Immigrants from Uganda vs Immigrants from South America 3 or more Vehicles in Household
COMPARE
Immigrants from Uganda
Immigrants from South America
3 or more Vehicles in Household
3 or more Vehicles in Household Comparison
Immigrants from Uganda
Immigrants from South America
18.4%
3 OR MORE VEHICLES IN HOUSEHOLD
4.6/ 100
METRIC RATING
232nd/ 347
METRIC RANK
16.7%
3 OR MORE VEHICLES IN HOUSEHOLD
0.1/ 100
METRIC RATING
299th/ 347
METRIC RANK
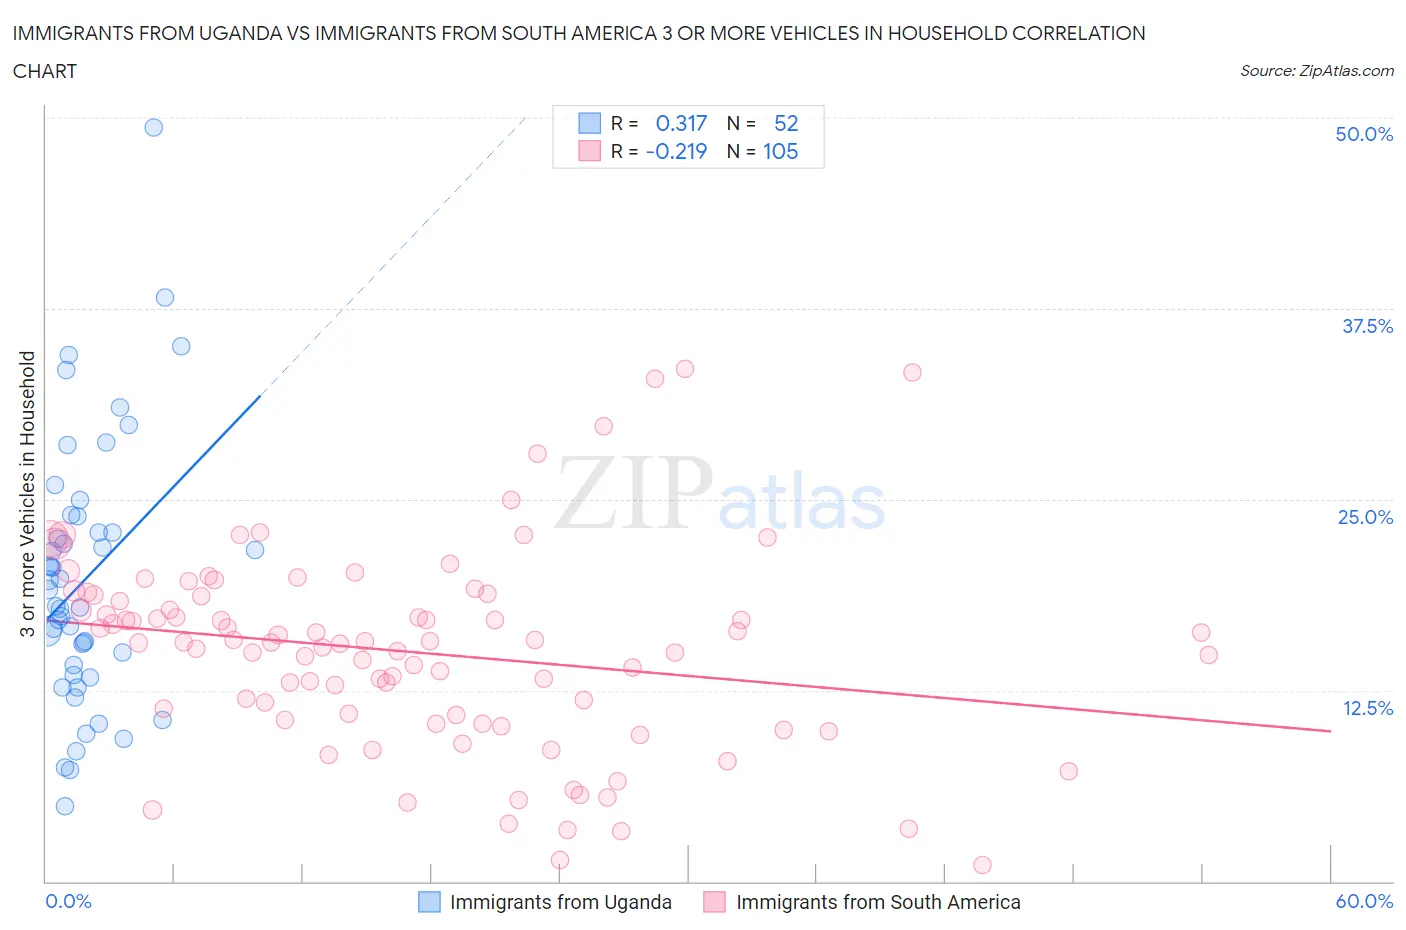
Immigrants from Uganda vs Immigrants from South America 3 or more Vehicles in Household Correlation Chart
The statistical analysis conducted on geographies consisting of 125,972,253 people shows a mild positive correlation between the proportion of Immigrants from Uganda and percentage of households with 3 or more vehicles available in the United States with a correlation coefficient (R) of 0.317 and weighted average of 18.4%. Similarly, the statistical analysis conducted on geographies consisting of 485,824,151 people shows a weak negative correlation between the proportion of Immigrants from South America and percentage of households with 3 or more vehicles available in the United States with a correlation coefficient (R) of -0.219 and weighted average of 16.7%, a difference of 10.1%.
3 or more Vehicles in Household Correlation Summary
| Measurement | Immigrants from Uganda | Immigrants from South America |
| Minimum | 4.9% | 1.1% |
| Maximum | 49.4% | 33.5% |
| Range | 44.5% | 32.4% |
| Mean | 19.8% | 15.0% |
| Median | 18.5% | 15.6% |
| Interquartile 25% (IQ1) | 13.8% | 10.7% |
| Interquartile 75% (IQ3) | 23.3% | 18.7% |
| Interquartile Range (IQR) | 9.5% | 8.0% |
| Standard Deviation (Sample) | 8.7% | 6.5% |
| Standard Deviation (Population) | 8.6% | 6.4% |
Similar Demographics by 3 or more Vehicles in Household
Demographics Similar to Immigrants from Uganda by 3 or more Vehicles in Household
In terms of 3 or more vehicles in household, the demographic groups most similar to Immigrants from Uganda are Honduran (18.4%, a difference of 0.020%), Immigrants from Belgium (18.4%, a difference of 0.060%), Immigrants from North Macedonia (18.4%, a difference of 0.080%), Immigrants from Western Asia (18.4%, a difference of 0.090%), and Immigrants from Switzerland (18.4%, a difference of 0.14%).
| Demographics | Rating | Rank | 3 or more Vehicles in Household |
| Immigrants | Lithuania | 5.6 /100 | #225 | Tragic 18.5% |
| Immigrants | Hungary | 5.5 /100 | #226 | Tragic 18.5% |
| Immigrants | Singapore | 5.4 /100 | #227 | Tragic 18.4% |
| Turks | 5.4 /100 | #228 | Tragic 18.4% |
| Immigrants | Switzerland | 5.0 /100 | #229 | Tragic 18.4% |
| Immigrants | Western Asia | 4.8 /100 | #230 | Tragic 18.4% |
| Immigrants | Belgium | 4.8 /100 | #231 | Tragic 18.4% |
| Immigrants | Uganda | 4.6 /100 | #232 | Tragic 18.4% |
| Hondurans | 4.6 /100 | #233 | Tragic 18.4% |
| Immigrants | North Macedonia | 4.4 /100 | #234 | Tragic 18.4% |
| Sierra Leoneans | 3.9 /100 | #235 | Tragic 18.3% |
| Immigrants | Malaysia | 3.6 /100 | #236 | Tragic 18.3% |
| Indonesians | 3.5 /100 | #237 | Tragic 18.3% |
| Immigrants | Honduras | 3.1 /100 | #238 | Tragic 18.2% |
| Immigrants | Middle Africa | 3.1 /100 | #239 | Tragic 18.2% |
Demographics Similar to Immigrants from South America by 3 or more Vehicles in Household
In terms of 3 or more vehicles in household, the demographic groups most similar to Immigrants from South America are Immigrants from Zaire (16.7%, a difference of 0.060%), Israeli (16.8%, a difference of 0.43%), Cypriot (16.6%, a difference of 0.48%), Paraguayan (16.6%, a difference of 0.89%), and Inupiat (16.9%, a difference of 0.90%).
| Demographics | Rating | Rank | 3 or more Vehicles in Household |
| Immigrants | Spain | 0.1 /100 | #292 | Tragic 17.0% |
| Bahamians | 0.1 /100 | #293 | Tragic 16.9% |
| Immigrants | Western Africa | 0.1 /100 | #294 | Tragic 16.9% |
| Immigrants | Russia | 0.1 /100 | #295 | Tragic 16.9% |
| Inupiat | 0.1 /100 | #296 | Tragic 16.9% |
| Israelis | 0.1 /100 | #297 | Tragic 16.8% |
| Immigrants | Zaire | 0.1 /100 | #298 | Tragic 16.7% |
| Immigrants | South America | 0.1 /100 | #299 | Tragic 16.7% |
| Cypriots | 0.0 /100 | #300 | Tragic 16.6% |
| Paraguayans | 0.0 /100 | #301 | Tragic 16.6% |
| Immigrants | Greece | 0.0 /100 | #302 | Tragic 16.5% |
| Immigrants | Serbia | 0.0 /100 | #303 | Tragic 16.4% |
| Ghanaians | 0.0 /100 | #304 | Tragic 16.4% |
| Immigrants | Morocco | 0.0 /100 | #305 | Tragic 16.3% |
| Somalis | 0.0 /100 | #306 | Tragic 16.2% |