Immigrants from Spain Self-Care Disability
COMPARE
Immigrants from Spain
Select to Compare
Self-Care Disability
Immigrants from Spain Self-Care Disability
2.3%
SELF-CARE DISABILITY
98.7/ 100
METRIC RATING
84th/ 347
METRIC RANK
Immigrants from Spain Self-Care Disability Correlation Chart
The statistical analysis conducted on geographies consisting of 239,524,195 people shows a mild positive correlation between the proportion of Immigrants from Spain and percentage of population with self-care disability in the United States with a correlation coefficient (R) of 0.389 and weighted average of 2.3%. On average, for every 1% (one percent) increase in Immigrants from Spain within a typical geography, there is an increase of 0.19% in percentage of population with self-care disability.
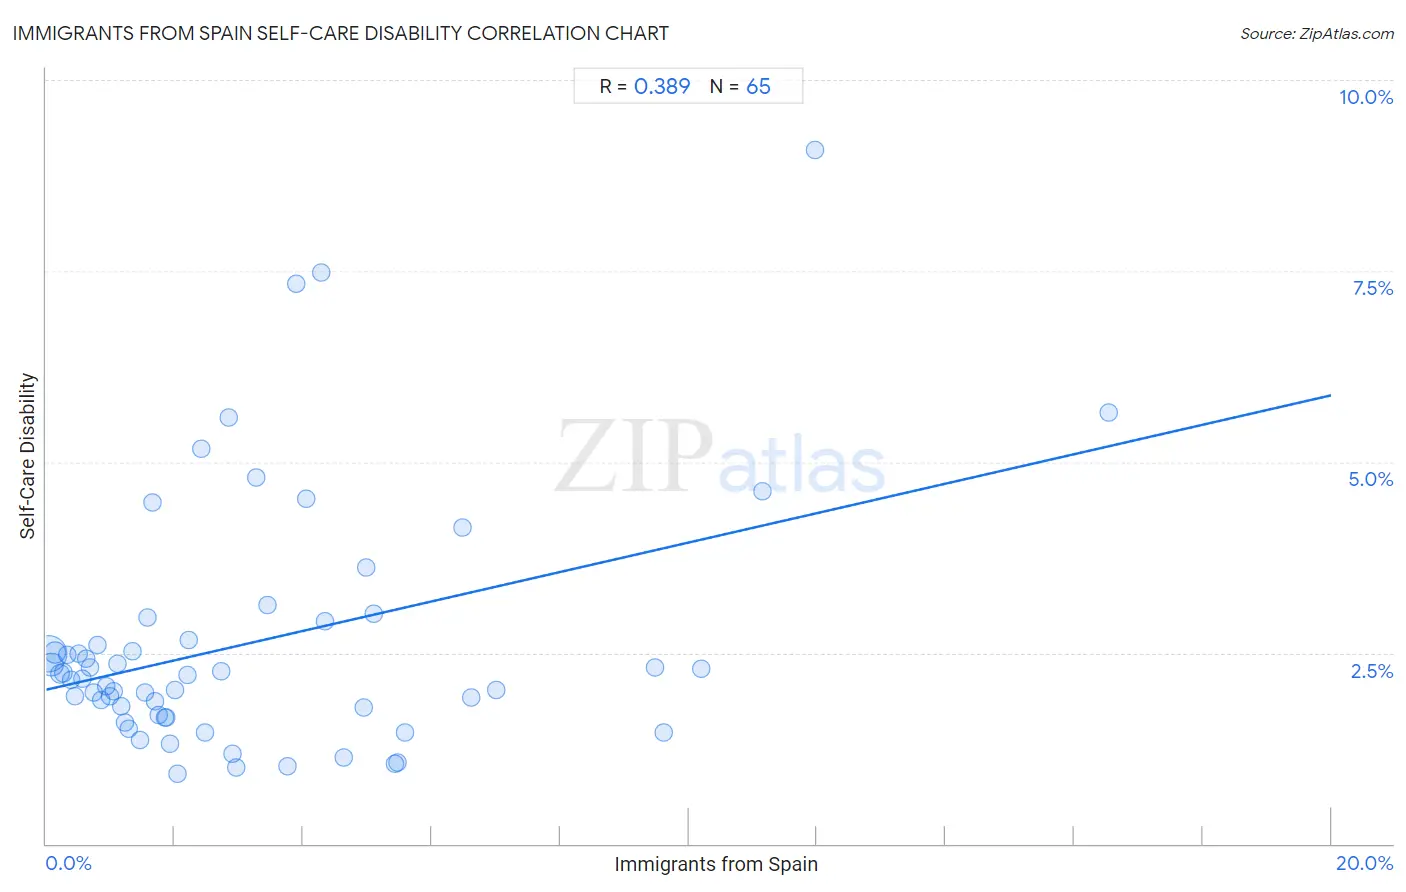
It is essential to understand that the correlation between the percentage of Immigrants from Spain and percentage of population with self-care disability does not imply a direct cause-and-effect relationship. It remains uncertain whether the presence of Immigrants from Spain influences an upward or downward trend in the level of percentage of population with self-care disability within an area, or if Immigrants from Spain simply ended up residing in those areas with higher or lower levels of percentage of population with self-care disability due to other factors.
Demographics Similar to Immigrants from Spain by Self-Care Disability
In terms of self-care disability, the demographic groups most similar to Immigrants from Spain are Indian (Asian) (2.3%, a difference of 0.040%), Immigrants from Denmark (2.3%, a difference of 0.10%), Ugandan (2.3%, a difference of 0.11%), Chilean (2.3%, a difference of 0.17%), and Estonian (2.3%, a difference of 0.34%).
| Demographics | Rating | Rank | Self-Care Disability |
| Immigrants from Middle Africa | 99.0 /100 | #77 | Exceptional 2.3% |
| Immigrants from Ireland | 99.0 /100 | #78 | Exceptional 2.3% |
| Immigrants from Kenya | 99.0 /100 | #79 | Exceptional 2.3% |
| Chileans | 98.8 /100 | #80 | Exceptional 2.3% |
| Ugandans | 98.8 /100 | #81 | Exceptional 2.3% |
| Immigrants from Denmark | 98.8 /100 | #82 | Exceptional 2.3% |
| Indians (Asian) | 98.7 /100 | #83 | Exceptional 2.3% |
| Immigrants from Spain | 98.7 /100 | #84 | Exceptional 2.3% |
| Estonians | 98.3 /100 | #85 | Exceptional 2.3% |
| Immigrants from Northern Africa | 98.2 /100 | #86 | Exceptional 2.3% |
| Sierra Leoneans | 98.0 /100 | #87 | Exceptional 2.4% |
| Lithuanians | 98.0 /100 | #88 | Exceptional 2.4% |
| Immigrants from Congo | 98.0 /100 | #89 | Exceptional 2.4% |
| Immigrants from Czechoslovakia | 97.7 /100 | #90 | Exceptional 2.4% |
| Immigrants from Jordan | 97.7 /100 | #91 | Exceptional 2.4% |
Immigrants from Spain Self-Care Disability Correlation Summary
| Measurement | Immigrants from Spain Data | Self-Care Disability Data |
| Minimum | 0.029% | 0.91% |
| Maximum | 16.5% | 9.1% |
| Range | 16.5% | 8.2% |
| Mean | 3.2% | 2.6% |
| Median | 2.0% | 2.2% |
| Interquartile 25% (IQ1) | 0.96% | 1.7% |
| Interquartile 75% (IQ3) | 4.5% | 2.8% |
| Interquartile Range (IQR) | 3.5% | 1.1% |
| Standard Deviation (Sample) | 3.3% | 1.6% |
| Standard Deviation (Population) | 3.3% | 1.6% |
Correlation Details
| Immigrants from Spain Percentile | Sample Size | Self-Care Disability |
[ 0.0% - 0.5% ] 0.029% | 140,388,875 | 2.5% |
[ 0.0% - 0.5% ] 0.085% | 43,910,273 | 2.3% |
[ 0.0% - 0.5% ] 0.14% | 27,677,965 | 2.5% |
[ 0.0% - 0.5% ] 0.21% | 8,635,995 | 2.2% |
[ 0.0% - 0.5% ] 0.26% | 5,916,138 | 2.2% |
[ 0.0% - 0.5% ] 0.33% | 3,593,396 | 2.5% |
[ 0.0% - 0.5% ] 0.39% | 2,038,594 | 2.1% |
[ 0.0% - 0.5% ] 0.45% | 1,419,760 | 1.9% |
[ 0.5% - 1.0% ] 0.51% | 1,887,193 | 2.5% |
[ 0.5% - 1.0% ] 0.57% | 882,723 | 2.2% |
[ 0.5% - 1.0% ] 0.63% | 689,256 | 2.4% |
[ 0.5% - 1.0% ] 0.69% | 335,367 | 2.3% |
[ 0.5% - 1.0% ] 0.74% | 184,644 | 2.0% |
[ 0.5% - 1.0% ] 0.81% | 281,707 | 2.6% |
[ 0.5% - 1.0% ] 0.86% | 213,573 | 1.9% |
[ 0.5% - 1.0% ] 0.93% | 169,833 | 2.1% |
[ 0.5% - 1.0% ] 0.98% | 160,257 | 1.9% |
[ 1.0% - 1.5% ] 1.05% | 175,975 | 2.0% |
[ 1.0% - 1.5% ] 1.10% | 177,669 | 2.4% |
[ 1.0% - 1.5% ] 1.16% | 79,261 | 1.8% |
[ 1.0% - 1.5% ] 1.23% | 67,171 | 1.6% |
[ 1.0% - 1.5% ] 1.27% | 39,392 | 1.5% |
[ 1.0% - 1.5% ] 1.35% | 99,419 | 2.5% |
[ 1.0% - 1.5% ] 1.46% | 97,568 | 1.4% |
[ 1.5% - 2.0% ] 1.53% | 25,385 | 2.0% |
[ 1.5% - 2.0% ] 1.58% | 6,512 | 3.0% |
[ 1.5% - 2.0% ] 1.66% | 3,133 | 4.5% |
[ 1.5% - 2.0% ] 1.69% | 7,493 | 1.9% |
[ 1.5% - 2.0% ] 1.74% | 10,260 | 1.7% |
[ 1.5% - 2.0% ] 1.84% | 58,682 | 1.7% |
[ 1.5% - 2.0% ] 1.87% | 9,495 | 1.6% |
[ 1.5% - 2.0% ] 1.92% | 468 | 1.3% |
[ 2.0% - 2.5% ] 2.01% | 53,976 | 2.0% |
[ 2.0% - 2.5% ] 2.04% | 5,881 | 0.91% |
[ 2.0% - 2.5% ] 2.20% | 90,500 | 2.2% |
[ 2.0% - 2.5% ] 2.22% | 270 | 2.7% |
[ 2.0% - 2.5% ] 2.42% | 2,069 | 5.2% |
[ 2.0% - 2.5% ] 2.48% | 1,575 | 1.5% |
[ 2.5% - 3.0% ] 2.72% | 7,795 | 2.3% |
[ 2.5% - 3.0% ] 2.83% | 14,441 | 5.6% |
[ 2.5% - 3.0% ] 2.90% | 18,856 | 1.2% |
[ 2.5% - 3.0% ] 2.96% | 2,801 | 1.00% |
[ 3.0% - 3.5% ] 3.27% | 3,698 | 4.8% |
[ 3.0% - 3.5% ] 3.45% | 1,014 | 3.1% |
[ 3.5% - 4.0% ] 3.75% | 23,340 | 1.0% |
[ 3.5% - 4.0% ] 3.89% | 565 | 7.3% |
[ 4.0% - 4.5% ] 4.05% | 5,500 | 4.5% |
[ 4.0% - 4.5% ] 4.29% | 2,308 | 7.5% |
[ 4.0% - 4.5% ] 4.34% | 4,098 | 2.9% |
[ 4.5% - 5.0% ] 4.63% | 2,227 | 1.1% |
[ 4.5% - 5.0% ] 4.95% | 1,333 | 1.8% |
[ 4.5% - 5.0% ] 4.99% | 1,123 | 3.6% |
[ 5.0% - 5.5% ] 5.10% | 824 | 3.0% |
[ 5.0% - 5.5% ] 5.44% | 14,639 | 1.1% |
[ 5.0% - 5.5% ] 5.46% | 14,572 | 1.1% |
[ 5.5% - 6.0% ] 5.57% | 2,368 | 1.5% |
[ 6.0% - 6.5% ] 6.48% | 633 | 4.1% |
[ 6.5% - 7.0% ] 6.61% | 681 | 1.9% |
[ 7.0% - 7.5% ] 7.00% | 714 | 2.0% |
[ 9.0% - 9.5% ] 9.47% | 697 | 2.3% |
[ 9.5% - 10.0% ] 9.61% | 281 | 1.4% |
[ 10.0% - 10.5% ] 10.19% | 932 | 2.3% |
[ 11.0% - 11.5% ] 11.14% | 368 | 4.6% |
[ 11.5% - 12.0% ] 11.96% | 418 | 9.1% |
[ 16.5% - 17.0% ] 16.54% | 266 | 5.6% |