Immigrants from Spain vs Choctaw 3 or more Vehicles in Household
COMPARE
Immigrants from Spain
Choctaw
3 or more Vehicles in Household
3 or more Vehicles in Household Comparison
Immigrants from Spain
Choctaw
17.0%
3 OR MORE VEHICLES IN HOUSEHOLD
0.1/ 100
METRIC RATING
292nd/ 347
METRIC RANK
23.0%
3 OR MORE VEHICLES IN HOUSEHOLD
100.0/ 100
METRIC RATING
35th/ 347
METRIC RANK
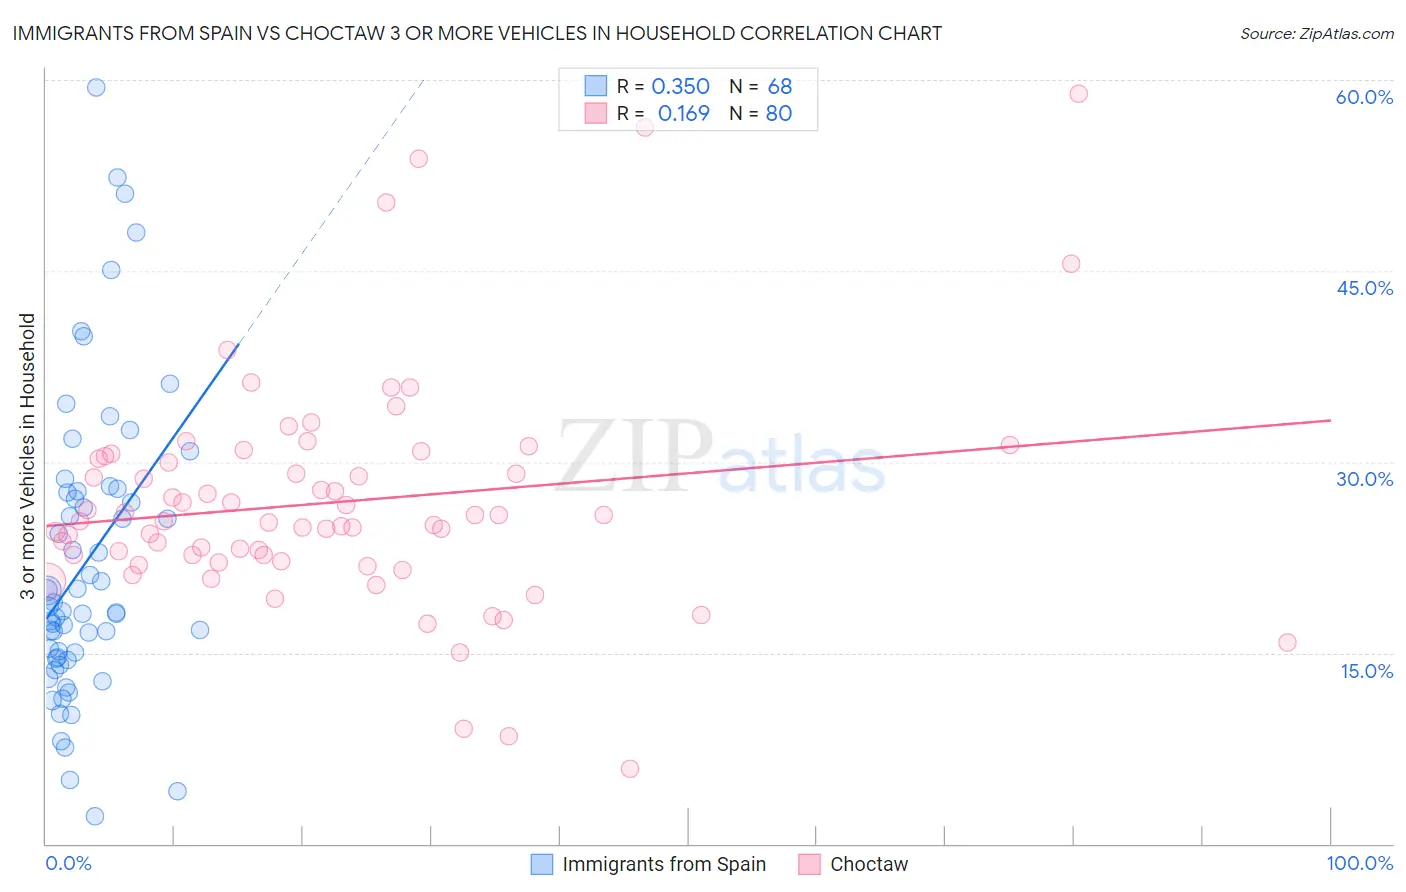
Immigrants from Spain vs Choctaw 3 or more Vehicles in Household Correlation Chart
The statistical analysis conducted on geographies consisting of 239,543,690 people shows a mild positive correlation between the proportion of Immigrants from Spain and percentage of households with 3 or more vehicles available in the United States with a correlation coefficient (R) of 0.350 and weighted average of 17.0%. Similarly, the statistical analysis conducted on geographies consisting of 269,608,745 people shows a poor positive correlation between the proportion of Choctaw and percentage of households with 3 or more vehicles available in the United States with a correlation coefficient (R) of 0.169 and weighted average of 23.0%, a difference of 35.7%.
3 or more Vehicles in Household Correlation Summary
| Measurement | Immigrants from Spain | Choctaw |
| Minimum | 2.1% | 5.9% |
| Maximum | 59.4% | 58.9% |
| Range | 57.3% | 53.0% |
| Mean | 22.1% | 26.8% |
| Median | 18.4% | 25.3% |
| Interquartile 25% (IQ1) | 14.6% | 22.4% |
| Interquartile 75% (IQ3) | 27.6% | 30.4% |
| Interquartile Range (IQR) | 13.1% | 7.9% |
| Standard Deviation (Sample) | 11.7% | 9.1% |
| Standard Deviation (Population) | 11.6% | 9.0% |
Similar Demographics by 3 or more Vehicles in Household
Demographics Similar to Immigrants from Spain by 3 or more Vehicles in Household
In terms of 3 or more vehicles in household, the demographic groups most similar to Immigrants from Spain are Bahamian (16.9%, a difference of 0.080%), Immigrants from Congo (17.0%, a difference of 0.11%), Immigrants from Western Africa (16.9%, a difference of 0.20%), Immigrants from Russia (16.9%, a difference of 0.25%), and Liberian (17.0%, a difference of 0.27%).
| Demographics | Rating | Rank | 3 or more Vehicles in Household |
| Immigrants | Croatia | 0.2 /100 | #285 | Tragic 17.2% |
| Menominee | 0.2 /100 | #286 | Tragic 17.2% |
| Immigrants | Brazil | 0.2 /100 | #287 | Tragic 17.1% |
| Immigrants | Uruguay | 0.2 /100 | #288 | Tragic 17.1% |
| Immigrants | Liberia | 0.1 /100 | #289 | Tragic 17.1% |
| Liberians | 0.1 /100 | #290 | Tragic 17.0% |
| Immigrants | Congo | 0.1 /100 | #291 | Tragic 17.0% |
| Immigrants | Spain | 0.1 /100 | #292 | Tragic 17.0% |
| Bahamians | 0.1 /100 | #293 | Tragic 16.9% |
| Immigrants | Western Africa | 0.1 /100 | #294 | Tragic 16.9% |
| Immigrants | Russia | 0.1 /100 | #295 | Tragic 16.9% |
| Inupiat | 0.1 /100 | #296 | Tragic 16.9% |
| Israelis | 0.1 /100 | #297 | Tragic 16.8% |
| Immigrants | Zaire | 0.1 /100 | #298 | Tragic 16.7% |
| Immigrants | South America | 0.1 /100 | #299 | Tragic 16.7% |
Demographics Similar to Choctaw by 3 or more Vehicles in Household
In terms of 3 or more vehicles in household, the demographic groups most similar to Choctaw are Swiss (23.0%, a difference of 0.020%), Cherokee (23.0%, a difference of 0.040%), Spanish American (23.0%, a difference of 0.070%), Swedish (23.0%, a difference of 0.070%), and Pueblo (23.0%, a difference of 0.13%).
| Demographics | Rating | Rank | 3 or more Vehicles in Household |
| Lumbee | 100.0 /100 | #28 | Exceptional 23.1% |
| Spanish | 100.0 /100 | #29 | Exceptional 23.1% |
| Immigrants | South Eastern Asia | 100.0 /100 | #30 | Exceptional 23.1% |
| English | 100.0 /100 | #31 | Exceptional 23.1% |
| Pueblo | 100.0 /100 | #32 | Exceptional 23.0% |
| Spanish Americans | 100.0 /100 | #33 | Exceptional 23.0% |
| Swiss | 100.0 /100 | #34 | Exceptional 23.0% |
| Choctaw | 100.0 /100 | #35 | Exceptional 23.0% |
| Cherokee | 100.0 /100 | #36 | Exceptional 23.0% |
| Swedes | 100.0 /100 | #37 | Exceptional 23.0% |
| Dutch | 100.0 /100 | #38 | Exceptional 22.9% |
| Yaqui | 100.0 /100 | #39 | Exceptional 22.9% |
| Europeans | 100.0 /100 | #40 | Exceptional 22.9% |
| Germans | 100.0 /100 | #41 | Exceptional 22.7% |
| Natives/Alaskans | 100.0 /100 | #42 | Exceptional 22.7% |