Immigrants from Spain 2 or more Vehicles in Household
COMPARE
Immigrants from Spain
Select to Compare
2 or more Vehicles in Household
Immigrants from Spain 2 or more Vehicles in Household
50.4%
2+ VEHICLES AVAILABLE
0.0/ 100
METRIC RATING
297th/ 347
METRIC RANK
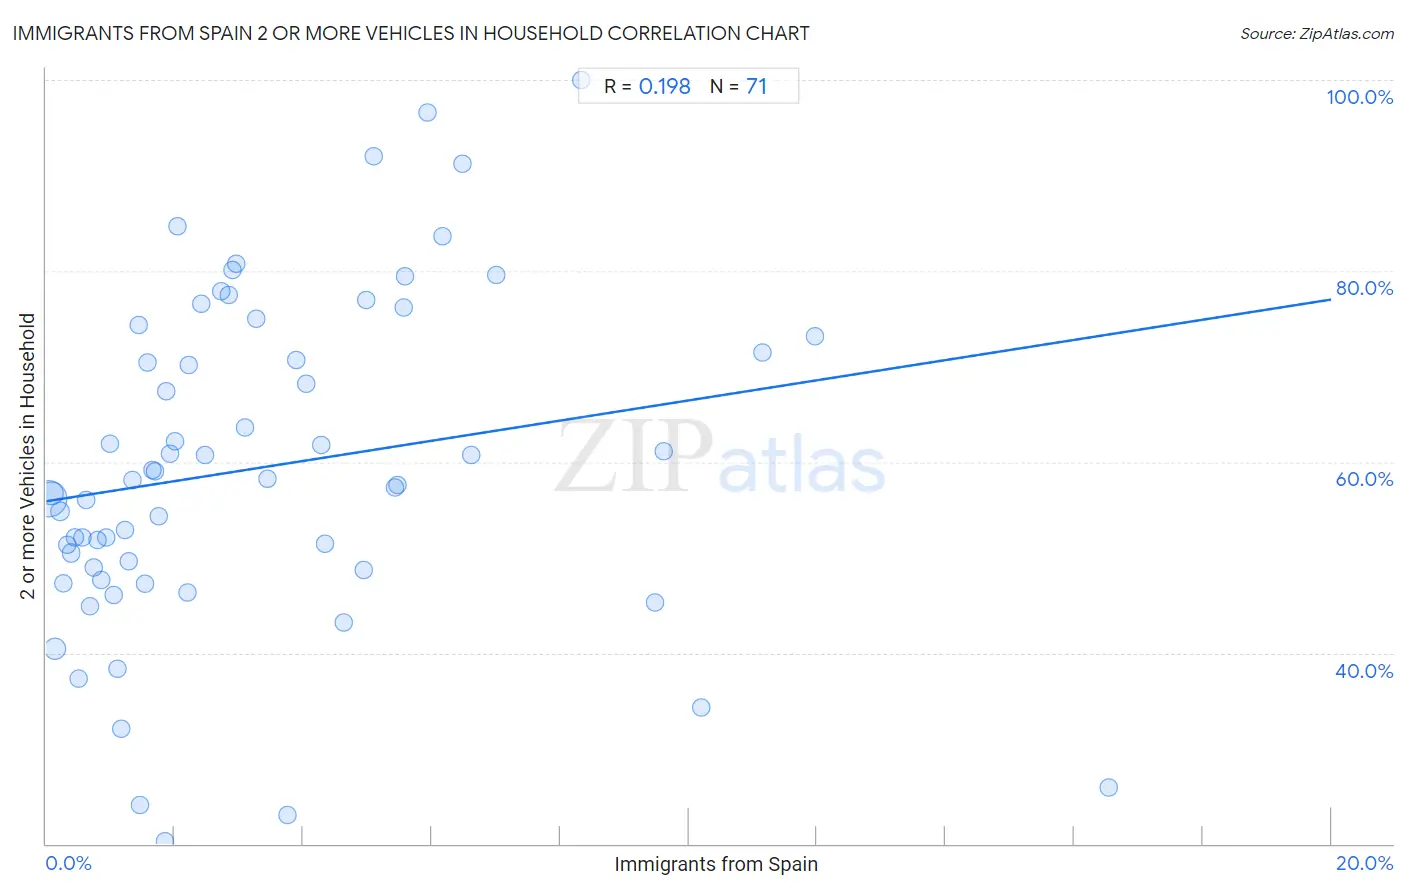
Immigrants from Spain 2 or more Vehicles in Household Correlation Chart
The statistical analysis conducted on geographies consisting of 239,620,026 people shows a poor positive correlation between the proportion of Immigrants from Spain and percentage of households with 2 or more vehicles available in the United States with a correlation coefficient (R) of 0.198 and weighted average of 50.4%. On average, for every 1% (one percent) increase in Immigrants from Spain within a typical geography, there is an increase of 1.1% in percentage of households with 2 or more vehicles available.
It is essential to understand that the correlation between the percentage of Immigrants from Spain and percentage of households with 2 or more vehicles available does not imply a direct cause-and-effect relationship. It remains uncertain whether the presence of Immigrants from Spain influences an upward or downward trend in the level of percentage of households with 2 or more vehicles available within an area, or if Immigrants from Spain simply ended up residing in those areas with higher or lower levels of percentage of households with 2 or more vehicles available due to other factors.
Demographics Similar to Immigrants from Spain by 2 or more Vehicles in Household
In terms of 2 or more vehicles in household, the demographic groups most similar to Immigrants from Spain are Paraguayan (50.3%, a difference of 0.13%), Immigrants from Morocco (50.3%, a difference of 0.16%), Immigrants from Russia (50.3%, a difference of 0.20%), Immigrants from Somalia (50.5%, a difference of 0.27%), and Cypriot (50.6%, a difference of 0.31%).
| Demographics | Rating | Rank | 2 or more Vehicles in Household |
| Immigrants from Panama | 0.0 /100 | #290 | Tragic 51.1% |
| Belizeans | 0.0 /100 | #291 | Tragic 51.0% |
| Immigrants from Ukraine | 0.0 /100 | #292 | Tragic 50.9% |
| Blacks/African Americans | 0.0 /100 | #293 | Tragic 50.9% |
| Bermudans | 0.0 /100 | #294 | Tragic 50.6% |
| Cypriots | 0.0 /100 | #295 | Tragic 50.6% |
| Immigrants from Somalia | 0.0 /100 | #296 | Tragic 50.5% |
| Immigrants from Spain | 0.0 /100 | #297 | Tragic 50.4% |
| Paraguayans | 0.0 /100 | #298 | Tragic 50.3% |
| Immigrants from Morocco | 0.0 /100 | #299 | Tragic 50.3% |
| Immigrants from Russia | 0.0 /100 | #300 | Tragic 50.3% |
| Immigrants from Greece | 0.0 /100 | #301 | Tragic 50.2% |
| Immigrants from South America | 0.0 /100 | #302 | Tragic 50.2% |
| Tohono O'odham | 0.0 /100 | #303 | Tragic 50.0% |
| Immigrants from Belize | 0.0 /100 | #304 | Tragic 49.9% |
Immigrants from Spain 2 or more Vehicles in Household Correlation Summary
| Measurement | Immigrants from Spain Data | 2 or more Vehicles in Household Data |
| Minimum | 0.029% | 20.3% |
| Maximum | 16.5% | 100.0% |
| Range | 16.5% | 79.7% |
| Mean | 3.4% | 59.4% |
| Median | 2.2% | 58.2% |
| Interquartile 25% (IQ1) | 1.0% | 48.7% |
| Interquartile 75% (IQ3) | 5.0% | 73.2% |
| Interquartile Range (IQR) | 3.9% | 24.6% |
| Standard Deviation (Sample) | 3.3% | 17.4% |
| Standard Deviation (Population) | 3.2% | 17.3% |
Correlation Details
| Immigrants from Spain Percentile | Sample Size | 2 or more Vehicles in Household |
[ 0.0% - 0.5% ] 0.029% | 140,388,875 | 56.1% |
[ 0.0% - 0.5% ] 0.085% | 43,920,051 | 56.7% |
[ 0.0% - 0.5% ] 0.14% | 27,688,041 | 40.4% |
[ 0.0% - 0.5% ] 0.21% | 8,652,922 | 54.8% |
[ 0.0% - 0.5% ] 0.26% | 5,929,051 | 47.3% |
[ 0.0% - 0.5% ] 0.33% | 3,601,666 | 51.3% |
[ 0.0% - 0.5% ] 0.39% | 2,041,442 | 50.4% |
[ 0.0% - 0.5% ] 0.45% | 1,428,051 | 52.0% |
[ 0.5% - 1.0% ] 0.51% | 1,888,223 | 37.3% |
[ 0.5% - 1.0% ] 0.57% | 888,349 | 52.0% |
[ 0.5% - 1.0% ] 0.63% | 689,256 | 56.0% |
[ 0.5% - 1.0% ] 0.69% | 336,392 | 44.9% |
[ 0.5% - 1.0% ] 0.74% | 185,471 | 49.0% |
[ 0.5% - 1.0% ] 0.81% | 291,564 | 51.9% |
[ 0.5% - 1.0% ] 0.86% | 213,573 | 47.6% |
[ 0.5% - 1.0% ] 0.93% | 169,833 | 52.1% |
[ 0.5% - 1.0% ] 0.98% | 160,565 | 61.9% |
[ 1.0% - 1.5% ] 1.05% | 175,975 | 46.0% |
[ 1.0% - 1.5% ] 1.10% | 177,669 | 38.3% |
[ 1.0% - 1.5% ] 1.16% | 81,660 | 32.1% |
[ 1.0% - 1.5% ] 1.23% | 68,154 | 52.8% |
[ 1.0% - 1.5% ] 1.27% | 39,392 | 49.5% |
[ 1.0% - 1.5% ] 1.35% | 99,638 | 58.2% |
[ 1.0% - 1.5% ] 1.44% | 627 | 74.4% |
[ 1.0% - 1.5% ] 1.46% | 97,568 | 24.1% |
[ 1.5% - 2.0% ] 1.53% | 25,385 | 47.2% |
[ 1.5% - 2.0% ] 1.58% | 6,512 | 70.4% |
[ 1.5% - 2.0% ] 1.66% | 3,133 | 59.2% |
[ 1.5% - 2.0% ] 1.69% | 7,493 | 59.0% |
[ 1.5% - 2.0% ] 1.74% | 10,260 | 54.4% |
[ 1.5% - 2.0% ] 1.84% | 60,116 | 20.3% |
[ 1.5% - 2.0% ] 1.87% | 9,495 | 67.4% |
[ 1.5% - 2.0% ] 1.92% | 468 | 60.9% |
[ 2.0% - 2.5% ] 2.01% | 53,976 | 62.2% |
[ 2.0% - 2.5% ] 2.04% | 5,881 | 84.7% |
[ 2.0% - 2.5% ] 2.20% | 90,500 | 46.4% |
[ 2.0% - 2.5% ] 2.22% | 270 | 70.1% |
[ 2.0% - 2.5% ] 2.42% | 2,069 | 76.5% |
[ 2.0% - 2.5% ] 2.48% | 1,575 | 60.7% |
[ 2.5% - 3.0% ] 2.72% | 7,795 | 77.9% |
[ 2.5% - 3.0% ] 2.83% | 14,441 | 77.5% |
[ 2.5% - 3.0% ] 2.90% | 19,922 | 80.0% |
[ 2.5% - 3.0% ] 2.96% | 2,801 | 80.7% |
[ 3.0% - 3.5% ] 3.09% | 194 | 63.6% |
[ 3.0% - 3.5% ] 3.27% | 3,698 | 75.0% |
[ 3.0% - 3.5% ] 3.45% | 1,014 | 58.2% |
[ 3.5% - 4.0% ] 3.75% | 23,340 | 23.1% |
[ 3.5% - 4.0% ] 3.89% | 565 | 70.6% |
[ 4.0% - 4.5% ] 4.05% | 5,500 | 68.1% |
[ 4.0% - 4.5% ] 4.29% | 2,308 | 61.7% |
[ 4.0% - 4.5% ] 4.34% | 4,098 | 51.4% |
[ 4.5% - 5.0% ] 4.63% | 2,227 | 43.2% |
[ 4.5% - 5.0% ] 4.95% | 1,475 | 48.7% |
[ 4.5% - 5.0% ] 4.99% | 1,123 | 76.9% |
[ 5.0% - 5.5% ] 5.10% | 824 | 92.0% |
[ 5.0% - 5.5% ] 5.44% | 14,639 | 57.3% |
[ 5.0% - 5.5% ] 5.46% | 14,572 | 57.5% |
[ 5.5% - 6.0% ] 5.56% | 54 | 76.2% |
[ 5.5% - 6.0% ] 5.57% | 2,368 | 79.4% |
[ 5.5% - 6.0% ] 5.94% | 707 | 96.6% |
[ 6.0% - 6.5% ] 6.16% | 146 | 83.7% |
[ 6.0% - 6.5% ] 6.48% | 633 | 91.2% |
[ 6.5% - 7.0% ] 6.61% | 681 | 60.7% |
[ 7.0% - 7.5% ] 7.00% | 714 | 79.6% |
[ 8.0% - 8.5% ] 8.33% | 84 | 100.0% |
[ 9.0% - 9.5% ] 9.47% | 697 | 45.3% |
[ 9.5% - 10.0% ] 9.61% | 281 | 61.1% |
[ 10.0% - 10.5% ] 10.19% | 932 | 34.3% |
[ 11.0% - 11.5% ] 11.14% | 368 | 71.5% |
[ 11.5% - 12.0% ] 11.96% | 418 | 73.2% |
[ 16.5% - 17.0% ] 16.54% | 266 | 25.9% |