Immigrants from Spain vs Korean 3 or more Vehicles in Household
COMPARE
Immigrants from Spain
Korean
3 or more Vehicles in Household
3 or more Vehicles in Household Comparison
Immigrants from Spain
Koreans
17.0%
3 OR MORE VEHICLES IN HOUSEHOLD
0.1/ 100
METRIC RATING
292nd/ 347
METRIC RANK
24.1%
3 OR MORE VEHICLES IN HOUSEHOLD
100.0/ 100
METRIC RATING
17th/ 347
METRIC RANK
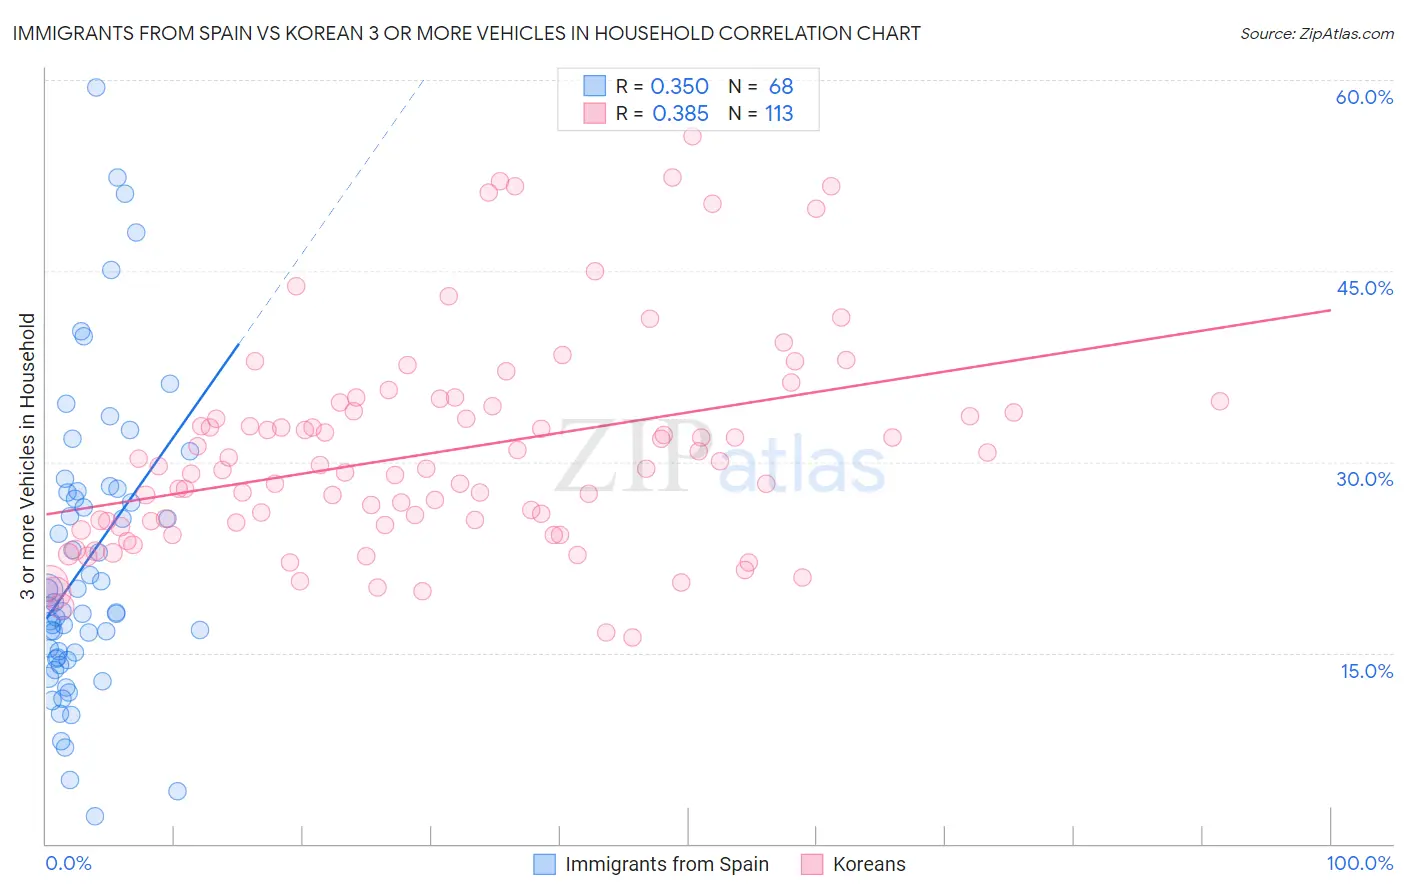
Immigrants from Spain vs Korean 3 or more Vehicles in Household Correlation Chart
The statistical analysis conducted on geographies consisting of 239,543,690 people shows a mild positive correlation between the proportion of Immigrants from Spain and percentage of households with 3 or more vehicles available in the United States with a correlation coefficient (R) of 0.350 and weighted average of 17.0%. Similarly, the statistical analysis conducted on geographies consisting of 510,183,740 people shows a mild positive correlation between the proportion of Koreans and percentage of households with 3 or more vehicles available in the United States with a correlation coefficient (R) of 0.385 and weighted average of 24.1%, a difference of 41.9%.
3 or more Vehicles in Household Correlation Summary
| Measurement | Immigrants from Spain | Korean |
| Minimum | 2.1% | 16.2% |
| Maximum | 59.4% | 55.6% |
| Range | 57.3% | 39.4% |
| Mean | 22.1% | 30.8% |
| Median | 18.4% | 29.4% |
| Interquartile 25% (IQ1) | 14.6% | 25.1% |
| Interquartile 75% (IQ3) | 27.6% | 34.2% |
| Interquartile Range (IQR) | 13.1% | 9.1% |
| Standard Deviation (Sample) | 11.7% | 8.3% |
| Standard Deviation (Population) | 11.6% | 8.2% |
Similar Demographics by 3 or more Vehicles in Household
Demographics Similar to Immigrants from Spain by 3 or more Vehicles in Household
In terms of 3 or more vehicles in household, the demographic groups most similar to Immigrants from Spain are Bahamian (16.9%, a difference of 0.080%), Immigrants from Congo (17.0%, a difference of 0.11%), Immigrants from Western Africa (16.9%, a difference of 0.20%), Immigrants from Russia (16.9%, a difference of 0.25%), and Liberian (17.0%, a difference of 0.27%).
| Demographics | Rating | Rank | 3 or more Vehicles in Household |
| Immigrants | Croatia | 0.2 /100 | #285 | Tragic 17.2% |
| Menominee | 0.2 /100 | #286 | Tragic 17.2% |
| Immigrants | Brazil | 0.2 /100 | #287 | Tragic 17.1% |
| Immigrants | Uruguay | 0.2 /100 | #288 | Tragic 17.1% |
| Immigrants | Liberia | 0.1 /100 | #289 | Tragic 17.1% |
| Liberians | 0.1 /100 | #290 | Tragic 17.0% |
| Immigrants | Congo | 0.1 /100 | #291 | Tragic 17.0% |
| Immigrants | Spain | 0.1 /100 | #292 | Tragic 17.0% |
| Bahamians | 0.1 /100 | #293 | Tragic 16.9% |
| Immigrants | Western Africa | 0.1 /100 | #294 | Tragic 16.9% |
| Immigrants | Russia | 0.1 /100 | #295 | Tragic 16.9% |
| Inupiat | 0.1 /100 | #296 | Tragic 16.9% |
| Israelis | 0.1 /100 | #297 | Tragic 16.8% |
| Immigrants | Zaire | 0.1 /100 | #298 | Tragic 16.7% |
| Immigrants | South America | 0.1 /100 | #299 | Tragic 16.7% |
Demographics Similar to Koreans by 3 or more Vehicles in Household
In terms of 3 or more vehicles in household, the demographic groups most similar to Koreans are Norwegian (23.9%, a difference of 0.79%), Basque (24.3%, a difference of 0.80%), Chinese (23.9%, a difference of 0.82%), Hawaiian (24.3%, a difference of 0.83%), and Paiute (23.8%, a difference of 1.1%).
| Demographics | Rating | Rank | 3 or more Vehicles in Household |
| Nepalese | 100.0 /100 | #10 | Exceptional 24.9% |
| Shoshone | 100.0 /100 | #11 | Exceptional 24.9% |
| Danes | 100.0 /100 | #12 | Exceptional 24.7% |
| Mexicans | 100.0 /100 | #13 | Exceptional 24.7% |
| Immigrants | Mexico | 100.0 /100 | #14 | Exceptional 24.6% |
| Hawaiians | 100.0 /100 | #15 | Exceptional 24.3% |
| Basques | 100.0 /100 | #16 | Exceptional 24.3% |
| Koreans | 100.0 /100 | #17 | Exceptional 24.1% |
| Norwegians | 100.0 /100 | #18 | Exceptional 23.9% |
| Chinese | 100.0 /100 | #19 | Exceptional 23.9% |
| Paiute | 100.0 /100 | #20 | Exceptional 23.8% |
| Immigrants | Vietnam | 100.0 /100 | #21 | Exceptional 23.8% |
| Immigrants | Philippines | 100.0 /100 | #22 | Exceptional 23.8% |
| Scandinavians | 100.0 /100 | #23 | Exceptional 23.6% |
| Sri Lankans | 100.0 /100 | #24 | Exceptional 23.6% |