Immigrants from Portugal vs Spanish 3 or more Vehicles in Household
COMPARE
Immigrants from Portugal
Spanish
3 or more Vehicles in Household
3 or more Vehicles in Household Comparison
Immigrants from Portugal
Spanish
18.6%
3 OR MORE VEHICLES IN HOUSEHOLD
8.9/ 100
METRIC RATING
218th/ 347
METRIC RANK
23.1%
3 OR MORE VEHICLES IN HOUSEHOLD
100.0/ 100
METRIC RATING
29th/ 347
METRIC RANK
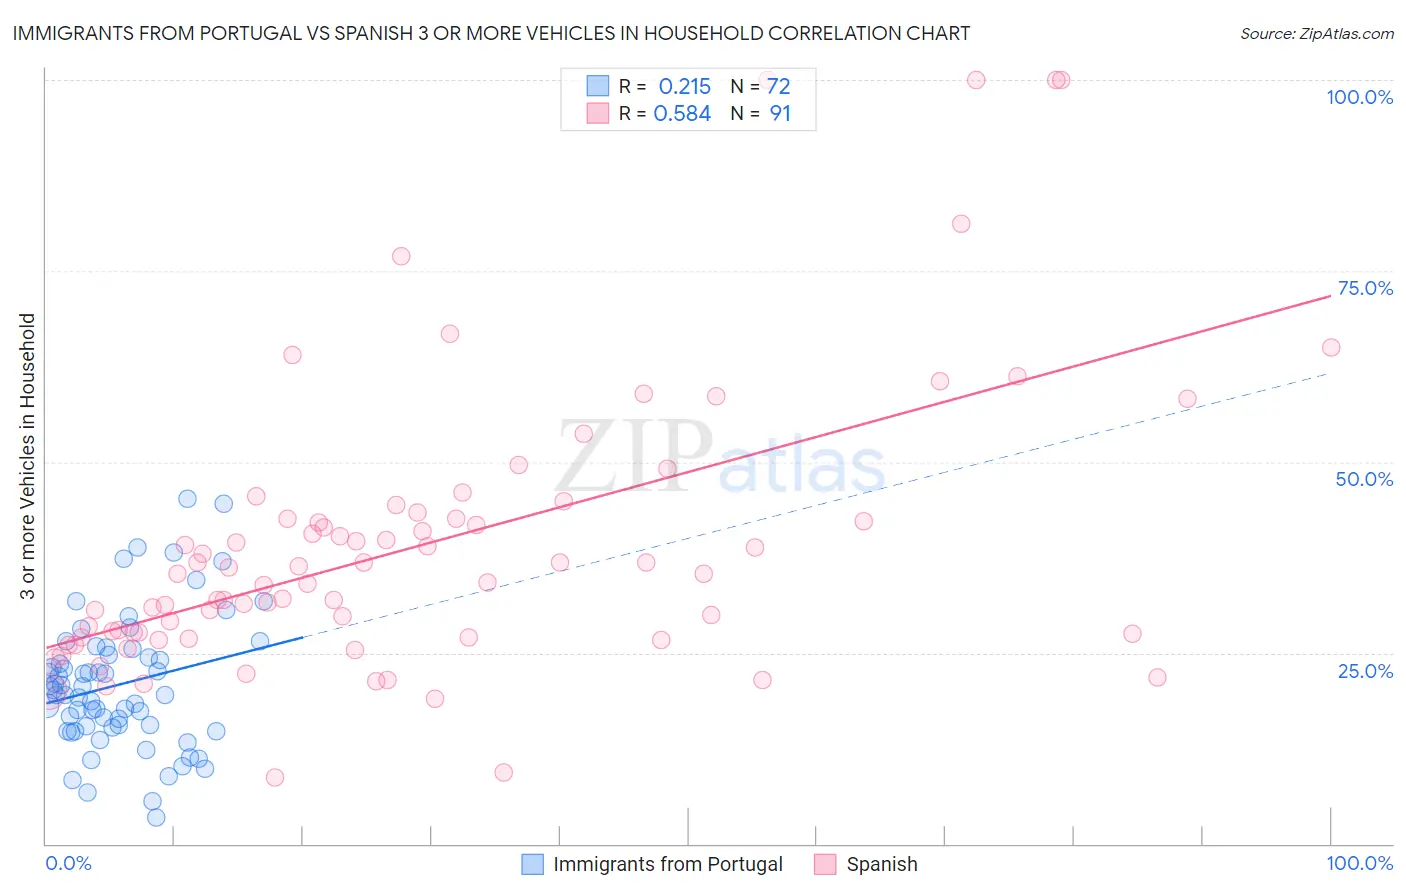
Immigrants from Portugal vs Spanish 3 or more Vehicles in Household Correlation Chart
The statistical analysis conducted on geographies consisting of 174,744,003 people shows a weak positive correlation between the proportion of Immigrants from Portugal and percentage of households with 3 or more vehicles available in the United States with a correlation coefficient (R) of 0.215 and weighted average of 18.6%. Similarly, the statistical analysis conducted on geographies consisting of 421,817,917 people shows a substantial positive correlation between the proportion of Spanish and percentage of households with 3 or more vehicles available in the United States with a correlation coefficient (R) of 0.584 and weighted average of 23.1%, a difference of 24.1%.
3 or more Vehicles in Household Correlation Summary
| Measurement | Immigrants from Portugal | Spanish |
| Minimum | 3.4% | 8.7% |
| Maximum | 45.2% | 100.0% |
| Range | 41.7% | 91.3% |
| Mean | 20.9% | 39.1% |
| Median | 19.9% | 35.3% |
| Interquartile 25% (IQ1) | 15.2% | 27.1% |
| Interquartile 75% (IQ3) | 25.1% | 42.6% |
| Interquartile Range (IQR) | 9.9% | 15.5% |
| Standard Deviation (Sample) | 8.7% | 18.7% |
| Standard Deviation (Population) | 8.6% | 18.6% |
Similar Demographics by 3 or more Vehicles in Household
Demographics Similar to Immigrants from Portugal by 3 or more Vehicles in Household
In terms of 3 or more vehicles in household, the demographic groups most similar to Immigrants from Portugal are Immigrants from Armenia (18.6%, a difference of 0.080%), Nigerian (18.6%, a difference of 0.28%), Immigrants from Italy (18.7%, a difference of 0.29%), Immigrants from Nigeria (18.7%, a difference of 0.31%), and Eastern European (18.7%, a difference of 0.37%).
| Demographics | Rating | Rank | 3 or more Vehicles in Household |
| Immigrants | Kenya | 12.4 /100 | #211 | Poor 18.8% |
| Panamanians | 11.6 /100 | #212 | Poor 18.8% |
| Immigrants | Cuba | 11.6 /100 | #213 | Poor 18.8% |
| Immigrants | Sierra Leone | 10.8 /100 | #214 | Poor 18.7% |
| Eastern Europeans | 10.6 /100 | #215 | Poor 18.7% |
| Immigrants | Nigeria | 10.3 /100 | #216 | Poor 18.7% |
| Immigrants | Italy | 10.2 /100 | #217 | Poor 18.7% |
| Immigrants | Portugal | 8.9 /100 | #218 | Tragic 18.6% |
| Immigrants | Armenia | 8.6 /100 | #219 | Tragic 18.6% |
| Nigerians | 7.9 /100 | #220 | Tragic 18.6% |
| Immigrants | Poland | 7.5 /100 | #221 | Tragic 18.6% |
| Belizeans | 7.3 /100 | #222 | Tragic 18.6% |
| Immigrants | Czechoslovakia | 5.9 /100 | #223 | Tragic 18.5% |
| Immigrants | Argentina | 5.6 /100 | #224 | Tragic 18.5% |
| Immigrants | Lithuania | 5.6 /100 | #225 | Tragic 18.5% |
Demographics Similar to Spanish by 3 or more Vehicles in Household
In terms of 3 or more vehicles in household, the demographic groups most similar to Spanish are Lumbee (23.1%, a difference of 0.070%), Immigrants from South Eastern Asia (23.1%, a difference of 0.17%), English (23.1%, a difference of 0.36%), Guamanian/Chamorro (23.2%, a difference of 0.40%), and Pueblo (23.0%, a difference of 0.45%).
| Demographics | Rating | Rank | 3 or more Vehicles in Household |
| Immigrants | Philippines | 100.0 /100 | #22 | Exceptional 23.8% |
| Scandinavians | 100.0 /100 | #23 | Exceptional 23.6% |
| Sri Lankans | 100.0 /100 | #24 | Exceptional 23.6% |
| Immigrants | Central America | 100.0 /100 | #25 | Exceptional 23.4% |
| Mexican American Indians | 100.0 /100 | #26 | Exceptional 23.3% |
| Guamanians/Chamorros | 100.0 /100 | #27 | Exceptional 23.2% |
| Lumbee | 100.0 /100 | #28 | Exceptional 23.1% |
| Spanish | 100.0 /100 | #29 | Exceptional 23.1% |
| Immigrants | South Eastern Asia | 100.0 /100 | #30 | Exceptional 23.1% |
| English | 100.0 /100 | #31 | Exceptional 23.1% |
| Pueblo | 100.0 /100 | #32 | Exceptional 23.0% |
| Spanish Americans | 100.0 /100 | #33 | Exceptional 23.0% |
| Swiss | 100.0 /100 | #34 | Exceptional 23.0% |
| Choctaw | 100.0 /100 | #35 | Exceptional 23.0% |
| Cherokee | 100.0 /100 | #36 | Exceptional 23.0% |