Immigrants from Portugal vs Immigrants from Zaire 3 or more Vehicles in Household
COMPARE
Immigrants from Portugal
Immigrants from Zaire
3 or more Vehicles in Household
3 or more Vehicles in Household Comparison
Immigrants from Portugal
Immigrants from Zaire
18.6%
3 OR MORE VEHICLES IN HOUSEHOLD
8.9/ 100
METRIC RATING
218th/ 347
METRIC RANK
16.7%
3 OR MORE VEHICLES IN HOUSEHOLD
0.1/ 100
METRIC RATING
298th/ 347
METRIC RANK
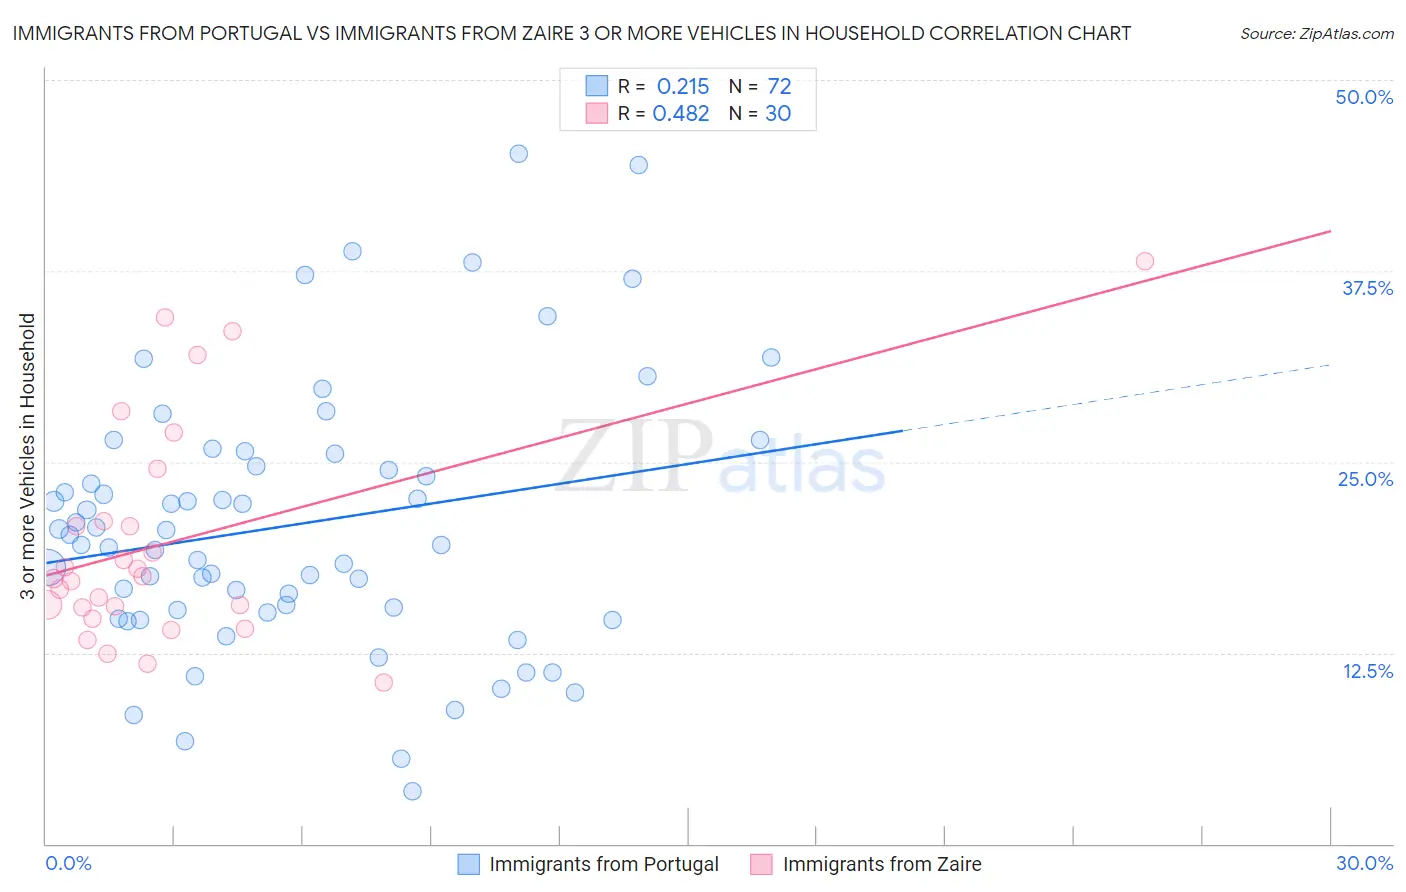
Immigrants from Portugal vs Immigrants from Zaire 3 or more Vehicles in Household Correlation Chart
The statistical analysis conducted on geographies consisting of 174,744,003 people shows a weak positive correlation between the proportion of Immigrants from Portugal and percentage of households with 3 or more vehicles available in the United States with a correlation coefficient (R) of 0.215 and weighted average of 18.6%. Similarly, the statistical analysis conducted on geographies consisting of 107,239,583 people shows a moderate positive correlation between the proportion of Immigrants from Zaire and percentage of households with 3 or more vehicles available in the United States with a correlation coefficient (R) of 0.482 and weighted average of 16.7%, a difference of 11.6%.
3 or more Vehicles in Household Correlation Summary
| Measurement | Immigrants from Portugal | Immigrants from Zaire |
| Minimum | 3.4% | 10.6% |
| Maximum | 45.2% | 38.1% |
| Range | 41.7% | 27.5% |
| Mean | 20.9% | 19.8% |
| Median | 19.9% | 17.5% |
| Interquartile 25% (IQ1) | 15.2% | 15.4% |
| Interquartile 75% (IQ3) | 25.1% | 21.1% |
| Interquartile Range (IQR) | 9.9% | 5.7% |
| Standard Deviation (Sample) | 8.7% | 7.2% |
| Standard Deviation (Population) | 8.6% | 7.1% |
Similar Demographics by 3 or more Vehicles in Household
Demographics Similar to Immigrants from Portugal by 3 or more Vehicles in Household
In terms of 3 or more vehicles in household, the demographic groups most similar to Immigrants from Portugal are Immigrants from Armenia (18.6%, a difference of 0.080%), Nigerian (18.6%, a difference of 0.28%), Immigrants from Italy (18.7%, a difference of 0.29%), Immigrants from Nigeria (18.7%, a difference of 0.31%), and Eastern European (18.7%, a difference of 0.37%).
| Demographics | Rating | Rank | 3 or more Vehicles in Household |
| Immigrants | Kenya | 12.4 /100 | #211 | Poor 18.8% |
| Panamanians | 11.6 /100 | #212 | Poor 18.8% |
| Immigrants | Cuba | 11.6 /100 | #213 | Poor 18.8% |
| Immigrants | Sierra Leone | 10.8 /100 | #214 | Poor 18.7% |
| Eastern Europeans | 10.6 /100 | #215 | Poor 18.7% |
| Immigrants | Nigeria | 10.3 /100 | #216 | Poor 18.7% |
| Immigrants | Italy | 10.2 /100 | #217 | Poor 18.7% |
| Immigrants | Portugal | 8.9 /100 | #218 | Tragic 18.6% |
| Immigrants | Armenia | 8.6 /100 | #219 | Tragic 18.6% |
| Nigerians | 7.9 /100 | #220 | Tragic 18.6% |
| Immigrants | Poland | 7.5 /100 | #221 | Tragic 18.6% |
| Belizeans | 7.3 /100 | #222 | Tragic 18.6% |
| Immigrants | Czechoslovakia | 5.9 /100 | #223 | Tragic 18.5% |
| Immigrants | Argentina | 5.6 /100 | #224 | Tragic 18.5% |
| Immigrants | Lithuania | 5.6 /100 | #225 | Tragic 18.5% |
Demographics Similar to Immigrants from Zaire by 3 or more Vehicles in Household
In terms of 3 or more vehicles in household, the demographic groups most similar to Immigrants from Zaire are Immigrants from South America (16.7%, a difference of 0.060%), Israeli (16.8%, a difference of 0.37%), Cypriot (16.6%, a difference of 0.54%), Inupiat (16.9%, a difference of 0.84%), and Paraguayan (16.6%, a difference of 0.95%).
| Demographics | Rating | Rank | 3 or more Vehicles in Household |
| Immigrants | Congo | 0.1 /100 | #291 | Tragic 17.0% |
| Immigrants | Spain | 0.1 /100 | #292 | Tragic 17.0% |
| Bahamians | 0.1 /100 | #293 | Tragic 16.9% |
| Immigrants | Western Africa | 0.1 /100 | #294 | Tragic 16.9% |
| Immigrants | Russia | 0.1 /100 | #295 | Tragic 16.9% |
| Inupiat | 0.1 /100 | #296 | Tragic 16.9% |
| Israelis | 0.1 /100 | #297 | Tragic 16.8% |
| Immigrants | Zaire | 0.1 /100 | #298 | Tragic 16.7% |
| Immigrants | South America | 0.1 /100 | #299 | Tragic 16.7% |
| Cypriots | 0.0 /100 | #300 | Tragic 16.6% |
| Paraguayans | 0.0 /100 | #301 | Tragic 16.6% |
| Immigrants | Greece | 0.0 /100 | #302 | Tragic 16.5% |
| Immigrants | Serbia | 0.0 /100 | #303 | Tragic 16.4% |
| Ghanaians | 0.0 /100 | #304 | Tragic 16.4% |
| Immigrants | Morocco | 0.0 /100 | #305 | Tragic 16.3% |