Immigrants from Portugal vs Asian 3 or more Vehicles in Household
COMPARE
Immigrants from Portugal
Asian
3 or more Vehicles in Household
3 or more Vehicles in Household Comparison
Immigrants from Portugal
Asians
18.6%
3 OR MORE VEHICLES IN HOUSEHOLD
8.9/ 100
METRIC RATING
218th/ 347
METRIC RANK
20.8%
3 OR MORE VEHICLES IN HOUSEHOLD
96.8/ 100
METRIC RATING
110th/ 347
METRIC RANK
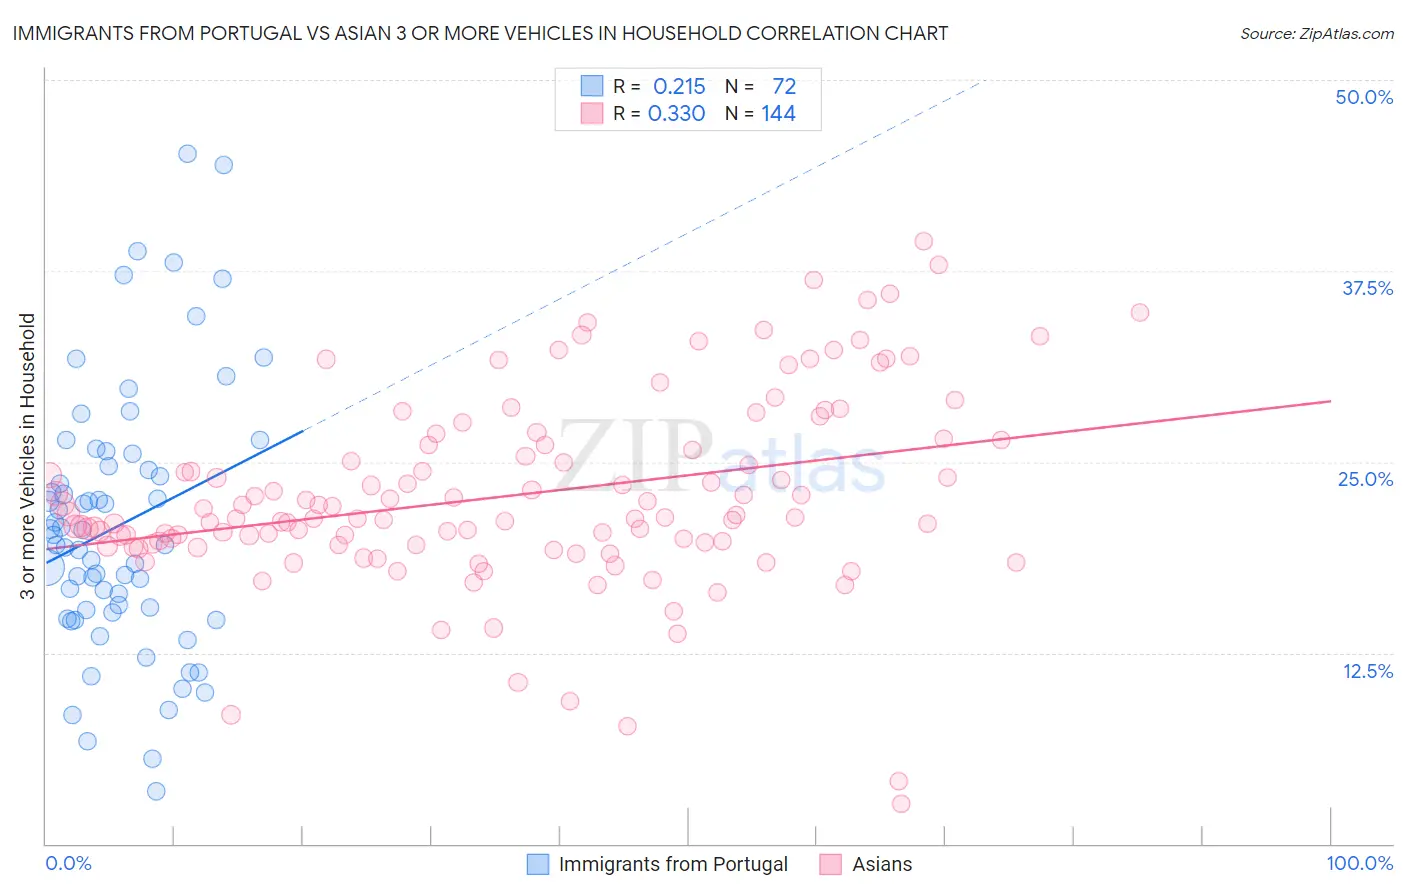
Immigrants from Portugal vs Asian 3 or more Vehicles in Household Correlation Chart
The statistical analysis conducted on geographies consisting of 174,744,003 people shows a weak positive correlation between the proportion of Immigrants from Portugal and percentage of households with 3 or more vehicles available in the United States with a correlation coefficient (R) of 0.215 and weighted average of 18.6%. Similarly, the statistical analysis conducted on geographies consisting of 549,911,489 people shows a mild positive correlation between the proportion of Asians and percentage of households with 3 or more vehicles available in the United States with a correlation coefficient (R) of 0.330 and weighted average of 20.8%, a difference of 11.3%.
3 or more Vehicles in Household Correlation Summary
| Measurement | Immigrants from Portugal | Asian |
| Minimum | 3.4% | 2.6% |
| Maximum | 45.2% | 39.4% |
| Range | 41.7% | 36.8% |
| Mean | 20.9% | 22.8% |
| Median | 19.9% | 21.3% |
| Interquartile 25% (IQ1) | 15.2% | 19.6% |
| Interquartile 75% (IQ3) | 25.1% | 26.1% |
| Interquartile Range (IQR) | 9.9% | 6.5% |
| Standard Deviation (Sample) | 8.7% | 6.3% |
| Standard Deviation (Population) | 8.6% | 6.2% |
Similar Demographics by 3 or more Vehicles in Household
Demographics Similar to Immigrants from Portugal by 3 or more Vehicles in Household
In terms of 3 or more vehicles in household, the demographic groups most similar to Immigrants from Portugal are Immigrants from Armenia (18.6%, a difference of 0.080%), Nigerian (18.6%, a difference of 0.28%), Immigrants from Italy (18.7%, a difference of 0.29%), Immigrants from Nigeria (18.7%, a difference of 0.31%), and Eastern European (18.7%, a difference of 0.37%).
| Demographics | Rating | Rank | 3 or more Vehicles in Household |
| Immigrants | Kenya | 12.4 /100 | #211 | Poor 18.8% |
| Panamanians | 11.6 /100 | #212 | Poor 18.8% |
| Immigrants | Cuba | 11.6 /100 | #213 | Poor 18.8% |
| Immigrants | Sierra Leone | 10.8 /100 | #214 | Poor 18.7% |
| Eastern Europeans | 10.6 /100 | #215 | Poor 18.7% |
| Immigrants | Nigeria | 10.3 /100 | #216 | Poor 18.7% |
| Immigrants | Italy | 10.2 /100 | #217 | Poor 18.7% |
| Immigrants | Portugal | 8.9 /100 | #218 | Tragic 18.6% |
| Immigrants | Armenia | 8.6 /100 | #219 | Tragic 18.6% |
| Nigerians | 7.9 /100 | #220 | Tragic 18.6% |
| Immigrants | Poland | 7.5 /100 | #221 | Tragic 18.6% |
| Belizeans | 7.3 /100 | #222 | Tragic 18.6% |
| Immigrants | Czechoslovakia | 5.9 /100 | #223 | Tragic 18.5% |
| Immigrants | Argentina | 5.6 /100 | #224 | Tragic 18.5% |
| Immigrants | Lithuania | 5.6 /100 | #225 | Tragic 18.5% |
Demographics Similar to Asians by 3 or more Vehicles in Household
In terms of 3 or more vehicles in household, the demographic groups most similar to Asians are Immigrants from Micronesia (20.7%, a difference of 0.030%), Filipino (20.8%, a difference of 0.14%), Immigrants from Scotland (20.8%, a difference of 0.20%), Nicaraguan (20.7%, a difference of 0.32%), and Immigrants from England (20.7%, a difference of 0.33%).
| Demographics | Rating | Rank | 3 or more Vehicles in Household |
| Dutch West Indians | 97.8 /100 | #103 | Exceptional 20.9% |
| Luxembourgers | 97.7 /100 | #104 | Exceptional 20.9% |
| Austrians | 97.5 /100 | #105 | Exceptional 20.9% |
| Bolivians | 97.4 /100 | #106 | Exceptional 20.8% |
| Immigrants | Germany | 97.4 /100 | #107 | Exceptional 20.8% |
| Immigrants | Scotland | 97.1 /100 | #108 | Exceptional 20.8% |
| Filipinos | 97.0 /100 | #109 | Exceptional 20.8% |
| Asians | 96.8 /100 | #110 | Exceptional 20.8% |
| Immigrants | Micronesia | 96.7 /100 | #111 | Exceptional 20.7% |
| Nicaraguans | 96.2 /100 | #112 | Exceptional 20.7% |
| Immigrants | England | 96.2 /100 | #113 | Exceptional 20.7% |
| Burmese | 95.8 /100 | #114 | Exceptional 20.6% |
| French Canadians | 95.0 /100 | #115 | Exceptional 20.6% |
| Italians | 94.9 /100 | #116 | Exceptional 20.6% |
| Croatians | 94.9 /100 | #117 | Exceptional 20.6% |