Immigrants from Lebanon 4 or more Vehicles in Household

COMPARE

Immigrants from Lebanon
Race
Ancestry
AfghanAfricanAlaska NativeAlaskan AthabascanAlbanianAleutAlsatianAmericanApacheArabArapahoArgentineanArmenianAssyrian/Chaldean/SyriacAustralianAustrianBahamianBangladeshiBarbadianBasqueBelgianBelizeanBermudanBhutaneseBlackfeetBolivianBrazilianBritishBritish West IndianBulgarianBurmeseCajunCambodianCanadianCape VerdeanCarpatho RusynCelticCentral AmericanCentral American IndianCherokeeCheyenneChickasawChileanChineseChippewaChoctawColombianColvilleComancheCosta RicanCreeCreekCroatianCrowCubanCypriotCzechCzechoslovakianDanishDelawareDominicanDutchDutch West IndianEastern EuropeanEcuadorianEgyptianEnglishEstonianEthiopianEuropeanFijianFilipinoFinnishFrenchFrench American IndianFrench CanadianGermanGerman RussianGhanaianGreekGuamanian/ChamorroGuatemalanGuyaneseHaitianHmongHonduranHopiHoumaHungarianIcelanderIndian (Asian)IndonesianInupiatIranianIraqiIrishIroquoisIsraeliItalianJamaicanJapaneseJordanianKenyanKiowaKoreanLaotianLatvianLebaneseLiberianLithuanianLumbeeLuxembourgerMacedonianMalaysianMalteseMarshalleseMenomineeMexicanMexican American IndianMongolianMoroccanNative HawaiianNavajoNepaleseNew ZealanderNicaraguanNigerianNorthern EuropeanNorwegianOkinawanOsageOttawaPaiutePakistaniPalestinianPanamanianParaguayanPennsylvania GermanPeruvianPimaPolishPortuguesePotawatomiPuebloPuerto RicanPuget Sound SalishRomanianRussianSalvadoranSamoanScandinavianScotch-IrishScottishSeminoleSenegaleseSerbianShoshoneSierra LeoneanSiouxSlavicSlovakSloveneSomaliSouth AfricanSouth AmericanSouth American IndianSoviet UnionSpaniardSpanishSpanish AmericanSpanish American IndianSri LankanSubsaharan AfricanSudaneseSwedishSwissSyrianTaiwaneseThaiTlingit-HaidaTohono O'OdhamTonganTrinidadian and TobagonianTsimshianTurkishU.S. Virgin IslanderUgandanUkrainianUruguayanUteVenezuelanVietnameseWelshWest IndianYakamaYaquiYugoslavianYumanYup'ikZimbabwean
Immigration
NonimmigrantsImmigrantsAfghanistanAfricaAlbaniaArgentinaArmeniaAsiaAustraliaAustriaBahamasBangladeshBarbadosBelarusBelgiumBelizeBoliviaBosnia and HerzegovinaBrazilBulgariaBurma/MyanmarCabo VerdeCambodiaCameroonCanadaCaribbeanCentral AmericaChileChinaColombiaCongoCosta RicaCroatiaCubaCzechoslovakiaDenmarkDominicaDominican RepublicEastern AfricaEastern AsiaEastern EuropeEcuadorEgyptEl SalvadorEnglandEritreaEthiopiaEuropeFijiFranceGermanyGhanaGreeceGrenadaGuatemalaGuyanaHaitiHondurasHong KongHungaryIndiaIndonesiaIranIraqIrelandIsraelItalyJamaicaJapanJordanKazakhstanKenyaKoreaKuwaitLaosLatin AmericaLatviaLebanonLiberiaLithuaniaMalaysiaMexicoMicronesiaMiddle AfricaMoldovaMoroccoNepalNetherlandsNicaraguaNigeriaNorth AmericaNorth MacedoniaNorthern AfricaNorthern EuropeNorwayOceaniaPakistanPanamaPeruPhilippinesPolandPortugalRomaniaRussiaSaudi ArabiaScotlandSenegalSerbiaSierra LeoneSingaporeSomaliaSouth AfricaSouth AmericaSouth Central AsiaSouth Eastern AsiaSouthern EuropeSpainSri LankaSt. Vincent and the GrenadinesSudanSwedenSwitzerlandSyriaTaiwanThailandTrinidad and TobagoTurkeyUgandaUkraineUruguayUzbekistanVenezuelaVietnamWest IndiesWestern AfricaWestern AsiaWestern EuropeYemenZaireZimbabweAzores
Select to Compare
Race
Ancestry
AfghanAfricanAlaska NativeAlaskan AthabascanAlbanianAleutAlsatianAmericanApacheArabArapahoArgentineanArmenianAssyrian/Chaldean/SyriacAustralianAustrianBahamianBangladeshiBarbadianBasqueBelgianBelizeanBermudanBhutaneseBlackfeetBolivianBrazilianBritishBritish West IndianBulgarianBurmeseCajunCambodianCanadianCape VerdeanCarpatho RusynCelticCentral AmericanCentral American IndianCherokeeCheyenneChickasawChileanChineseChippewaChoctawColombianColvilleComancheCosta RicanCreeCreekCroatianCrowCubanCypriotCzechCzechoslovakianDanishDelawareDominicanDutchDutch West IndianEastern EuropeanEcuadorianEgyptianEnglishEstonianEthiopianEuropeanFijianFilipinoFinnishFrenchFrench American IndianFrench CanadianGermanGerman RussianGhanaianGreekGuamanian/ChamorroGuatemalanGuyaneseHaitianHmongHonduranHopiHoumaHungarianIcelanderIndian (Asian)IndonesianInupiatIranianIraqiIrishIroquoisIsraeliItalianJamaicanJapaneseJordanianKenyanKiowaKoreanLaotianLatvianLebaneseLiberianLithuanianLumbeeLuxembourgerMacedonianMalaysianMalteseMarshalleseMenomineeMexicanMexican American IndianMongolianMoroccanNative HawaiianNavajoNepaleseNew ZealanderNicaraguanNigerianNorthern EuropeanNorwegianOkinawanOsageOttawaPaiutePakistaniPalestinianPanamanianParaguayanPennsylvania GermanPeruvianPimaPolishPortuguesePotawatomiPuebloPuerto RicanPuget Sound SalishRomanianRussianSalvadoranSamoanScandinavianScotch-IrishScottishSeminoleSenegaleseSerbianShoshoneSierra LeoneanSiouxSlavicSlovakSloveneSomaliSouth AfricanSouth AmericanSouth American IndianSoviet UnionSpaniardSpanishSpanish AmericanSpanish American IndianSri LankanSubsaharan AfricanSudaneseSwedishSwissSyrianTaiwaneseThaiTlingit-HaidaTohono O'OdhamTonganTrinidadian and TobagonianTsimshianTurkishU.S. Virgin IslanderUgandanUkrainianUruguayanUteVenezuelanVietnameseWelshWest IndianYakamaYaquiYugoslavianYumanYup'ikZimbabwean
Immigration
NonimmigrantsImmigrantsAfghanistanAfricaAlbaniaArgentinaArmeniaAsiaAustraliaAustriaBahamasBangladeshBarbadosBelarusBelgiumBelizeBoliviaBosnia and HerzegovinaBrazilBulgariaBurma/MyanmarCabo VerdeCambodiaCameroonCanadaCaribbeanCentral AmericaChileChinaColombiaCongoCosta RicaCroatiaCubaCzechoslovakiaDenmarkDominicaDominican RepublicEastern AfricaEastern AsiaEastern EuropeEcuadorEgyptEl SalvadorEnglandEritreaEthiopiaEuropeFijiFranceGermanyGhanaGreeceGrenadaGuatemalaGuyanaHaitiHondurasHong KongHungaryIndiaIndonesiaIranIraqIrelandIsraelItalyJamaicaJapanJordanKazakhstanKenyaKoreaKuwaitLaosLatin AmericaLatviaLiberiaLithuaniaMalaysiaMexicoMicronesiaMiddle AfricaMoldovaMoroccoNepalNetherlandsNicaraguaNigeriaNorth AmericaNorth MacedoniaNorthern AfricaNorthern EuropeNorwayOceaniaPakistanPanamaPeruPhilippinesPolandPortugalRomaniaRussiaSaudi ArabiaScotlandSenegalSerbiaSierra LeoneSingaporeSomaliaSouth AfricaSouth AmericaSouth Central AsiaSouth Eastern AsiaSouthern EuropeSpainSri LankaSt. Vincent and the GrenadinesSudanSwedenSwitzerlandSyriaTaiwanThailandTrinidad and TobagoTurkeyUgandaUkraineUruguayUzbekistanVenezuelaVietnamWest IndiesWestern AfricaWestern AsiaWestern EuropeYemenZaireZimbabweAzores
4 or more Vehicles in Household
Income
Poverty
Unemployment
Labor Participation
Family Structure
Vehicle Availability
Education Level
Disability

Immigrants from Lebanon 4 or more Vehicles in Household
Average

6.3%
4+ VEHICLES AVAILABLE
51.7/ 100
METRIC RATING
172nd/ 347
METRIC RANK

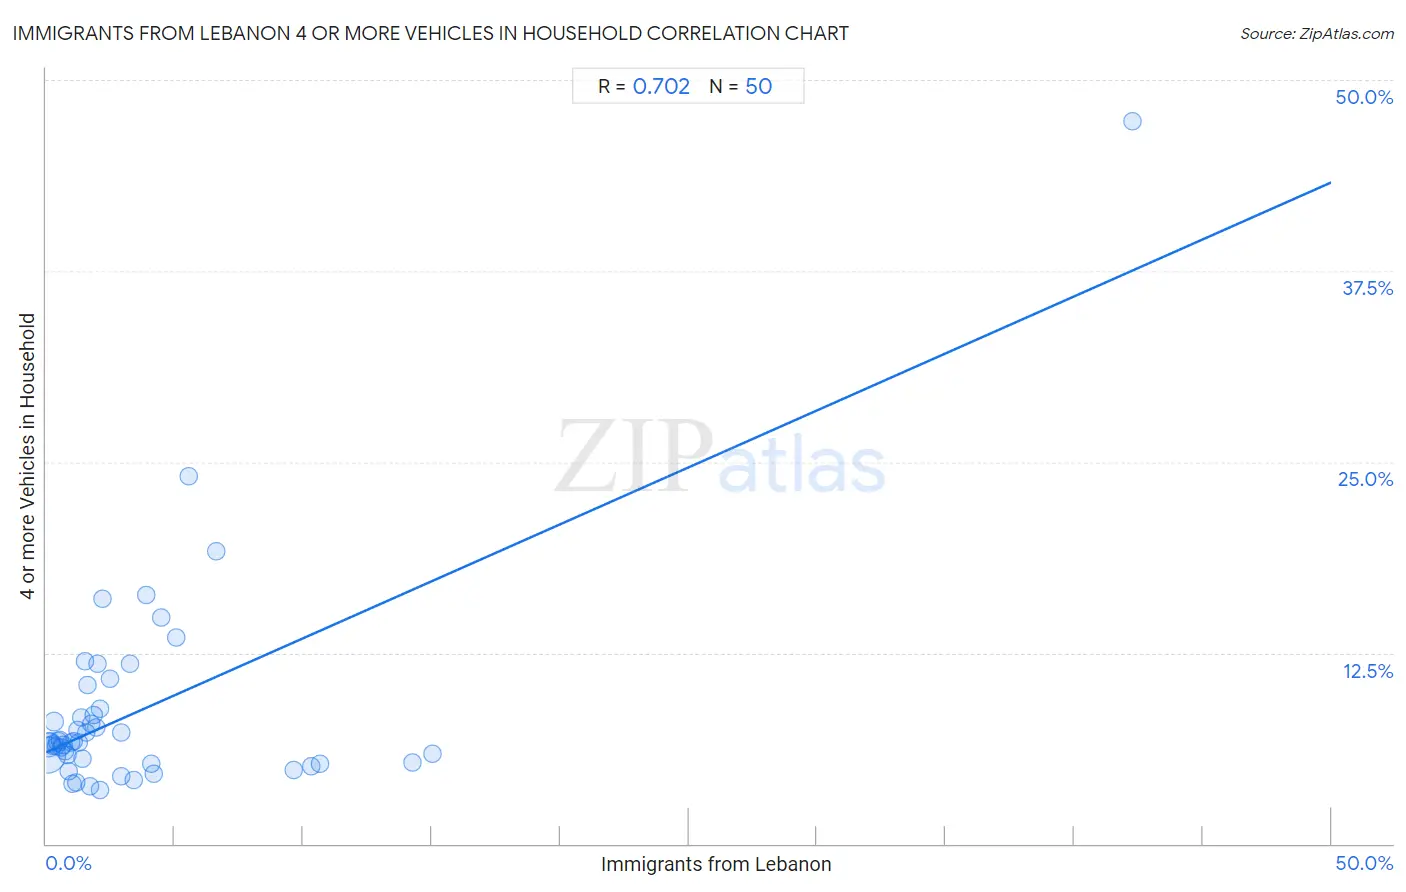
Immigrants from Lebanon 4 or more Vehicles in Household Correlation Chart

The statistical analysis conducted on geographies consisting of 216,708,139 people shows a strong positive correlation between the proportion of Immigrants from Lebanon and percentage of households with 4 or more vehicles available in the United States with a correlation coefficient (R) of 0.702 and weighted average of 6.3%. On average, for every 1% (one percent) increase in Immigrants from Lebanon within a typical geography, there is an increase of 0.75% in percentage of households with 4 or more vehicles available.
Immigrants from Lebanon 4 or more Vehicles in Household
It is essential to understand that the correlation between the percentage of Immigrants from Lebanon and percentage of households with 4 or more vehicles available does not imply a direct cause-and-effect relationship. It remains uncertain whether the presence of Immigrants from Lebanon influences an upward or downward trend in the level of percentage of households with 4 or more vehicles available within an area, or if Immigrants from Lebanon simply ended up residing in those areas with higher or lower levels of percentage of households with 4 or more vehicles available due to other factors.

Demographics Similar to Immigrants from Lebanon by 4 or more Vehicles in Household

In terms of 4 or more vehicles in household, the demographic groups most similar to Immigrants from Lebanon are Immigrants from India (6.3%, a difference of 0.020%), Slovene (6.3%, a difference of 0.060%), Immigrants from Syria (6.3%, a difference of 0.11%), Lithuanian (6.3%, a difference of 0.17%), and Immigrants from Western Europe (6.3%, a difference of 0.29%).
DemographicsRating | Rank4 or more Vehicles in Household
Immigrants from Peru
59.8
/100
|
#165
Average
6.4%
Immigrants from Denmark
57.8
/100
|
#166
Average
6.4%
Poles
56.9
/100
|
#167
Average
6.4%
Lebanese
55.8
/100
|
#168
Average
6.4%
Estonians
55.1
/100
|
#169
Average
6.4%
Immigrants from Syria
52.8
/100
|
#170
Average
6.3%
Immigrants from India
51.9
/100
|
#171
Average
6.3%
Immigrants from Lebanon
51.7
/100
|
#172
Average
6.3%
Slovenes
51.1
/100
|
#173
Average
6.3%
Lithuanians
50.0
/100
|
#174
Average
6.3%
Immigrants from Western Europe
48.8
/100
|
#175
Average
6.3%
Ukrainians
47.6
/100
|
#176
Average
6.3%
Slovaks
46.9
/100
|
#177
Average
6.3%
Belizeans
44.5
/100
|
#178
Average
6.3%
Immigrants from Japan
43.1
/100
|
#179
Average
6.3%

Immigrants from Lebanon 4 or more Vehicles in Household Correlation Summary

MeasurementImmigrants from Lebanon Data4 or more Vehicles in Household Data
Minimum0.032%3.5%
Maximum42.3%47.3%
Range42.2%43.7%
Mean3.7%8.8%
Median1.7%6.6%
Interquartile 25% (IQ1)0.87%5.3%
Interquartile 75% (IQ3)3.9%8.8%
Interquartile Range (IQR)3.0%3.6%
Standard Deviation (Sample)6.5%7.0%
Standard Deviation (Population)6.5%6.9%

Correlation Details

Immigrants from Lebanon PercentileSample Size4 or more Vehicles in Household
[
0.0%
-
0.5%
]
0.032%
131,853,8845.8%
[
0.0%
-
0.5%
]
0.096%
44,555,3506.4%
[
0.0%
-
0.5%
]
0.17%
17,958,0796.6%
[
0.0%
-
0.5%
]
0.24%
7,588,2706.4%
[
0.0%
-
0.5%
]
0.31%
4,209,8268.0%
[
0.0%
-
0.5%
]
0.38%
2,699,9846.4%
[
0.0%
-
0.5%
]
0.46%
1,649,2096.7%
[
0.5%
-
1.0%
]
0.53%
1,505,3316.8%
[
0.5%
-
1.0%
]
0.59%
1,237,2616.3%
[
0.5%
-
1.0%
]
0.66%
486,6176.5%
[
0.5%
-
1.0%
]
0.73%
224,3786.0%
[
0.5%
-
1.0%
]
0.82%
337,5545.8%
[
0.5%
-
1.0%
]
0.87%
361,6864.7%
[
0.5%
-
1.0%
]
0.95%
405,2656.6%
[
1.0%
-
1.5%
]
1.00%
135,1353.9%
[
1.0%
-
1.5%
]
1.09%
243,7286.7%
[
1.0%
-
1.5%
]
1.15%
32,9274.0%
[
1.0%
-
1.5%
]
1.23%
210,7817.4%
[
1.0%
-
1.5%
]
1.27%
343,7786.6%
[
1.0%
-
1.5%
]
1.38%
71,9718.3%
[
1.0%
-
1.5%
]
1.43%
29,0655.6%
[
1.0%
-
1.5%
]
1.49%
33,27811.9%
[
1.5%
-
2.0%
]
1.57%
3,4507.3%
[
1.5%
-
2.0%
]
1.63%
6,08310.4%
[
1.5%
-
2.0%
]
1.69%
22,0823.7%
[
1.5%
-
2.0%
]
1.76%
43,4127.9%
[
1.5%
-
2.0%
]
1.87%
20,3718.5%
[
1.5%
-
2.0%
]
1.93%
35,4087.7%
[
1.5%
-
2.0%
]
1.98%
4,96011.8%
[
2.0%
-
2.5%
]
2.09%
24,2293.5%
[
2.0%
-
2.5%
]
2.11%
15,3778.8%
[
2.0%
-
2.5%
]
2.20%
3,54416.0%
[
2.0%
-
2.5%
]
2.46%
28410.8%
[
2.5%
-
3.0%
]
2.93%
2057.3%
[
2.5%
-
3.0%
]
2.94%
22,8314.5%
[
3.0%
-
3.5%
]
3.26%
2,02511.8%
[
3.0%
-
3.5%
]
3.42%
34,0464.2%
[
3.5%
-
4.0%
]
3.89%
41116.3%
[
4.0%
-
4.5%
]
4.08%
8,9195.3%
[
4.0%
-
4.5%
]
4.17%
2,5894.6%
[
4.0%
-
4.5%
]
4.46%
1,50114.8%
[
5.0%
-
5.5%
]
5.04%
1,94513.5%
[
5.5%
-
6.0%
]
5.54%
3,25224.1%
[
6.5%
-
7.0%
]
6.61%
46919.1%
[
9.5%
-
10.0%
]
9.61%
108,4144.9%
[
10.0%
-
10.5%
]
10.31%
62,4745.1%
[
10.5%
-
11.0%
]
10.66%
12,4055.2%
[
14.0%
-
14.5%
]
14.27%
53,0445.3%
[
15.0%
-
15.5%
]
15.03%
40,3925.9%
[
42.0%
-
42.5%
]
42.27%
66047.3%