Immigrants from Lebanon vs Immigrants from China 3 or more Vehicles in Household
COMPARE
Immigrants from Lebanon
Immigrants from China
3 or more Vehicles in Household
3 or more Vehicles in Household Comparison
Immigrants from Lebanon
Immigrants from China
19.8%
3 OR MORE VEHICLES IN HOUSEHOLD
67.6/ 100
METRIC RATING
160th/ 347
METRIC RANK
18.2%
3 OR MORE VEHICLES IN HOUSEHOLD
2.9/ 100
METRIC RATING
240th/ 347
METRIC RANK
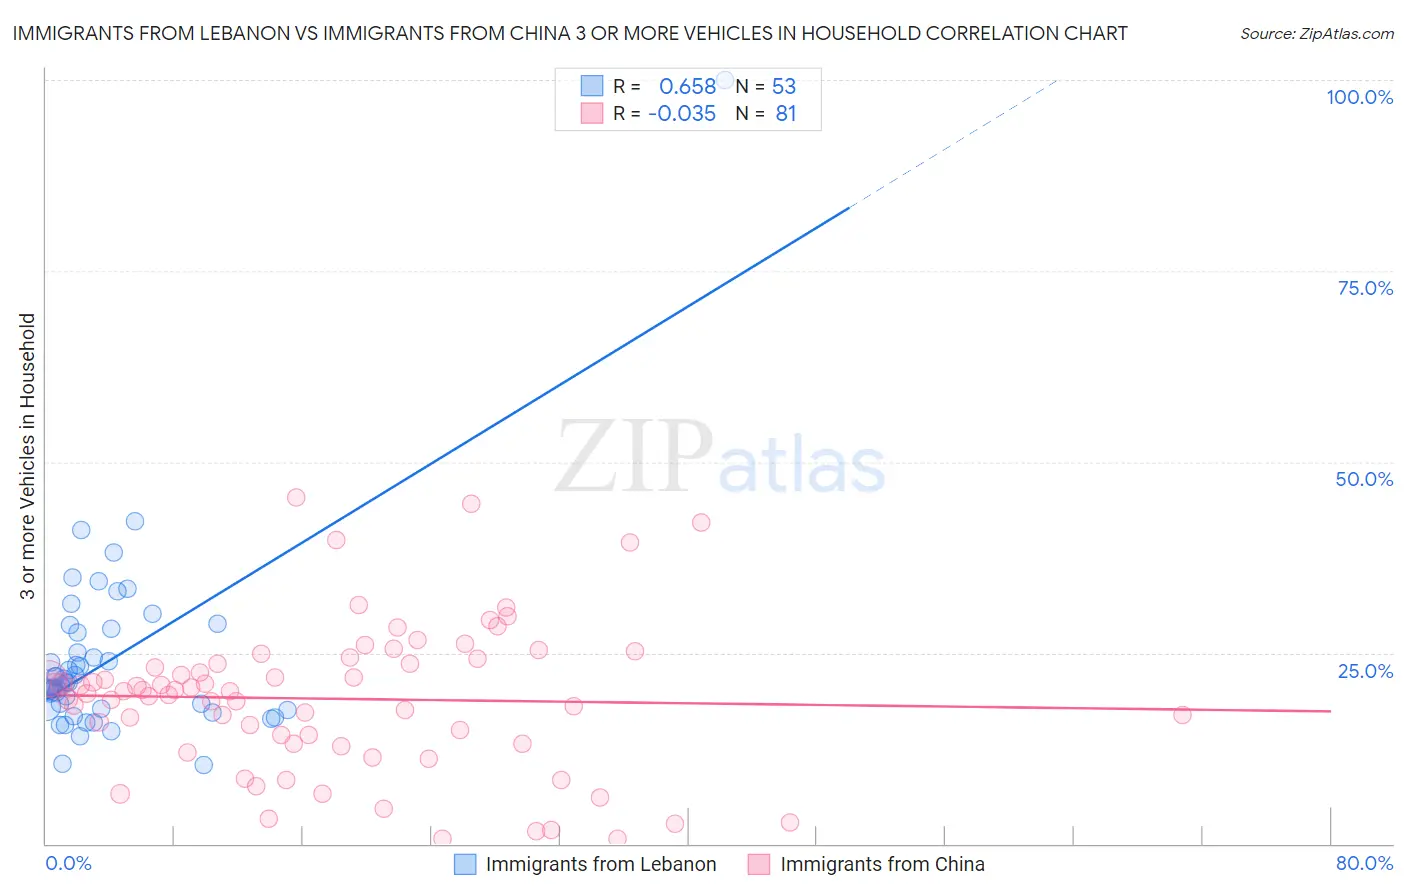
Immigrants from Lebanon vs Immigrants from China 3 or more Vehicles in Household Correlation Chart
The statistical analysis conducted on geographies consisting of 217,088,415 people shows a significant positive correlation between the proportion of Immigrants from Lebanon and percentage of households with 3 or more vehicles available in the United States with a correlation coefficient (R) of 0.658 and weighted average of 19.8%. Similarly, the statistical analysis conducted on geographies consisting of 456,383,621 people shows no correlation between the proportion of Immigrants from China and percentage of households with 3 or more vehicles available in the United States with a correlation coefficient (R) of -0.035 and weighted average of 18.2%, a difference of 8.6%.
3 or more Vehicles in Household Correlation Summary
| Measurement | Immigrants from Lebanon | Immigrants from China |
| Minimum | 10.3% | 0.62% |
| Maximum | 100.0% | 45.4% |
| Range | 89.7% | 44.8% |
| Mean | 24.1% | 19.0% |
| Median | 21.1% | 19.9% |
| Interquartile 25% (IQ1) | 17.5% | 13.0% |
| Interquartile 75% (IQ3) | 27.9% | 23.9% |
| Interquartile Range (IQR) | 10.4% | 10.9% |
| Standard Deviation (Sample) | 12.8% | 9.7% |
| Standard Deviation (Population) | 12.7% | 9.6% |
Similar Demographics by 3 or more Vehicles in Household
Demographics Similar to Immigrants from Lebanon by 3 or more Vehicles in Household
In terms of 3 or more vehicles in household, the demographic groups most similar to Immigrants from Lebanon are Immigrants from Pakistan (19.8%, a difference of 0.050%), Armenian (19.8%, a difference of 0.11%), Immigrants from Guatemala (19.7%, a difference of 0.16%), Hungarian (19.8%, a difference of 0.26%), and Thai (19.8%, a difference of 0.31%).
| Demographics | Rating | Rank | 3 or more Vehicles in Household |
| Yuman | 75.6 /100 | #153 | Good 19.9% |
| Immigrants | Jordan | 75.0 /100 | #154 | Good 19.9% |
| Tlingit-Haida | 73.4 /100 | #155 | Good 19.9% |
| Thais | 71.1 /100 | #156 | Good 19.8% |
| Hungarians | 70.5 /100 | #157 | Good 19.8% |
| Armenians | 68.8 /100 | #158 | Good 19.8% |
| Immigrants | Pakistan | 68.2 /100 | #159 | Good 19.8% |
| Immigrants | Lebanon | 67.6 /100 | #160 | Good 19.8% |
| Immigrants | Guatemala | 65.6 /100 | #161 | Good 19.7% |
| Estonians | 63.2 /100 | #162 | Good 19.7% |
| Chileans | 63.0 /100 | #163 | Good 19.7% |
| Yugoslavians | 62.9 /100 | #164 | Good 19.7% |
| Immigrants | Costa Rica | 61.9 /100 | #165 | Good 19.7% |
| Immigrants | Cameroon | 60.9 /100 | #166 | Good 19.7% |
| Ukrainians | 58.9 /100 | #167 | Average 19.6% |
Demographics Similar to Immigrants from China by 3 or more Vehicles in Household
In terms of 3 or more vehicles in household, the demographic groups most similar to Immigrants from China are Immigrants from Honduras (18.2%, a difference of 0.13%), Immigrants from Middle Africa (18.2%, a difference of 0.13%), African (18.2%, a difference of 0.20%), Hopi (18.2%, a difference of 0.31%), and Indonesian (18.3%, a difference of 0.36%).
| Demographics | Rating | Rank | 3 or more Vehicles in Household |
| Hondurans | 4.6 /100 | #233 | Tragic 18.4% |
| Immigrants | North Macedonia | 4.4 /100 | #234 | Tragic 18.4% |
| Sierra Leoneans | 3.9 /100 | #235 | Tragic 18.3% |
| Immigrants | Malaysia | 3.6 /100 | #236 | Tragic 18.3% |
| Indonesians | 3.5 /100 | #237 | Tragic 18.3% |
| Immigrants | Honduras | 3.1 /100 | #238 | Tragic 18.2% |
| Immigrants | Middle Africa | 3.1 /100 | #239 | Tragic 18.2% |
| Immigrants | China | 2.9 /100 | #240 | Tragic 18.2% |
| Africans | 2.7 /100 | #241 | Tragic 18.2% |
| Hopi | 2.5 /100 | #242 | Tragic 18.2% |
| Immigrants | Europe | 2.4 /100 | #243 | Tragic 18.1% |
| Mongolians | 2.3 /100 | #244 | Tragic 18.1% |
| Immigrants | Belize | 2.1 /100 | #245 | Tragic 18.1% |
| Immigrants | Australia | 2.0 /100 | #246 | Tragic 18.1% |
| Carpatho Rusyns | 1.9 /100 | #247 | Tragic 18.0% |