Immigrants from Lebanon GED/Equivalency

COMPARE

Immigrants from Lebanon
Race
Ancestry
AfghanAfricanAlaska NativeAlaskan AthabascanAlbanianAleutAlsatianAmericanApacheArabArapahoArgentineanArmenianAssyrian/Chaldean/SyriacAustralianAustrianBahamianBangladeshiBarbadianBasqueBelgianBelizeanBermudanBhutaneseBlackfeetBolivianBrazilianBritishBritish West IndianBulgarianBurmeseCajunCambodianCanadianCape VerdeanCarpatho RusynCelticCentral AmericanCentral American IndianCherokeeCheyenneChickasawChileanChineseChippewaChoctawColombianColvilleComancheCosta RicanCreeCreekCroatianCrowCubanCypriotCzechCzechoslovakianDanishDelawareDominicanDutchDutch West IndianEastern EuropeanEcuadorianEgyptianEnglishEstonianEthiopianEuropeanFijianFilipinoFinnishFrenchFrench American IndianFrench CanadianGermanGerman RussianGhanaianGreekGuamanian/ChamorroGuatemalanGuyaneseHaitianHmongHonduranHopiHoumaHungarianIcelanderIndian (Asian)IndonesianInupiatIranianIraqiIrishIroquoisIsraeliItalianJamaicanJapaneseJordanianKenyanKiowaKoreanLaotianLatvianLebaneseLiberianLithuanianLumbeeLuxembourgerMacedonianMalaysianMalteseMarshalleseMenomineeMexicanMexican American IndianMongolianMoroccanNative HawaiianNavajoNepaleseNew ZealanderNicaraguanNigerianNorthern EuropeanNorwegianOkinawanOsageOttawaPaiutePakistaniPalestinianPanamanianParaguayanPennsylvania GermanPeruvianPimaPolishPortuguesePotawatomiPuebloPuerto RicanPuget Sound SalishRomanianRussianSalvadoranSamoanScandinavianScotch-IrishScottishSeminoleSenegaleseSerbianShoshoneSierra LeoneanSiouxSlavicSlovakSloveneSomaliSouth AfricanSouth AmericanSouth American IndianSoviet UnionSpaniardSpanishSpanish AmericanSpanish American IndianSri LankanSubsaharan AfricanSudaneseSwedishSwissSyrianTaiwaneseThaiTlingit-HaidaTohono O'OdhamTonganTrinidadian and TobagonianTsimshianTurkishU.S. Virgin IslanderUgandanUkrainianUruguayanUteVenezuelanVietnameseWelshWest IndianYakamaYaquiYugoslavianYumanYup'ikZimbabwean
Immigration
NonimmigrantsImmigrantsAfghanistanAfricaAlbaniaArgentinaArmeniaAsiaAustraliaAustriaBahamasBangladeshBarbadosBelarusBelgiumBelizeBoliviaBosnia and HerzegovinaBrazilBulgariaBurma/MyanmarCabo VerdeCambodiaCameroonCanadaCaribbeanCentral AmericaChileChinaColombiaCongoCosta RicaCroatiaCubaCzechoslovakiaDenmarkDominicaDominican RepublicEastern AfricaEastern AsiaEastern EuropeEcuadorEgyptEl SalvadorEnglandEritreaEthiopiaEuropeFijiFranceGermanyGhanaGreeceGrenadaGuatemalaGuyanaHaitiHondurasHong KongHungaryIndiaIndonesiaIranIraqIrelandIsraelItalyJamaicaJapanJordanKazakhstanKenyaKoreaKuwaitLaosLatin AmericaLatviaLebanonLiberiaLithuaniaMalaysiaMexicoMicronesiaMiddle AfricaMoldovaMoroccoNepalNetherlandsNicaraguaNigeriaNorth AmericaNorth MacedoniaNorthern AfricaNorthern EuropeNorwayOceaniaPakistanPanamaPeruPhilippinesPolandPortugalRomaniaRussiaSaudi ArabiaScotlandSenegalSerbiaSierra LeoneSingaporeSomaliaSouth AfricaSouth AmericaSouth Central AsiaSouth Eastern AsiaSouthern EuropeSpainSri LankaSt. Vincent and the GrenadinesSudanSwedenSwitzerlandSyriaTaiwanThailandTrinidad and TobagoTurkeyUgandaUkraineUruguayUzbekistanVenezuelaVietnamWest IndiesWestern AfricaWestern AsiaWestern EuropeYemenZaireZimbabweAzores
Select to Compare
Race
Ancestry
AfghanAfricanAlaska NativeAlaskan AthabascanAlbanianAleutAlsatianAmericanApacheArabArapahoArgentineanArmenianAssyrian/Chaldean/SyriacAustralianAustrianBahamianBangladeshiBarbadianBasqueBelgianBelizeanBermudanBhutaneseBlackfeetBolivianBrazilianBritishBritish West IndianBulgarianBurmeseCajunCambodianCanadianCape VerdeanCarpatho RusynCelticCentral AmericanCentral American IndianCherokeeCheyenneChickasawChileanChineseChippewaChoctawColombianColvilleComancheCosta RicanCreeCreekCroatianCrowCubanCypriotCzechCzechoslovakianDanishDelawareDominicanDutchDutch West IndianEastern EuropeanEcuadorianEgyptianEnglishEstonianEthiopianEuropeanFijianFilipinoFinnishFrenchFrench American IndianFrench CanadianGermanGerman RussianGhanaianGreekGuamanian/ChamorroGuatemalanGuyaneseHaitianHmongHonduranHopiHoumaHungarianIcelanderIndian (Asian)IndonesianInupiatIranianIraqiIrishIroquoisIsraeliItalianJamaicanJapaneseJordanianKenyanKiowaKoreanLaotianLatvianLebaneseLiberianLithuanianLumbeeLuxembourgerMacedonianMalaysianMalteseMarshalleseMenomineeMexicanMexican American IndianMongolianMoroccanNative HawaiianNavajoNepaleseNew ZealanderNicaraguanNigerianNorthern EuropeanNorwegianOkinawanOsageOttawaPaiutePakistaniPalestinianPanamanianParaguayanPennsylvania GermanPeruvianPimaPolishPortuguesePotawatomiPuebloPuerto RicanPuget Sound SalishRomanianRussianSalvadoranSamoanScandinavianScotch-IrishScottishSeminoleSenegaleseSerbianShoshoneSierra LeoneanSiouxSlavicSlovakSloveneSomaliSouth AfricanSouth AmericanSouth American IndianSoviet UnionSpaniardSpanishSpanish AmericanSpanish American IndianSri LankanSubsaharan AfricanSudaneseSwedishSwissSyrianTaiwaneseThaiTlingit-HaidaTohono O'OdhamTonganTrinidadian and TobagonianTsimshianTurkishU.S. Virgin IslanderUgandanUkrainianUruguayanUteVenezuelanVietnameseWelshWest IndianYakamaYaquiYugoslavianYumanYup'ikZimbabwean
Immigration
NonimmigrantsImmigrantsAfghanistanAfricaAlbaniaArgentinaArmeniaAsiaAustraliaAustriaBahamasBangladeshBarbadosBelarusBelgiumBelizeBoliviaBosnia and HerzegovinaBrazilBulgariaBurma/MyanmarCabo VerdeCambodiaCameroonCanadaCaribbeanCentral AmericaChileChinaColombiaCongoCosta RicaCroatiaCubaCzechoslovakiaDenmarkDominicaDominican RepublicEastern AfricaEastern AsiaEastern EuropeEcuadorEgyptEl SalvadorEnglandEritreaEthiopiaEuropeFijiFranceGermanyGhanaGreeceGrenadaGuatemalaGuyanaHaitiHondurasHong KongHungaryIndiaIndonesiaIranIraqIrelandIsraelItalyJamaicaJapanJordanKazakhstanKenyaKoreaKuwaitLaosLatin AmericaLatviaLiberiaLithuaniaMalaysiaMexicoMicronesiaMiddle AfricaMoldovaMoroccoNepalNetherlandsNicaraguaNigeriaNorth AmericaNorth MacedoniaNorthern AfricaNorthern EuropeNorwayOceaniaPakistanPanamaPeruPhilippinesPolandPortugalRomaniaRussiaSaudi ArabiaScotlandSenegalSerbiaSierra LeoneSingaporeSomaliaSouth AfricaSouth AmericaSouth Central AsiaSouth Eastern AsiaSouthern EuropeSpainSri LankaSt. Vincent and the GrenadinesSudanSwedenSwitzerlandSyriaTaiwanThailandTrinidad and TobagoTurkeyUgandaUkraineUruguayUzbekistanVenezuelaVietnamWest IndiesWestern AfricaWestern AsiaWestern EuropeYemenZaireZimbabweAzores
GED/Equivalency
Income
Poverty
Unemployment
Labor Participation
Family Structure
Vehicle Availability
Education Level
Disability

Immigrants from Lebanon GED/Equivalency
Exceptional

86.8%
GED/EQUIVALENCY
90.9/ 100
METRIC RATING
121st/ 347
METRIC RANK

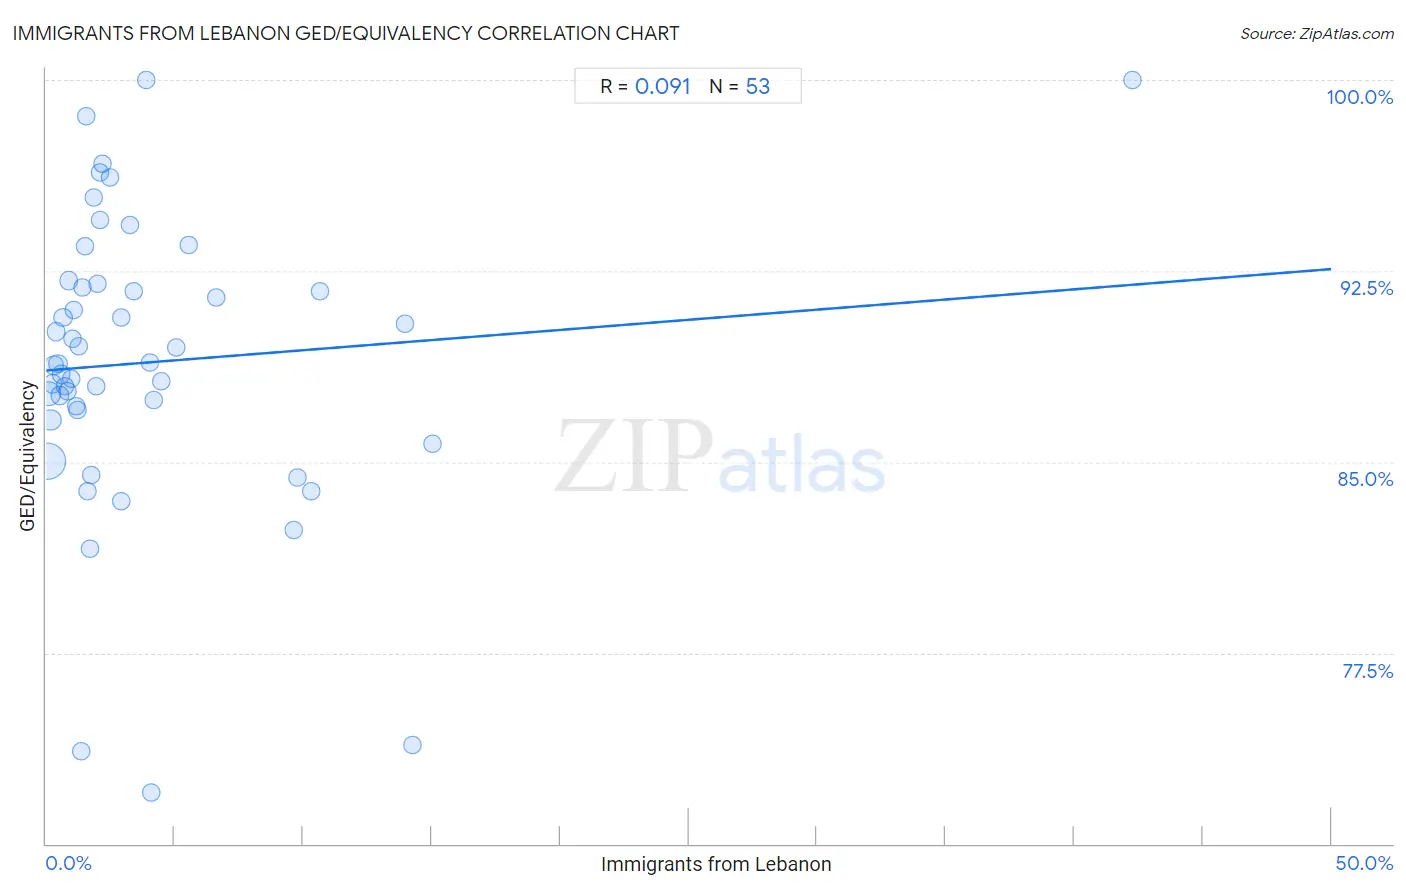
Immigrants from Lebanon GED/Equivalency Correlation Chart

The statistical analysis conducted on geographies consisting of 217,164,247 people shows a slight positive correlation between the proportion of Immigrants from Lebanon and percentage of population with at least ged/equivalency education in the United States with a correlation coefficient (R) of 0.091 and weighted average of 86.8%. On average, for every 1% (one percent) increase in Immigrants from Lebanon within a typical geography, there is an increase of 0.080% in percentage of population with at least ged/equivalency education.
Immigrants from Lebanon GED/Equivalency
It is essential to understand that the correlation between the percentage of Immigrants from Lebanon and percentage of population with at least ged/equivalency education does not imply a direct cause-and-effect relationship. It remains uncertain whether the presence of Immigrants from Lebanon influences an upward or downward trend in the level of percentage of population with at least ged/equivalency education within an area, or if Immigrants from Lebanon simply ended up residing in those areas with higher or lower levels of percentage of population with at least ged/equivalency education due to other factors.

Demographics Similar to Immigrants from Lebanon by GED/Equivalency

In terms of ged/equivalency, the demographic groups most similar to Immigrants from Lebanon are Immigrants from Jordan (86.8%, a difference of 0.0%), Immigrants from Italy (86.7%, a difference of 0.020%), Immigrants from Egypt (86.7%, a difference of 0.030%), Celtic (86.7%, a difference of 0.030%), and Asian (86.7%, a difference of 0.040%).
DemographicsRating | RankGED/Equivalency
Immigrants from Kazakhstan
94.7
/100
|
#114
Exceptional
87.0%
Mongolians
94.6
/100
|
#115
Exceptional
87.0%
Swiss
94.5
/100
|
#116
Exceptional
87.0%
Immigrants from Hong Kong
93.8
/100
|
#117
Exceptional
86.9%
French Canadians
93.2
/100
|
#118
Exceptional
86.9%
Immigrants from China
93.2
/100
|
#119
Exceptional
86.9%
Scotch-Irish
91.6
/100
|
#120
Exceptional
86.8%
Immigrants from Lebanon
90.9
/100
|
#121
Exceptional
86.8%
Immigrants from Jordan
90.8
/100
|
#122
Exceptional
86.8%
Immigrants from Italy
90.5
/100
|
#123
Exceptional
86.7%
Immigrants from Egypt
90.4
/100
|
#124
Exceptional
86.7%
Celtics
90.4
/100
|
#125
Exceptional
86.7%
Asians
90.3
/100
|
#126
Exceptional
86.7%
Argentineans
89.7
/100
|
#127
Excellent
86.7%
Yugoslavians
89.5
/100
|
#128
Excellent
86.7%

Immigrants from Lebanon GED/Equivalency Correlation Summary

MeasurementImmigrants from Lebanon DataGED/Equivalency Data
Minimum0.032%72.0%
Maximum42.3%100.0%
Range42.2%28.0%
Mean4.0%88.9%
Median1.9%88.9%
Interquartile 25% (IQ1)0.91%86.8%
Interquartile 75% (IQ3)4.1%91.9%
Interquartile Range (IQR)3.2%5.1%
Standard Deviation (Sample)6.6%5.8%
Standard Deviation (Population)6.5%5.7%

Correlation Details

Immigrants from Lebanon PercentileSample SizeGED/Equivalency
[
0.0%
-
0.5%
]
0.032%
132,067,72485.0%
[
0.0%
-
0.5%
]
0.096%
44,570,66787.7%
[
0.0%
-
0.5%
]
0.17%
18,030,66886.6%
[
0.0%
-
0.5%
]
0.24%
7,616,30388.0%
[
0.0%
-
0.5%
]
0.31%
4,223,65188.8%
[
0.0%
-
0.5%
]
0.38%
2,710,60890.1%
[
0.0%
-
0.5%
]
0.46%
1,666,42188.9%
[
0.5%
-
1.0%
]
0.53%
1,526,03587.6%
[
0.5%
-
1.0%
]
0.59%
1,237,77088.4%
[
0.5%
-
1.0%
]
0.66%
491,93990.7%
[
0.5%
-
1.0%
]
0.73%
224,37888.0%
[
0.5%
-
1.0%
]
0.82%
343,23087.8%
[
0.5%
-
1.0%
]
0.87%
396,07292.1%
[
0.5%
-
1.0%
]
0.95%
405,26588.3%
[
1.0%
-
1.5%
]
1.00%
135,13589.8%
[
1.0%
-
1.5%
]
1.09%
243,72891.0%
[
1.0%
-
1.5%
]
1.15%
32,92787.2%
[
1.0%
-
1.5%
]
1.23%
210,78187.0%
[
1.0%
-
1.5%
]
1.27%
358,28589.5%
[
1.0%
-
1.5%
]
1.38%
71,97173.6%
[
1.0%
-
1.5%
]
1.43%
29,06591.8%
[
1.0%
-
1.5%
]
1.49%
33,27893.5%
[
1.5%
-
2.0%
]
1.57%
3,45098.6%
[
1.5%
-
2.0%
]
1.63%
6,08383.8%
[
1.5%
-
2.0%
]
1.70%
23,58981.6%
[
1.5%
-
2.0%
]
1.76%
43,41284.5%
[
1.5%
-
2.0%
]
1.87%
20,37195.4%
[
1.5%
-
2.0%
]
1.93%
35,40888.0%
[
1.5%
-
2.0%
]
1.98%
6,26092.0%
[
2.0%
-
2.5%
]
2.09%
24,22996.4%
[
2.0%
-
2.5%
]
2.11%
15,37794.5%
[
2.0%
-
2.5%
]
2.20%
3,54496.7%
[
2.0%
-
2.5%
]
2.46%
28496.2%
[
2.5%
-
3.0%
]
2.93%
20583.4%
[
2.5%
-
3.0%
]
2.94%
22,83190.7%
[
3.0%
-
3.5%
]
3.26%
2,02594.3%
[
3.0%
-
3.5%
]
3.42%
34,04691.7%
[
3.5%
-
4.0%
]
3.89%
411100.0%
[
4.0%
-
4.5%
]
4.04%
9988.9%
[
4.0%
-
4.5%
]
4.08%
8,91972.0%
[
4.0%
-
4.5%
]
4.17%
2,58987.4%
[
4.0%
-
4.5%
]
4.46%
1,50188.2%
[
5.0%
-
5.5%
]
5.04%
1,94589.5%
[
5.5%
-
6.0%
]
5.54%
3,25293.5%
[
6.5%
-
7.0%
]
6.61%
46991.5%
[
9.5%
-
10.0%
]
9.61%
108,41482.3%
[
9.5%
-
10.0%
]
9.79%
42984.4%
[
10.0%
-
10.5%
]
10.31%
62,47483.8%
[
10.5%
-
11.0%
]
10.66%
12,40591.7%
[
13.5%
-
14.0%
]
13.97%
22990.4%
[
14.0%
-
14.5%
]
14.27%
53,04473.9%
[
15.0%
-
15.5%
]
15.03%
40,39285.7%
[
42.0%
-
42.5%
]
42.27%
660100.0%