Immigrants from Lebanon Disability Age 5 to 17

COMPARE

Immigrants from Lebanon
Race
Ancestry
AfghanAfricanAlaska NativeAlaskan AthabascanAlbanianAleutAlsatianAmericanApacheArabArapahoArgentineanArmenianAssyrian/Chaldean/SyriacAustralianAustrianBahamianBangladeshiBarbadianBasqueBelgianBelizeanBermudanBhutaneseBlackfeetBolivianBrazilianBritishBritish West IndianBulgarianBurmeseCajunCambodianCanadianCape VerdeanCarpatho RusynCelticCentral AmericanCentral American IndianCherokeeCheyenneChickasawChileanChineseChippewaChoctawColombianColvilleComancheCosta RicanCreeCreekCroatianCrowCubanCypriotCzechCzechoslovakianDanishDelawareDominicanDutchDutch West IndianEastern EuropeanEcuadorianEgyptianEnglishEstonianEthiopianEuropeanFijianFilipinoFinnishFrenchFrench American IndianFrench CanadianGermanGerman RussianGhanaianGreekGuamanian/ChamorroGuatemalanGuyaneseHaitianHmongHonduranHopiHoumaHungarianIcelanderIndian (Asian)IndonesianInupiatIranianIraqiIrishIroquoisIsraeliItalianJamaicanJapaneseJordanianKenyanKiowaKoreanLaotianLatvianLebaneseLiberianLithuanianLumbeeLuxembourgerMacedonianMalaysianMalteseMarshalleseMenomineeMexicanMexican American IndianMongolianMoroccanNative HawaiianNavajoNepaleseNew ZealanderNicaraguanNigerianNorthern EuropeanNorwegianOkinawanOsageOttawaPaiutePakistaniPalestinianPanamanianParaguayanPennsylvania GermanPeruvianPimaPolishPortuguesePotawatomiPuebloPuerto RicanPuget Sound SalishRomanianRussianSalvadoranSamoanScandinavianScotch-IrishScottishSeminoleSenegaleseSerbianShoshoneSierra LeoneanSiouxSlavicSlovakSloveneSomaliSouth AfricanSouth AmericanSouth American IndianSoviet UnionSpaniardSpanishSpanish AmericanSpanish American IndianSri LankanSubsaharan AfricanSudaneseSwedishSwissSyrianTaiwaneseThaiTlingit-HaidaTohono O'OdhamTonganTrinidadian and TobagonianTsimshianTurkishU.S. Virgin IslanderUgandanUkrainianUruguayanUteVenezuelanVietnameseWelshWest IndianYakamaYaquiYugoslavianYumanYup'ikZimbabwean
Immigration
NonimmigrantsImmigrantsAfghanistanAfricaAlbaniaArgentinaArmeniaAsiaAustraliaAustriaBahamasBangladeshBarbadosBelarusBelgiumBelizeBoliviaBosnia and HerzegovinaBrazilBulgariaBurma/MyanmarCabo VerdeCambodiaCameroonCanadaCaribbeanCentral AmericaChileChinaColombiaCongoCosta RicaCroatiaCubaCzechoslovakiaDenmarkDominicaDominican RepublicEastern AfricaEastern AsiaEastern EuropeEcuadorEgyptEl SalvadorEnglandEritreaEthiopiaEuropeFijiFranceGermanyGhanaGreeceGrenadaGuatemalaGuyanaHaitiHondurasHong KongHungaryIndiaIndonesiaIranIraqIrelandIsraelItalyJamaicaJapanJordanKazakhstanKenyaKoreaKuwaitLaosLatin AmericaLatviaLebanonLiberiaLithuaniaMalaysiaMexicoMicronesiaMiddle AfricaMoldovaMoroccoNepalNetherlandsNicaraguaNigeriaNorth AmericaNorth MacedoniaNorthern AfricaNorthern EuropeNorwayOceaniaPakistanPanamaPeruPhilippinesPolandPortugalRomaniaRussiaSaudi ArabiaScotlandSenegalSerbiaSierra LeoneSingaporeSomaliaSouth AfricaSouth AmericaSouth Central AsiaSouth Eastern AsiaSouthern EuropeSpainSri LankaSt. Vincent and the GrenadinesSudanSwedenSwitzerlandSyriaTaiwanThailandTrinidad and TobagoTurkeyUgandaUkraineUruguayUzbekistanVenezuelaVietnamWest IndiesWestern AfricaWestern AsiaWestern EuropeYemenZaireZimbabweAzores
Select to Compare
Race
Ancestry
AfghanAfricanAlaska NativeAlaskan AthabascanAlbanianAleutAlsatianAmericanApacheArabArapahoArgentineanArmenianAssyrian/Chaldean/SyriacAustralianAustrianBahamianBangladeshiBarbadianBasqueBelgianBelizeanBermudanBhutaneseBlackfeetBolivianBrazilianBritishBritish West IndianBulgarianBurmeseCajunCambodianCanadianCape VerdeanCarpatho RusynCelticCentral AmericanCentral American IndianCherokeeCheyenneChickasawChileanChineseChippewaChoctawColombianColvilleComancheCosta RicanCreeCreekCroatianCrowCubanCypriotCzechCzechoslovakianDanishDelawareDominicanDutchDutch West IndianEastern EuropeanEcuadorianEgyptianEnglishEstonianEthiopianEuropeanFijianFilipinoFinnishFrenchFrench American IndianFrench CanadianGermanGerman RussianGhanaianGreekGuamanian/ChamorroGuatemalanGuyaneseHaitianHmongHonduranHopiHoumaHungarianIcelanderIndian (Asian)IndonesianInupiatIranianIraqiIrishIroquoisIsraeliItalianJamaicanJapaneseJordanianKenyanKiowaKoreanLaotianLatvianLebaneseLiberianLithuanianLumbeeLuxembourgerMacedonianMalaysianMalteseMarshalleseMenomineeMexicanMexican American IndianMongolianMoroccanNative HawaiianNavajoNepaleseNew ZealanderNicaraguanNigerianNorthern EuropeanNorwegianOkinawanOsageOttawaPaiutePakistaniPalestinianPanamanianParaguayanPennsylvania GermanPeruvianPimaPolishPortuguesePotawatomiPuebloPuerto RicanPuget Sound SalishRomanianRussianSalvadoranSamoanScandinavianScotch-IrishScottishSeminoleSenegaleseSerbianShoshoneSierra LeoneanSiouxSlavicSlovakSloveneSomaliSouth AfricanSouth AmericanSouth American IndianSoviet UnionSpaniardSpanishSpanish AmericanSpanish American IndianSri LankanSubsaharan AfricanSudaneseSwedishSwissSyrianTaiwaneseThaiTlingit-HaidaTohono O'OdhamTonganTrinidadian and TobagonianTsimshianTurkishU.S. Virgin IslanderUgandanUkrainianUruguayanUteVenezuelanVietnameseWelshWest IndianYakamaYaquiYugoslavianYumanYup'ikZimbabwean
Immigration
NonimmigrantsImmigrantsAfghanistanAfricaAlbaniaArgentinaArmeniaAsiaAustraliaAustriaBahamasBangladeshBarbadosBelarusBelgiumBelizeBoliviaBosnia and HerzegovinaBrazilBulgariaBurma/MyanmarCabo VerdeCambodiaCameroonCanadaCaribbeanCentral AmericaChileChinaColombiaCongoCosta RicaCroatiaCubaCzechoslovakiaDenmarkDominicaDominican RepublicEastern AfricaEastern AsiaEastern EuropeEcuadorEgyptEl SalvadorEnglandEritreaEthiopiaEuropeFijiFranceGermanyGhanaGreeceGrenadaGuatemalaGuyanaHaitiHondurasHong KongHungaryIndiaIndonesiaIranIraqIrelandIsraelItalyJamaicaJapanJordanKazakhstanKenyaKoreaKuwaitLaosLatin AmericaLatviaLiberiaLithuaniaMalaysiaMexicoMicronesiaMiddle AfricaMoldovaMoroccoNepalNetherlandsNicaraguaNigeriaNorth AmericaNorth MacedoniaNorthern AfricaNorthern EuropeNorwayOceaniaPakistanPanamaPeruPhilippinesPolandPortugalRomaniaRussiaSaudi ArabiaScotlandSenegalSerbiaSierra LeoneSingaporeSomaliaSouth AfricaSouth AmericaSouth Central AsiaSouth Eastern AsiaSouthern EuropeSpainSri LankaSt. Vincent and the GrenadinesSudanSwedenSwitzerlandSyriaTaiwanThailandTrinidad and TobagoTurkeyUgandaUkraineUruguayUzbekistanVenezuelaVietnamWest IndiesWestern AfricaWestern AsiaWestern EuropeYemenZaireZimbabweAzores
Disability Age 5 to 17
Income
Poverty
Unemployment
Labor Participation
Family Structure
Vehicle Availability
Education Level
Disability

Immigrants from Lebanon Disability Age 5 to 17
Exceptional

4.8%
DISABILITY | AGE 5 TO 17
100.0/ 100
METRIC RATING
24th/ 347
METRIC RANK

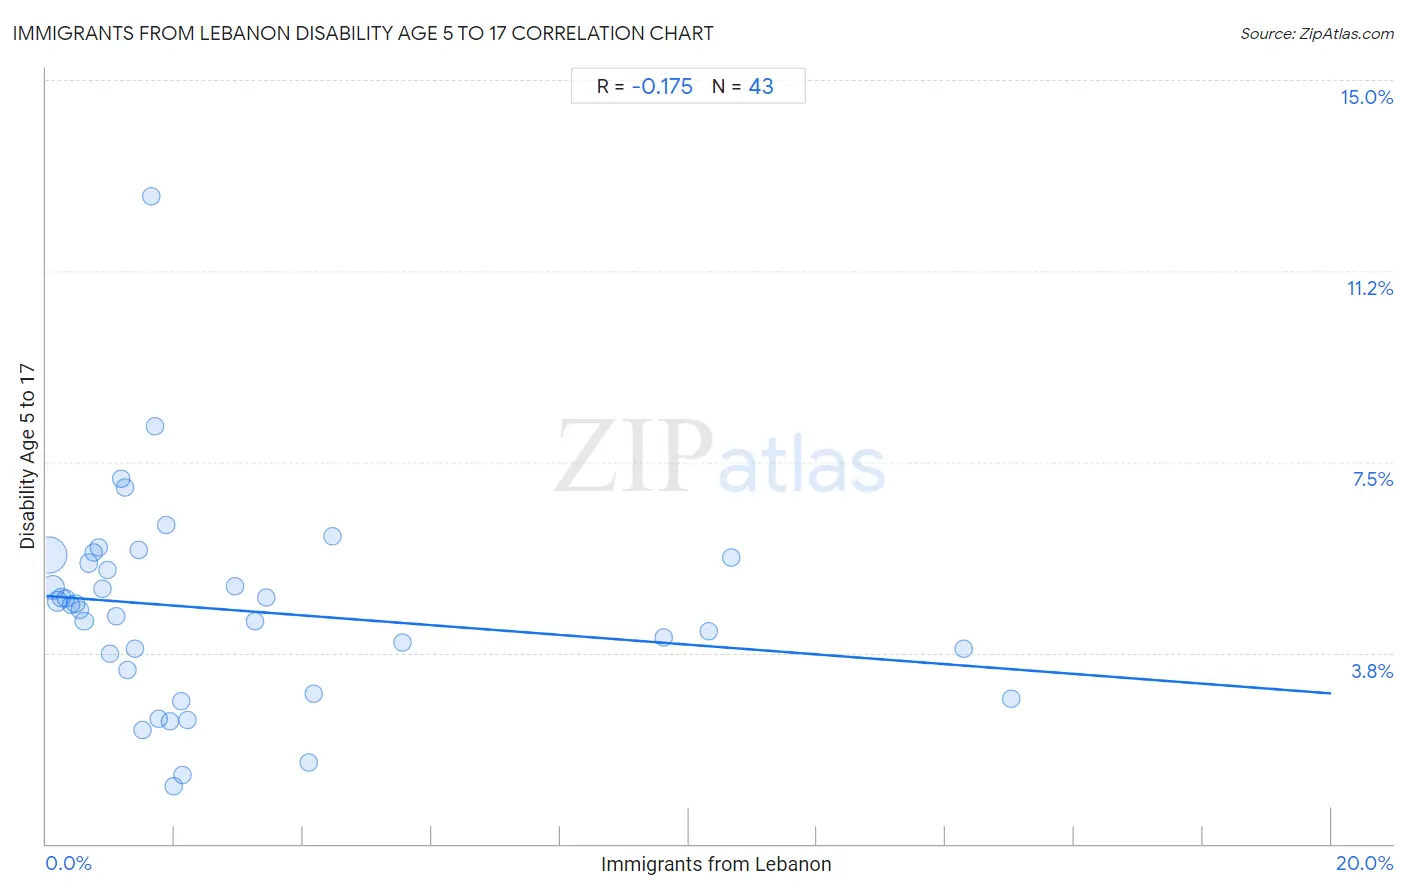
Immigrants from Lebanon Disability Age 5 to 17 Correlation Chart

The statistical analysis conducted on geographies consisting of 216,408,470 people shows a poor negative correlation between the proportion of Immigrants from Lebanon and percentage of population with a disability between the ages 5 and 17 in the United States with a correlation coefficient (R) of -0.175 and weighted average of 4.8%. On average, for every 1% (one percent) increase in Immigrants from Lebanon within a typical geography, there is a decrease of 0.096% in percentage of population with a disability between the ages 5 and 17.
Immigrants from Lebanon Disability Age 5 to 17
It is essential to understand that the correlation between the percentage of Immigrants from Lebanon and percentage of population with a disability between the ages 5 and 17 does not imply a direct cause-and-effect relationship. It remains uncertain whether the presence of Immigrants from Lebanon influences an upward or downward trend in the level of percentage of population with a disability between the ages 5 and 17 within an area, or if Immigrants from Lebanon simply ended up residing in those areas with higher or lower levels of percentage of population with a disability between the ages 5 and 17 due to other factors.

Demographics Similar to Immigrants from Lebanon by Disability Age 5 to 17

In terms of disability age 5 to 17, the demographic groups most similar to Immigrants from Lebanon are Immigrants from Asia (4.8%, a difference of 0.11%), Immigrants from Bolivia (4.8%, a difference of 0.15%), Asian (4.8%, a difference of 0.81%), Bhutanese (4.9%, a difference of 0.98%), and Yup'ik (4.8%, a difference of 1.1%).
DemographicsRating | RankDisability Age 5 to 17
Arapaho
100.0
/100
|
#17
Exceptional
4.7%
Immigrants from South Central Asia
100.0
/100
|
#18
Exceptional
4.7%
Immigrants from Uzbekistan
100.0
/100
|
#19
Exceptional
4.8%
Burmese
100.0
/100
|
#20
Exceptional
4.8%
Yup'ik
100.0
/100
|
#21
Exceptional
4.8%
Asians
100.0
/100
|
#22
Exceptional
4.8%
Immigrants from Bolivia
100.0
/100
|
#23
Exceptional
4.8%
Immigrants from Lebanon
100.0
/100
|
#24
Exceptional
4.8%
Immigrants from Asia
100.0
/100
|
#25
Exceptional
4.8%
Bhutanese
100.0
/100
|
#26
Exceptional
4.9%
Taiwanese
100.0
/100
|
#27
Exceptional
4.9%
Immigrants from Japan
100.0
/100
|
#28
Exceptional
4.9%
Immigrants from Serbia
100.0
/100
|
#29
Exceptional
4.9%
Immigrants from Malaysia
100.0
/100
|
#30
Exceptional
5.0%
Immigrants from Pakistan
100.0
/100
|
#31
Exceptional
5.0%

Immigrants from Lebanon Disability Age 5 to 17 Correlation Summary

MeasurementImmigrants from Lebanon DataDisability Age 5 to 17 Data
Minimum0.032%1.1%
Maximum15.0%12.7%
Range15.0%11.6%
Mean2.8%4.6%
Median1.5%4.7%
Interquartile 25% (IQ1)0.73%3.4%
Interquartile 75% (IQ3)3.3%5.6%
Interquartile Range (IQR)2.5%2.2%
Standard Deviation (Sample)3.7%2.0%
Standard Deviation (Population)3.6%2.0%

Correlation Details

Immigrants from Lebanon PercentileSample SizeDisability Age 5 to 17
[
0.0%
-
0.5%
]
0.032%
131,971,2145.7%
[
0.0%
-
0.5%
]
0.096%
44,429,7635.0%
[
0.0%
-
0.5%
]
0.17%
17,851,0224.8%
[
0.0%
-
0.5%
]
0.24%
7,554,1484.8%
[
0.0%
-
0.5%
]
0.31%
4,162,6814.8%
[
0.0%
-
0.5%
]
0.38%
2,659,3184.7%
[
0.0%
-
0.5%
]
0.46%
1,632,9014.7%
[
0.5%
-
1.0%
]
0.53%
1,510,5354.6%
[
0.5%
-
1.0%
]
0.59%
1,219,1154.4%
[
0.5%
-
1.0%
]
0.65%
475,0375.5%
[
0.5%
-
1.0%
]
0.73%
209,4645.7%
[
0.5%
-
1.0%
]
0.82%
343,2305.8%
[
0.5%
-
1.0%
]
0.87%
396,0725.0%
[
0.5%
-
1.0%
]
0.95%
392,5735.4%
[
1.0%
-
1.5%
]
1.00%
131,8993.7%
[
1.0%
-
1.5%
]
1.09%
237,1034.5%
[
1.0%
-
1.5%
]
1.16%
19,9427.2%
[
1.0%
-
1.5%
]
1.23%
210,3787.0%
[
1.0%
-
1.5%
]
1.27%
343,5483.4%
[
1.0%
-
1.5%
]
1.38%
70,8893.8%
[
1.0%
-
1.5%
]
1.43%
26,5365.8%
[
1.0%
-
1.5%
]
1.49%
33,2782.2%
[
1.5%
-
2.0%
]
1.63%
6,08312.7%
[
1.5%
-
2.0%
]
1.70%
23,5898.2%
[
1.5%
-
2.0%
]
1.76%
43,4122.5%
[
1.5%
-
2.0%
]
1.87%
20,3716.3%
[
1.5%
-
2.0%
]
1.93%
35,4082.4%
[
1.5%
-
2.0%
]
1.98%
4,9601.1%
[
2.0%
-
2.5%
]
2.09%
24,2292.8%
[
2.0%
-
2.5%
]
2.11%
15,3771.4%
[
2.0%
-
2.5%
]
2.20%
3,5442.4%
[
2.5%
-
3.0%
]
2.94%
22,8315.1%
[
3.0%
-
3.5%
]
3.25%
9844.4%
[
3.0%
-
3.5%
]
3.42%
34,0464.8%
[
4.0%
-
4.5%
]
4.08%
8,9191.6%
[
4.0%
-
4.5%
]
4.17%
2,5893.0%
[
4.0%
-
4.5%
]
4.46%
1,5016.0%
[
5.5%
-
6.0%
]
5.54%
3,2524.0%
[
9.5%
-
10.0%
]
9.61%
108,4144.1%
[
10.0%
-
10.5%
]
10.31%
62,4744.2%
[
10.5%
-
11.0%
]
10.66%
12,4055.6%
[
14.0%
-
14.5%
]
14.27%
53,0443.8%
[
15.0%
-
15.5%
]
15.03%
40,3922.9%