Immigrants from Iran vs Colombian 3 or more Vehicles in Household
COMPARE
Immigrants from Iran
Colombian
3 or more Vehicles in Household
3 or more Vehicles in Household Comparison
Immigrants from Iran
Colombians
20.0%
3 OR MORE VEHICLES IN HOUSEHOLD
80.9/ 100
METRIC RATING
149th/ 347
METRIC RANK
17.8%
3 OR MORE VEHICLES IN HOUSEHOLD
0.9/ 100
METRIC RATING
262nd/ 347
METRIC RANK
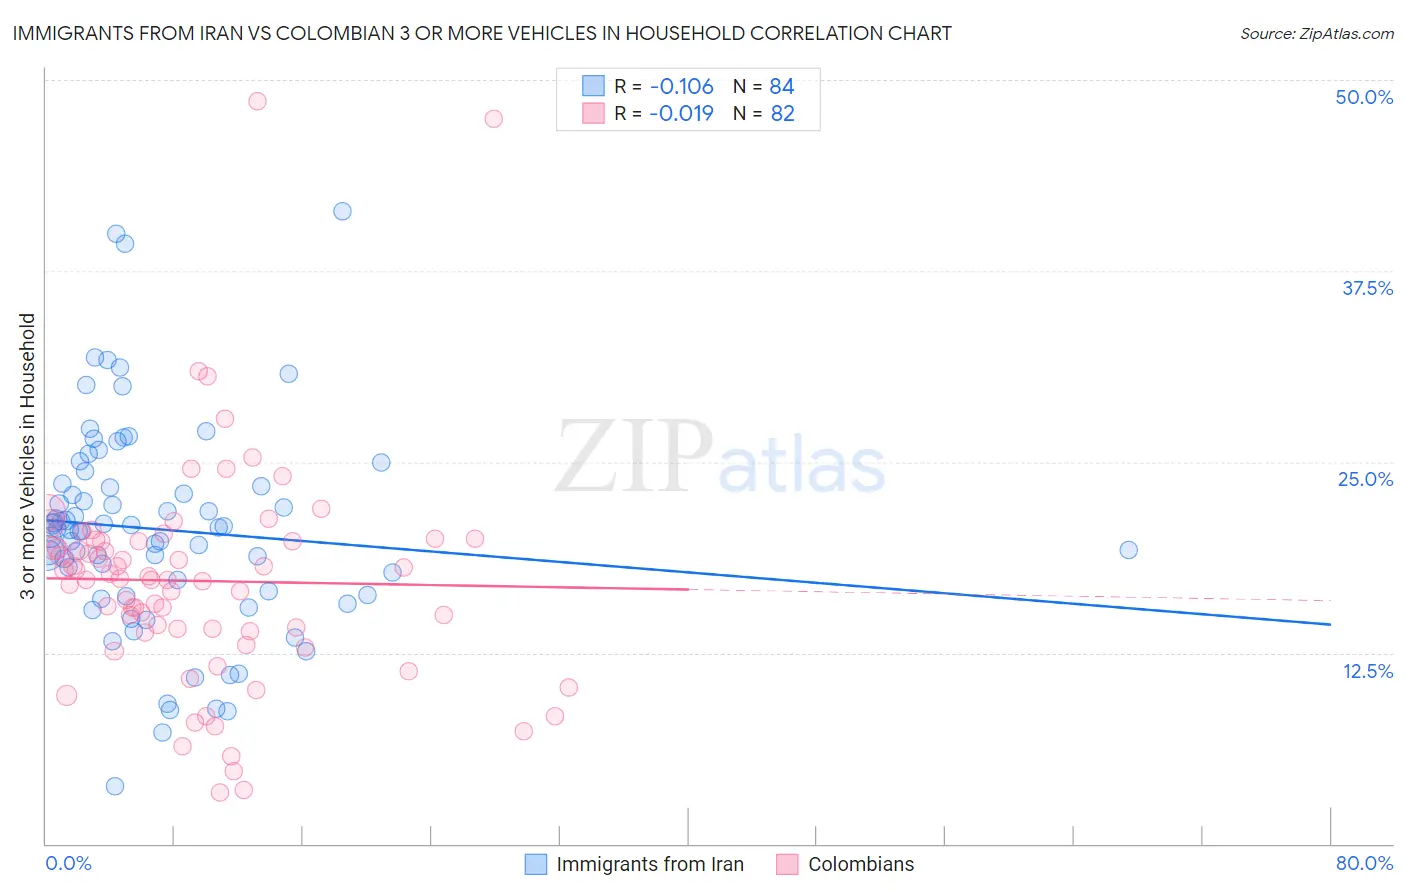
Immigrants from Iran vs Colombian 3 or more Vehicles in Household Correlation Chart
The statistical analysis conducted on geographies consisting of 279,780,113 people shows a poor negative correlation between the proportion of Immigrants from Iran and percentage of households with 3 or more vehicles available in the United States with a correlation coefficient (R) of -0.106 and weighted average of 20.0%. Similarly, the statistical analysis conducted on geographies consisting of 419,151,305 people shows no correlation between the proportion of Colombians and percentage of households with 3 or more vehicles available in the United States with a correlation coefficient (R) of -0.019 and weighted average of 17.8%, a difference of 12.7%.
3 or more Vehicles in Household Correlation Summary
| Measurement | Immigrants from Iran | Colombian |
| Minimum | 3.8% | 3.4% |
| Maximum | 41.4% | 48.6% |
| Range | 37.6% | 45.2% |
| Mean | 20.6% | 17.2% |
| Median | 20.6% | 17.3% |
| Interquartile 25% (IQ1) | 16.4% | 13.9% |
| Interquartile 75% (IQ3) | 23.5% | 19.8% |
| Interquartile Range (IQR) | 7.1% | 5.9% |
| Standard Deviation (Sample) | 6.9% | 7.4% |
| Standard Deviation (Population) | 6.9% | 7.3% |
Similar Demographics by 3 or more Vehicles in Household
Demographics Similar to Immigrants from Iran by 3 or more Vehicles in Household
In terms of 3 or more vehicles in household, the demographic groups most similar to Immigrants from Iran are Immigrants (20.0%, a difference of 0.020%), Taiwanese (20.0%, a difference of 0.030%), Lebanese (20.0%, a difference of 0.13%), Guatemalan (20.1%, a difference of 0.20%), and Slovak (20.1%, a difference of 0.26%).
| Demographics | Rating | Rank | 3 or more Vehicles in Household |
| Jordanians | 84.4 /100 | #142 | Excellent 20.1% |
| Lithuanians | 84.4 /100 | #143 | Excellent 20.1% |
| Iranians | 84.0 /100 | #144 | Excellent 20.1% |
| Palestinians | 83.9 /100 | #145 | Excellent 20.1% |
| Australians | 83.6 /100 | #146 | Excellent 20.1% |
| Slovaks | 83.0 /100 | #147 | Excellent 20.1% |
| Guatemalans | 82.6 /100 | #148 | Excellent 20.1% |
| Immigrants | Iran | 80.9 /100 | #149 | Excellent 20.0% |
| Immigrants | Immigrants | 80.8 /100 | #150 | Excellent 20.0% |
| Taiwanese | 80.6 /100 | #151 | Excellent 20.0% |
| Lebanese | 79.8 /100 | #152 | Good 20.0% |
| Yuman | 75.6 /100 | #153 | Good 19.9% |
| Immigrants | Jordan | 75.0 /100 | #154 | Good 19.9% |
| Tlingit-Haida | 73.4 /100 | #155 | Good 19.9% |
| Thais | 71.1 /100 | #156 | Good 19.8% |
Demographics Similar to Colombians by 3 or more Vehicles in Household
In terms of 3 or more vehicles in household, the demographic groups most similar to Colombians are Immigrants from Northern Africa (17.8%, a difference of 0.030%), Ugandan (17.8%, a difference of 0.050%), Bermudan (17.8%, a difference of 0.11%), Cambodian (17.8%, a difference of 0.14%), and Uruguayan (17.8%, a difference of 0.18%).
| Demographics | Rating | Rank | 3 or more Vehicles in Household |
| Immigrants | Turkey | 1.2 /100 | #255 | Tragic 17.9% |
| Sub-Saharan Africans | 1.1 /100 | #256 | Tragic 17.9% |
| Immigrants | Eritrea | 1.1 /100 | #257 | Tragic 17.8% |
| Sudanese | 1.1 /100 | #258 | Tragic 17.8% |
| Uruguayans | 1.0 /100 | #259 | Tragic 17.8% |
| Ugandans | 0.9 /100 | #260 | Tragic 17.8% |
| Immigrants | Northern Africa | 0.9 /100 | #261 | Tragic 17.8% |
| Colombians | 0.9 /100 | #262 | Tragic 17.8% |
| Bermudans | 0.9 /100 | #263 | Tragic 17.8% |
| Cambodians | 0.9 /100 | #264 | Tragic 17.8% |
| Immigrants | Panama | 0.8 /100 | #265 | Tragic 17.7% |
| Macedonians | 0.8 /100 | #266 | Tragic 17.7% |
| Immigrants | Venezuela | 0.8 /100 | #267 | Tragic 17.7% |
| Immigrants | Bulgaria | 0.8 /100 | #268 | Tragic 17.7% |
| Immigrants | France | 0.6 /100 | #269 | Tragic 17.6% |