Immigrants from Iran vs Immigrants from Eastern Asia 3 or more Vehicles in Household

COMPARE

Immigrants from Iran
Race
Ancestry
AfghanAfricanAlaska NativeAlaskan AthabascanAlbanianAleutAlsatianAmericanApacheArabArapahoArgentineanArmenianAssyrian/Chaldean/SyriacAustralianAustrianBahamianBangladeshiBarbadianBasqueBelgianBelizeanBermudanBhutaneseBlackfeetBolivianBrazilianBritishBritish West IndianBulgarianBurmeseCajunCambodianCanadianCape VerdeanCarpatho RusynCelticCentral AmericanCentral American IndianCherokeeCheyenneChickasawChileanChineseChippewaChoctawColombianColvilleComancheCosta RicanCreeCreekCroatianCrowCubanCypriotCzechCzechoslovakianDanishDelawareDominicanDutchDutch West IndianEastern EuropeanEcuadorianEgyptianEnglishEstonianEthiopianEuropeanFijianFilipinoFinnishFrenchFrench American IndianFrench CanadianGermanGerman RussianGhanaianGreekGuamanian/ChamorroGuatemalanGuyaneseHaitianHmongHonduranHopiHoumaHungarianIcelanderIndian (Asian)IndonesianInupiatIranianIraqiIrishIroquoisIsraeliItalianJamaicanJapaneseJordanianKenyanKiowaKoreanLaotianLatvianLebaneseLiberianLithuanianLumbeeLuxembourgerMacedonianMalaysianMalteseMarshalleseMenomineeMexicanMexican American IndianMongolianMoroccanNative HawaiianNavajoNepaleseNew ZealanderNicaraguanNigerianNorthern EuropeanNorwegianOkinawanOsageOttawaPaiutePakistaniPalestinianPanamanianParaguayanPennsylvania GermanPeruvianPimaPolishPortuguesePotawatomiPuebloPuerto RicanPuget Sound SalishRomanianRussianSalvadoranSamoanScandinavianScotch-IrishScottishSeminoleSenegaleseSerbianShoshoneSierra LeoneanSiouxSlavicSlovakSloveneSomaliSouth AfricanSouth AmericanSouth American IndianSoviet UnionSpaniardSpanishSpanish AmericanSpanish American IndianSri LankanSubsaharan AfricanSudaneseSwedishSwissSyrianTaiwaneseThaiTlingit-HaidaTohono O'OdhamTonganTrinidadian and TobagonianTsimshianTurkishU.S. Virgin IslanderUgandanUkrainianUruguayanUteVenezuelanVietnameseWelshWest IndianYakamaYaquiYugoslavianYumanYup'ikZimbabwean
Immigration
NonimmigrantsImmigrantsAfghanistanAfricaAlbaniaArgentinaArmeniaAsiaAustraliaAustriaBahamasBangladeshBarbadosBelarusBelgiumBelizeBoliviaBosnia and HerzegovinaBrazilBulgariaBurma/MyanmarCabo VerdeCambodiaCameroonCanadaCaribbeanCentral AmericaChileChinaColombiaCongoCosta RicaCroatiaCubaCzechoslovakiaDenmarkDominicaDominican RepublicEastern AfricaEastern EuropeEcuadorEgyptEl SalvadorEnglandEritreaEthiopiaEuropeFijiFranceGermanyGhanaGreeceGrenadaGuatemalaGuyanaHaitiHondurasHong KongHungaryIndiaIndonesiaIranIraqIrelandIsraelItalyJamaicaJapanJordanKazakhstanKenyaKoreaKuwaitLaosLatin AmericaLatviaLebanonLiberiaLithuaniaMalaysiaMexicoMicronesiaMiddle AfricaMoldovaMoroccoNepalNetherlandsNicaraguaNigeriaNorth AmericaNorth MacedoniaNorthern AfricaNorthern EuropeNorwayOceaniaPakistanPanamaPeruPhilippinesPolandPortugalRomaniaRussiaSaudi ArabiaScotlandSenegalSerbiaSierra LeoneSingaporeSomaliaSouth AfricaSouth AmericaSouth Central AsiaSouth Eastern AsiaSouthern EuropeSpainSri LankaSt. Vincent and the GrenadinesSudanSwedenSwitzerlandSyriaTaiwanThailandTrinidad and TobagoTurkeyUgandaUkraineUruguayUzbekistanVenezuelaVietnamWest IndiesWestern AfricaWestern AsiaWestern EuropeYemenZaireZimbabweAzores
Immigrants from Eastern Asia
Race
Ancestry
AfghanAfricanAlaska NativeAlaskan AthabascanAlbanianAleutAlsatianAmericanApacheArabArapahoArgentineanArmenianAssyrian/Chaldean/SyriacAustralianAustrianBahamianBangladeshiBarbadianBasqueBelgianBelizeanBermudanBhutaneseBlackfeetBolivianBrazilianBritishBritish West IndianBulgarianBurmeseCajunCambodianCanadianCape VerdeanCarpatho RusynCelticCentral AmericanCentral American IndianCherokeeCheyenneChickasawChileanChineseChippewaChoctawColombianColvilleComancheCosta RicanCreeCreekCroatianCrowCubanCypriotCzechCzechoslovakianDanishDelawareDominicanDutchDutch West IndianEastern EuropeanEcuadorianEgyptianEnglishEstonianEthiopianEuropeanFijianFilipinoFinnishFrenchFrench American IndianFrench CanadianGermanGerman RussianGhanaianGreekGuamanian/ChamorroGuatemalanGuyaneseHaitianHmongHonduranHopiHoumaHungarianIcelanderIndian (Asian)IndonesianInupiatIranianIraqiIrishIroquoisIsraeliItalianJamaicanJapaneseJordanianKenyanKiowaKoreanLaotianLatvianLebaneseLiberianLithuanianLumbeeLuxembourgerMacedonianMalaysianMalteseMarshalleseMenomineeMexicanMexican American IndianMongolianMoroccanNative HawaiianNavajoNepaleseNew ZealanderNicaraguanNigerianNorthern EuropeanNorwegianOkinawanOsageOttawaPaiutePakistaniPalestinianPanamanianParaguayanPennsylvania GermanPeruvianPimaPolishPortuguesePotawatomiPuebloPuerto RicanPuget Sound SalishRomanianRussianSalvadoranSamoanScandinavianScotch-IrishScottishSeminoleSenegaleseSerbianShoshoneSierra LeoneanSiouxSlavicSlovakSloveneSomaliSouth AfricanSouth AmericanSouth American IndianSoviet UnionSpaniardSpanishSpanish AmericanSpanish American IndianSri LankanSubsaharan AfricanSudaneseSwedishSwissSyrianTaiwaneseThaiTlingit-HaidaTohono O'OdhamTonganTrinidadian and TobagonianTsimshianTurkishU.S. Virgin IslanderUgandanUkrainianUruguayanUteVenezuelanVietnameseWelshWest IndianYakamaYaquiYugoslavianYumanYup'ikZimbabwean
Immigration
NonimmigrantsImmigrantsAfghanistanAfricaAlbaniaArgentinaArmeniaAsiaAustraliaAustriaBahamasBangladeshBarbadosBelarusBelgiumBelizeBoliviaBosnia and HerzegovinaBrazilBulgariaBurma/MyanmarCabo VerdeCambodiaCameroonCanadaCaribbeanCentral AmericaChileChinaColombiaCongoCosta RicaCroatiaCubaCzechoslovakiaDenmarkDominicaDominican RepublicEastern AfricaEastern AsiaEastern EuropeEcuadorEgyptEl SalvadorEnglandEritreaEthiopiaEuropeFijiFranceGermanyGhanaGreeceGrenadaGuatemalaGuyanaHaitiHondurasHong KongHungaryIndiaIndonesiaIraqIrelandIsraelItalyJamaicaJapanJordanKazakhstanKenyaKoreaKuwaitLaosLatin AmericaLatviaLebanonLiberiaLithuaniaMalaysiaMexicoMicronesiaMiddle AfricaMoldovaMoroccoNepalNetherlandsNicaraguaNigeriaNorth AmericaNorth MacedoniaNorthern AfricaNorthern EuropeNorwayOceaniaPakistanPanamaPeruPhilippinesPolandPortugalRomaniaRussiaSaudi ArabiaScotlandSenegalSerbiaSierra LeoneSingaporeSomaliaSouth AfricaSouth AmericaSouth Central AsiaSouth Eastern AsiaSouthern EuropeSpainSri LankaSt. Vincent and the GrenadinesSudanSwedenSwitzerlandSyriaTaiwanThailandTrinidad and TobagoTurkeyUgandaUkraineUruguayUzbekistanVenezuelaVietnamWest IndiesWestern AfricaWestern AsiaWestern EuropeYemenZaireZimbabweAzores
3 or more Vehicles in Household
Income
Poverty
Unemployment
Labor Participation
Family Structure
Vehicle Availability
Education Level
Disability

3 or more Vehicles in Household Comparison

Immigrants from Iran

Immigrants from Eastern Asia

Excellent
Poor
20.0%
3 OR MORE VEHICLES IN HOUSEHOLD
80.9/ 100
METRIC RATING
149th/ 347
METRIC RANK
18.8%
3 OR MORE VEHICLES IN HOUSEHOLD
14.1/ 100
METRIC RATING
206th/ 347
METRIC RANK

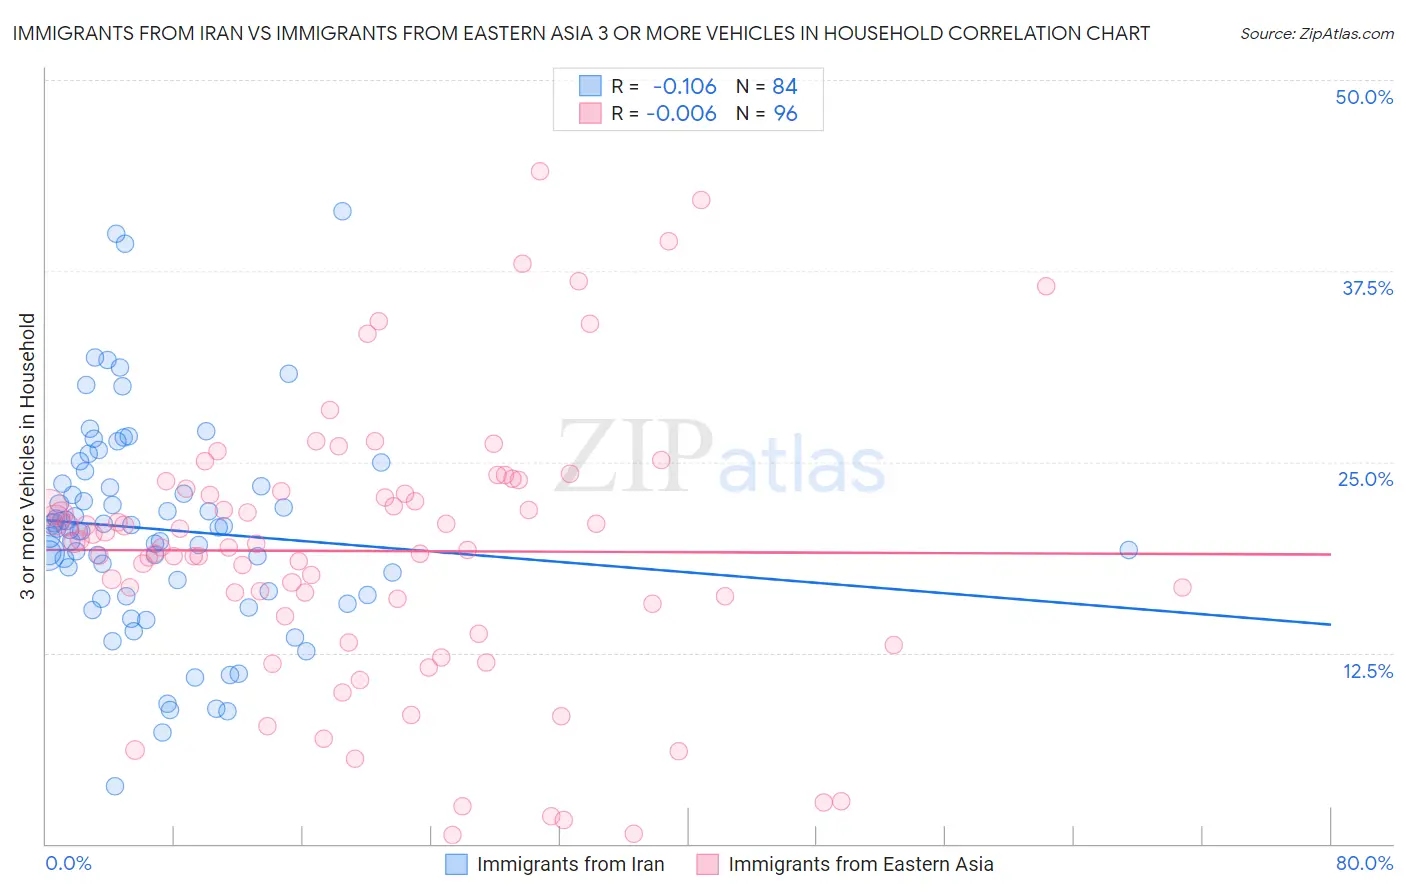
Immigrants from Iran vs Immigrants from Eastern Asia 3 or more Vehicles in Household Correlation Chart

The statistical analysis conducted on geographies consisting of 279,780,113 people shows a poor negative correlation between the proportion of Immigrants from Iran and percentage of households with 3 or more vehicles available in the United States with a correlation coefficient (R) of -0.106 and weighted average of 20.0%. Similarly, the statistical analysis conducted on geographies consisting of 499,168,797 people shows no correlation between the proportion of Immigrants from Eastern Asia and percentage of households with 3 or more vehicles available in the United States with a correlation coefficient (R) of -0.006 and weighted average of 18.8%, a difference of 6.4%.
Immigrants from Iran vs Immigrants from Eastern Asia 3 or more Vehicles in Household

3 or more Vehicles in Household Correlation Summary

MeasurementImmigrants from IranImmigrants from Eastern Asia
Minimum3.8%0.54%
Maximum41.4%44.0%
Range37.6%43.5%
Mean20.6%19.2%
Median20.6%19.5%
Interquartile 25% (IQ1)16.4%15.3%
Interquartile 75% (IQ3)23.5%23.2%
Interquartile Range (IQR)7.1%7.9%
Standard Deviation (Sample)6.9%8.9%
Standard Deviation (Population)6.9%8.9%

Similar Demographics by 3 or more Vehicles in Household

Demographics Similar to Immigrants from Iran by 3 or more Vehicles in Household

In terms of 3 or more vehicles in household, the demographic groups most similar to Immigrants from Iran are Immigrants (20.0%, a difference of 0.020%), Taiwanese (20.0%, a difference of 0.030%), Lebanese (20.0%, a difference of 0.13%), Guatemalan (20.1%, a difference of 0.20%), and Slovak (20.1%, a difference of 0.26%).
DemographicsRating | Rank3 or more Vehicles in Household
Jordanians
84.4
/100
|
#142
Excellent
20.1%
Lithuanians
84.4
/100
|
#143
Excellent
20.1%
Iranians
84.0
/100
|
#144
Excellent
20.1%
Palestinians
83.9
/100
|
#145
Excellent
20.1%
Australians
83.6
/100
|
#146
Excellent
20.1%
Slovaks
83.0
/100
|
#147
Excellent
20.1%
Guatemalans
82.6
/100
|
#148
Excellent
20.1%
Immigrants | Iran
80.9
/100
|
#149
Excellent
20.0%
Immigrants | Immigrants
80.8
/100
|
#150
Excellent
20.0%
Taiwanese
80.6
/100
|
#151
Excellent
20.0%
Lebanese
79.8
/100
|
#152
Good
20.0%
Yuman
75.6
/100
|
#153
Good
19.9%
Immigrants | Jordan
75.0
/100
|
#154
Good
19.9%
Tlingit-Haida
73.4
/100
|
#155
Good
19.9%
Thais
71.1
/100
|
#156
Good
19.8%

Demographics Similar to Immigrants from Eastern Asia by 3 or more Vehicles in Household

In terms of 3 or more vehicles in household, the demographic groups most similar to Immigrants from Eastern Asia are Russian (18.8%, a difference of 0.010%), Immigrants from Romania (18.9%, a difference of 0.080%), Immigrants from Chile (18.8%, a difference of 0.080%), Immigrants from Burma/Myanmar (18.8%, a difference of 0.090%), and Immigrants from Egypt (18.8%, a difference of 0.10%).
DemographicsRating | Rank3 or more Vehicles in Household
Immigrants | Norway
19.0
/100
|
#199
Poor
19.0%
Argentineans
18.2
/100
|
#200
Poor
18.9%
Arabs
17.7
/100
|
#201
Poor
18.9%
Immigrants | Austria
15.4
/100
|
#202
Poor
18.9%
Tohono O'odham
14.8
/100
|
#203
Poor
18.9%
Immigrants | Romania
14.6
/100
|
#204
Poor
18.9%
Russians
14.2
/100
|
#205
Poor
18.8%
Immigrants | Eastern Asia
14.1
/100
|
#206
Poor
18.8%
Immigrants | Chile
13.6
/100
|
#207
Poor
18.8%
Immigrants | Burma/Myanmar
13.6
/100
|
#208
Poor
18.8%
Immigrants | Egypt
13.5
/100
|
#209
Poor
18.8%
Bulgarians
13.1
/100
|
#210
Poor
18.8%
Immigrants | Kenya
12.4
/100
|
#211
Poor
18.8%
Panamanians
11.6
/100
|
#212
Poor
18.8%
Immigrants | Cuba
11.6
/100
|
#213
Poor
18.8%