Immigrants from Iran 2 or more Vehicles in Household
COMPARE
Immigrants from Iran
Select to Compare
2 or more Vehicles in Household
Immigrants from Iran 2 or more Vehicles in Household
57.9%
2+ VEHICLES AVAILABLE
99.1/ 100
METRIC RATING
88th/ 347
METRIC RANK
Immigrants from Iran 2 or more Vehicles in Household Correlation Chart
The statistical analysis conducted on geographies consisting of 279,850,243 people shows a mild negative correlation between the proportion of Immigrants from Iran and percentage of households with 2 or more vehicles available in the United States with a correlation coefficient (R) of -0.344 and weighted average of 57.9%. On average, for every 1% (one percent) increase in Immigrants from Iran within a typical geography, there is a decrease of 0.48% in percentage of households with 2 or more vehicles available.
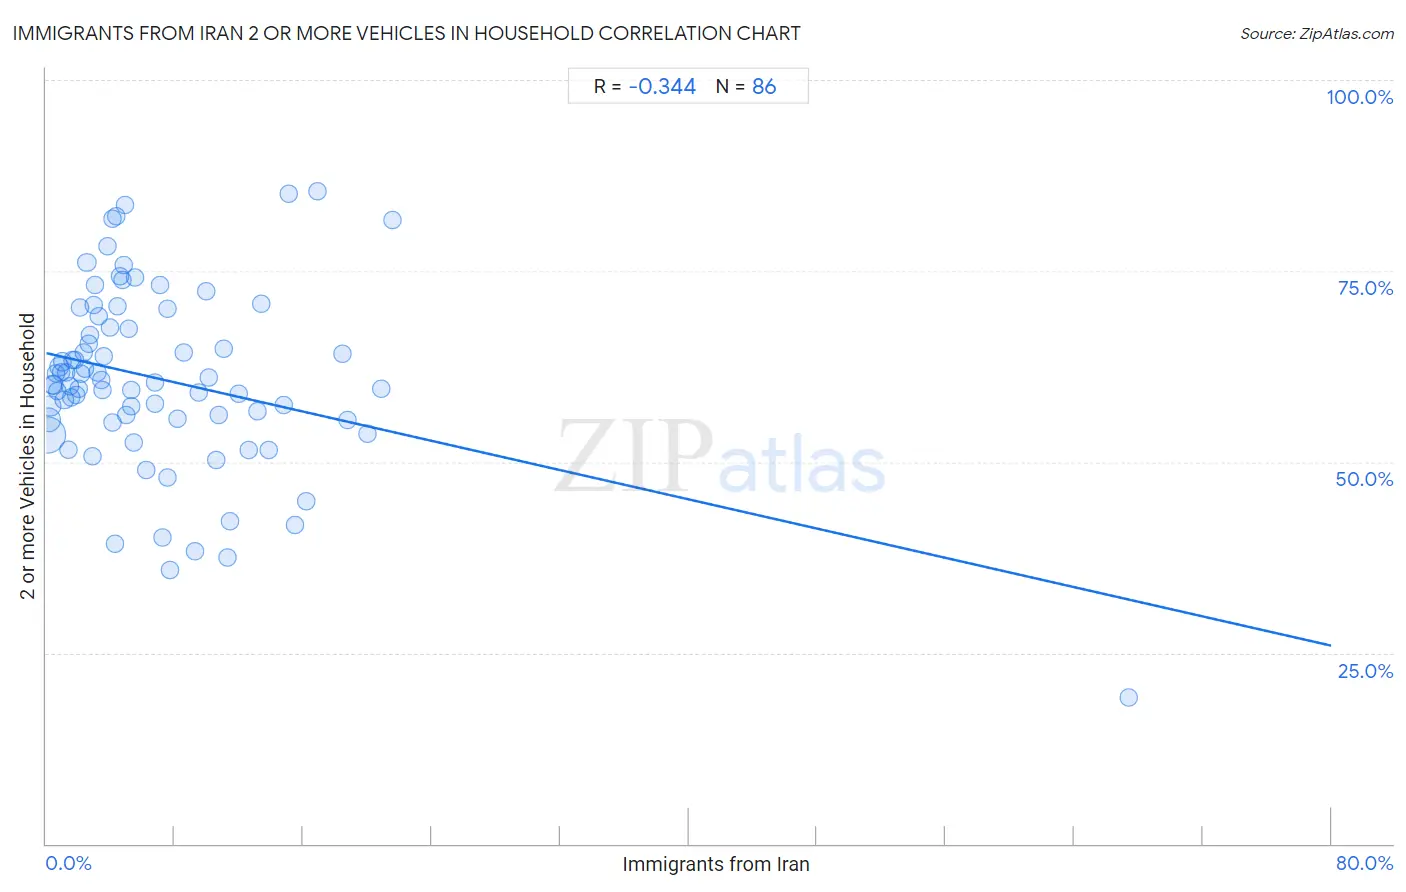
It is essential to understand that the correlation between the percentage of Immigrants from Iran and percentage of households with 2 or more vehicles available does not imply a direct cause-and-effect relationship. It remains uncertain whether the presence of Immigrants from Iran influences an upward or downward trend in the level of percentage of households with 2 or more vehicles available within an area, or if Immigrants from Iran simply ended up residing in those areas with higher or lower levels of percentage of households with 2 or more vehicles available due to other factors.
Demographics Similar to Immigrants from Iran by 2 or more Vehicles in Household
In terms of 2 or more vehicles in household, the demographic groups most similar to Immigrants from Iran are Thai (57.9%, a difference of 0.010%), Potawatomi (58.0%, a difference of 0.050%), Immigrants from Germany (57.9%, a difference of 0.070%), Hispanic or Latino (57.9%, a difference of 0.070%), and Slovak (58.0%, a difference of 0.080%).
| Demographics | Rating | Rank | 2 or more Vehicles in Household |
| Immigrants from Iraq | 99.3 /100 | #81 | Exceptional 58.1% |
| Iranians | 99.3 /100 | #82 | Exceptional 58.1% |
| Icelanders | 99.2 /100 | #83 | Exceptional 58.0% |
| Maltese | 99.2 /100 | #84 | Exceptional 58.0% |
| Slovaks | 99.2 /100 | #85 | Exceptional 58.0% |
| Potawatomi | 99.1 /100 | #86 | Exceptional 58.0% |
| Thais | 99.1 /100 | #87 | Exceptional 57.9% |
| Immigrants from Iran | 99.1 /100 | #88 | Exceptional 57.9% |
| Immigrants from Germany | 99.0 /100 | #89 | Exceptional 57.9% |
| Hispanics or Latinos | 99.0 /100 | #90 | Exceptional 57.9% |
| Pakistanis | 99.0 /100 | #91 | Exceptional 57.9% |
| Shoshone | 99.0 /100 | #92 | Exceptional 57.9% |
| Ottawa | 99.0 /100 | #93 | Exceptional 57.9% |
| Filipinos | 98.9 /100 | #94 | Exceptional 57.8% |
| Hmong | 98.9 /100 | #95 | Exceptional 57.8% |
Immigrants from Iran 2 or more Vehicles in Household Correlation Summary
| Measurement | Immigrants from Iran Data | 2 or more Vehicles in Household Data |
| Minimum | 0.052% | 19.2% |
| Maximum | 67.4% | 85.4% |
| Range | 67.3% | 66.2% |
| Mean | 7.2% | 60.8% |
| Median | 4.8% | 60.2% |
| Interquartile 25% (IQ1) | 2.3% | 55.5% |
| Interquartile 75% (IQ3) | 10.1% | 67.5% |
| Interquartile Range (IQR) | 7.8% | 12.0% |
| Standard Deviation (Sample) | 8.5% | 11.9% |
| Standard Deviation (Population) | 8.5% | 11.8% |
Correlation Details
| Immigrants from Iran Percentile | Sample Size | 2 or more Vehicles in Household |
[ 0.0% - 0.5% ] 0.052% | 151,545,902 | 53.5% |
[ 0.0% - 0.5% ] 0.15% | 53,242,632 | 55.5% |
[ 0.0% - 0.5% ] 0.26% | 24,763,040 | 57.3% |
[ 0.0% - 0.5% ] 0.37% | 13,231,513 | 60.0% |
[ 0.0% - 0.5% ] 0.49% | 9,942,938 | 60.1% |
[ 0.5% - 1.0% ] 0.58% | 4,745,068 | 61.6% |
[ 0.5% - 1.0% ] 0.70% | 3,096,782 | 59.3% |
[ 0.5% - 1.0% ] 0.81% | 2,014,469 | 62.4% |
[ 0.5% - 1.0% ] 0.91% | 2,347,521 | 61.7% |
[ 1.0% - 1.5% ] 1.01% | 2,211,397 | 63.1% |
[ 1.0% - 1.5% ] 1.12% | 665,605 | 58.1% |
[ 1.0% - 1.5% ] 1.24% | 1,340,432 | 61.7% |
[ 1.0% - 1.5% ] 1.37% | 4,533,089 | 51.6% |
[ 1.0% - 1.5% ] 1.46% | 539,588 | 59.9% |
[ 1.5% - 2.0% ] 1.56% | 813,324 | 58.4% |
[ 1.5% - 2.0% ] 1.66% | 386,820 | 63.3% |
[ 1.5% - 2.0% ] 1.78% | 326,063 | 63.4% |
[ 1.5% - 2.0% ] 1.89% | 263,874 | 58.7% |
[ 1.5% - 2.0% ] 1.99% | 139,534 | 59.6% |
[ 2.0% - 2.5% ] 2.10% | 174,310 | 70.3% |
[ 2.0% - 2.5% ] 2.19% | 196,829 | 61.5% |
[ 2.0% - 2.5% ] 2.31% | 193,289 | 64.3% |
[ 2.0% - 2.5% ] 2.44% | 87,748 | 62.1% |
[ 2.5% - 3.0% ] 2.53% | 168,842 | 76.1% |
[ 2.5% - 3.0% ] 2.65% | 62,121 | 65.4% |
[ 2.5% - 3.0% ] 2.74% | 237,161 | 66.6% |
[ 2.5% - 3.0% ] 2.90% | 37,654 | 50.8% |
[ 2.5% - 3.0% ] 2.97% | 168,262 | 70.6% |
[ 3.0% - 3.5% ] 3.06% | 96,787 | 73.2% |
[ 3.0% - 3.5% ] 3.17% | 366,071 | 61.8% |
[ 3.0% - 3.5% ] 3.28% | 205,431 | 69.1% |
[ 3.0% - 3.5% ] 3.42% | 106,622 | 60.7% |
[ 3.5% - 4.0% ] 3.54% | 104,647 | 59.5% |
[ 3.5% - 4.0% ] 3.59% | 31,657 | 63.8% |
[ 3.5% - 4.0% ] 3.82% | 33,868 | 78.2% |
[ 3.5% - 4.0% ] 3.95% | 24,177 | 67.5% |
[ 4.0% - 4.5% ] 4.09% | 6,915 | 81.9% |
[ 4.0% - 4.5% ] 4.10% | 29,744 | 55.2% |
[ 4.0% - 4.5% ] 4.28% | 20,668 | 39.3% |
[ 4.0% - 4.5% ] 4.33% | 4,410 | 82.1% |
[ 4.0% - 4.5% ] 4.46% | 133,954 | 70.4% |
[ 4.5% - 5.0% ] 4.62% | 21,080 | 74.3% |
[ 4.5% - 5.0% ] 4.72% | 36,842 | 73.8% |
[ 4.5% - 5.0% ] 4.79% | 2,318 | 75.8% |
[ 4.5% - 5.0% ] 4.88% | 38,267 | 83.6% |
[ 4.5% - 5.0% ] 4.96% | 29,544 | 56.2% |
[ 5.0% - 5.5% ] 5.12% | 31,381 | 67.4% |
[ 5.0% - 5.5% ] 5.26% | 35,819 | 57.4% |
[ 5.0% - 5.5% ] 5.30% | 73,595 | 59.5% |
[ 5.0% - 5.5% ] 5.43% | 54,074 | 52.6% |
[ 5.5% - 6.0% ] 5.56% | 180 | 74.2% |
[ 6.0% - 6.5% ] 6.19% | 28,792 | 49.0% |
[ 6.5% - 7.0% ] 6.74% | 30,549 | 57.7% |
[ 6.5% - 7.0% ] 6.80% | 30,599 | 60.4% |
[ 7.0% - 7.5% ] 7.05% | 2,936 | 73.2% |
[ 7.0% - 7.5% ] 7.22% | 44,429 | 40.1% |
[ 7.5% - 8.0% ] 7.51% | 7,509 | 48.0% |
[ 7.5% - 8.0% ] 7.58% | 28,765 | 70.0% |
[ 7.5% - 8.0% ] 7.72% | 50,392 | 35.8% |
[ 8.0% - 8.5% ] 8.15% | 44,862 | 55.7% |
[ 8.5% - 9.0% ] 8.58% | 16,246 | 64.4% |
[ 9.0% - 9.5% ] 9.23% | 38,408 | 38.3% |
[ 9.5% - 10.0% ] 9.51% | 17,076 | 59.2% |
[ 9.5% - 10.0% ] 9.95% | 16,190 | 72.3% |
[ 10.0% - 10.5% ] 10.11% | 49,408 | 61.1% |
[ 10.5% - 11.0% ] 10.60% | 11,060 | 50.3% |
[ 10.5% - 11.0% ] 10.73% | 1,445 | 56.1% |
[ 11.0% - 11.5% ] 11.04% | 462 | 64.8% |
[ 11.0% - 11.5% ] 11.26% | 23,193 | 37.4% |
[ 11.0% - 11.5% ] 11.42% | 18,445 | 42.3% |
[ 12.0% - 12.5% ] 12.01% | 9,699 | 59.0% |
[ 12.5% - 13.0% ] 12.57% | 18,951 | 51.5% |
[ 13.0% - 13.5% ] 13.18% | 59,525 | 56.6% |
[ 13.0% - 13.5% ] 13.42% | 9,105 | 70.8% |
[ 13.5% - 14.0% ] 13.81% | 195,069 | 51.5% |
[ 14.5% - 15.0% ] 14.76% | 51,474 | 57.4% |
[ 15.0% - 15.5% ] 15.07% | 5,593 | 85.2% |
[ 15.0% - 15.5% ] 15.45% | 1,139 | 41.7% |
[ 16.0% - 16.5% ] 16.21% | 16,679 | 44.9% |
[ 16.5% - 17.0% ] 16.88% | 77 | 85.4% |
[ 18.0% - 18.5% ] 18.45% | 233 | 64.1% |
[ 18.5% - 19.0% ] 18.76% | 23,473 | 55.4% |
[ 20.0% - 20.5% ] 20.01% | 22,163 | 53.7% |
[ 20.5% - 21.0% ] 20.87% | 11,091 | 59.5% |
[ 21.5% - 22.0% ] 21.54% | 1,207 | 81.7% |
[ 67.0% - 67.5% ] 67.38% | 141 | 19.2% |