Immigrants from Iran vs Pueblo 3 or more Vehicles in Household
COMPARE
Immigrants from Iran
Pueblo
3 or more Vehicles in Household
3 or more Vehicles in Household Comparison
Immigrants from Iran
Pueblo
20.0%
3 OR MORE VEHICLES IN HOUSEHOLD
80.9/ 100
METRIC RATING
149th/ 347
METRIC RANK
23.0%
3 OR MORE VEHICLES IN HOUSEHOLD
100.0/ 100
METRIC RATING
32nd/ 347
METRIC RANK
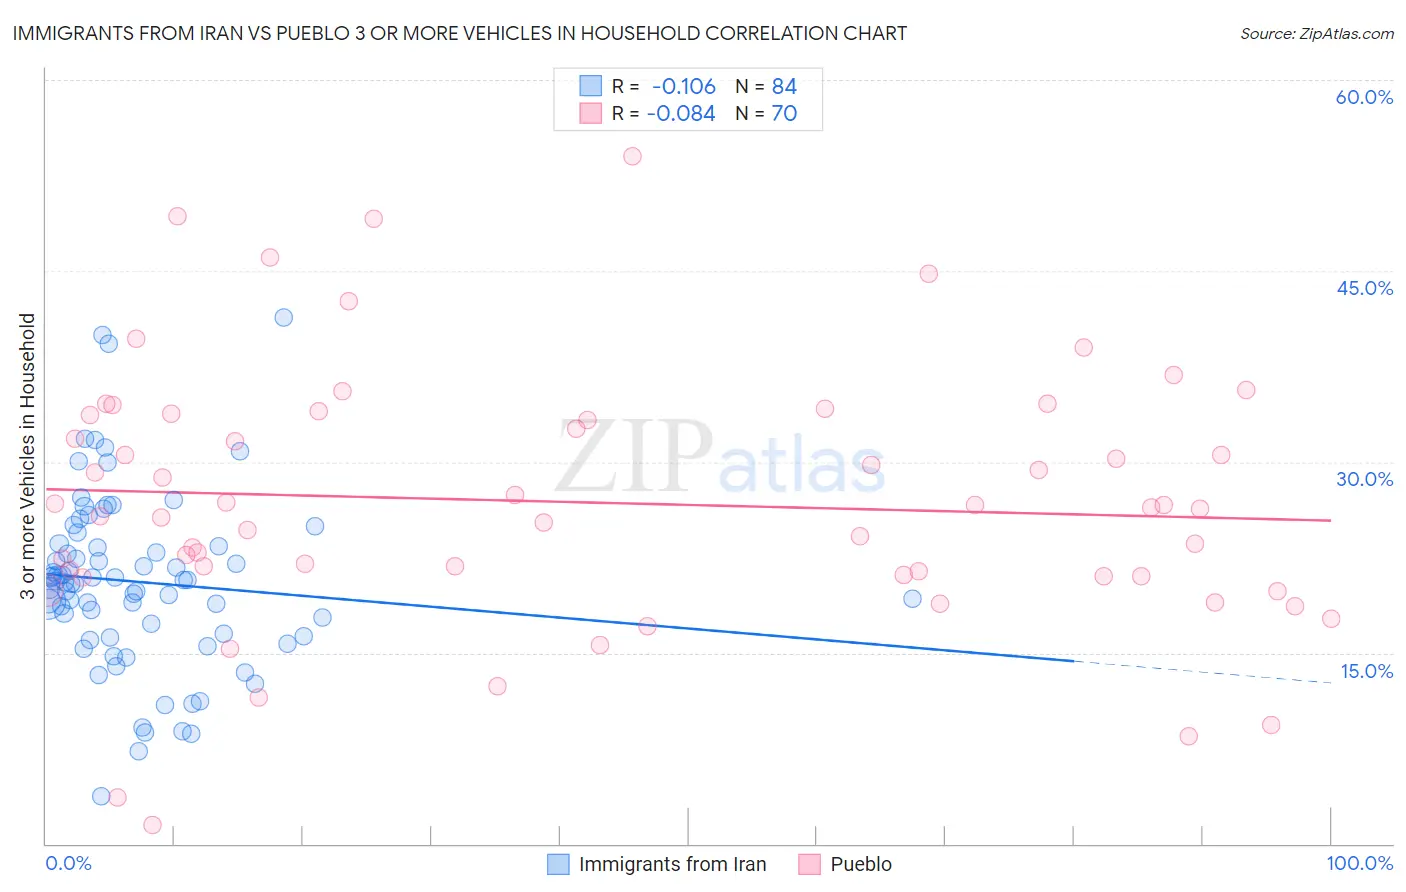
Immigrants from Iran vs Pueblo 3 or more Vehicles in Household Correlation Chart
The statistical analysis conducted on geographies consisting of 279,780,113 people shows a poor negative correlation between the proportion of Immigrants from Iran and percentage of households with 3 or more vehicles available in the United States with a correlation coefficient (R) of -0.106 and weighted average of 20.0%. Similarly, the statistical analysis conducted on geographies consisting of 120,063,355 people shows a slight negative correlation between the proportion of Pueblo and percentage of households with 3 or more vehicles available in the United States with a correlation coefficient (R) of -0.084 and weighted average of 23.0%, a difference of 15.0%.
3 or more Vehicles in Household Correlation Summary
| Measurement | Immigrants from Iran | Pueblo |
| Minimum | 3.8% | 1.4% |
| Maximum | 41.4% | 54.0% |
| Range | 37.6% | 52.6% |
| Mean | 20.6% | 26.8% |
| Median | 20.6% | 26.3% |
| Interquartile 25% (IQ1) | 16.4% | 21.0% |
| Interquartile 75% (IQ3) | 23.5% | 33.7% |
| Interquartile Range (IQR) | 7.1% | 12.7% |
| Standard Deviation (Sample) | 6.9% | 10.2% |
| Standard Deviation (Population) | 6.9% | 10.1% |
Similar Demographics by 3 or more Vehicles in Household
Demographics Similar to Immigrants from Iran by 3 or more Vehicles in Household
In terms of 3 or more vehicles in household, the demographic groups most similar to Immigrants from Iran are Immigrants (20.0%, a difference of 0.020%), Taiwanese (20.0%, a difference of 0.030%), Lebanese (20.0%, a difference of 0.13%), Guatemalan (20.1%, a difference of 0.20%), and Slovak (20.1%, a difference of 0.26%).
| Demographics | Rating | Rank | 3 or more Vehicles in Household |
| Jordanians | 84.4 /100 | #142 | Excellent 20.1% |
| Lithuanians | 84.4 /100 | #143 | Excellent 20.1% |
| Iranians | 84.0 /100 | #144 | Excellent 20.1% |
| Palestinians | 83.9 /100 | #145 | Excellent 20.1% |
| Australians | 83.6 /100 | #146 | Excellent 20.1% |
| Slovaks | 83.0 /100 | #147 | Excellent 20.1% |
| Guatemalans | 82.6 /100 | #148 | Excellent 20.1% |
| Immigrants | Iran | 80.9 /100 | #149 | Excellent 20.0% |
| Immigrants | Immigrants | 80.8 /100 | #150 | Excellent 20.0% |
| Taiwanese | 80.6 /100 | #151 | Excellent 20.0% |
| Lebanese | 79.8 /100 | #152 | Good 20.0% |
| Yuman | 75.6 /100 | #153 | Good 19.9% |
| Immigrants | Jordan | 75.0 /100 | #154 | Good 19.9% |
| Tlingit-Haida | 73.4 /100 | #155 | Good 19.9% |
| Thais | 71.1 /100 | #156 | Good 19.8% |
Demographics Similar to Pueblo by 3 or more Vehicles in Household
In terms of 3 or more vehicles in household, the demographic groups most similar to Pueblo are Spanish American (23.0%, a difference of 0.060%), English (23.1%, a difference of 0.090%), Swiss (23.0%, a difference of 0.11%), Choctaw (23.0%, a difference of 0.13%), and Cherokee (23.0%, a difference of 0.17%).
| Demographics | Rating | Rank | 3 or more Vehicles in Household |
| Immigrants | Central America | 100.0 /100 | #25 | Exceptional 23.4% |
| Mexican American Indians | 100.0 /100 | #26 | Exceptional 23.3% |
| Guamanians/Chamorros | 100.0 /100 | #27 | Exceptional 23.2% |
| Lumbee | 100.0 /100 | #28 | Exceptional 23.1% |
| Spanish | 100.0 /100 | #29 | Exceptional 23.1% |
| Immigrants | South Eastern Asia | 100.0 /100 | #30 | Exceptional 23.1% |
| English | 100.0 /100 | #31 | Exceptional 23.1% |
| Pueblo | 100.0 /100 | #32 | Exceptional 23.0% |
| Spanish Americans | 100.0 /100 | #33 | Exceptional 23.0% |
| Swiss | 100.0 /100 | #34 | Exceptional 23.0% |
| Choctaw | 100.0 /100 | #35 | Exceptional 23.0% |
| Cherokee | 100.0 /100 | #36 | Exceptional 23.0% |
| Swedes | 100.0 /100 | #37 | Exceptional 23.0% |
| Dutch | 100.0 /100 | #38 | Exceptional 22.9% |
| Yaqui | 100.0 /100 | #39 | Exceptional 22.9% |