Immigrants from Hungary 4 or more Vehicles in Household
COMPARE
Immigrants from Hungary
Select to Compare
4 or more Vehicles in Household
Immigrants from Hungary 4 or more Vehicles in Household
5.8%
4+ VEHICLES AVAILABLE
4.6/ 100
METRIC RATING
235th/ 347
METRIC RANK
Immigrants from Hungary 4 or more Vehicles in Household Correlation Chart
The statistical analysis conducted on geographies consisting of 194,934,489 people shows a poor negative correlation between the proportion of Immigrants from Hungary and percentage of households with 4 or more vehicles available in the United States with a correlation coefficient (R) of -0.107 and weighted average of 5.8%. On average, for every 1% (one percent) increase in Immigrants from Hungary within a typical geography, there is a decrease of 0.16% in percentage of households with 4 or more vehicles available.
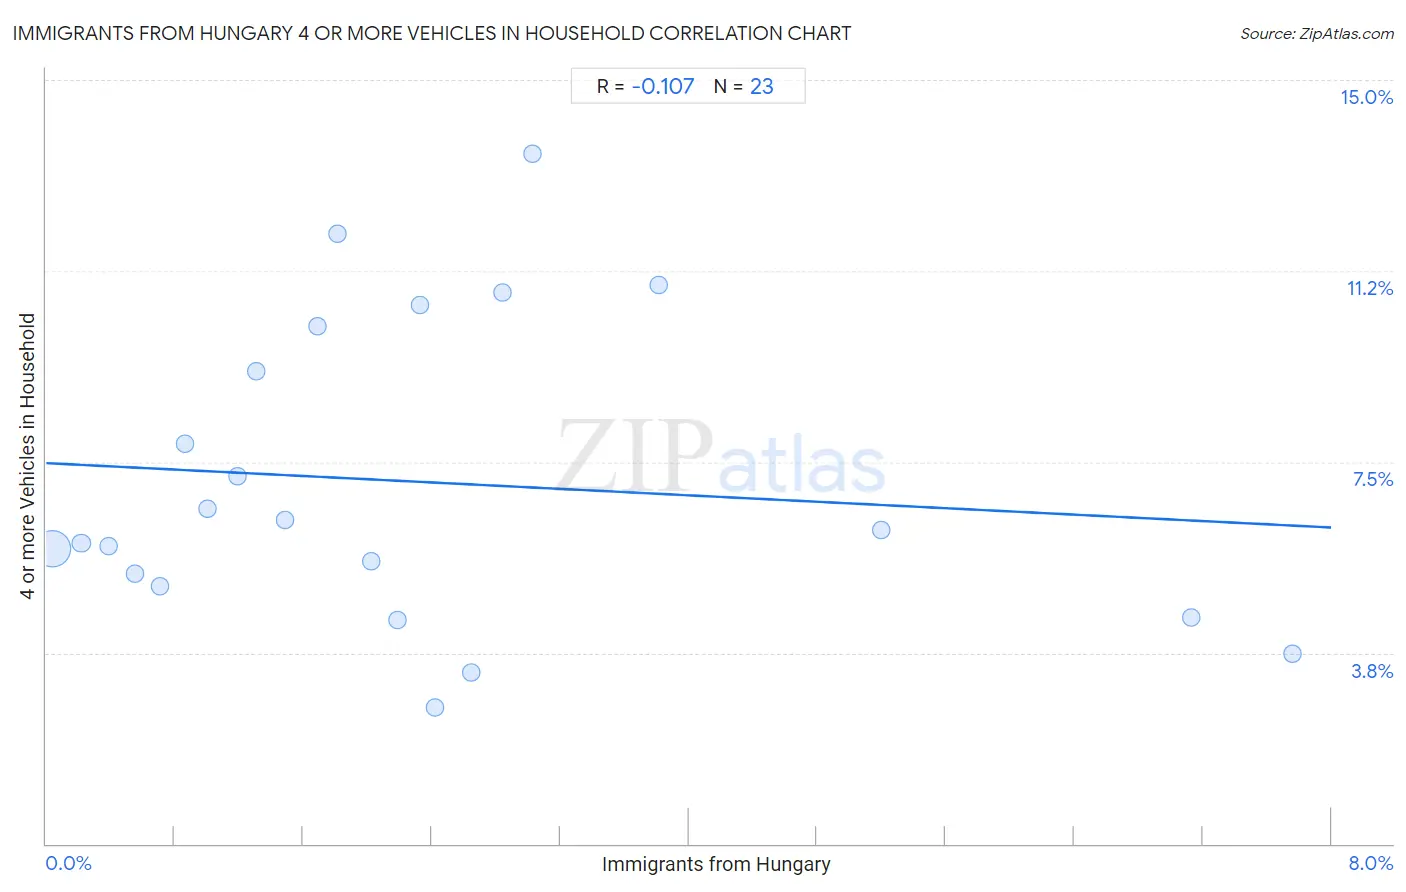
It is essential to understand that the correlation between the percentage of Immigrants from Hungary and percentage of households with 4 or more vehicles available does not imply a direct cause-and-effect relationship. It remains uncertain whether the presence of Immigrants from Hungary influences an upward or downward trend in the level of percentage of households with 4 or more vehicles available within an area, or if Immigrants from Hungary simply ended up residing in those areas with higher or lower levels of percentage of households with 4 or more vehicles available due to other factors.
Demographics Similar to Immigrants from Hungary by 4 or more Vehicles in Household
In terms of 4 or more vehicles in household, the demographic groups most similar to Immigrants from Hungary are Immigrants from Eritrea (5.8%, a difference of 0.010%), African (5.8%, a difference of 0.020%), Turkish (5.8%, a difference of 0.29%), Immigrants from Belgium (5.8%, a difference of 0.41%), and Immigrants from Australia (5.8%, a difference of 0.51%).
| Demographics | Rating | Rank | 4 or more Vehicles in Household |
| Immigrants from Uganda | 7.5 /100 | #228 | Tragic 5.9% |
| Eastern Europeans | 6.8 /100 | #229 | Tragic 5.9% |
| Immigrants from Malaysia | 6.7 /100 | #230 | Tragic 5.9% |
| Immigrants from Switzerland | 6.4 /100 | #231 | Tragic 5.9% |
| Immigrants from Argentina | 6.0 /100 | #232 | Tragic 5.9% |
| Sierra Leoneans | 6.0 /100 | #233 | Tragic 5.9% |
| Africans | 4.6 /100 | #234 | Tragic 5.8% |
| Immigrants from Hungary | 4.6 /100 | #235 | Tragic 5.8% |
| Immigrants from Eritrea | 4.5 /100 | #236 | Tragic 5.8% |
| Turks | 4.1 /100 | #237 | Tragic 5.8% |
| Immigrants from Belgium | 4.0 /100 | #238 | Tragic 5.8% |
| Immigrants from Australia | 3.8 /100 | #239 | Tragic 5.8% |
| Immigrants from Poland | 3.8 /100 | #240 | Tragic 5.8% |
| Mongolians | 3.7 /100 | #241 | Tragic 5.8% |
| Immigrants from Middle Africa | 3.4 /100 | #242 | Tragic 5.8% |
Immigrants from Hungary 4 or more Vehicles in Household Correlation Summary
| Measurement | Immigrants from Hungary Data | 4 or more Vehicles in Household Data |
| Minimum | 0.039% | 2.7% |
| Maximum | 7.8% | 13.6% |
| Range | 7.7% | 10.9% |
| Mean | 2.3% | 7.1% |
| Median | 1.8% | 6.2% |
| Interquartile 25% (IQ1) | 0.86% | 5.1% |
| Interquartile 75% (IQ3) | 2.8% | 10.2% |
| Interquartile Range (IQR) | 2.0% | 5.1% |
| Standard Deviation (Sample) | 2.0% | 3.0% |
| Standard Deviation (Population) | 2.0% | 2.9% |
Correlation Details
| Immigrants from Hungary Percentile | Sample Size | 4 or more Vehicles in Household |
[ 0.0% - 0.5% ] 0.039% | 180,103,394 | 5.8% |
[ 0.0% - 0.5% ] 0.22% | 10,842,012 | 5.9% |
[ 0.0% - 0.5% ] 0.39% | 2,326,629 | 5.8% |
[ 0.5% - 1.0% ] 0.55% | 990,720 | 5.3% |
[ 0.5% - 1.0% ] 0.71% | 293,734 | 5.1% |
[ 0.5% - 1.0% ] 0.86% | 108,815 | 7.9% |
[ 1.0% - 1.5% ] 1.00% | 44,634 | 6.6% |
[ 1.0% - 1.5% ] 1.19% | 84,971 | 7.2% |
[ 1.0% - 1.5% ] 1.31% | 5,583 | 9.3% |
[ 1.0% - 1.5% ] 1.49% | 49,940 | 6.3% |
[ 1.5% - 2.0% ] 1.69% | 15,069 | 10.2% |
[ 1.5% - 2.0% ] 1.81% | 1,987 | 12.0% |
[ 2.0% - 2.5% ] 2.03% | 31,979 | 5.6% |
[ 2.0% - 2.5% ] 2.19% | 11,295 | 4.4% |
[ 2.0% - 2.5% ] 2.33% | 1,374 | 10.6% |
[ 2.0% - 2.5% ] 2.42% | 4,420 | 2.7% |
[ 2.5% - 3.0% ] 2.65% | 3,968 | 3.4% |
[ 2.5% - 3.0% ] 2.84% | 598 | 10.8% |
[ 3.0% - 3.5% ] 3.03% | 8,612 | 13.6% |
[ 3.5% - 4.0% ] 3.81% | 1,599 | 11.0% |
[ 5.0% - 5.5% ] 5.20% | 1,174 | 6.2% |
[ 7.0% - 7.5% ] 7.13% | 603 | 4.5% |
[ 7.5% - 8.0% ] 7.76% | 1,379 | 3.7% |