Immigrants from Hungary Married-couple Households
COMPARE
Immigrants from Hungary
Select to Compare
Married-couple Households
Immigrants from Hungary Married-couple Households
47.3%
MARRIED-COUPLE HOUSEHOLDS
87.8/ 100
METRIC RATING
130th/ 347
METRIC RANK
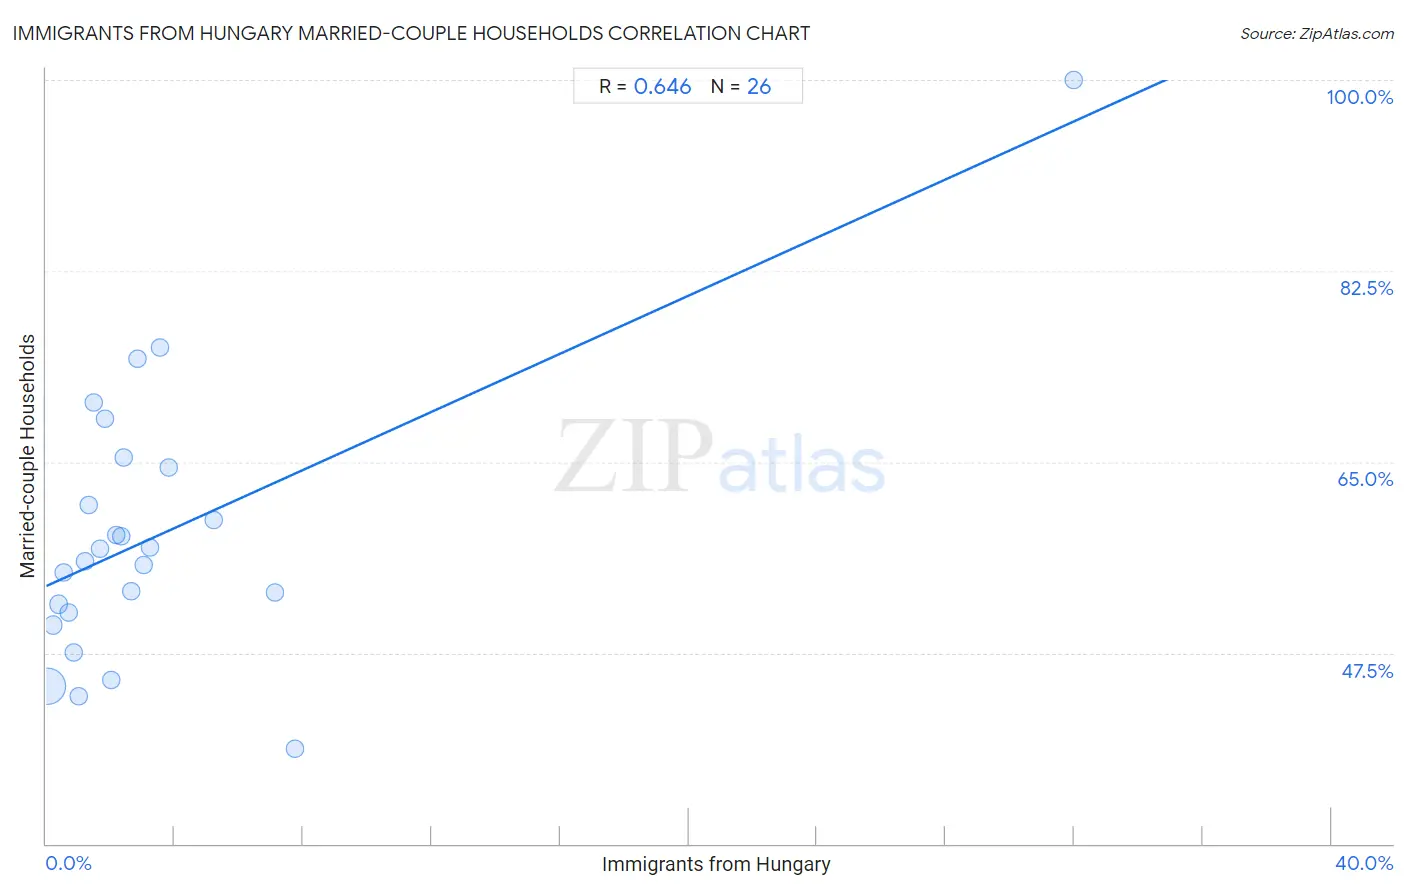
Immigrants from Hungary Married-couple Households Correlation Chart
The statistical analysis conducted on geographies consisting of 195,664,672 people shows a significant positive correlation between the proportion of Immigrants from Hungary and percentage of married-couple family households in the United States with a correlation coefficient (R) of 0.646 and weighted average of 47.3%. On average, for every 1% (one percent) increase in Immigrants from Hungary within a typical geography, there is an increase of 1.3% in percentage of married-couple family households.
It is essential to understand that the correlation between the percentage of Immigrants from Hungary and percentage of married-couple family households does not imply a direct cause-and-effect relationship. It remains uncertain whether the presence of Immigrants from Hungary influences an upward or downward trend in the level of percentage of married-couple family households within an area, or if Immigrants from Hungary simply ended up residing in those areas with higher or lower levels of percentage of married-couple family households due to other factors.
Demographics Similar to Immigrants from Hungary by Married-couple Households
In terms of married-couple households, the demographic groups most similar to Immigrants from Hungary are Immigrants from Iraq (47.3%, a difference of 0.0%), Immigrants from Peru (47.3%, a difference of 0.010%), Immigrants from Denmark (47.3%, a difference of 0.020%), Celtic (47.3%, a difference of 0.030%), and Pakistani (47.3%, a difference of 0.070%).
| Demographics | Rating | Rank | Married-couple Households |
| Immigrants from Venezuela | 89.3 /100 | #123 | Excellent 47.4% |
| Zimbabweans | 89.2 /100 | #124 | Excellent 47.4% |
| Australians | 89.0 /100 | #125 | Excellent 47.4% |
| Pakistanis | 88.6 /100 | #126 | Excellent 47.3% |
| Celtics | 88.1 /100 | #127 | Excellent 47.3% |
| Immigrants from Peru | 87.9 /100 | #128 | Excellent 47.3% |
| Immigrants from Iraq | 87.8 /100 | #129 | Excellent 47.3% |
| Immigrants from Hungary | 87.8 /100 | #130 | Excellent 47.3% |
| Immigrants from Denmark | 87.5 /100 | #131 | Excellent 47.3% |
| Immigrants from Ukraine | 86.7 /100 | #132 | Excellent 47.3% |
| South Africans | 86.4 /100 | #133 | Excellent 47.3% |
| Immigrants from Greece | 86.0 /100 | #134 | Excellent 47.2% |
| Immigrants from Argentina | 86.0 /100 | #135 | Excellent 47.2% |
| New Zealanders | 85.3 /100 | #136 | Excellent 47.2% |
| Immigrants from Malaysia | 85.2 /100 | #137 | Excellent 47.2% |
Immigrants from Hungary Married-couple Households Correlation Summary
| Measurement | Immigrants from Hungary Data | Married-couple Households Data |
| Minimum | 0.039% | 38.7% |
| Maximum | 32.0% | 100.0% |
| Range | 32.0% | 61.3% |
| Mean | 3.5% | 58.3% |
| Median | 2.1% | 56.5% |
| Interquartile 25% (IQ1) | 1.0% | 51.2% |
| Interquartile 75% (IQ3) | 3.2% | 64.5% |
| Interquartile Range (IQR) | 2.2% | 13.2% |
| Standard Deviation (Sample) | 6.1% | 12.6% |
| Standard Deviation (Population) | 6.0% | 12.4% |
Correlation Details
| Immigrants from Hungary Percentile | Sample Size | Married-couple Households |
[ 0.0% - 0.5% ] 0.039% | 180,545,948 | 44.5% |
[ 0.0% - 0.5% ] 0.22% | 11,011,692 | 50.1% |
[ 0.0% - 0.5% ] 0.39% | 2,392,376 | 52.0% |
[ 0.5% - 1.0% ] 0.55% | 1,002,005 | 54.9% |
[ 0.5% - 1.0% ] 0.70% | 304,010 | 51.2% |
[ 0.5% - 1.0% ] 0.87% | 129,377 | 47.5% |
[ 1.0% - 1.5% ] 1.01% | 47,444 | 43.6% |
[ 1.0% - 1.5% ] 1.19% | 84,971 | 55.9% |
[ 1.0% - 1.5% ] 1.31% | 6,499 | 61.0% |
[ 1.0% - 1.5% ] 1.49% | 50,070 | 70.5% |
[ 1.5% - 2.0% ] 1.69% | 15,069 | 57.0% |
[ 1.5% - 2.0% ] 1.81% | 1,987 | 68.9% |
[ 2.0% - 2.5% ] 2.02% | 34,658 | 45.0% |
[ 2.0% - 2.5% ] 2.19% | 11,295 | 58.3% |
[ 2.0% - 2.5% ] 2.33% | 1,546 | 58.2% |
[ 2.0% - 2.5% ] 2.43% | 4,902 | 65.4% |
[ 2.5% - 3.0% ] 2.65% | 3,968 | 53.1% |
[ 2.5% - 3.0% ] 2.84% | 598 | 74.5% |
[ 3.0% - 3.5% ] 3.03% | 8,612 | 55.6% |
[ 3.0% - 3.5% ] 3.23% | 124 | 57.1% |
[ 3.5% - 4.0% ] 3.54% | 2,741 | 75.4% |
[ 3.5% - 4.0% ] 3.81% | 1,599 | 64.5% |
[ 5.0% - 5.5% ] 5.20% | 1,174 | 59.7% |
[ 7.0% - 7.5% ] 7.13% | 603 | 53.0% |
[ 7.5% - 8.0% ] 7.76% | 1,379 | 38.7% |
[ 32.0% - 32.5% ] 32.00% | 25 | 100.0% |