Immigrants from Hungary 1 or more Vehicles in Household
COMPARE
Immigrants from Hungary
Select to Compare
1 or more Vehicles in Household
Immigrants from Hungary 1 or more Vehicles in Household
89.0%
1+ VEHICLES AVAILABLE
11.9/ 100
METRIC RATING
214th/ 347
METRIC RANK
Immigrants from Hungary 1 or more Vehicles in Household Correlation Chart
The statistical analysis conducted on geographies consisting of 195,676,592 people shows a moderate positive correlation between the proportion of Immigrants from Hungary and percentage of households with 1 or more vehicles available in the United States with a correlation coefficient (R) of 0.426 and weighted average of 89.0%. On average, for every 1% (one percent) increase in Immigrants from Hungary within a typical geography, there is an increase of 0.29% in percentage of households with 1 or more vehicles available.
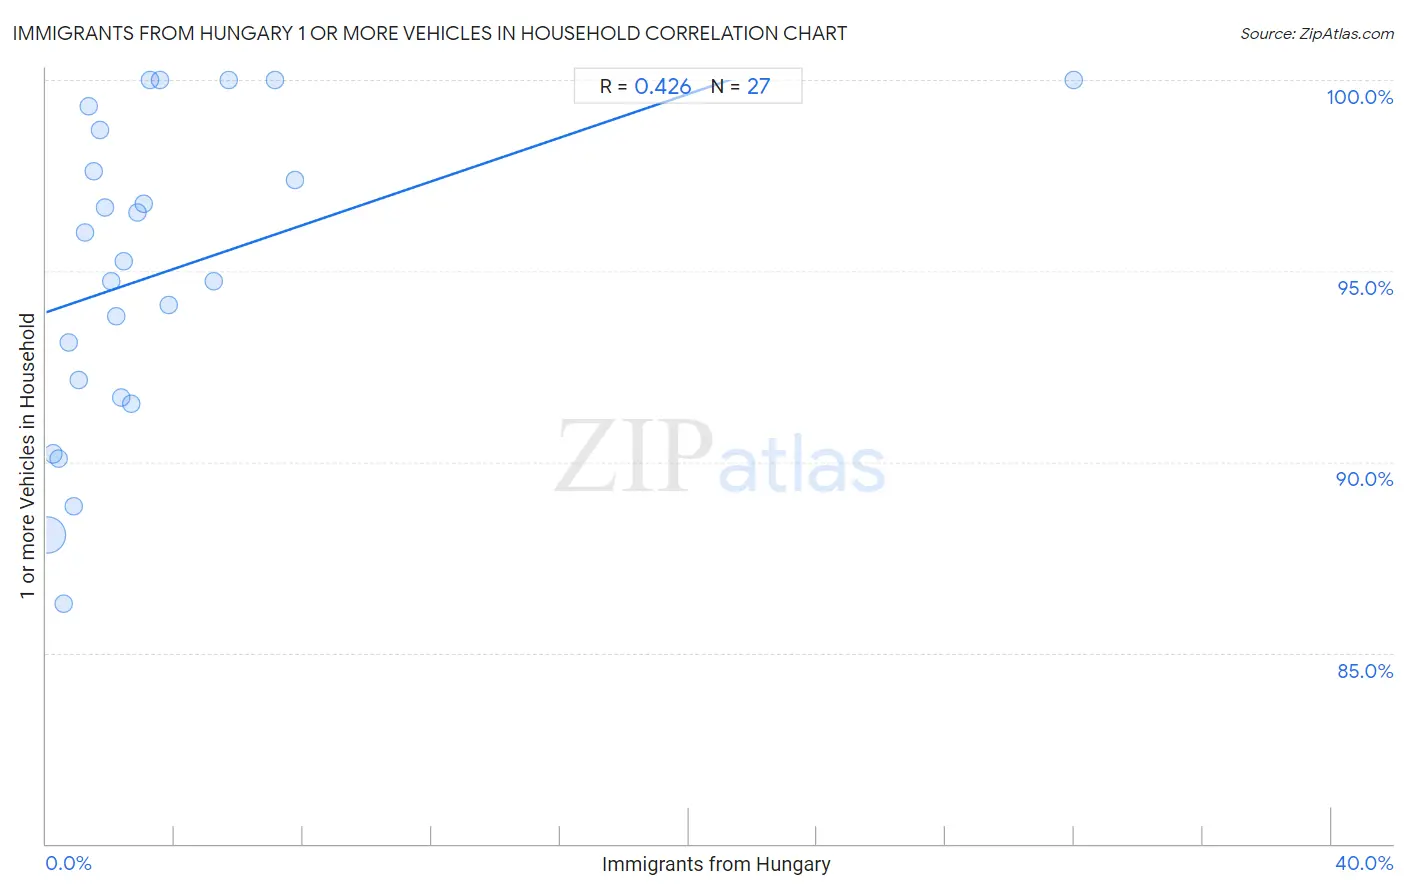
It is essential to understand that the correlation between the percentage of Immigrants from Hungary and percentage of households with 1 or more vehicles available does not imply a direct cause-and-effect relationship. It remains uncertain whether the presence of Immigrants from Hungary influences an upward or downward trend in the level of percentage of households with 1 or more vehicles available within an area, or if Immigrants from Hungary simply ended up residing in those areas with higher or lower levels of percentage of households with 1 or more vehicles available due to other factors.
Demographics Similar to Immigrants from Hungary by 1 or more Vehicles in Household
In terms of 1 or more vehicles in household, the demographic groups most similar to Immigrants from Hungary are Immigrants from Western Asia (89.0%, a difference of 0.010%), Somali (89.0%, a difference of 0.030%), Sierra Leonean (89.0%, a difference of 0.040%), Dutch West Indian (89.0%, a difference of 0.060%), and Immigrants from Italy (89.1%, a difference of 0.070%).
| Demographics | Rating | Rank | 1 or more Vehicles in Household |
| Immigrants from Denmark | 14.8 /100 | #207 | Poor 89.1% |
| Immigrants from Chile | 14.4 /100 | #208 | Poor 89.1% |
| Immigrants from Italy | 14.0 /100 | #209 | Poor 89.1% |
| Dutch West Indians | 13.5 /100 | #210 | Poor 89.0% |
| Sierra Leoneans | 13.0 /100 | #211 | Poor 89.0% |
| Somalis | 12.8 /100 | #212 | Poor 89.0% |
| Immigrants from Western Asia | 12.3 /100 | #213 | Poor 89.0% |
| Immigrants from Hungary | 11.9 /100 | #214 | Poor 89.0% |
| Immigrants from Sri Lanka | 10.2 /100 | #215 | Poor 88.9% |
| Immigrants from Argentina | 9.4 /100 | #216 | Tragic 88.9% |
| Argentineans | 8.8 /100 | #217 | Tragic 88.9% |
| Ugandans | 8.7 /100 | #218 | Tragic 88.9% |
| Immigrants from Guatemala | 8.6 /100 | #219 | Tragic 88.9% |
| Immigrants from Zaire | 8.1 /100 | #220 | Tragic 88.8% |
| Peruvians | 7.9 /100 | #221 | Tragic 88.8% |
Immigrants from Hungary 1 or more Vehicles in Household Correlation Summary
| Measurement | Immigrants from Hungary Data | 1 or more Vehicles in Household Data |
| Minimum | 0.039% | 86.3% |
| Maximum | 32.0% | 100.0% |
| Range | 32.0% | 13.7% |
| Mean | 3.6% | 94.9% |
| Median | 2.2% | 95.3% |
| Interquartile 25% (IQ1) | 1.0% | 91.7% |
| Interquartile 75% (IQ3) | 3.5% | 98.7% |
| Interquartile Range (IQR) | 2.5% | 7.0% |
| Standard Deviation (Sample) | 6.0% | 4.0% |
| Standard Deviation (Population) | 5.9% | 4.0% |
Correlation Details
| Immigrants from Hungary Percentile | Sample Size | 1 or more Vehicles in Household |
[ 0.0% - 0.5% ] 0.039% | 180,557,322 | 88.1% |
[ 0.0% - 0.5% ] 0.22% | 11,011,692 | 90.2% |
[ 0.0% - 0.5% ] 0.39% | 2,392,376 | 90.1% |
[ 0.5% - 1.0% ] 0.55% | 1,002,005 | 86.3% |
[ 0.5% - 1.0% ] 0.70% | 304,010 | 93.1% |
[ 0.5% - 1.0% ] 0.87% | 129,377 | 88.8% |
[ 1.0% - 1.5% ] 1.01% | 47,444 | 92.1% |
[ 1.0% - 1.5% ] 1.19% | 84,971 | 96.0% |
[ 1.0% - 1.5% ] 1.31% | 6,499 | 99.3% |
[ 1.0% - 1.5% ] 1.49% | 50,070 | 97.6% |
[ 1.5% - 2.0% ] 1.69% | 15,069 | 98.7% |
[ 1.5% - 2.0% ] 1.81% | 1,987 | 96.7% |
[ 2.0% - 2.5% ] 2.02% | 34,658 | 94.7% |
[ 2.0% - 2.5% ] 2.19% | 11,295 | 93.8% |
[ 2.0% - 2.5% ] 2.33% | 1,546 | 91.7% |
[ 2.0% - 2.5% ] 2.43% | 4,902 | 95.3% |
[ 2.5% - 3.0% ] 2.65% | 3,968 | 91.5% |
[ 2.5% - 3.0% ] 2.84% | 598 | 96.5% |
[ 3.0% - 3.5% ] 3.03% | 8,612 | 96.8% |
[ 3.0% - 3.5% ] 3.23% | 124 | 100.0% |
[ 3.5% - 4.0% ] 3.54% | 2,741 | 100.0% |
[ 3.5% - 4.0% ] 3.81% | 1,599 | 94.1% |
[ 5.0% - 5.5% ] 5.20% | 1,174 | 94.7% |
[ 5.5% - 6.0% ] 5.68% | 546 | 100.0% |
[ 7.0% - 7.5% ] 7.13% | 603 | 100.0% |
[ 7.5% - 8.0% ] 7.76% | 1,379 | 97.4% |
[ 32.0% - 32.5% ] 32.00% | 25 | 100.0% |