Immigrants from Guatemala vs Immigrants from Korea 3 or more Vehicles in Household
COMPARE
Immigrants from Guatemala
Immigrants from Korea
3 or more Vehicles in Household
3 or more Vehicles in Household Comparison
Immigrants from Guatemala
Immigrants from Korea
19.7%
3 OR MORE VEHICLES IN HOUSEHOLD
65.6/ 100
METRIC RATING
161st/ 347
METRIC RANK
20.5%
3 OR MORE VEHICLES IN HOUSEHOLD
93.7/ 100
METRIC RATING
123rd/ 347
METRIC RANK
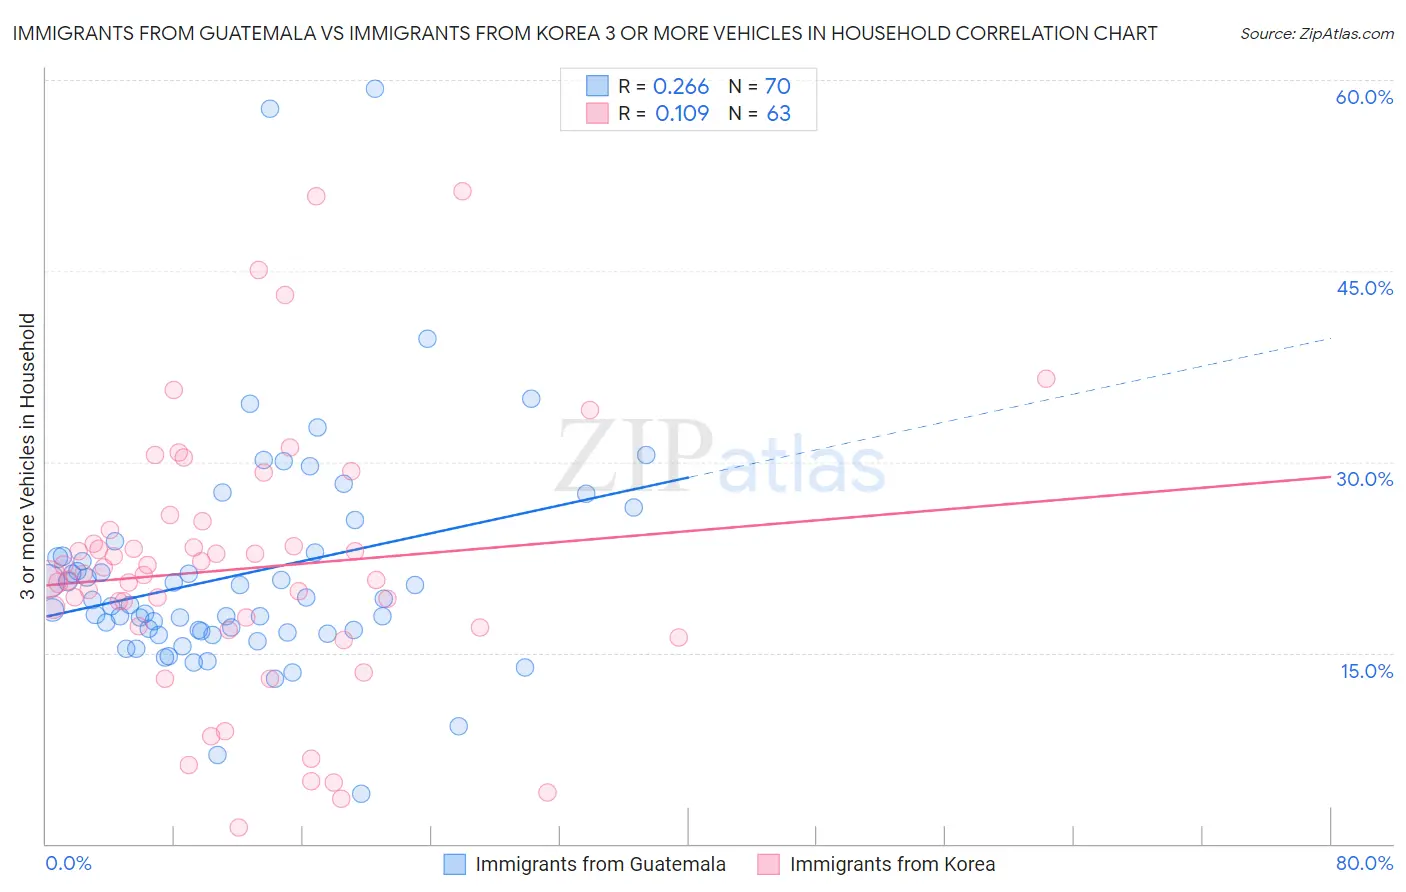
Immigrants from Guatemala vs Immigrants from Korea 3 or more Vehicles in Household Correlation Chart
The statistical analysis conducted on geographies consisting of 377,138,976 people shows a weak positive correlation between the proportion of Immigrants from Guatemala and percentage of households with 3 or more vehicles available in the United States with a correlation coefficient (R) of 0.266 and weighted average of 19.7%. Similarly, the statistical analysis conducted on geographies consisting of 415,786,030 people shows a poor positive correlation between the proportion of Immigrants from Korea and percentage of households with 3 or more vehicles available in the United States with a correlation coefficient (R) of 0.109 and weighted average of 20.5%, a difference of 3.8%.
3 or more Vehicles in Household Correlation Summary
| Measurement | Immigrants from Guatemala | Immigrants from Korea |
| Minimum | 3.9% | 1.2% |
| Maximum | 59.3% | 51.2% |
| Range | 55.5% | 50.0% |
| Mean | 21.1% | 21.6% |
| Median | 18.7% | 21.1% |
| Interquartile 25% (IQ1) | 16.6% | 17.0% |
| Interquartile 75% (IQ3) | 22.6% | 24.6% |
| Interquartile Range (IQR) | 6.0% | 7.6% |
| Standard Deviation (Sample) | 9.0% | 10.3% |
| Standard Deviation (Population) | 9.0% | 10.3% |
Similar Demographics by 3 or more Vehicles in Household
Demographics Similar to Immigrants from Guatemala by 3 or more Vehicles in Household
In terms of 3 or more vehicles in household, the demographic groups most similar to Immigrants from Guatemala are Immigrants from Lebanon (19.8%, a difference of 0.16%), Estonian (19.7%, a difference of 0.19%), Chilean (19.7%, a difference of 0.21%), Immigrants from Pakistan (19.8%, a difference of 0.22%), and Yugoslavian (19.7%, a difference of 0.22%).
| Demographics | Rating | Rank | 3 or more Vehicles in Household |
| Immigrants | Jordan | 75.0 /100 | #154 | Good 19.9% |
| Tlingit-Haida | 73.4 /100 | #155 | Good 19.9% |
| Thais | 71.1 /100 | #156 | Good 19.8% |
| Hungarians | 70.5 /100 | #157 | Good 19.8% |
| Armenians | 68.8 /100 | #158 | Good 19.8% |
| Immigrants | Pakistan | 68.2 /100 | #159 | Good 19.8% |
| Immigrants | Lebanon | 67.6 /100 | #160 | Good 19.8% |
| Immigrants | Guatemala | 65.6 /100 | #161 | Good 19.7% |
| Estonians | 63.2 /100 | #162 | Good 19.7% |
| Chileans | 63.0 /100 | #163 | Good 19.7% |
| Yugoslavians | 62.9 /100 | #164 | Good 19.7% |
| Immigrants | Costa Rica | 61.9 /100 | #165 | Good 19.7% |
| Immigrants | Cameroon | 60.9 /100 | #166 | Good 19.7% |
| Ukrainians | 58.9 /100 | #167 | Average 19.6% |
| Peruvians | 58.8 /100 | #168 | Average 19.6% |
Demographics Similar to Immigrants from Korea by 3 or more Vehicles in Household
In terms of 3 or more vehicles in household, the demographic groups most similar to Immigrants from Korea are German Russian (20.5%, a difference of 0.010%), Immigrants from Thailand (20.5%, a difference of 0.050%), Maltese (20.5%, a difference of 0.060%), Central American (20.5%, a difference of 0.17%), and Immigrants from Netherlands (20.4%, a difference of 0.20%).
| Demographics | Rating | Rank | 3 or more Vehicles in Household |
| Italians | 94.9 /100 | #116 | Exceptional 20.6% |
| Croatians | 94.9 /100 | #117 | Exceptional 20.6% |
| Costa Ricans | 94.6 /100 | #118 | Exceptional 20.6% |
| Immigrants | Latin America | 94.5 /100 | #119 | Exceptional 20.5% |
| Maltese | 93.9 /100 | #120 | Exceptional 20.5% |
| Immigrants | Thailand | 93.8 /100 | #121 | Exceptional 20.5% |
| German Russians | 93.7 /100 | #122 | Exceptional 20.5% |
| Immigrants | Korea | 93.7 /100 | #123 | Exceptional 20.5% |
| Central Americans | 93.1 /100 | #124 | Exceptional 20.5% |
| Immigrants | Netherlands | 92.9 /100 | #125 | Exceptional 20.4% |
| Slavs | 92.1 /100 | #126 | Exceptional 20.4% |
| Immigrants | Bolivia | 92.0 /100 | #127 | Exceptional 20.4% |
| New Zealanders | 91.3 /100 | #128 | Exceptional 20.4% |
| Zimbabweans | 88.7 /100 | #129 | Excellent 20.3% |
| Greeks | 88.6 /100 | #130 | Excellent 20.3% |