Immigrants from Guatemala vs Immigrants from Kenya 3 or more Vehicles in Household
COMPARE
Immigrants from Guatemala
Immigrants from Kenya
3 or more Vehicles in Household
3 or more Vehicles in Household Comparison
Immigrants from Guatemala
Immigrants from Kenya
19.7%
3 OR MORE VEHICLES IN HOUSEHOLD
65.6/ 100
METRIC RATING
161st/ 347
METRIC RANK
18.8%
3 OR MORE VEHICLES IN HOUSEHOLD
12.4/ 100
METRIC RATING
211th/ 347
METRIC RANK
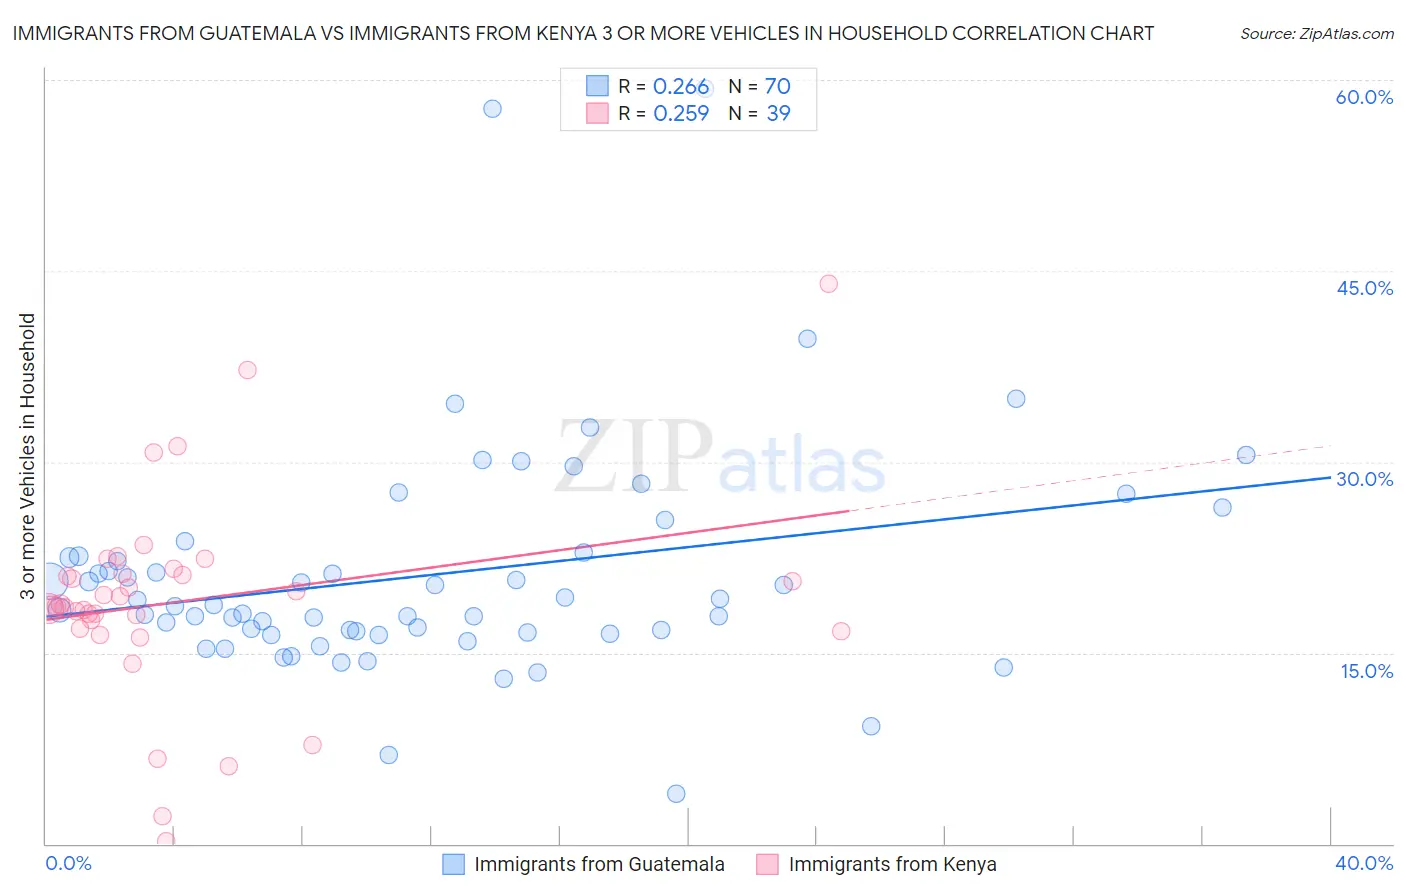
Immigrants from Guatemala vs Immigrants from Kenya 3 or more Vehicles in Household Correlation Chart
The statistical analysis conducted on geographies consisting of 377,138,976 people shows a weak positive correlation between the proportion of Immigrants from Guatemala and percentage of households with 3 or more vehicles available in the United States with a correlation coefficient (R) of 0.266 and weighted average of 19.7%. Similarly, the statistical analysis conducted on geographies consisting of 217,959,739 people shows a weak positive correlation between the proportion of Immigrants from Kenya and percentage of households with 3 or more vehicles available in the United States with a correlation coefficient (R) of 0.259 and weighted average of 18.8%, a difference of 5.1%.
3 or more Vehicles in Household Correlation Summary
| Measurement | Immigrants from Guatemala | Immigrants from Kenya |
| Minimum | 3.9% | 0.19% |
| Maximum | 59.3% | 44.0% |
| Range | 55.5% | 43.8% |
| Mean | 21.1% | 19.1% |
| Median | 18.7% | 18.7% |
| Interquartile 25% (IQ1) | 16.6% | 16.9% |
| Interquartile 75% (IQ3) | 22.6% | 21.2% |
| Interquartile Range (IQR) | 6.0% | 4.3% |
| Standard Deviation (Sample) | 9.0% | 8.1% |
| Standard Deviation (Population) | 9.0% | 8.0% |
Similar Demographics by 3 or more Vehicles in Household
Demographics Similar to Immigrants from Guatemala by 3 or more Vehicles in Household
In terms of 3 or more vehicles in household, the demographic groups most similar to Immigrants from Guatemala are Immigrants from Lebanon (19.8%, a difference of 0.16%), Estonian (19.7%, a difference of 0.19%), Chilean (19.7%, a difference of 0.21%), Immigrants from Pakistan (19.8%, a difference of 0.22%), and Yugoslavian (19.7%, a difference of 0.22%).
| Demographics | Rating | Rank | 3 or more Vehicles in Household |
| Immigrants | Jordan | 75.0 /100 | #154 | Good 19.9% |
| Tlingit-Haida | 73.4 /100 | #155 | Good 19.9% |
| Thais | 71.1 /100 | #156 | Good 19.8% |
| Hungarians | 70.5 /100 | #157 | Good 19.8% |
| Armenians | 68.8 /100 | #158 | Good 19.8% |
| Immigrants | Pakistan | 68.2 /100 | #159 | Good 19.8% |
| Immigrants | Lebanon | 67.6 /100 | #160 | Good 19.8% |
| Immigrants | Guatemala | 65.6 /100 | #161 | Good 19.7% |
| Estonians | 63.2 /100 | #162 | Good 19.7% |
| Chileans | 63.0 /100 | #163 | Good 19.7% |
| Yugoslavians | 62.9 /100 | #164 | Good 19.7% |
| Immigrants | Costa Rica | 61.9 /100 | #165 | Good 19.7% |
| Immigrants | Cameroon | 60.9 /100 | #166 | Good 19.7% |
| Ukrainians | 58.9 /100 | #167 | Average 19.6% |
| Peruvians | 58.8 /100 | #168 | Average 19.6% |
Demographics Similar to Immigrants from Kenya by 3 or more Vehicles in Household
In terms of 3 or more vehicles in household, the demographic groups most similar to Immigrants from Kenya are Bulgarian (18.8%, a difference of 0.12%), Panamanian (18.8%, a difference of 0.14%), Immigrants from Cuba (18.8%, a difference of 0.15%), Immigrants from Egypt (18.8%, a difference of 0.20%), and Immigrants from Chile (18.8%, a difference of 0.21%).
| Demographics | Rating | Rank | 3 or more Vehicles in Household |
| Immigrants | Romania | 14.6 /100 | #204 | Poor 18.9% |
| Russians | 14.2 /100 | #205 | Poor 18.8% |
| Immigrants | Eastern Asia | 14.1 /100 | #206 | Poor 18.8% |
| Immigrants | Chile | 13.6 /100 | #207 | Poor 18.8% |
| Immigrants | Burma/Myanmar | 13.6 /100 | #208 | Poor 18.8% |
| Immigrants | Egypt | 13.5 /100 | #209 | Poor 18.8% |
| Bulgarians | 13.1 /100 | #210 | Poor 18.8% |
| Immigrants | Kenya | 12.4 /100 | #211 | Poor 18.8% |
| Panamanians | 11.6 /100 | #212 | Poor 18.8% |
| Immigrants | Cuba | 11.6 /100 | #213 | Poor 18.8% |
| Immigrants | Sierra Leone | 10.8 /100 | #214 | Poor 18.7% |
| Eastern Europeans | 10.6 /100 | #215 | Poor 18.7% |
| Immigrants | Nigeria | 10.3 /100 | #216 | Poor 18.7% |
| Immigrants | Italy | 10.2 /100 | #217 | Poor 18.7% |
| Immigrants | Portugal | 8.9 /100 | #218 | Tragic 18.6% |