Immigrants from Guatemala vs Trinidadian and Tobagonian 3 or more Vehicles in Household
COMPARE
Immigrants from Guatemala
Trinidadian and Tobagonian
3 or more Vehicles in Household
3 or more Vehicles in Household Comparison
Immigrants from Guatemala
Trinidadians and Tobagonians
19.7%
3 OR MORE VEHICLES IN HOUSEHOLD
65.6/ 100
METRIC RATING
161st/ 347
METRIC RANK
13.6%
3 OR MORE VEHICLES IN HOUSEHOLD
0.0/ 100
METRIC RATING
332nd/ 347
METRIC RANK
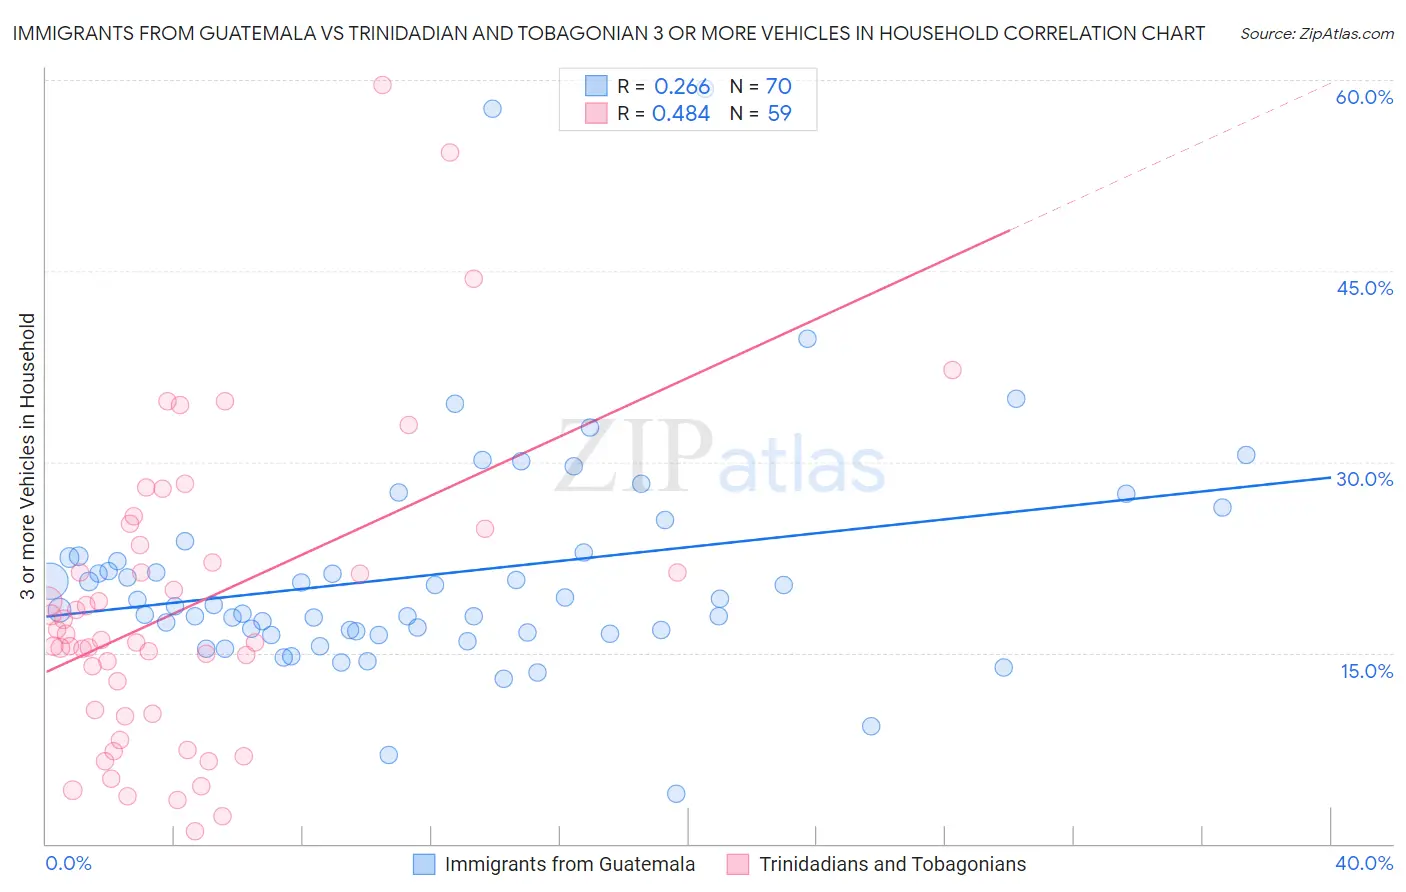
Immigrants from Guatemala vs Trinidadian and Tobagonian 3 or more Vehicles in Household Correlation Chart
The statistical analysis conducted on geographies consisting of 377,138,976 people shows a weak positive correlation between the proportion of Immigrants from Guatemala and percentage of households with 3 or more vehicles available in the United States with a correlation coefficient (R) of 0.266 and weighted average of 19.7%. Similarly, the statistical analysis conducted on geographies consisting of 219,661,129 people shows a moderate positive correlation between the proportion of Trinidadians and Tobagonians and percentage of households with 3 or more vehicles available in the United States with a correlation coefficient (R) of 0.484 and weighted average of 13.6%, a difference of 44.9%.
3 or more Vehicles in Household Correlation Summary
| Measurement | Immigrants from Guatemala | Trinidadian and Tobagonian |
| Minimum | 3.9% | 1.0% |
| Maximum | 59.3% | 59.6% |
| Range | 55.5% | 58.6% |
| Mean | 21.1% | 18.6% |
| Median | 18.7% | 16.0% |
| Interquartile 25% (IQ1) | 16.6% | 10.2% |
| Interquartile 75% (IQ3) | 22.6% | 23.5% |
| Interquartile Range (IQR) | 6.0% | 13.3% |
| Standard Deviation (Sample) | 9.0% | 11.9% |
| Standard Deviation (Population) | 9.0% | 11.8% |
Similar Demographics by 3 or more Vehicles in Household
Demographics Similar to Immigrants from Guatemala by 3 or more Vehicles in Household
In terms of 3 or more vehicles in household, the demographic groups most similar to Immigrants from Guatemala are Immigrants from Lebanon (19.8%, a difference of 0.16%), Estonian (19.7%, a difference of 0.19%), Chilean (19.7%, a difference of 0.21%), Immigrants from Pakistan (19.8%, a difference of 0.22%), and Yugoslavian (19.7%, a difference of 0.22%).
| Demographics | Rating | Rank | 3 or more Vehicles in Household |
| Immigrants | Jordan | 75.0 /100 | #154 | Good 19.9% |
| Tlingit-Haida | 73.4 /100 | #155 | Good 19.9% |
| Thais | 71.1 /100 | #156 | Good 19.8% |
| Hungarians | 70.5 /100 | #157 | Good 19.8% |
| Armenians | 68.8 /100 | #158 | Good 19.8% |
| Immigrants | Pakistan | 68.2 /100 | #159 | Good 19.8% |
| Immigrants | Lebanon | 67.6 /100 | #160 | Good 19.8% |
| Immigrants | Guatemala | 65.6 /100 | #161 | Good 19.7% |
| Estonians | 63.2 /100 | #162 | Good 19.7% |
| Chileans | 63.0 /100 | #163 | Good 19.7% |
| Yugoslavians | 62.9 /100 | #164 | Good 19.7% |
| Immigrants | Costa Rica | 61.9 /100 | #165 | Good 19.7% |
| Immigrants | Cameroon | 60.9 /100 | #166 | Good 19.7% |
| Ukrainians | 58.9 /100 | #167 | Average 19.6% |
| Peruvians | 58.8 /100 | #168 | Average 19.6% |
Demographics Similar to Trinidadians and Tobagonians by 3 or more Vehicles in Household
In terms of 3 or more vehicles in household, the demographic groups most similar to Trinidadians and Tobagonians are Immigrants from Cabo Verde (13.6%, a difference of 0.36%), Immigrants from Dominica (13.7%, a difference of 0.71%), West Indian (13.7%, a difference of 0.93%), Immigrants from Senegal (13.8%, a difference of 1.3%), and Immigrants from Ecuador (13.4%, a difference of 1.6%).
| Demographics | Rating | Rank | 3 or more Vehicles in Household |
| Senegalese | 0.0 /100 | #325 | Tragic 14.2% |
| Soviet Union | 0.0 /100 | #326 | Tragic 14.2% |
| Ecuadorians | 0.0 /100 | #327 | Tragic 14.1% |
| Immigrants | Albania | 0.0 /100 | #328 | Tragic 14.0% |
| Immigrants | Senegal | 0.0 /100 | #329 | Tragic 13.8% |
| West Indians | 0.0 /100 | #330 | Tragic 13.7% |
| Immigrants | Dominica | 0.0 /100 | #331 | Tragic 13.7% |
| Trinidadians and Tobagonians | 0.0 /100 | #332 | Tragic 13.6% |
| Immigrants | Cabo Verde | 0.0 /100 | #333 | Tragic 13.6% |
| Immigrants | Ecuador | 0.0 /100 | #334 | Tragic 13.4% |
| Immigrants | Trinidad and Tobago | 0.0 /100 | #335 | Tragic 13.3% |
| Barbadians | 0.0 /100 | #336 | Tragic 12.6% |
| Immigrants | Bangladesh | 0.0 /100 | #337 | Tragic 12.5% |
| Vietnamese | 0.0 /100 | #338 | Tragic 12.5% |
| Immigrants | Uzbekistan | 0.0 /100 | #339 | Tragic 12.0% |