Immigrants from Guatemala vs Lumbee 3 or more Vehicles in Household
COMPARE
Immigrants from Guatemala
Lumbee
3 or more Vehicles in Household
3 or more Vehicles in Household Comparison
Immigrants from Guatemala
Lumbee
19.7%
3 OR MORE VEHICLES IN HOUSEHOLD
65.6/ 100
METRIC RATING
161st/ 347
METRIC RANK
23.1%
3 OR MORE VEHICLES IN HOUSEHOLD
100.0/ 100
METRIC RATING
28th/ 347
METRIC RANK
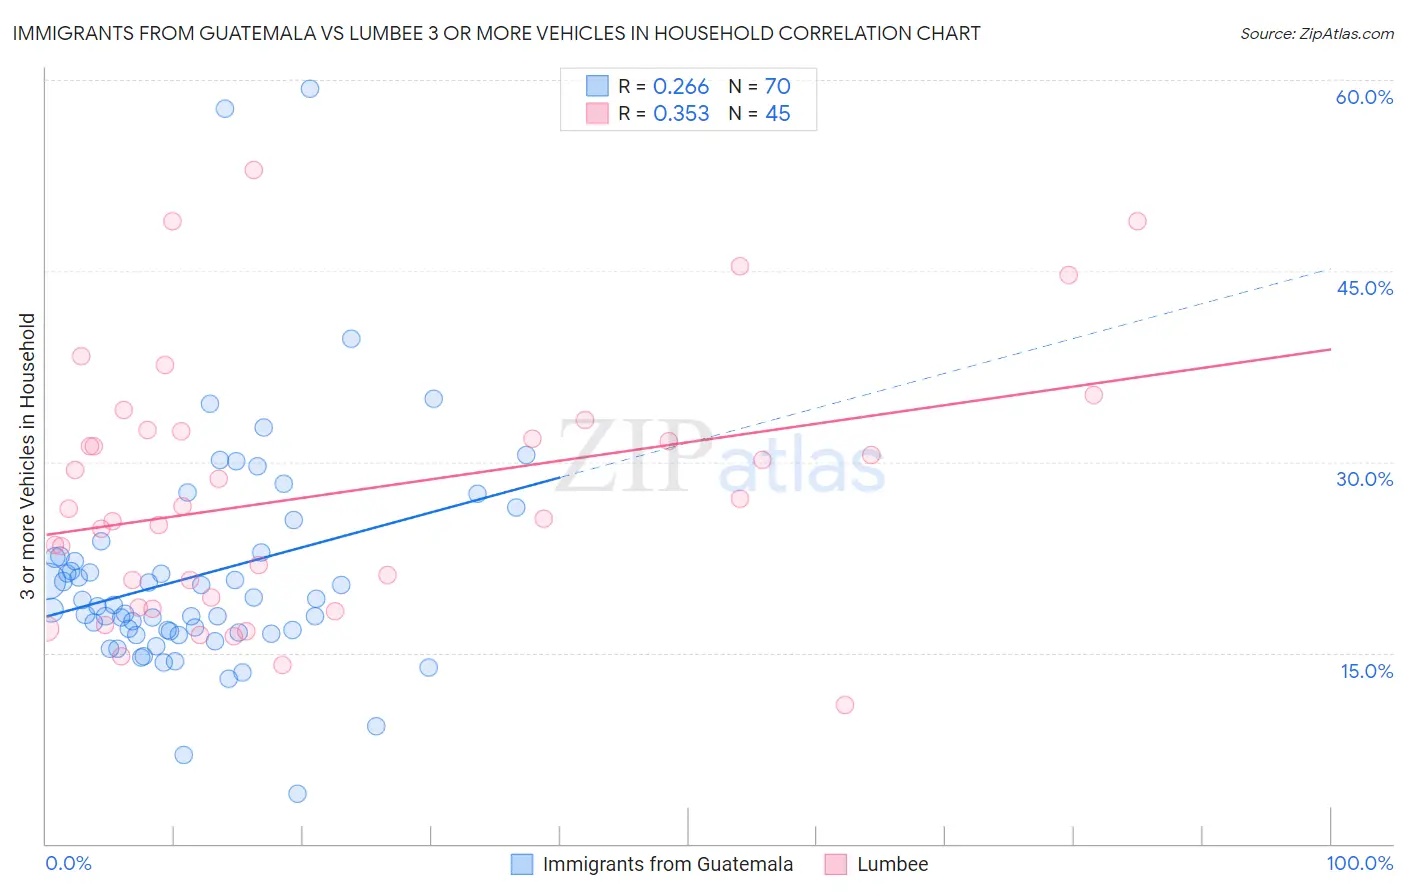
Immigrants from Guatemala vs Lumbee 3 or more Vehicles in Household Correlation Chart
The statistical analysis conducted on geographies consisting of 377,138,976 people shows a weak positive correlation between the proportion of Immigrants from Guatemala and percentage of households with 3 or more vehicles available in the United States with a correlation coefficient (R) of 0.266 and weighted average of 19.7%. Similarly, the statistical analysis conducted on geographies consisting of 92,258,443 people shows a mild positive correlation between the proportion of Lumbee and percentage of households with 3 or more vehicles available in the United States with a correlation coefficient (R) of 0.353 and weighted average of 23.1%, a difference of 17.3%.
3 or more Vehicles in Household Correlation Summary
| Measurement | Immigrants from Guatemala | Lumbee |
| Minimum | 3.9% | 10.9% |
| Maximum | 59.3% | 53.0% |
| Range | 55.5% | 42.0% |
| Mean | 21.1% | 27.5% |
| Median | 18.7% | 26.3% |
| Interquartile 25% (IQ1) | 16.6% | 19.0% |
| Interquartile 75% (IQ3) | 22.6% | 32.4% |
| Interquartile Range (IQR) | 6.0% | 13.4% |
| Standard Deviation (Sample) | 9.0% | 10.0% |
| Standard Deviation (Population) | 9.0% | 9.9% |
Similar Demographics by 3 or more Vehicles in Household
Demographics Similar to Immigrants from Guatemala by 3 or more Vehicles in Household
In terms of 3 or more vehicles in household, the demographic groups most similar to Immigrants from Guatemala are Immigrants from Lebanon (19.8%, a difference of 0.16%), Estonian (19.7%, a difference of 0.19%), Chilean (19.7%, a difference of 0.21%), Immigrants from Pakistan (19.8%, a difference of 0.22%), and Yugoslavian (19.7%, a difference of 0.22%).
| Demographics | Rating | Rank | 3 or more Vehicles in Household |
| Immigrants | Jordan | 75.0 /100 | #154 | Good 19.9% |
| Tlingit-Haida | 73.4 /100 | #155 | Good 19.9% |
| Thais | 71.1 /100 | #156 | Good 19.8% |
| Hungarians | 70.5 /100 | #157 | Good 19.8% |
| Armenians | 68.8 /100 | #158 | Good 19.8% |
| Immigrants | Pakistan | 68.2 /100 | #159 | Good 19.8% |
| Immigrants | Lebanon | 67.6 /100 | #160 | Good 19.8% |
| Immigrants | Guatemala | 65.6 /100 | #161 | Good 19.7% |
| Estonians | 63.2 /100 | #162 | Good 19.7% |
| Chileans | 63.0 /100 | #163 | Good 19.7% |
| Yugoslavians | 62.9 /100 | #164 | Good 19.7% |
| Immigrants | Costa Rica | 61.9 /100 | #165 | Good 19.7% |
| Immigrants | Cameroon | 60.9 /100 | #166 | Good 19.7% |
| Ukrainians | 58.9 /100 | #167 | Average 19.6% |
| Peruvians | 58.8 /100 | #168 | Average 19.6% |
Demographics Similar to Lumbee by 3 or more Vehicles in Household
In terms of 3 or more vehicles in household, the demographic groups most similar to Lumbee are Spanish (23.1%, a difference of 0.070%), Immigrants from South Eastern Asia (23.1%, a difference of 0.24%), Guamanian/Chamorro (23.2%, a difference of 0.33%), English (23.1%, a difference of 0.43%), and Mexican American Indian (23.3%, a difference of 0.47%).
| Demographics | Rating | Rank | 3 or more Vehicles in Household |
| Immigrants | Vietnam | 100.0 /100 | #21 | Exceptional 23.8% |
| Immigrants | Philippines | 100.0 /100 | #22 | Exceptional 23.8% |
| Scandinavians | 100.0 /100 | #23 | Exceptional 23.6% |
| Sri Lankans | 100.0 /100 | #24 | Exceptional 23.6% |
| Immigrants | Central America | 100.0 /100 | #25 | Exceptional 23.4% |
| Mexican American Indians | 100.0 /100 | #26 | Exceptional 23.3% |
| Guamanians/Chamorros | 100.0 /100 | #27 | Exceptional 23.2% |
| Lumbee | 100.0 /100 | #28 | Exceptional 23.1% |
| Spanish | 100.0 /100 | #29 | Exceptional 23.1% |
| Immigrants | South Eastern Asia | 100.0 /100 | #30 | Exceptional 23.1% |
| English | 100.0 /100 | #31 | Exceptional 23.1% |
| Pueblo | 100.0 /100 | #32 | Exceptional 23.0% |
| Spanish Americans | 100.0 /100 | #33 | Exceptional 23.0% |
| Swiss | 100.0 /100 | #34 | Exceptional 23.0% |
| Choctaw | 100.0 /100 | #35 | Exceptional 23.0% |