Immigrants from Egypt vs Maltese 3 or more Vehicles in Household
COMPARE
Immigrants from Egypt
Maltese
3 or more Vehicles in Household
3 or more Vehicles in Household Comparison
Immigrants from Egypt
Maltese
18.8%
3 OR MORE VEHICLES IN HOUSEHOLD
13.5/ 100
METRIC RATING
209th/ 347
METRIC RANK
20.5%
3 OR MORE VEHICLES IN HOUSEHOLD
93.9/ 100
METRIC RATING
120th/ 347
METRIC RANK
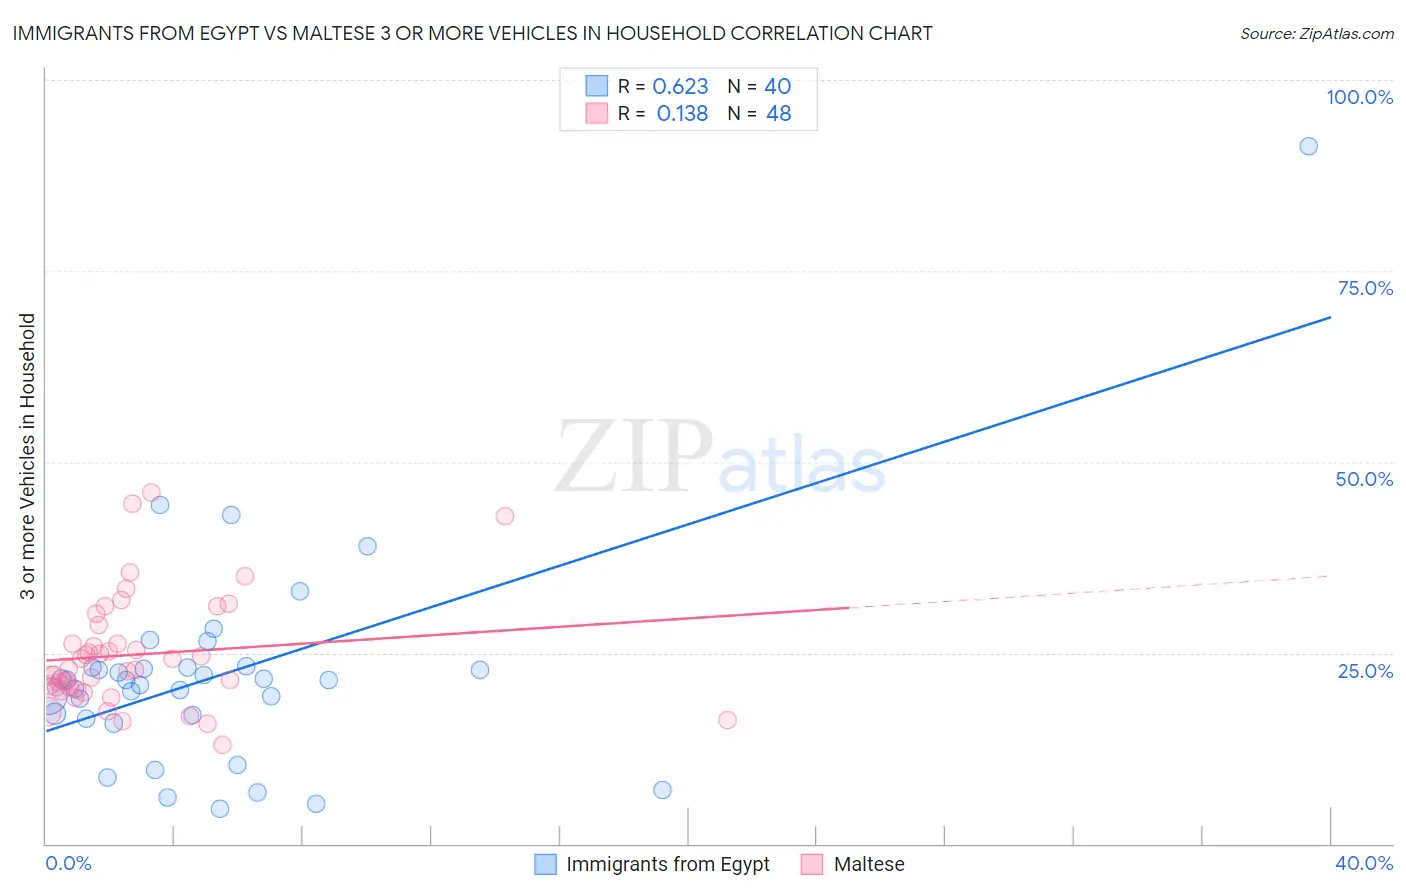
Immigrants from Egypt vs Maltese 3 or more Vehicles in Household Correlation Chart
The statistical analysis conducted on geographies consisting of 245,380,289 people shows a significant positive correlation between the proportion of Immigrants from Egypt and percentage of households with 3 or more vehicles available in the United States with a correlation coefficient (R) of 0.623 and weighted average of 18.8%. Similarly, the statistical analysis conducted on geographies consisting of 126,427,013 people shows a poor positive correlation between the proportion of Maltese and percentage of households with 3 or more vehicles available in the United States with a correlation coefficient (R) of 0.138 and weighted average of 20.5%, a difference of 9.0%.
3 or more Vehicles in Household Correlation Summary
| Measurement | Immigrants from Egypt | Maltese |
| Minimum | 4.5% | 12.9% |
| Maximum | 91.3% | 45.9% |
| Range | 86.8% | 33.0% |
| Mean | 22.1% | 24.8% |
| Median | 21.4% | 22.8% |
| Interquartile 25% (IQ1) | 16.6% | 20.2% |
| Interquartile 75% (IQ3) | 23.1% | 27.4% |
| Interquartile Range (IQR) | 6.5% | 7.1% |
| Standard Deviation (Sample) | 14.5% | 7.3% |
| Standard Deviation (Population) | 14.3% | 7.2% |
Similar Demographics by 3 or more Vehicles in Household
Demographics Similar to Immigrants from Egypt by 3 or more Vehicles in Household
In terms of 3 or more vehicles in household, the demographic groups most similar to Immigrants from Egypt are Immigrants from Burma/Myanmar (18.8%, a difference of 0.010%), Immigrants from Chile (18.8%, a difference of 0.020%), Bulgarian (18.8%, a difference of 0.080%), Immigrants from Eastern Asia (18.8%, a difference of 0.10%), and Russian (18.8%, a difference of 0.11%).
| Demographics | Rating | Rank | 3 or more Vehicles in Household |
| Immigrants | Austria | 15.4 /100 | #202 | Poor 18.9% |
| Tohono O'odham | 14.8 /100 | #203 | Poor 18.9% |
| Immigrants | Romania | 14.6 /100 | #204 | Poor 18.9% |
| Russians | 14.2 /100 | #205 | Poor 18.8% |
| Immigrants | Eastern Asia | 14.1 /100 | #206 | Poor 18.8% |
| Immigrants | Chile | 13.6 /100 | #207 | Poor 18.8% |
| Immigrants | Burma/Myanmar | 13.6 /100 | #208 | Poor 18.8% |
| Immigrants | Egypt | 13.5 /100 | #209 | Poor 18.8% |
| Bulgarians | 13.1 /100 | #210 | Poor 18.8% |
| Immigrants | Kenya | 12.4 /100 | #211 | Poor 18.8% |
| Panamanians | 11.6 /100 | #212 | Poor 18.8% |
| Immigrants | Cuba | 11.6 /100 | #213 | Poor 18.8% |
| Immigrants | Sierra Leone | 10.8 /100 | #214 | Poor 18.7% |
| Eastern Europeans | 10.6 /100 | #215 | Poor 18.7% |
| Immigrants | Nigeria | 10.3 /100 | #216 | Poor 18.7% |
Demographics Similar to Maltese by 3 or more Vehicles in Household
In terms of 3 or more vehicles in household, the demographic groups most similar to Maltese are Immigrants from Thailand (20.5%, a difference of 0.010%), German Russian (20.5%, a difference of 0.060%), Immigrants from Korea (20.5%, a difference of 0.060%), Immigrants from Latin America (20.5%, a difference of 0.19%), and Costa Rican (20.6%, a difference of 0.23%).
| Demographics | Rating | Rank | 3 or more Vehicles in Household |
| Immigrants | England | 96.2 /100 | #113 | Exceptional 20.7% |
| Burmese | 95.8 /100 | #114 | Exceptional 20.6% |
| French Canadians | 95.0 /100 | #115 | Exceptional 20.6% |
| Italians | 94.9 /100 | #116 | Exceptional 20.6% |
| Croatians | 94.9 /100 | #117 | Exceptional 20.6% |
| Costa Ricans | 94.6 /100 | #118 | Exceptional 20.6% |
| Immigrants | Latin America | 94.5 /100 | #119 | Exceptional 20.5% |
| Maltese | 93.9 /100 | #120 | Exceptional 20.5% |
| Immigrants | Thailand | 93.8 /100 | #121 | Exceptional 20.5% |
| German Russians | 93.7 /100 | #122 | Exceptional 20.5% |
| Immigrants | Korea | 93.7 /100 | #123 | Exceptional 20.5% |
| Central Americans | 93.1 /100 | #124 | Exceptional 20.5% |
| Immigrants | Netherlands | 92.9 /100 | #125 | Exceptional 20.4% |
| Slavs | 92.1 /100 | #126 | Exceptional 20.4% |
| Immigrants | Bolivia | 92.0 /100 | #127 | Exceptional 20.4% |