Egyptian 4 or more Vehicles in Household
COMPARE
Egyptian
Select to Compare
4 or more Vehicles in Household
Egyptian 4 or more Vehicles in Household
6.1%
4+ VEHICLES AVAILABLE
21.4/ 100
METRIC RATING
201st/ 347
METRIC RANK
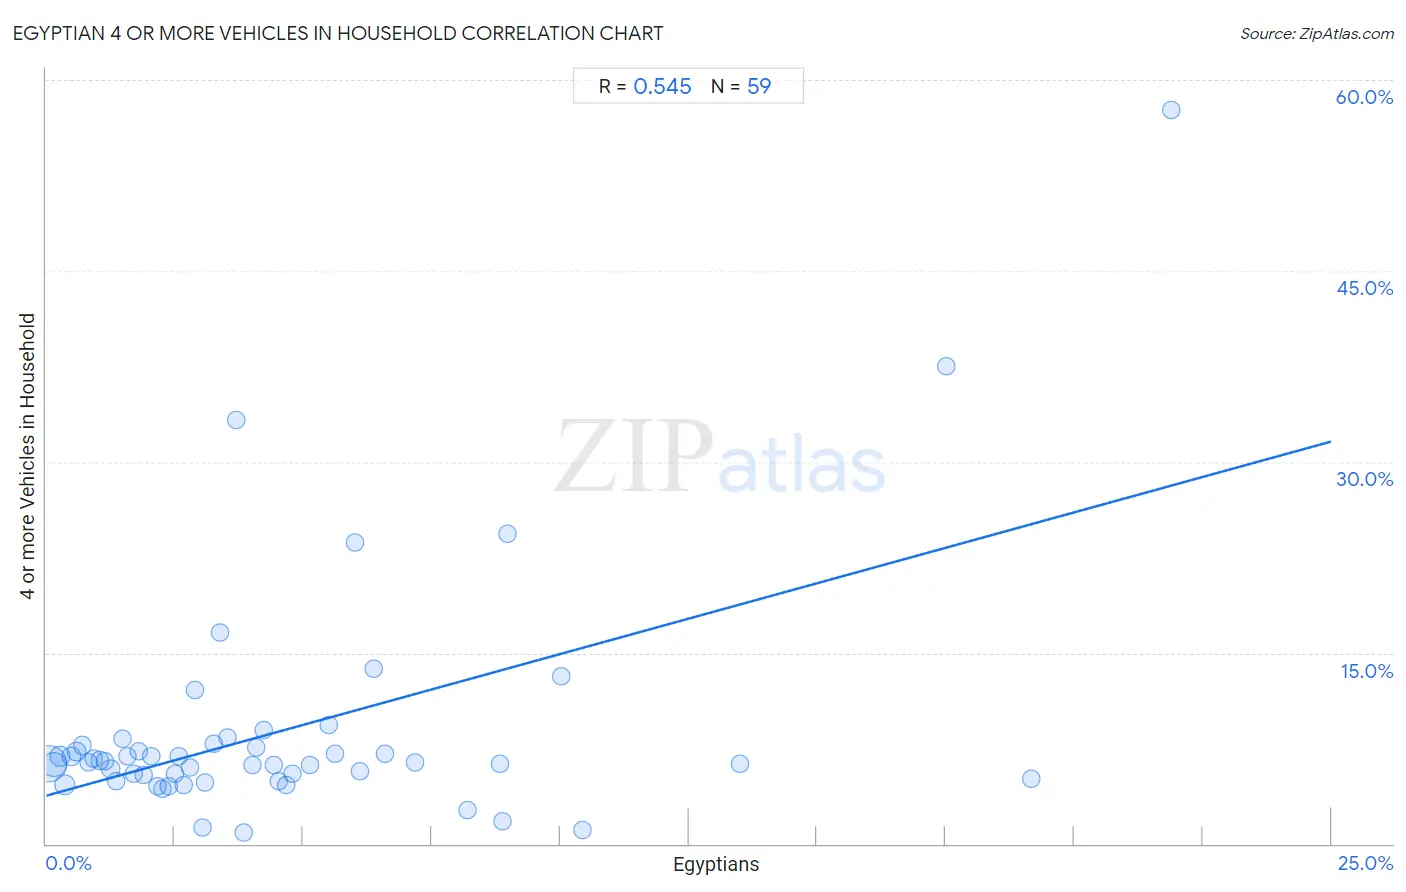
Egyptian 4 or more Vehicles in Household Correlation Chart
The statistical analysis conducted on geographies consisting of 275,639,232 people shows a substantial positive correlation between the proportion of Egyptians and percentage of households with 4 or more vehicles available in the United States with a correlation coefficient (R) of 0.545 and weighted average of 6.1%. On average, for every 1% (one percent) increase in Egyptians within a typical geography, there is an increase of 1.1% in percentage of households with 4 or more vehicles available.
It is essential to understand that the correlation between the percentage of Egyptians and percentage of households with 4 or more vehicles available does not imply a direct cause-and-effect relationship. It remains uncertain whether the presence of Egyptians influences an upward or downward trend in the level of percentage of households with 4 or more vehicles available within an area, or if Egyptians simply ended up residing in those areas with higher or lower levels of percentage of households with 4 or more vehicles available due to other factors.
Demographics Similar to Egyptians by 4 or more Vehicles in Household
In terms of 4 or more vehicles in household, the demographic groups most similar to Egyptians are Immigrants from South Central Asia (6.1%, a difference of 0.010%), Latvian (6.1%, a difference of 0.050%), Immigrants from Norway (6.1%, a difference of 0.060%), Immigrants from Portugal (6.1%, a difference of 0.14%), and Immigrants from Sierra Leone (6.1%, a difference of 0.15%).
| Demographics | Rating | Rank | 4 or more Vehicles in Household |
| Immigrants from Sweden | 27.0 /100 | #194 | Fair 6.2% |
| Argentineans | 27.0 /100 | #195 | Fair 6.2% |
| Tsimshian | 26.4 /100 | #196 | Fair 6.2% |
| Immigrants from Sri Lanka | 23.7 /100 | #197 | Fair 6.1% |
| Immigrants from Portugal | 22.3 /100 | #198 | Fair 6.1% |
| Immigrants from Norway | 21.8 /100 | #199 | Fair 6.1% |
| Latvians | 21.7 /100 | #200 | Fair 6.1% |
| Egyptians | 21.4 /100 | #201 | Fair 6.1% |
| Immigrants from South Central Asia | 21.3 /100 | #202 | Fair 6.1% |
| Immigrants from Sierra Leone | 20.5 /100 | #203 | Fair 6.1% |
| Immigrants from Belize | 19.8 /100 | #204 | Poor 6.1% |
| Hondurans | 19.3 /100 | #205 | Poor 6.1% |
| Kenyans | 18.5 /100 | #206 | Poor 6.1% |
| Immigrants from Chile | 16.9 /100 | #207 | Poor 6.1% |
| Immigrants from Nigeria | 15.6 /100 | #208 | Poor 6.1% |
Egyptian 4 or more Vehicles in Household Correlation Summary
| Measurement | Egyptian Data | 4 or more Vehicles in Household Data |
| Minimum | 0.048% | 0.85% |
| Maximum | 21.9% | 57.7% |
| Range | 21.8% | 56.8% |
| Mean | 4.6% | 8.9% |
| Median | 3.3% | 6.4% |
| Interquartile 25% (IQ1) | 1.6% | 5.1% |
| Interquartile 75% (IQ3) | 6.0% | 7.7% |
| Interquartile Range (IQR) | 4.4% | 2.6% |
| Standard Deviation (Sample) | 4.6% | 9.3% |
| Standard Deviation (Population) | 4.5% | 9.2% |
Correlation Details
| Egyptian Percentile | Sample Size | 4 or more Vehicles in Household |
[ 0.0% - 0.5% ] 0.048% | 148,176,739 | 6.3% |
[ 0.0% - 0.5% ] 0.16% | 56,979,211 | 6.2% |
[ 0.0% - 0.5% ] 0.27% | 19,970,799 | 6.9% |
[ 0.0% - 0.5% ] 0.36% | 22,679,458 | 4.6% |
[ 0.0% - 0.5% ] 0.49% | 7,387,730 | 6.9% |
[ 0.5% - 1.0% ] 0.60% | 4,820,787 | 7.2% |
[ 0.5% - 1.0% ] 0.70% | 3,204,584 | 7.7% |
[ 0.5% - 1.0% ] 0.82% | 2,390,343 | 6.4% |
[ 0.5% - 1.0% ] 0.93% | 1,793,571 | 6.7% |
[ 1.0% - 1.5% ] 1.04% | 1,959,392 | 6.5% |
[ 1.0% - 1.5% ] 1.14% | 855,863 | 6.5% |
[ 1.0% - 1.5% ] 1.25% | 676,576 | 5.9% |
[ 1.0% - 1.5% ] 1.35% | 770,371 | 5.0% |
[ 1.0% - 1.5% ] 1.48% | 389,448 | 8.3% |
[ 1.5% - 2.0% ] 1.59% | 409,088 | 6.9% |
[ 1.5% - 2.0% ] 1.69% | 486,548 | 5.5% |
[ 1.5% - 2.0% ] 1.80% | 290,419 | 7.3% |
[ 1.5% - 2.0% ] 1.89% | 742,845 | 5.4% |
[ 2.0% - 2.5% ] 2.04% | 262,183 | 6.9% |
[ 2.0% - 2.5% ] 2.16% | 122,258 | 4.5% |
[ 2.0% - 2.5% ] 2.27% | 25,474 | 4.3% |
[ 2.0% - 2.5% ] 2.37% | 77,570 | 4.6% |
[ 2.5% - 3.0% ] 2.51% | 9,255 | 5.5% |
[ 2.5% - 3.0% ] 2.58% | 159,607 | 6.8% |
[ 2.5% - 3.0% ] 2.66% | 143,734 | 4.6% |
[ 2.5% - 3.0% ] 2.79% | 96,434 | 6.0% |
[ 2.5% - 3.0% ] 2.90% | 3,828 | 12.1% |
[ 3.0% - 3.5% ] 3.03% | 77,913 | 1.3% |
[ 3.0% - 3.5% ] 3.10% | 113,569 | 4.8% |
[ 3.0% - 3.5% ] 3.25% | 9,596 | 7.9% |
[ 3.0% - 3.5% ] 3.38% | 5,444 | 16.6% |
[ 3.5% - 4.0% ] 3.53% | 18,086 | 8.4% |
[ 3.5% - 4.0% ] 3.70% | 81 | 33.3% |
[ 3.5% - 4.0% ] 3.83% | 58,053 | 0.85% |
[ 4.0% - 4.5% ] 4.01% | 5,835 | 6.2% |
[ 4.0% - 4.5% ] 4.09% | 60,303 | 7.6% |
[ 4.0% - 4.5% ] 4.22% | 13,070 | 9.0% |
[ 4.0% - 4.5% ] 4.44% | 36,823 | 6.2% |
[ 4.5% - 5.0% ] 4.52% | 155 | 4.9% |
[ 4.5% - 5.0% ] 4.67% | 52,230 | 4.6% |
[ 4.5% - 5.0% ] 4.79% | 4,782 | 5.5% |
[ 5.0% - 5.5% ] 5.13% | 99,800 | 6.2% |
[ 5.0% - 5.5% ] 5.49% | 601 | 9.3% |
[ 5.5% - 6.0% ] 5.61% | 659 | 7.1% |
[ 5.5% - 6.0% ] 5.99% | 3,553 | 23.7% |
[ 6.0% - 6.5% ] 6.10% | 6,952 | 5.7% |
[ 6.0% - 6.5% ] 6.36% | 14,518 | 13.7% |
[ 6.5% - 7.0% ] 6.59% | 8,410 | 7.0% |
[ 7.0% - 7.5% ] 7.17% | 7,017 | 6.4% |
[ 8.0% - 8.5% ] 8.20% | 140,994 | 2.7% |
[ 8.5% - 9.0% ] 8.83% | 1,155 | 6.2% |
[ 8.5% - 9.0% ] 8.89% | 1,429 | 1.8% |
[ 8.5% - 9.0% ] 8.97% | 747 | 24.4% |
[ 10.0% - 10.5% ] 10.02% | 5,751 | 13.1% |
[ 10.0% - 10.5% ] 10.44% | 5,000 | 1.1% |
[ 13.0% - 13.5% ] 13.49% | 1,394 | 6.3% |
[ 17.0% - 17.5% ] 17.50% | 120 | 37.5% |
[ 19.0% - 19.5% ] 19.16% | 981 | 5.1% |
[ 21.5% - 22.0% ] 21.88% | 96 | 57.7% |