Souris, ND Map & Demographics
Souris Map
Souris Overview
$50,888
PER CAPITA INCOME
$111,250
AVG FAMILY INCOME
$66,250
AVG HOUSEHOLD INCOME
0.33
INEQUALITY / GINI INDEX
57
TOTAL POPULATION
44
MALE POPULATION
13
FEMALE POPULATION
338.46
MALES / 100 FEMALES
29.55
FEMALES / 100 MALES
53.3
MEDIAN AGE
3.4
AVG FAMILY SIZE
1.5
AVG HOUSEHOLD SIZE
29
LABOR FORCE [ PEOPLE ]
56.9%
PERCENT IN LABOR FORCE
Souris Zip Codes
Souris Area Codes
Income in Souris
Income Overview in Souris
Per Capita Income in Souris is $50,888, while median incomes of families and households are $111,250 and $66,250 respectively.
| Characteristic | Number | Measure |
| Per Capita Income | 57 | $50,888 |
| Median Family Income | 7 | $111,250 |
| Mean Family Income | 7 | $112,400 |
| Median Household Income | 37 | $66,250 |
| Mean Household Income | 37 | $75,070 |
| Income Deficit | 7 | $0 |
| Wage / Income Gap (%) | 57 | 0.00% |
| Wage / Income Gap ($) | 57 | 100.00¢ per $1 |
| Gini / Inequality Index | 57 | 0.33 |
Earnings by Sex in Souris
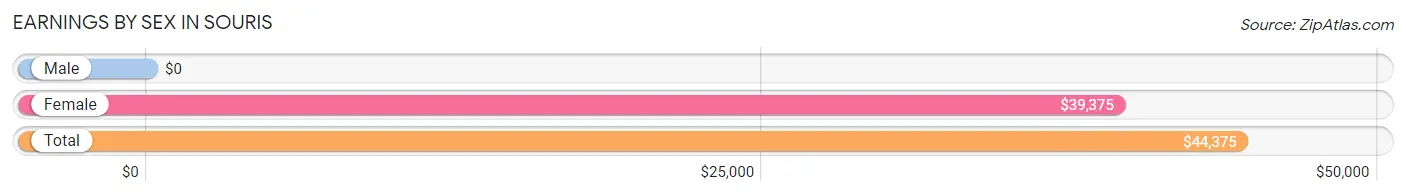
| Sex | Number | Average Earnings |
| Male | 21 (70.0%) | $0 |
| Female | 9 (30.0%) | $39,375 |
| Total | 30 (100.0%) | $44,375 |
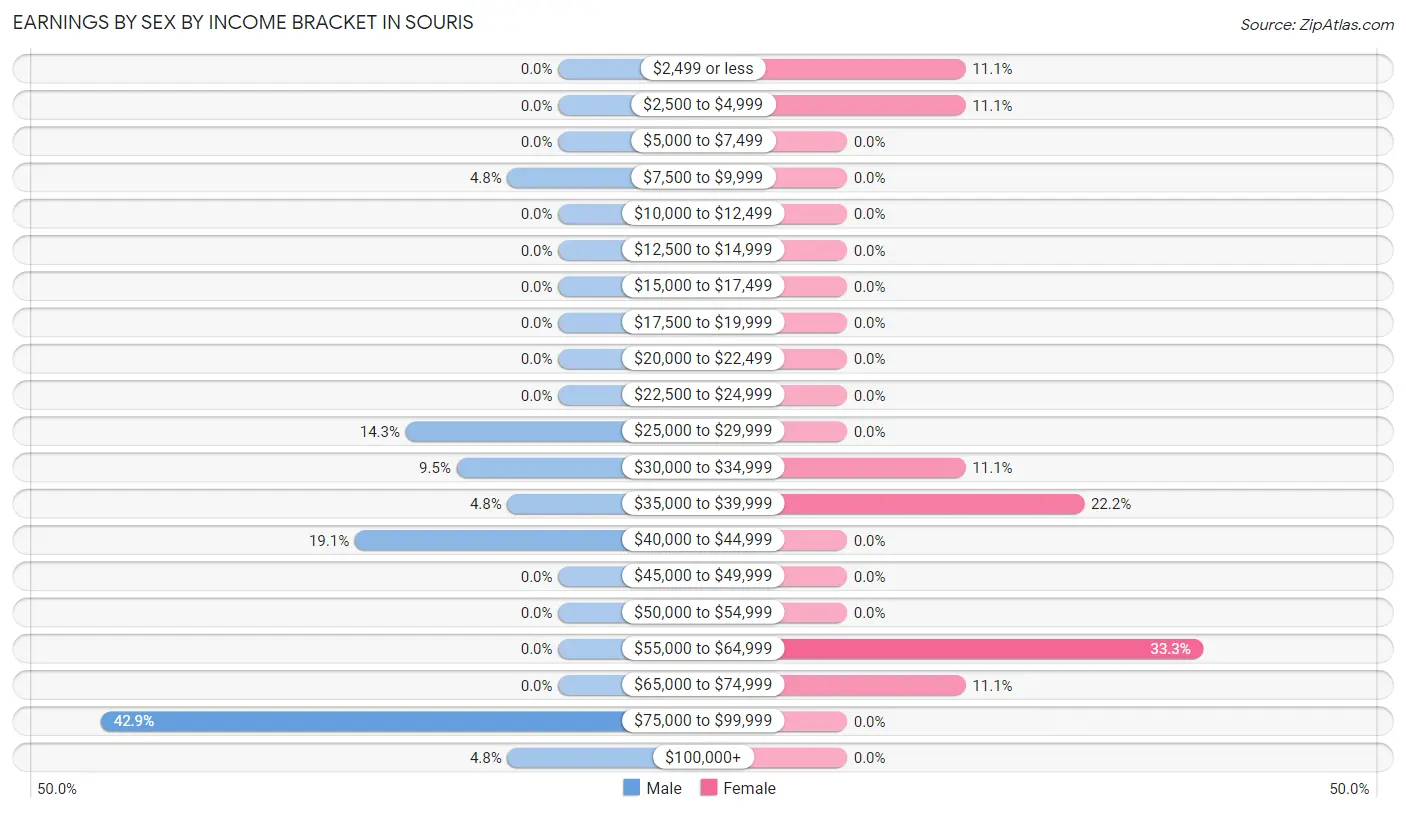
Earnings by Sex by Income Bracket in Souris
The most common earnings brackets in Souris are $75,000 to $99,999 for men (9 | 42.9%) and $55,000 to $64,999 for women (3 | 33.3%).
| Income | Male | Female |
| $2,499 or less | 0 (0.0%) | 1 (11.1%) |
| $2,500 to $4,999 | 0 (0.0%) | 1 (11.1%) |
| $5,000 to $7,499 | 0 (0.0%) | 0 (0.0%) |
| $7,500 to $9,999 | 1 (4.8%) | 0 (0.0%) |
| $10,000 to $12,499 | 0 (0.0%) | 0 (0.0%) |
| $12,500 to $14,999 | 0 (0.0%) | 0 (0.0%) |
| $15,000 to $17,499 | 0 (0.0%) | 0 (0.0%) |
| $17,500 to $19,999 | 0 (0.0%) | 0 (0.0%) |
| $20,000 to $22,499 | 0 (0.0%) | 0 (0.0%) |
| $22,500 to $24,999 | 0 (0.0%) | 0 (0.0%) |
| $25,000 to $29,999 | 3 (14.3%) | 0 (0.0%) |
| $30,000 to $34,999 | 2 (9.5%) | 1 (11.1%) |
| $35,000 to $39,999 | 1 (4.8%) | 2 (22.2%) |
| $40,000 to $44,999 | 4 (19.1%) | 0 (0.0%) |
| $45,000 to $49,999 | 0 (0.0%) | 0 (0.0%) |
| $50,000 to $54,999 | 0 (0.0%) | 0 (0.0%) |
| $55,000 to $64,999 | 0 (0.0%) | 3 (33.3%) |
| $65,000 to $74,999 | 0 (0.0%) | 1 (11.1%) |
| $75,000 to $99,999 | 9 (42.9%) | 0 (0.0%) |
| $100,000+ | 1 (4.8%) | 0 (0.0%) |
| Total | 21 (100.0%) | 9 (100.0%) |
Earnings by Sex by Educational Attainment in Souris
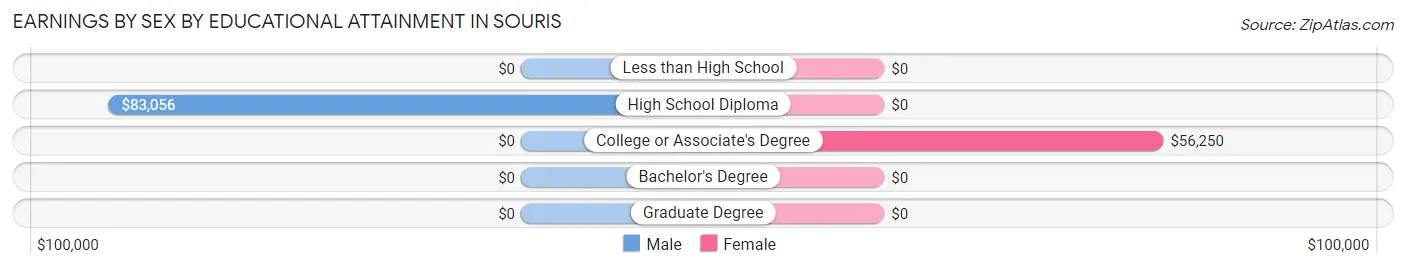
| Educational Attainment | Male Income | Female Income |
| Less than High School | - | - |
| High School Diploma | $83,056 | $0 |
| College or Associate's Degree | - | - |
| Bachelor's Degree | - | - |
| Graduate Degree | - | - |
| Total | - | - |
Family Income in Souris
Family Income Brackets in Souris
According to the Souris family income data, there are 3 families falling into the $100,000 to $149,999 income range, which is the most common income bracket and makes up 42.9% of all families.
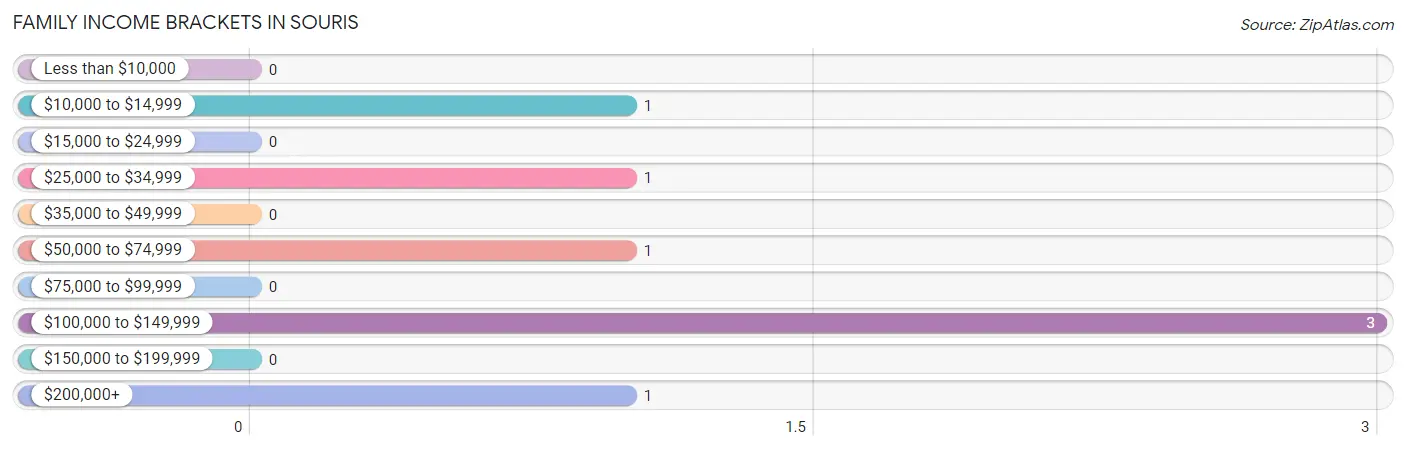
| Income Bracket | # Families | % Families |
| Less than $10,000 | 0 | 0.0% |
| $10,000 to $14,999 | 1 | 14.3% |
| $15,000 to $24,999 | 0 | 0.0% |
| $25,000 to $34,999 | 1 | 14.3% |
| $35,000 to $49,999 | 0 | 0.0% |
| $50,000 to $74,999 | 1 | 14.3% |
| $75,000 to $99,999 | 0 | 0.0% |
| $100,000 to $149,999 | 3 | 42.9% |
| $150,000 to $199,999 | 0 | 0.0% |
| $200,000+ | 1 | 14.3% |
Family Income by Famaliy Size in Souris
2-person families (5 | 71.4%) account for the highest median family income in Souris with $145,625 per family, while 2-person families (5 | 71.4%) have the highest median income of $72,812 per family member.
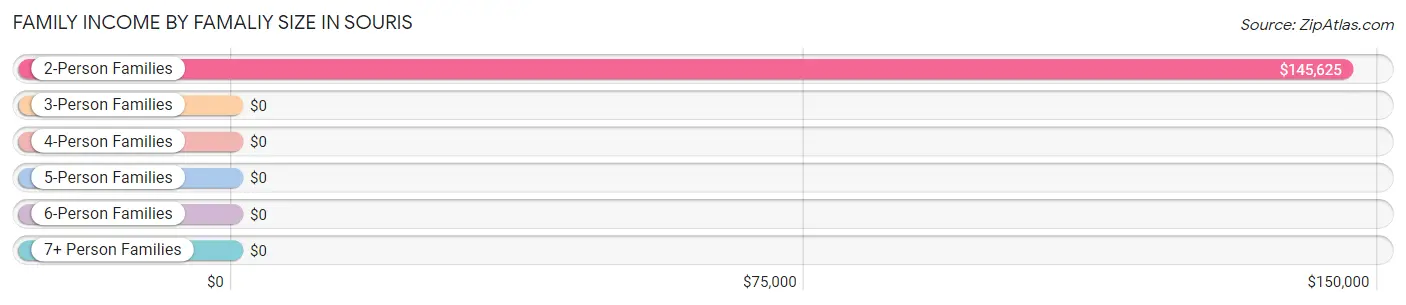
| Income Bracket | # Families | Median Income |
| 2-Person Families | 5 (71.4%) | $145,625 |
| 3-Person Families | 0 (0.0%) | $0 |
| 4-Person Families | 0 (0.0%) | $0 |
| 5-Person Families | 2 (28.6%) | $0 |
| 6-Person Families | 0 (0.0%) | $0 |
| 7+ Person Families | 0 (0.0%) | $0 |
| Total | 7 (100.0%) | $111,250 |
Family Income by Number of Earners in Souris
| Number of Earners | # Families | Median Income |
| No Earners | 0 (0.0%) | $0 |
| 1 Earner | 3 (42.9%) | $0 |
| 2 Earners | 4 (57.1%) | $0 |
| 3+ Earners | 0 (0.0%) | $0 |
| Total | 7 (100.0%) | $111,250 |
Household Income in Souris
Household Income Brackets in Souris
With 11 households falling in the category, the $25,000 to $34,999 income range is the most frequent in Souris, accounting for 29.7% of all households.
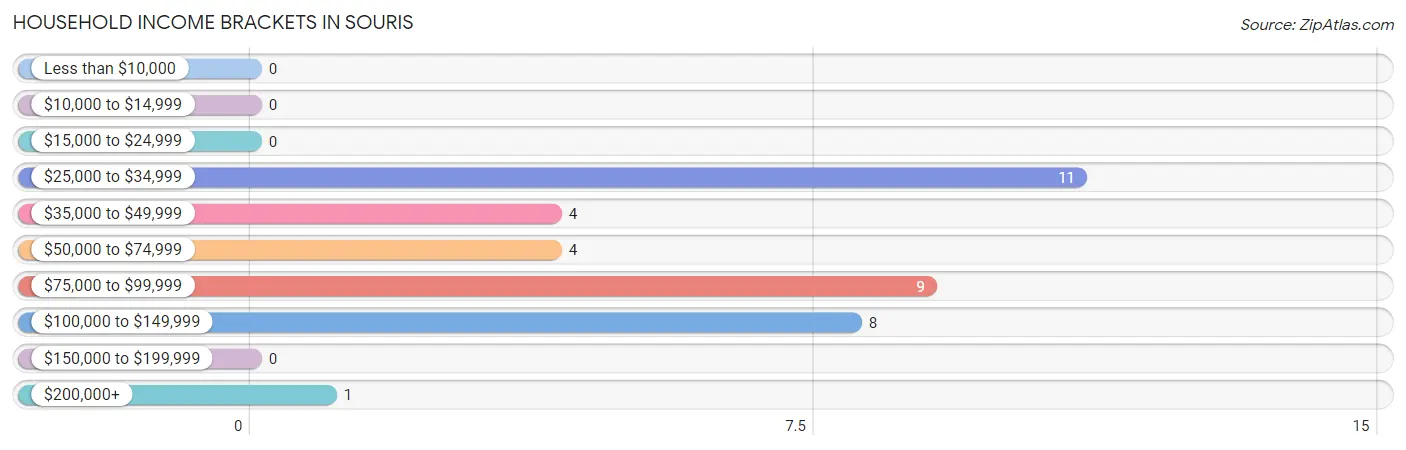
| Income Bracket | # Households | % Households |
| Less than $10,000 | 0 | 0.0% |
| $10,000 to $14,999 | 0 | 0.0% |
| $15,000 to $24,999 | 0 | 0.0% |
| $25,000 to $34,999 | 11 | 29.7% |
| $35,000 to $49,999 | 4 | 10.8% |
| $50,000 to $74,999 | 4 | 10.8% |
| $75,000 to $99,999 | 9 | 24.3% |
| $100,000 to $149,999 | 8 | 21.6% |
| $150,000 to $199,999 | 0 | 0.0% |
| $200,000+ | 1 | 2.7% |
Household Income by Householder Age in Souris
The median household income in Souris is $66,250, with the highest median household income of $121,500 found in the 45 to 64 years age bracket for the primary householder. A total of 10 households (27.0%) fall into this category.
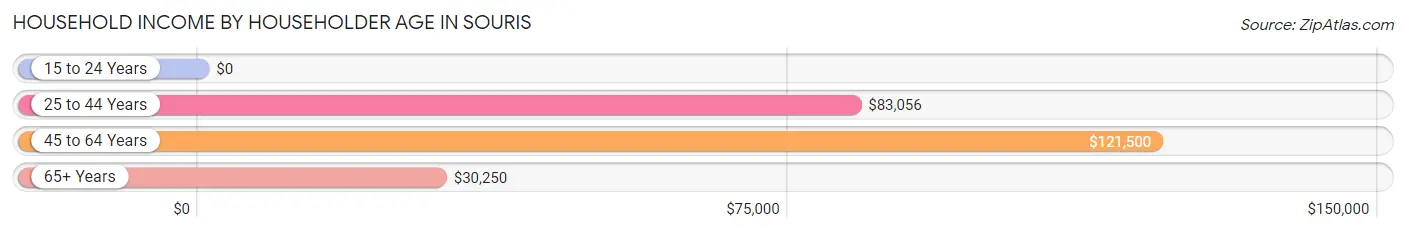
| Income Bracket | # Households | Median Income |
| 15 to 24 Years | 0 (0.0%) | $0 |
| 25 to 44 Years | 14 (37.8%) | $83,056 |
| 45 to 64 Years | 10 (27.0%) | $121,500 |
| 65+ Years | 13 (35.1%) | $30,250 |
| Total | 37 (100.0%) | $66,250 |
Poverty in Souris
Income Below Poverty by Sex and Age in Souris
With 13.6% poverty level for males and 38.5% for females among the residents of Souris, 6 to 11 year old males and 12 to 14 year old females are the most vulnerable to poverty, with 1 males (100.0%) and 1 females (100.0%) in their respective age groups living below the poverty level.
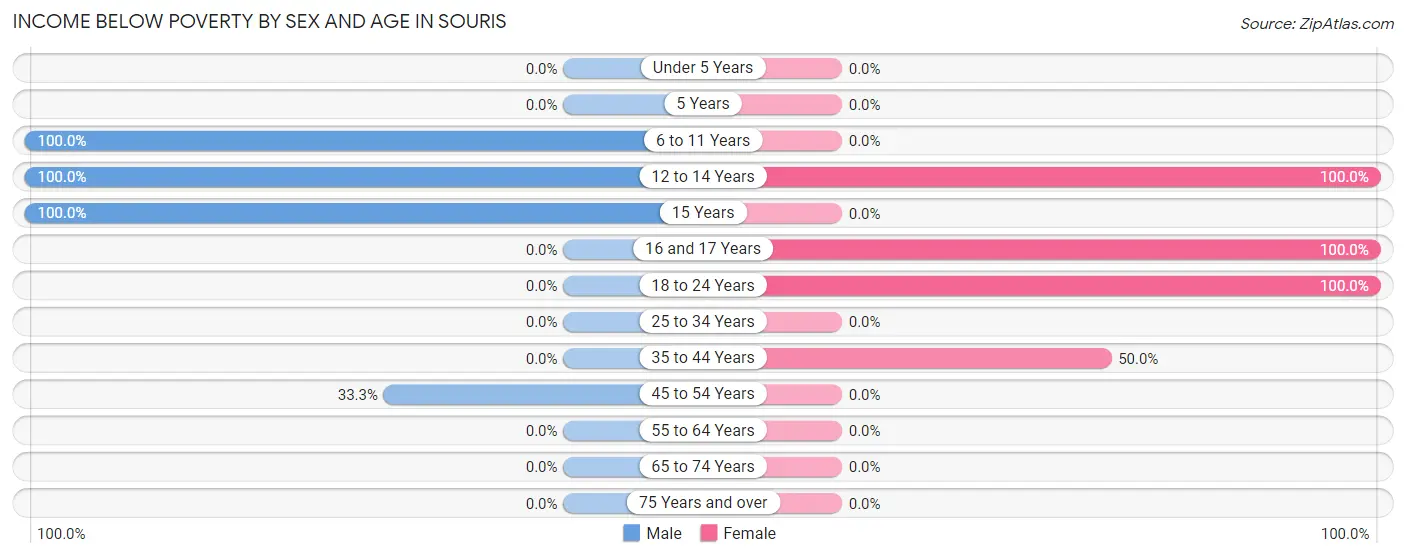
| Age Bracket | Male | Female |
| Under 5 Years | 0 (0.0%) | 0 (0.0%) |
| 5 Years | 0 (0.0%) | 0 (0.0%) |
| 6 to 11 Years | 1 (100.0%) | 0 (0.0%) |
| 12 to 14 Years | 3 (100.0%) | 1 (100.0%) |
| 15 Years | 1 (100.0%) | 0 (0.0%) |
| 16 and 17 Years | 0 (0.0%) | 2 (100.0%) |
| 18 to 24 Years | 0 (0.0%) | 1 (100.0%) |
| 25 to 34 Years | 0 (0.0%) | 0 (0.0%) |
| 35 to 44 Years | 0 (0.0%) | 1 (50.0%) |
| 45 to 54 Years | 1 (33.3%) | 0 (0.0%) |
| 55 to 64 Years | 0 (0.0%) | 0 (0.0%) |
| 65 to 74 Years | 0 (0.0%) | 0 (0.0%) |
| 75 Years and over | 0 (0.0%) | 0 (0.0%) |
| Total | 6 (13.6%) | 5 (38.5%) |
Income Above Poverty by Sex and Age in Souris
According to the poverty statistics in Souris, males aged 25 to 34 years and females aged 45 to 54 years are the age groups that are most secure financially, with 100.0% of males and 100.0% of females in these age groups living above the poverty line.
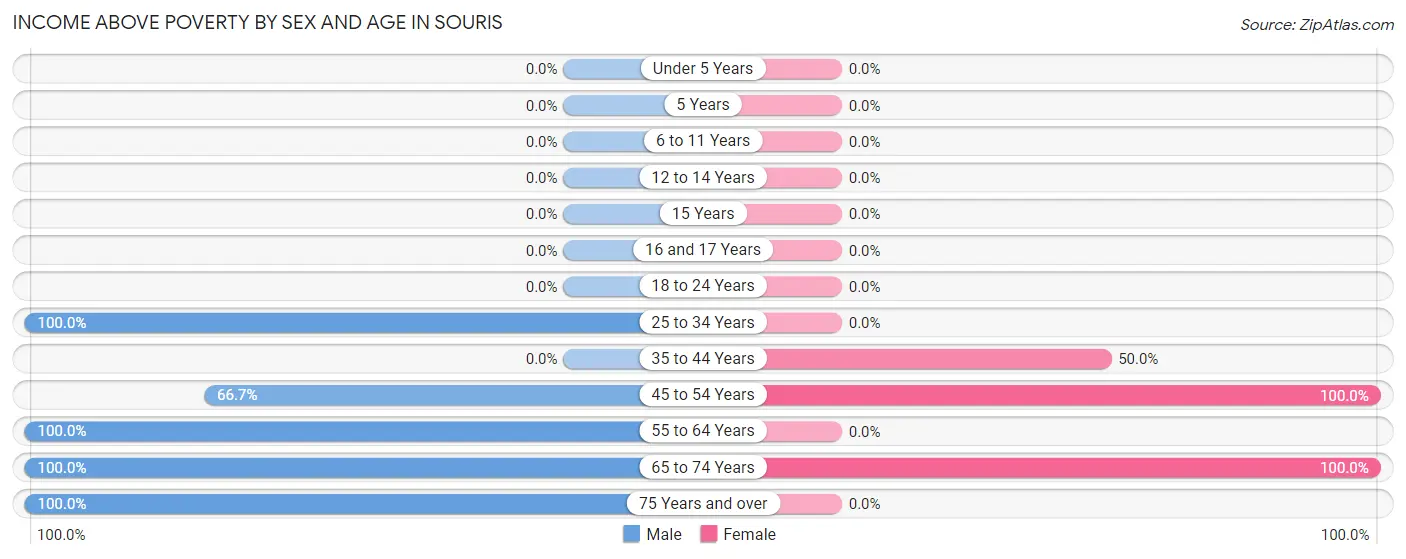
| Age Bracket | Male | Female |
| Under 5 Years | 0 (0.0%) | 0 (0.0%) |
| 5 Years | 0 (0.0%) | 0 (0.0%) |
| 6 to 11 Years | 0 (0.0%) | 0 (0.0%) |
| 12 to 14 Years | 0 (0.0%) | 0 (0.0%) |
| 15 Years | 0 (0.0%) | 0 (0.0%) |
| 16 and 17 Years | 0 (0.0%) | 0 (0.0%) |
| 18 to 24 Years | 0 (0.0%) | 0 (0.0%) |
| 25 to 34 Years | 13 (100.0%) | 0 (0.0%) |
| 35 to 44 Years | 0 (0.0%) | 1 (50.0%) |
| 45 to 54 Years | 2 (66.7%) | 4 (100.0%) |
| 55 to 64 Years | 11 (100.0%) | 0 (0.0%) |
| 65 to 74 Years | 11 (100.0%) | 3 (100.0%) |
| 75 Years and over | 1 (100.0%) | 0 (0.0%) |
| Total | 38 (86.4%) | 8 (61.5%) |
Income Below Poverty Among Married-Couple Families in Souris
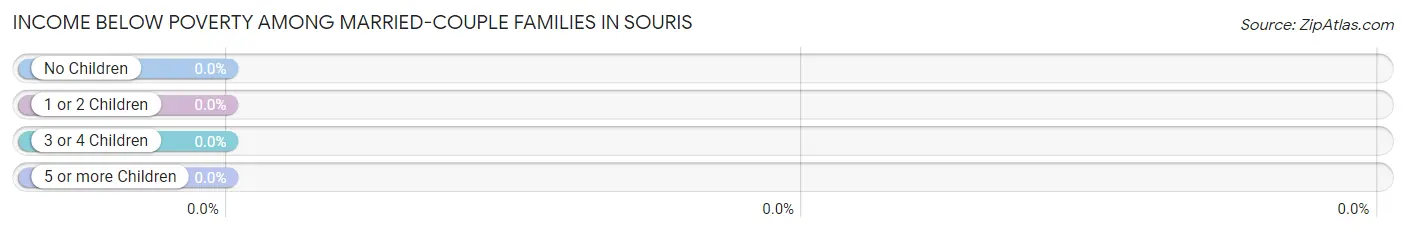
| Children | Above Poverty | Below Poverty |
| No Children | 5 (100.0%) | 0 (0.0%) |
| 1 or 2 Children | 0 (0.0%) | 0 (0.0%) |
| 3 or 4 Children | 0 (0.0%) | 0 (0.0%) |
| 5 or more Children | 0 (0.0%) | 0 (0.0%) |
| Total | 5 (100.0%) | 0 (0.0%) |
Income Below Poverty Among Single-Parent Households in Souris
According to the poverty data in Souris, 100.0% or 1 single-father households and 100.0% or 1 single-mother households are living below the poverty line. Among single-father households, those with 3 or 4 children have the highest poverty rate, with 1 households (100.0%) experiencing poverty. Likewise, among single-mother households, those with 3 or 4 children have the highest poverty rate, with 1 households (100.0%) falling below the poverty line.
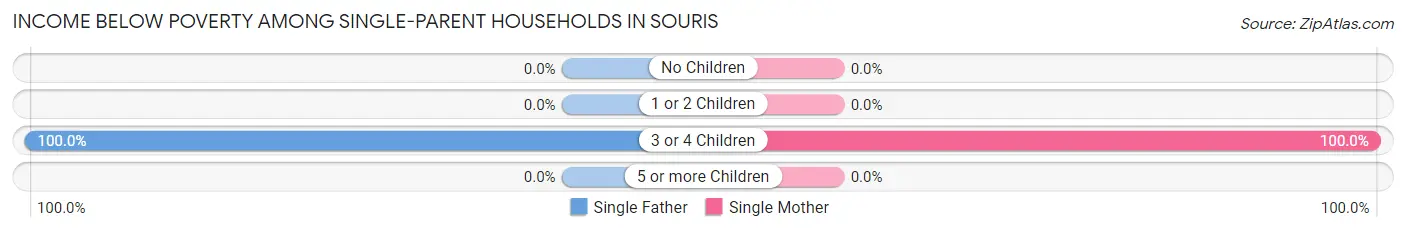
| Children | Single Father | Single Mother |
| No Children | 0 (0.0%) | 0 (0.0%) |
| 1 or 2 Children | 0 (0.0%) | 0 (0.0%) |
| 3 or 4 Children | 1 (100.0%) | 1 (100.0%) |
| 5 or more Children | 0 (0.0%) | 0 (0.0%) |
| Total | 1 (100.0%) | 1 (100.0%) |
Income Below Poverty Among Married-Couple vs Single-Parent Households in Souris
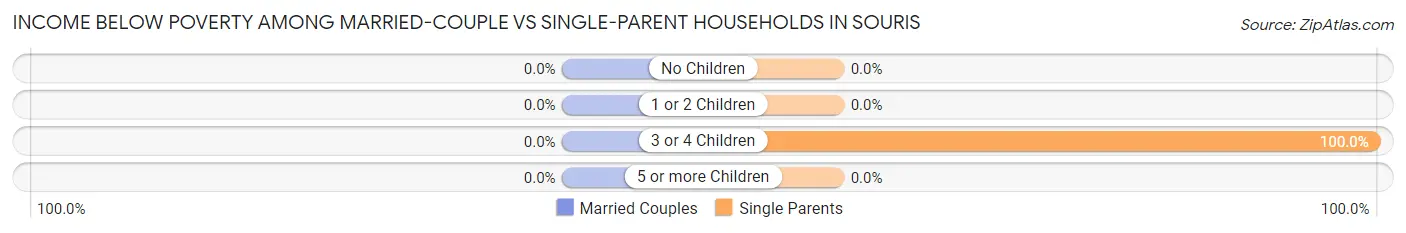
| Children | Married-Couple Families | Single-Parent Households |
| No Children | 0 (0.0%) | 0 (0.0%) |
| 1 or 2 Children | 0 (0.0%) | 0 (0.0%) |
| 3 or 4 Children | 0 (0.0%) | 2 (100.0%) |
| 5 or more Children | 0 (0.0%) | 0 (0.0%) |
| Total | 0 (0.0%) | 2 (100.0%) |
Race in Souris
The most populous races in Souris are , and White / Caucasian (57 | 100.0%).
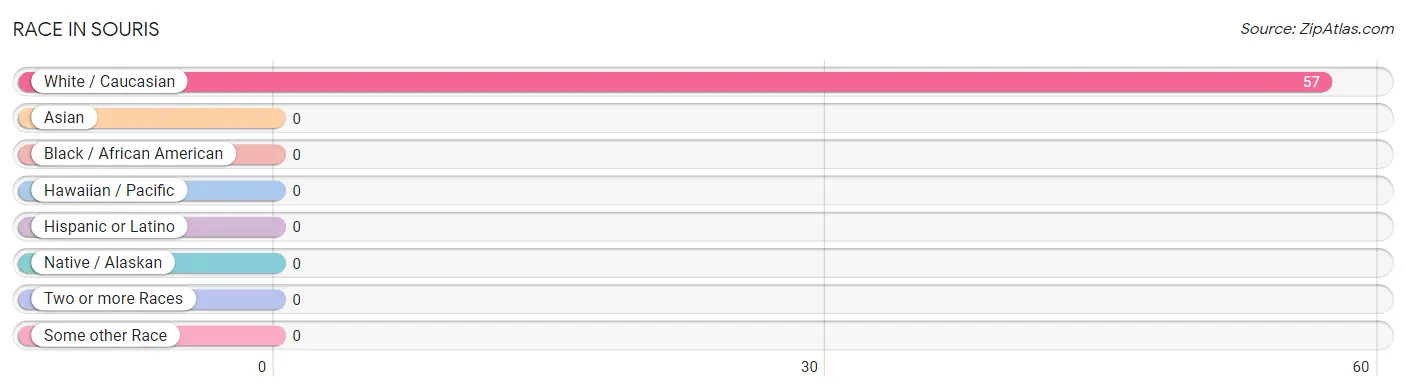
| Race | # Population | % Population |
| Asian | 0 | 0.0% |
| Black / African American | 0 | 0.0% |
| Hawaiian / Pacific | 0 | 0.0% |
| Hispanic or Latino | 0 | 0.0% |
| Native / Alaskan | 0 | 0.0% |
| White / Caucasian | 57 | 100.0% |
| Two or more Races | 0 | 0.0% |
| Some other Race | 0 | 0.0% |
| Total | 57 | 100.0% |
Ancestry in Souris
The most populous ancestries reported in Souris are Norwegian (32 | 56.1%), German (22 | 38.6%), Irish (14 | 24.6%), Scottish (5 | 8.8%), and French (3 | 5.3%), together accounting for 133.3% of all Souris residents.
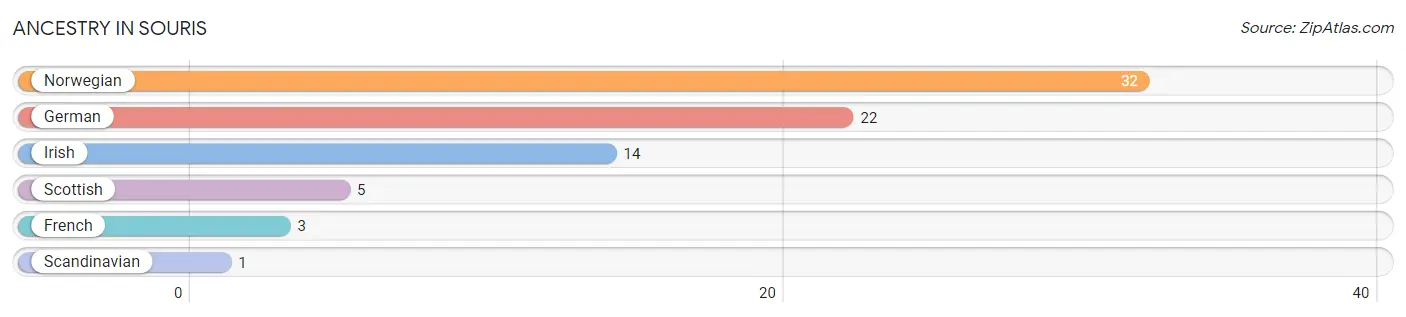
| Ancestry | # Population | % Population |
| French | 3 | 5.3% |
| German | 22 | 38.6% |
| Irish | 14 | 24.6% |
| Norwegian | 32 | 56.1% |
| Scandinavian | 1 | 1.8% |
| Scottish | 5 | 8.8% | View All 6 Rows |
Immigrants in Souris

| Immigration Origin | # Population | % Population | View All 0 Rows |
Sex and Age in Souris
Sex and Age in Souris
The most populous age groups in Souris are 55 to 59 Years (10 | 22.7%) for men and 50 to 54 Years (4 | 30.8%) for women.
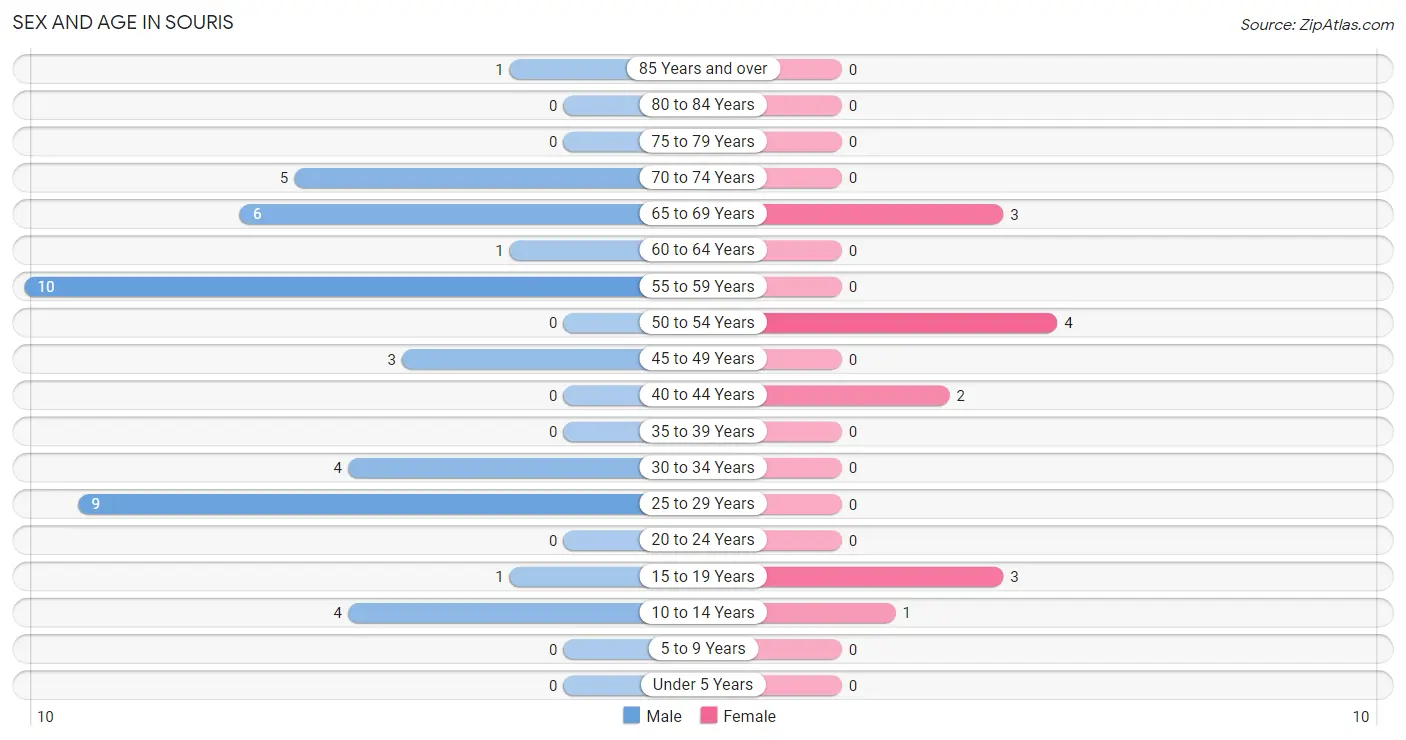
| Age Bracket | Male | Female |
| Under 5 Years | 0 (0.0%) | 0 (0.0%) |
| 5 to 9 Years | 0 (0.0%) | 0 (0.0%) |
| 10 to 14 Years | 4 (9.1%) | 1 (7.7%) |
| 15 to 19 Years | 1 (2.3%) | 3 (23.1%) |
| 20 to 24 Years | 0 (0.0%) | 0 (0.0%) |
| 25 to 29 Years | 9 (20.4%) | 0 (0.0%) |
| 30 to 34 Years | 4 (9.1%) | 0 (0.0%) |
| 35 to 39 Years | 0 (0.0%) | 0 (0.0%) |
| 40 to 44 Years | 0 (0.0%) | 2 (15.4%) |
| 45 to 49 Years | 3 (6.8%) | 0 (0.0%) |
| 50 to 54 Years | 0 (0.0%) | 4 (30.8%) |
| 55 to 59 Years | 10 (22.7%) | 0 (0.0%) |
| 60 to 64 Years | 1 (2.3%) | 0 (0.0%) |
| 65 to 69 Years | 6 (13.6%) | 3 (23.1%) |
| 70 to 74 Years | 5 (11.4%) | 0 (0.0%) |
| 75 to 79 Years | 0 (0.0%) | 0 (0.0%) |
| 80 to 84 Years | 0 (0.0%) | 0 (0.0%) |
| 85 Years and over | 1 (2.3%) | 0 (0.0%) |
| Total | 44 (100.0%) | 13 (100.0%) |
Families and Households in Souris
Median Family Size in Souris
The median family size in Souris is 3.43 persons per family, with single female/mother families (1 | 14.3%) accounting for the largest median family size of 6 persons per family. On the other hand, married-couple families (5 | 71.4%) represent the smallest median family size with 2.60 persons per family.
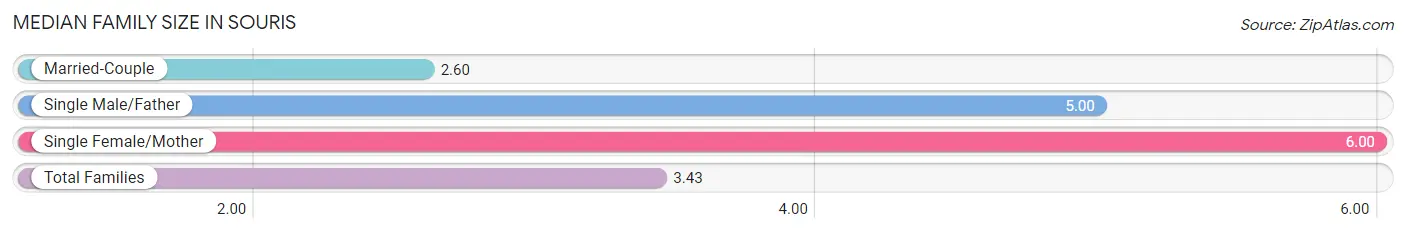
| Family Type | # Families | Family Size |
| Married-Couple | 5 (71.4%) | 2.60 |
| Single Male/Father | 1 (14.3%) | 5.00 |
| Single Female/Mother | 1 (14.3%) | 6.00 |
| Total Families | 7 (100.0%) | 3.43 |
Median Household Size in Souris
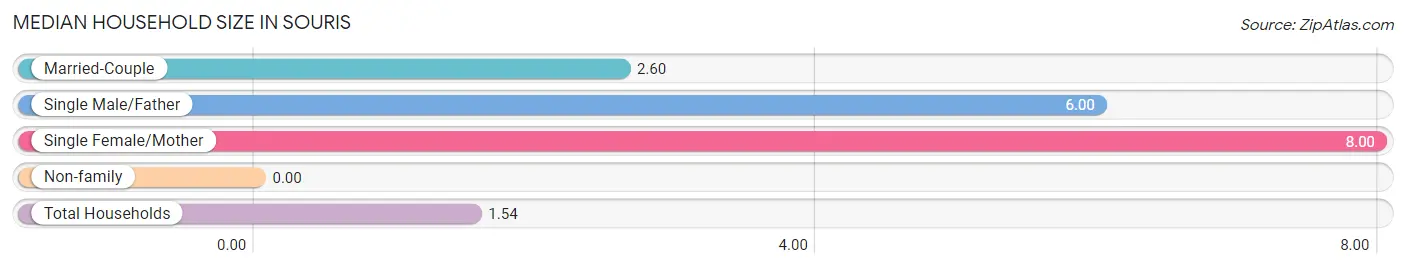
| Household Type | # Households | Household Size |
| Married-Couple | 5 (13.5%) | 2.60 |
| Single Male/Father | 1 (2.7%) | 6.00 |
| Single Female/Mother | 1 (2.7%) | 8.00 |
| Non-family | 30 (81.1%) | - |
| Total Households | 37 (100.0%) | 1.54 |
Household Size by Marriage Status in Souris
Out of a total of 37 households in Souris, 7 (18.9%) are family households, while 30 (81.1%) are nonfamily households. The most numerous type of family households are 2-person households, comprising 5, and the most common type of nonfamily households are 1-person households, comprising 30.
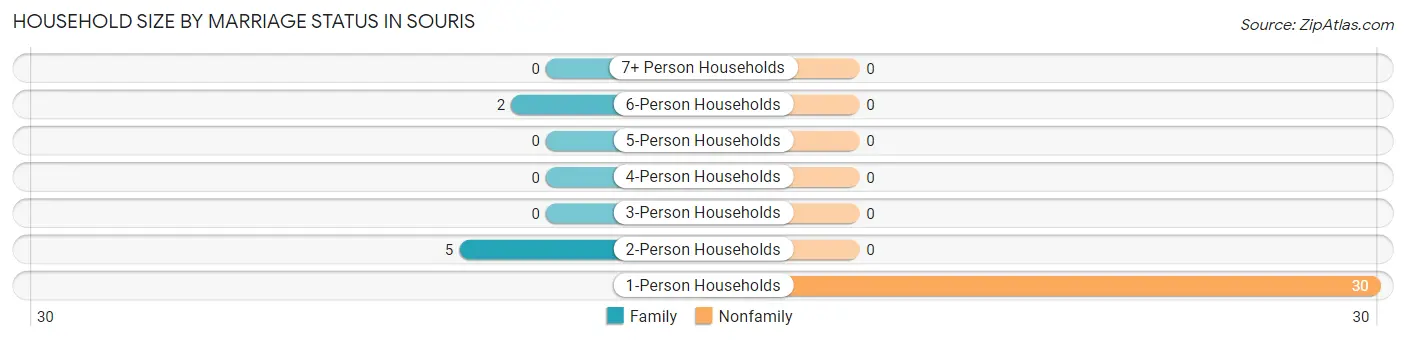
| Household Size | Family Households | Nonfamily Households |
| 1-Person Households | - | 30 (81.1%) |
| 2-Person Households | 5 (13.5%) | 0 (0.0%) |
| 3-Person Households | 0 (0.0%) | 0 (0.0%) |
| 4-Person Households | 0 (0.0%) | 0 (0.0%) |
| 5-Person Households | 0 (0.0%) | 0 (0.0%) |
| 6-Person Households | 2 (5.4%) | 0 (0.0%) |
| 7+ Person Households | 0 (0.0%) | 0 (0.0%) |
| Total | 7 (18.9%) | 30 (81.1%) |
Female Fertility in Souris
Fertility by Age in Souris
| Age Bracket | Women with Births | Births / 1,000 Women |
| 15 to 19 years | 0 (0.0%) | 0.0 |
| 20 to 34 years | 0 (0.0%) | 0.0 |
| 35 to 50 years | 0 (0.0%) | 0.0 |
| Total | 0 (0.0%) | 0.0 |
Fertility by Age by Marriage Status in Souris
| Age Bracket | Married | Unmarried |
| 15 to 19 years | 0 (0.0%) | 0 (0.0%) |
| 20 to 34 years | 0 (0.0%) | 0 (0.0%) |
| 35 to 50 years | 0 (0.0%) | 0 (0.0%) |
| Total | 0 (0.0%) | 0 (0.0%) |
Fertility by Education in Souris
| Educational Attainment | Women with Births | Births / 1,000 Women |
| Less than High School | 0 (0.0%) | 0.0 |
| High School Diploma | 0 (0.0%) | 0.0 |
| College or Associate's Degree | 0 (0.0%) | 0.0 |
| Bachelor's Degree | 0 (0.0%) | 0.0 |
| Graduate Degree | 0 (0.0%) | 0.0 |
| Total | 0 (0.0%) | 0.0 |
Fertility by Education by Marriage Status in Souris
| Educational Attainment | Married | Unmarried |
| Less than High School | 0 (0.0%) | 0 (0.0%) |
| High School Diploma | 0 (0.0%) | 0 (0.0%) |
| College or Associate's Degree | 0 (0.0%) | 0 (0.0%) |
| Bachelor's Degree | 0 (0.0%) | 0 (0.0%) |
| Graduate Degree | 0 (0.0%) | 0 (0.0%) |
| Total | 0 (0.0%) | 0 (0.0%) |
Employment Characteristics in Souris
Employment by Class of Employer in Souris
Among the 29 employed individuals in Souris, private company employees (11 | 37.9%), self-employed (not incorporated) (8 | 27.6%), and not-for-profit organizations (5 | 17.2%) make up the most common classes of employment.
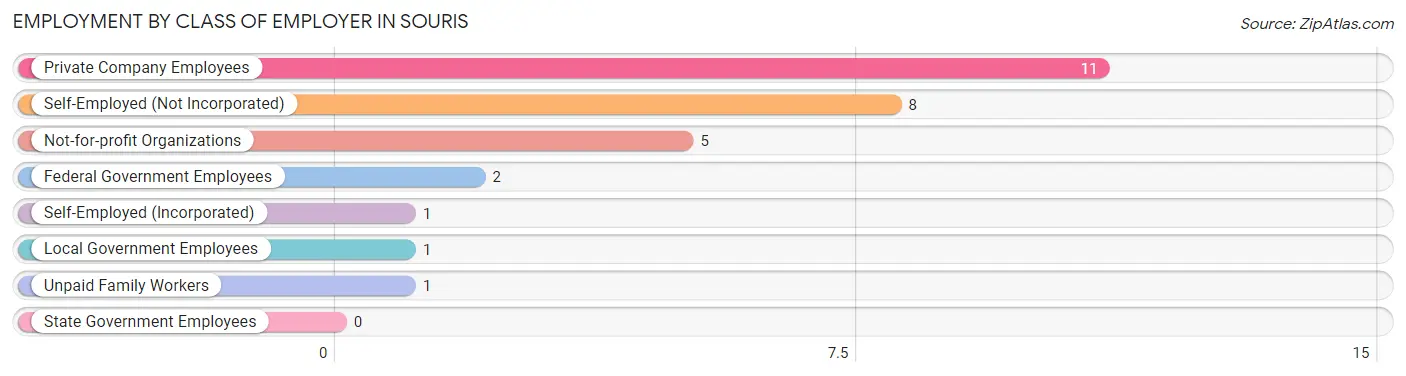
| Employer Class | # Employees | % Employees |
| Private Company Employees | 11 | 37.9% |
| Self-Employed (Incorporated) | 1 | 3.5% |
| Self-Employed (Not Incorporated) | 8 | 27.6% |
| Not-for-profit Organizations | 5 | 17.2% |
| Local Government Employees | 1 | 3.5% |
| State Government Employees | 0 | 0.0% |
| Federal Government Employees | 2 | 6.9% |
| Unpaid Family Workers | 1 | 3.5% |
| Total | 29 | 100.0% |
Employment Status by Age in Souris
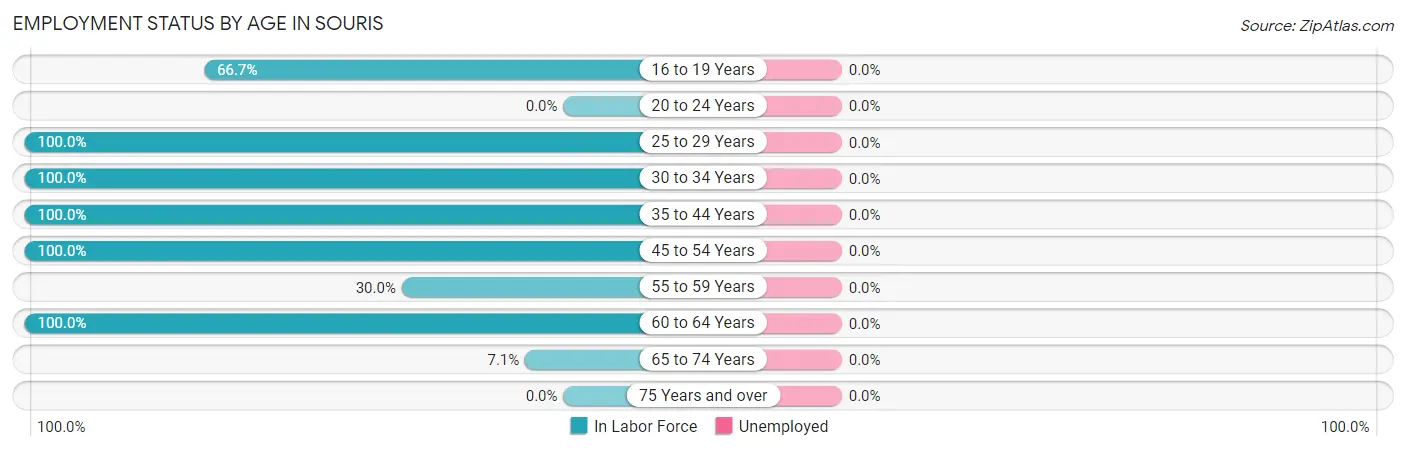
| Age Bracket | In Labor Force | Unemployed |
| 16 to 19 Years | 2 (66.7%) | 0 (0.0%) |
| 20 to 24 Years | 0 (0.0%) | 0 (0.0%) |
| 25 to 29 Years | 9 (100.0%) | 0 (0.0%) |
| 30 to 34 Years | 4 (100.0%) | 0 (0.0%) |
| 35 to 44 Years | 2 (100.0%) | 0 (0.0%) |
| 45 to 54 Years | 7 (100.0%) | 0 (0.0%) |
| 55 to 59 Years | 3 (30.0%) | 0 (0.0%) |
| 60 to 64 Years | 1 (100.0%) | 0 (0.0%) |
| 65 to 74 Years | 1 (7.1%) | 0 (0.0%) |
| 75 Years and over | 0 (0.0%) | 0 (0.0%) |
| Total | 29 (56.9%) | 0 (0.0%) |
Employment Status by Educational Attainment in Souris
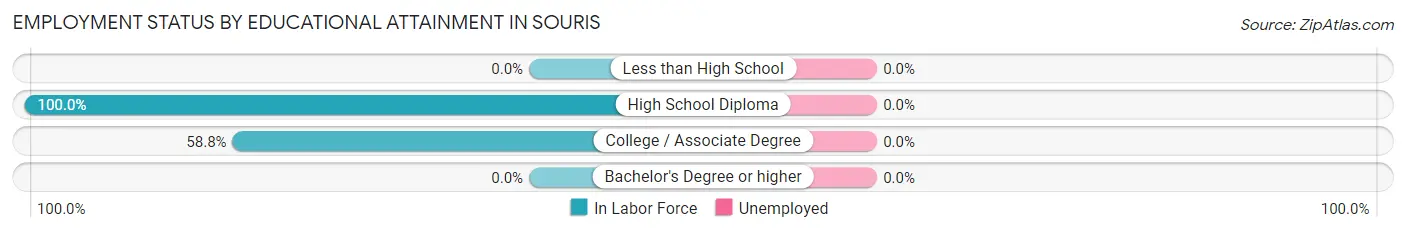
| Educational Attainment | In Labor Force | Unemployed |
| Less than High School | 0 (0.0%) | 0 (0.0%) |
| High School Diploma | 16 (100.0%) | 0 (0.0%) |
| College / Associate Degree | 10 (58.8%) | 0 (0.0%) |
| Bachelor's Degree or higher | 0 (0.0%) | 0 (0.0%) |
| Total | 26 (78.8%) | 0 (0.0%) |
Employment Occupations by Sex in Souris
Management, Business, Science and Arts Occupations
The most common Management, Business, Science and Arts occupations in Souris are , and Management (5 | 17.2%).
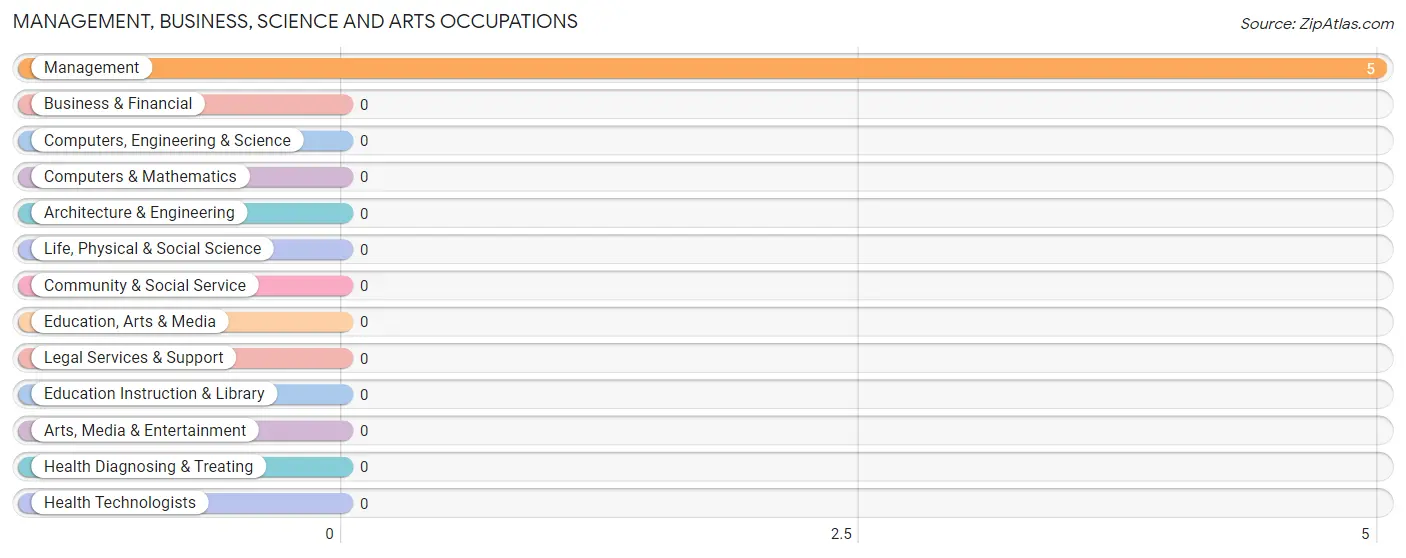
Management, Business, Science and Arts Occupations by Sex
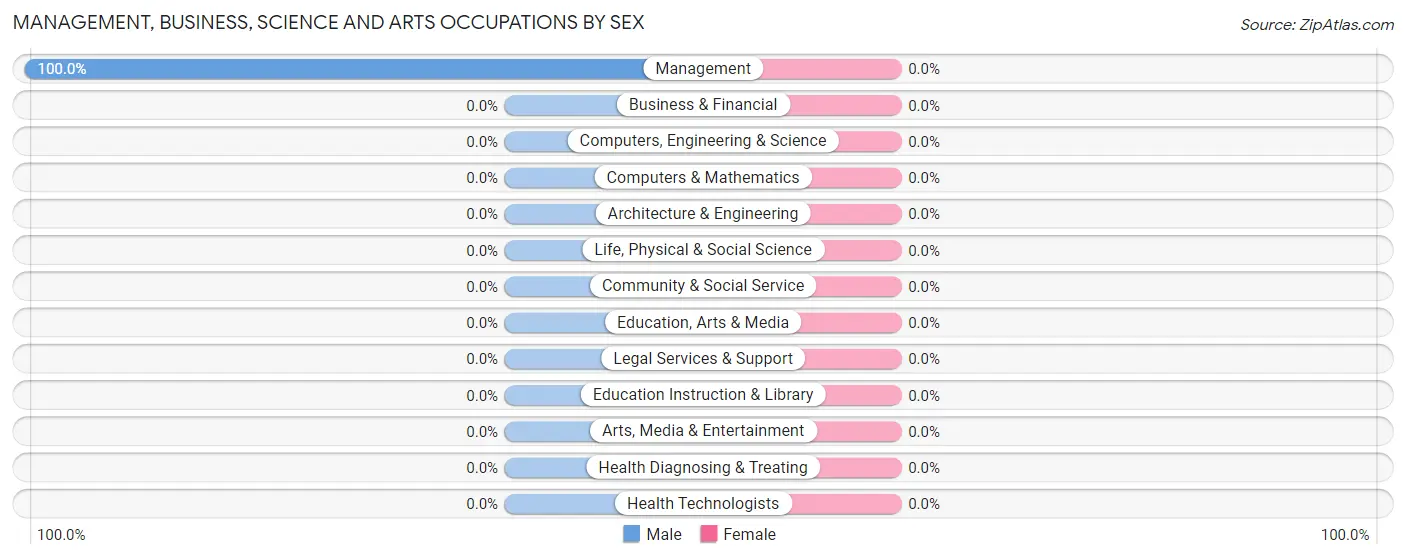
| Occupation | Male | Female |
| Management | 5 (100.0%) | 0 (0.0%) |
| Business & Financial | 0 (0.0%) | 0 (0.0%) |
| Computers, Engineering & Science | 0 (0.0%) | 0 (0.0%) |
| Computers & Mathematics | 0 (0.0%) | 0 (0.0%) |
| Architecture & Engineering | 0 (0.0%) | 0 (0.0%) |
| Life, Physical & Social Science | 0 (0.0%) | 0 (0.0%) |
| Community & Social Service | 0 (0.0%) | 0 (0.0%) |
| Education, Arts & Media | 0 (0.0%) | 0 (0.0%) |
| Legal Services & Support | 0 (0.0%) | 0 (0.0%) |
| Education Instruction & Library | 0 (0.0%) | 0 (0.0%) |
| Arts, Media & Entertainment | 0 (0.0%) | 0 (0.0%) |
| Health Diagnosing & Treating | 0 (0.0%) | 0 (0.0%) |
| Health Technologists | 0 (0.0%) | 0 (0.0%) |
| Total (Category) | 5 (100.0%) | 0 (0.0%) |
| Total (Overall) | 20 (69.0%) | 9 (31.0%) |
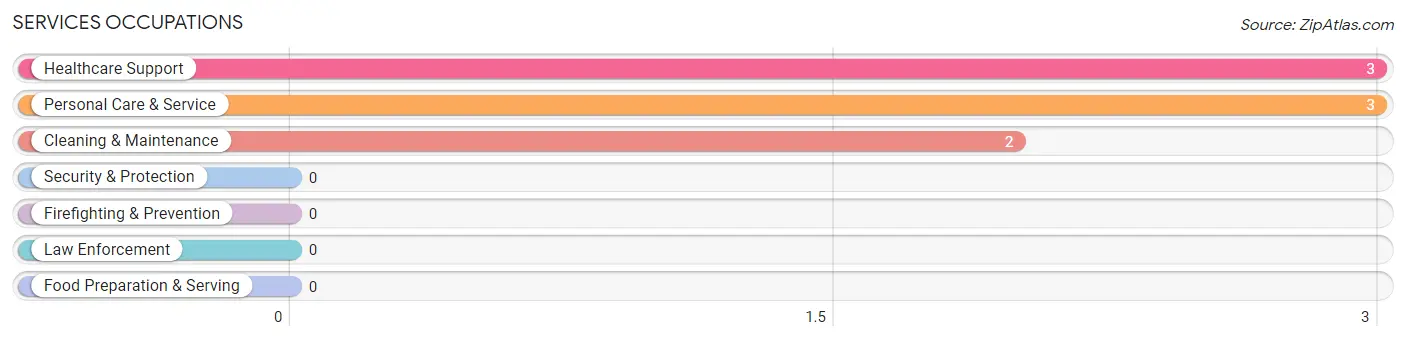
Services Occupations
The most common Services occupations in Souris are Healthcare Support (3 | 10.3%), Personal Care & Service (3 | 10.3%), and Cleaning & Maintenance (2 | 6.9%).
Services Occupations by Sex
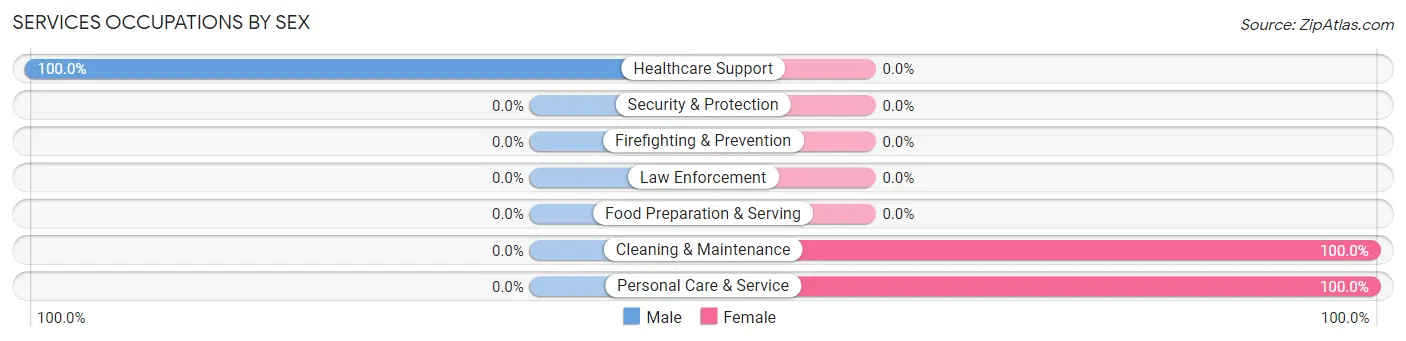
| Occupation | Male | Female |
| Healthcare Support | 3 (100.0%) | 0 (0.0%) |
| Security & Protection | 0 (0.0%) | 0 (0.0%) |
| Firefighting & Prevention | 0 (0.0%) | 0 (0.0%) |
| Law Enforcement | 0 (0.0%) | 0 (0.0%) |
| Food Preparation & Serving | 0 (0.0%) | 0 (0.0%) |
| Cleaning & Maintenance | 0 (0.0%) | 2 (100.0%) |
| Personal Care & Service | 0 (0.0%) | 3 (100.0%) |
| Total (Category) | 3 (37.5%) | 5 (62.5%) |
| Total (Overall) | 20 (69.0%) | 9 (31.0%) |
Sales and Office Occupations
The most common Sales and Office occupations in Souris are Office & Administration (3 | 10.3%), and Sales & Related (1 | 3.5%).
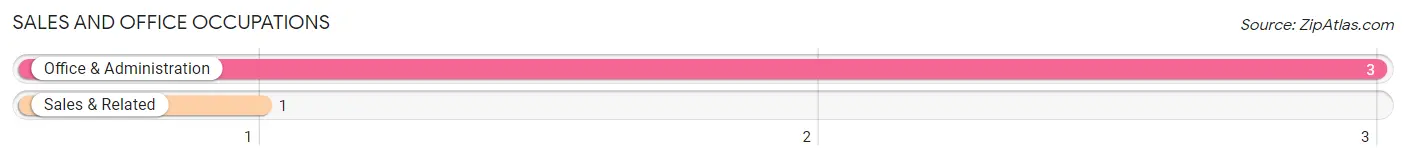
Sales and Office Occupations by Sex
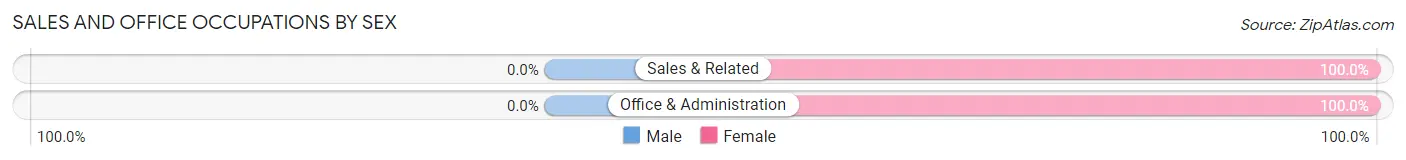
| Occupation | Male | Female |
| Sales & Related | 0 (0.0%) | 1 (100.0%) |
| Office & Administration | 0 (0.0%) | 3 (100.0%) |
| Total (Category) | 0 (0.0%) | 4 (100.0%) |
| Total (Overall) | 20 (69.0%) | 9 (31.0%) |
Natural Resources, Construction and Maintenance Occupations
The most common Natural Resources, Construction and Maintenance occupations in Souris are Installation, Maintenance & Repair (9 | 31.0%), and Construction & Extraction (3 | 10.3%).
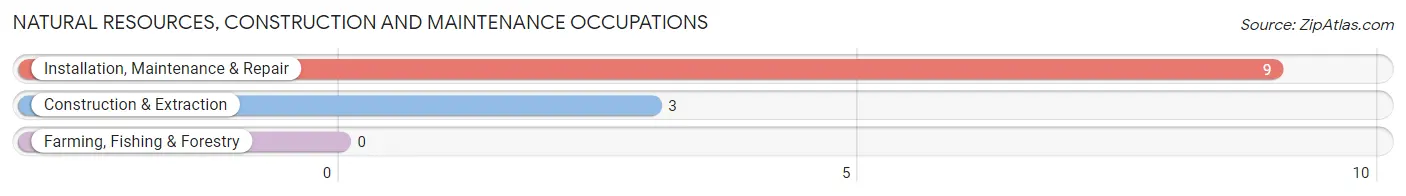
Natural Resources, Construction and Maintenance Occupations by Sex
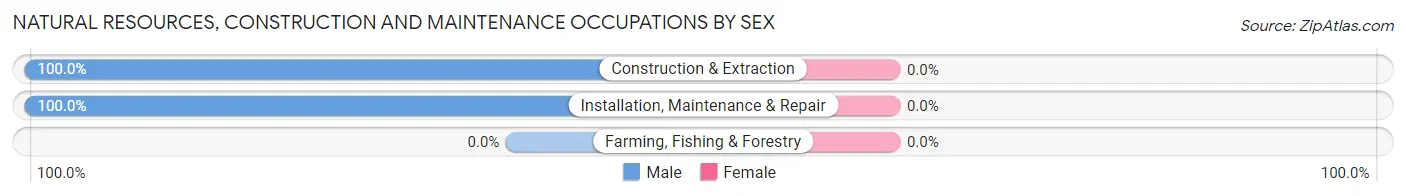
| Occupation | Male | Female |
| Farming, Fishing & Forestry | 0 (0.0%) | 0 (0.0%) |
| Construction & Extraction | 3 (100.0%) | 0 (0.0%) |
| Installation, Maintenance & Repair | 9 (100.0%) | 0 (0.0%) |
| Total (Category) | 12 (100.0%) | 0 (0.0%) |
| Total (Overall) | 20 (69.0%) | 9 (31.0%) |
Production, Transportation and Moving Occupations
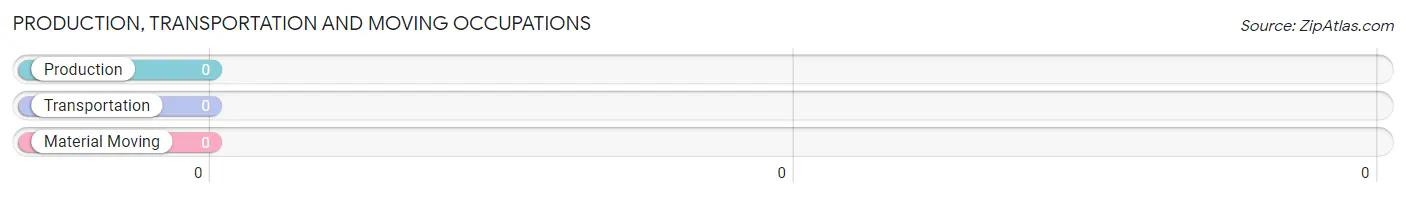
Production, Transportation and Moving Occupations by Sex
| Occupation | Male | Female |
| Production | 0 (0.0%) | 0 (0.0%) |
| Transportation | 0 (0.0%) | 0 (0.0%) |
| Material Moving | 0 (0.0%) | 0 (0.0%) |
| Total (Category) | 0 (0.0%) | 0 (0.0%) |
| Total (Overall) | 20 (69.0%) | 9 (31.0%) |
Employment Industries by Sex in Souris
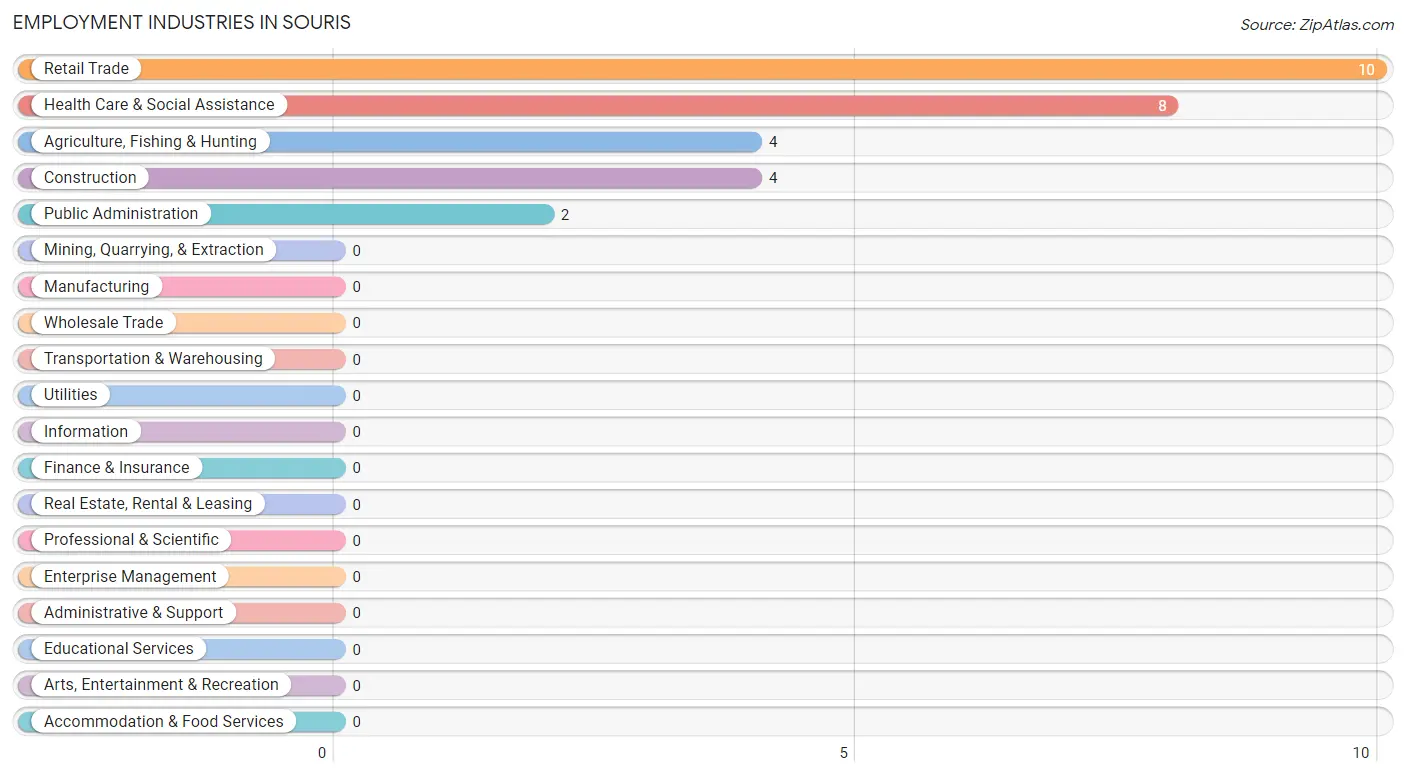
Employment Industries in Souris
The major employment industries in Souris include Retail Trade (10 | 34.5%), Health Care & Social Assistance (8 | 27.6%), Agriculture, Fishing & Hunting (4 | 13.8%), Construction (4 | 13.8%), and Public Administration (2 | 6.9%).
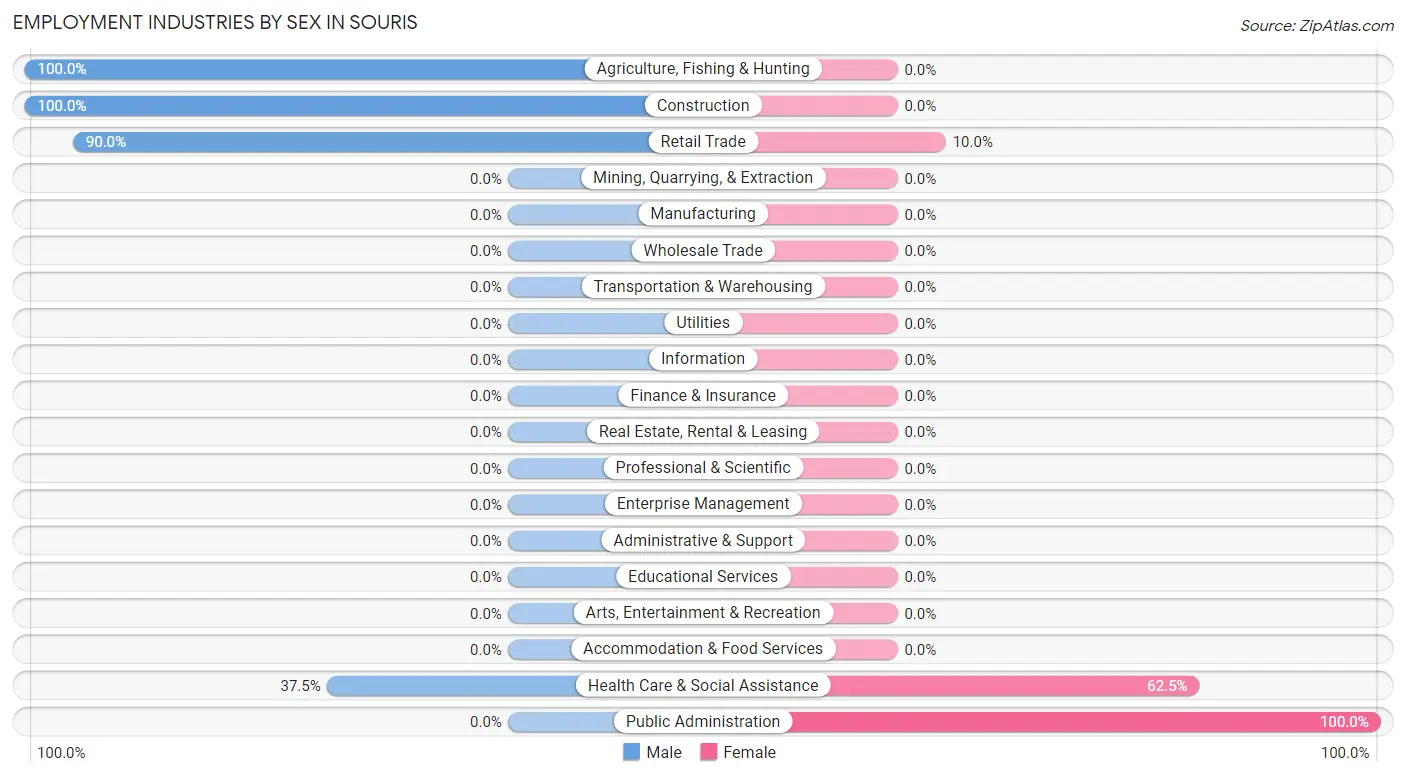
Employment Industries by Sex in Souris
The Souris industries that see more men than women are Agriculture, Fishing & Hunting (100.0%), Construction (100.0%), and Retail Trade (90.0%), whereas the industries that tend to have a higher number of women are Public Administration (100.0%), Health Care & Social Assistance (62.5%), and Retail Trade (10.0%).
| Industry | Male | Female |
| Agriculture, Fishing & Hunting | 4 (100.0%) | 0 (0.0%) |
| Mining, Quarrying, & Extraction | 0 (0.0%) | 0 (0.0%) |
| Construction | 4 (100.0%) | 0 (0.0%) |
| Manufacturing | 0 (0.0%) | 0 (0.0%) |
| Wholesale Trade | 0 (0.0%) | 0 (0.0%) |
| Retail Trade | 9 (90.0%) | 1 (10.0%) |
| Transportation & Warehousing | 0 (0.0%) | 0 (0.0%) |
| Utilities | 0 (0.0%) | 0 (0.0%) |
| Information | 0 (0.0%) | 0 (0.0%) |
| Finance & Insurance | 0 (0.0%) | 0 (0.0%) |
| Real Estate, Rental & Leasing | 0 (0.0%) | 0 (0.0%) |
| Professional & Scientific | 0 (0.0%) | 0 (0.0%) |
| Enterprise Management | 0 (0.0%) | 0 (0.0%) |
| Administrative & Support | 0 (0.0%) | 0 (0.0%) |
| Educational Services | 0 (0.0%) | 0 (0.0%) |
| Health Care & Social Assistance | 3 (37.5%) | 5 (62.5%) |
| Arts, Entertainment & Recreation | 0 (0.0%) | 0 (0.0%) |
| Accommodation & Food Services | 0 (0.0%) | 0 (0.0%) |
| Public Administration | 0 (0.0%) | 2 (100.0%) |
| Total | 20 (69.0%) | 9 (31.0%) |
Education in Souris
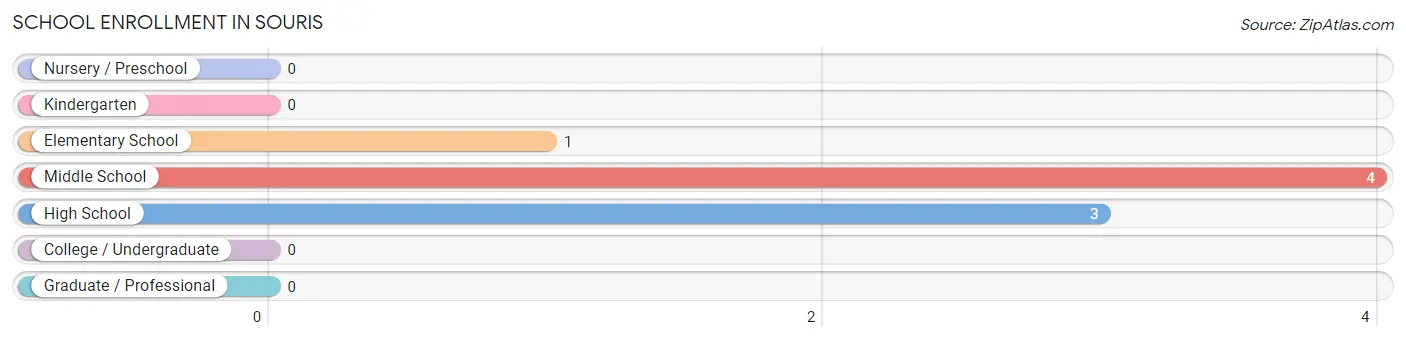
School Enrollment in Souris
The most common levels of schooling among the 8 students in Souris are middle school (4 | 50.0%), high school (3 | 37.5%), and elementary school (1 | 12.5%).
| School Level | # Students | % Students |
| Nursery / Preschool | 0 | 0.0% |
| Kindergarten | 0 | 0.0% |
| Elementary School | 1 | 12.5% |
| Middle School | 4 | 50.0% |
| High School | 3 | 37.5% |
| College / Undergraduate | 0 | 0.0% |
| Graduate / Professional | 0 | 0.0% |
| Total | 8 | 100.0% |
School Enrollment by Age by Funding Source in Souris
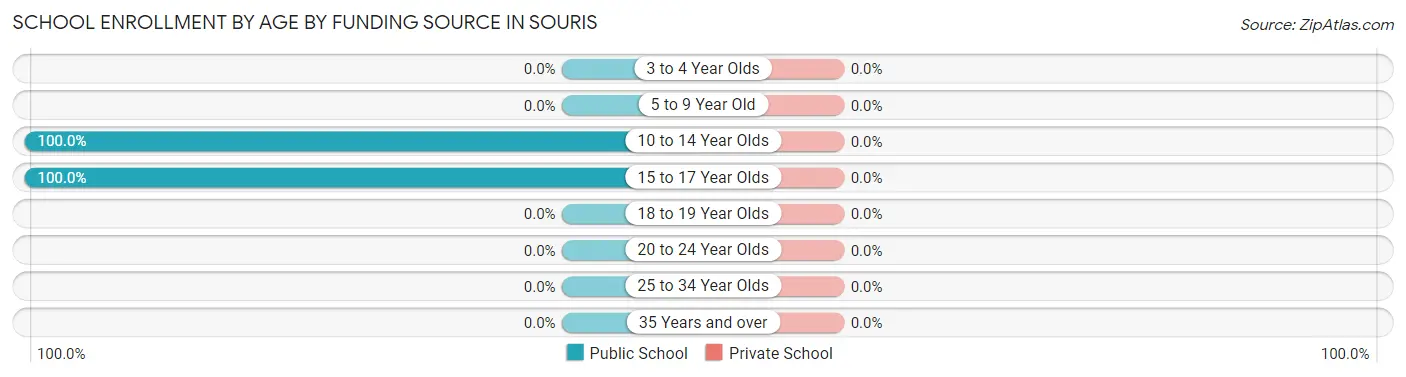
| Age Bracket | Public School | Private School |
| 3 to 4 Year Olds | 0 (0.0%) | 0 (0.0%) |
| 5 to 9 Year Old | 0 (0.0%) | 0 (0.0%) |
| 10 to 14 Year Olds | 5 (100.0%) | 0 (0.0%) |
| 15 to 17 Year Olds | 3 (100.0%) | 0 (0.0%) |
| 18 to 19 Year Olds | 0 (0.0%) | 0 (0.0%) |
| 20 to 24 Year Olds | 0 (0.0%) | 0 (0.0%) |
| 25 to 34 Year Olds | 0 (0.0%) | 0 (0.0%) |
| 35 Years and over | 0 (0.0%) | 0 (0.0%) |
| Total | 8 (100.0%) | 0 (0.0%) |
Educational Attainment by Field of Study in Souris
Psychology (1 | 50.0%), and education (1 | 50.0%) are the most common fields of study among 2 individuals in Souris who have obtained a bachelor's degree or higher.
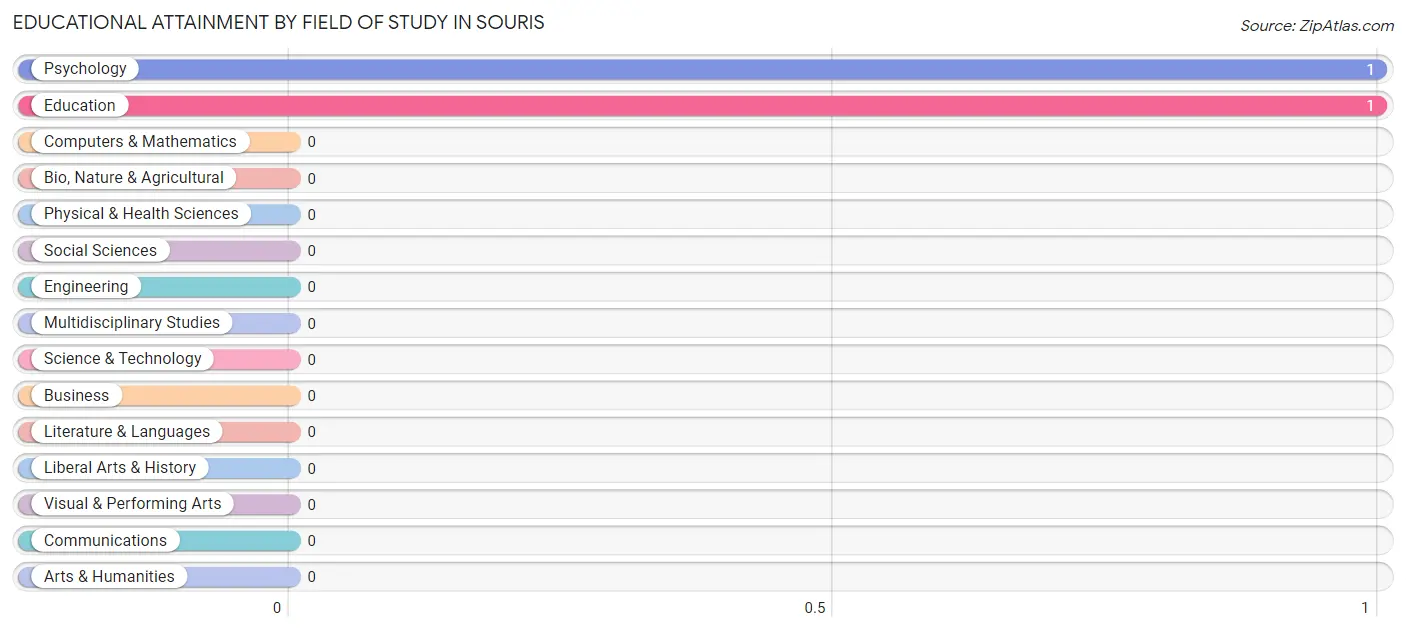
| Field of Study | # Graduates | % Graduates |
| Computers & Mathematics | 0 | 0.0% |
| Bio, Nature & Agricultural | 0 | 0.0% |
| Physical & Health Sciences | 0 | 0.0% |
| Psychology | 1 | 50.0% |
| Social Sciences | 0 | 0.0% |
| Engineering | 0 | 0.0% |
| Multidisciplinary Studies | 0 | 0.0% |
| Science & Technology | 0 | 0.0% |
| Business | 0 | 0.0% |
| Education | 1 | 50.0% |
| Literature & Languages | 0 | 0.0% |
| Liberal Arts & History | 0 | 0.0% |
| Visual & Performing Arts | 0 | 0.0% |
| Communications | 0 | 0.0% |
| Arts & Humanities | 0 | 0.0% |
| Total | 2 | 100.0% |
Transportation & Commute in Souris
Vehicle Availability by Sex in Souris
The most prevalent vehicle ownership categories in Souris are males with 1 vehicle (9, accounting for 45.0%) and females with 1 vehicle (0, making up 100.0%).
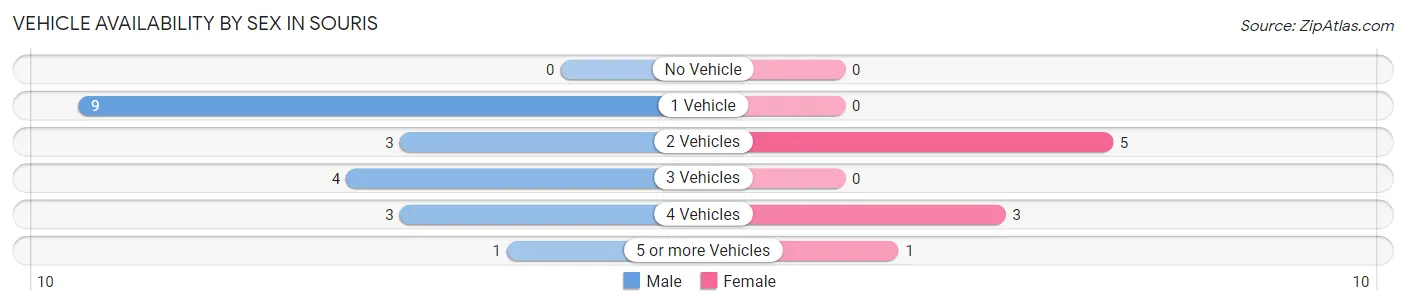
| Vehicles Available | Male | Female |
| No Vehicle | 0 (0.0%) | 0 (0.0%) |
| 1 Vehicle | 9 (45.0%) | 0 (0.0%) |
| 2 Vehicles | 3 (15.0%) | 5 (55.6%) |
| 3 Vehicles | 4 (20.0%) | 0 (0.0%) |
| 4 Vehicles | 3 (15.0%) | 3 (33.3%) |
| 5 or more Vehicles | 1 (5.0%) | 1 (11.1%) |
| Total | 20 (100.0%) | 9 (100.0%) |
Commute Time in Souris
The most frequently occuring commute durations in Souris are 20 to 24 minutes (12 commuters, 41.4%), 15 to 19 minutes (10 commuters, 34.5%), and 25 to 29 minutes (3 commuters, 10.3%).
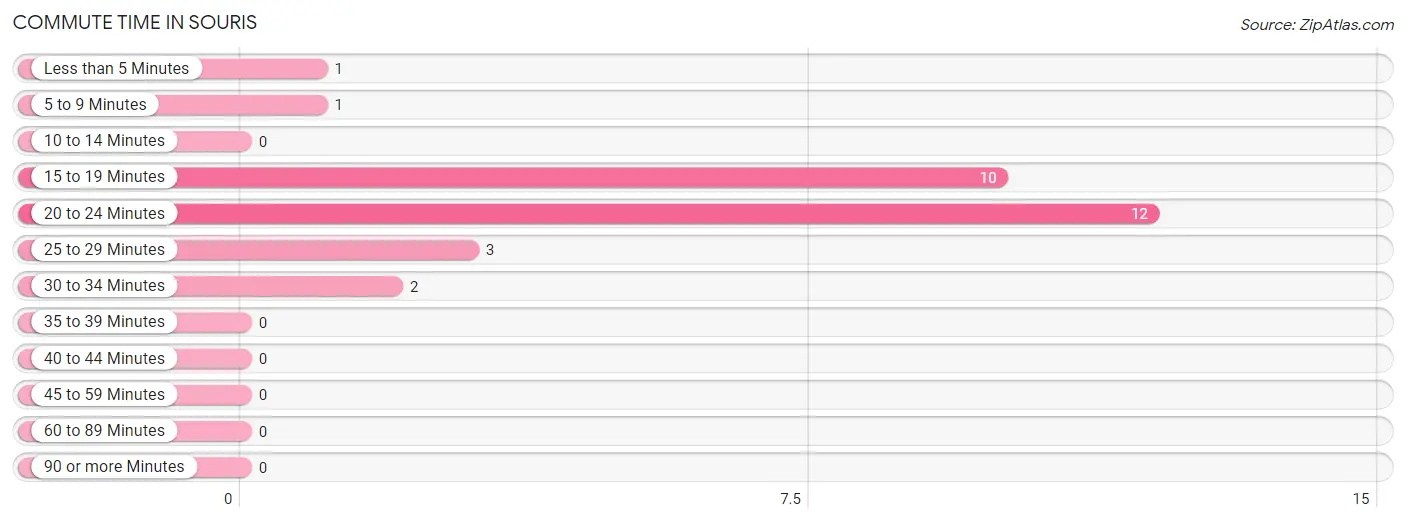
| Commute Time | # Commuters | % Commuters |
| Less than 5 Minutes | 1 | 3.5% |
| 5 to 9 Minutes | 1 | 3.5% |
| 10 to 14 Minutes | 0 | 0.0% |
| 15 to 19 Minutes | 10 | 34.5% |
| 20 to 24 Minutes | 12 | 41.4% |
| 25 to 29 Minutes | 3 | 10.3% |
| 30 to 34 Minutes | 2 | 6.9% |
| 35 to 39 Minutes | 0 | 0.0% |
| 40 to 44 Minutes | 0 | 0.0% |
| 45 to 59 Minutes | 0 | 0.0% |
| 60 to 89 Minutes | 0 | 0.0% |
| 90 or more Minutes | 0 | 0.0% |
Commute Time by Sex in Souris
The most common commute times in Souris are 15 to 19 minutes (9 commuters, 45.0%) for males and 20 to 24 minutes (5 commuters, 55.6%) for females.
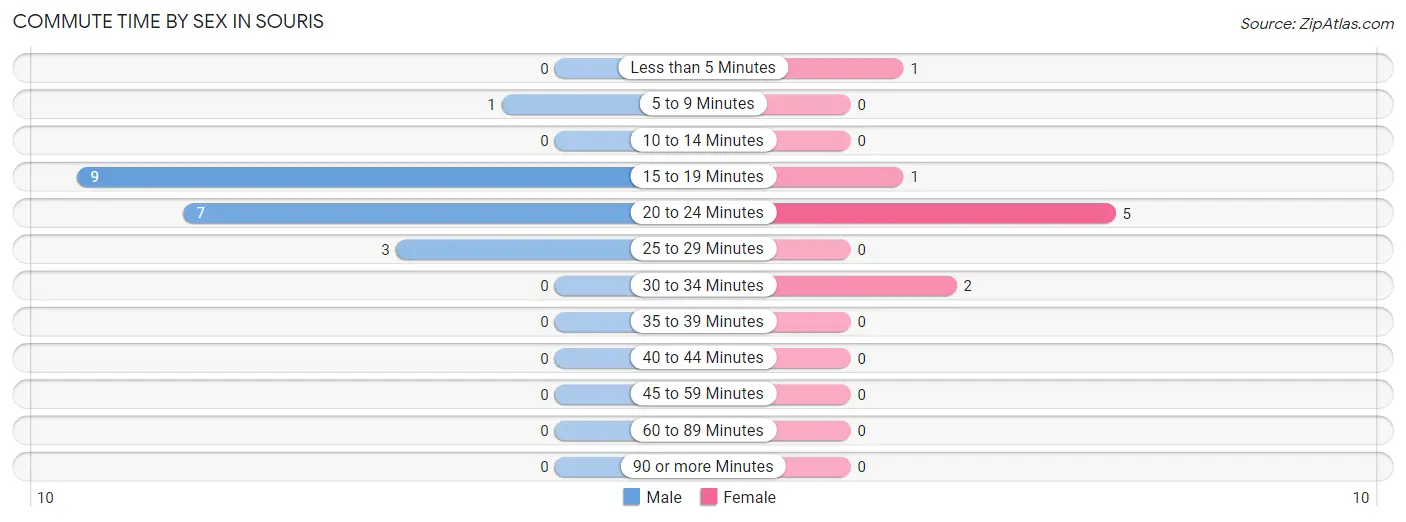
| Commute Time | Male | Female |
| Less than 5 Minutes | 0 (0.0%) | 1 (11.1%) |
| 5 to 9 Minutes | 1 (5.0%) | 0 (0.0%) |
| 10 to 14 Minutes | 0 (0.0%) | 0 (0.0%) |
| 15 to 19 Minutes | 9 (45.0%) | 1 (11.1%) |
| 20 to 24 Minutes | 7 (35.0%) | 5 (55.6%) |
| 25 to 29 Minutes | 3 (15.0%) | 0 (0.0%) |
| 30 to 34 Minutes | 0 (0.0%) | 2 (22.2%) |
| 35 to 39 Minutes | 0 (0.0%) | 0 (0.0%) |
| 40 to 44 Minutes | 0 (0.0%) | 0 (0.0%) |
| 45 to 59 Minutes | 0 (0.0%) | 0 (0.0%) |
| 60 to 89 Minutes | 0 (0.0%) | 0 (0.0%) |
| 90 or more Minutes | 0 (0.0%) | 0 (0.0%) |
Time of Departure to Work by Sex in Souris
The most frequent times of departure to work in Souris are 6:30 AM to 6:59 AM (12, 60.0%) for males and 6:00 AM to 6:29 AM (3, 33.3%) for females.
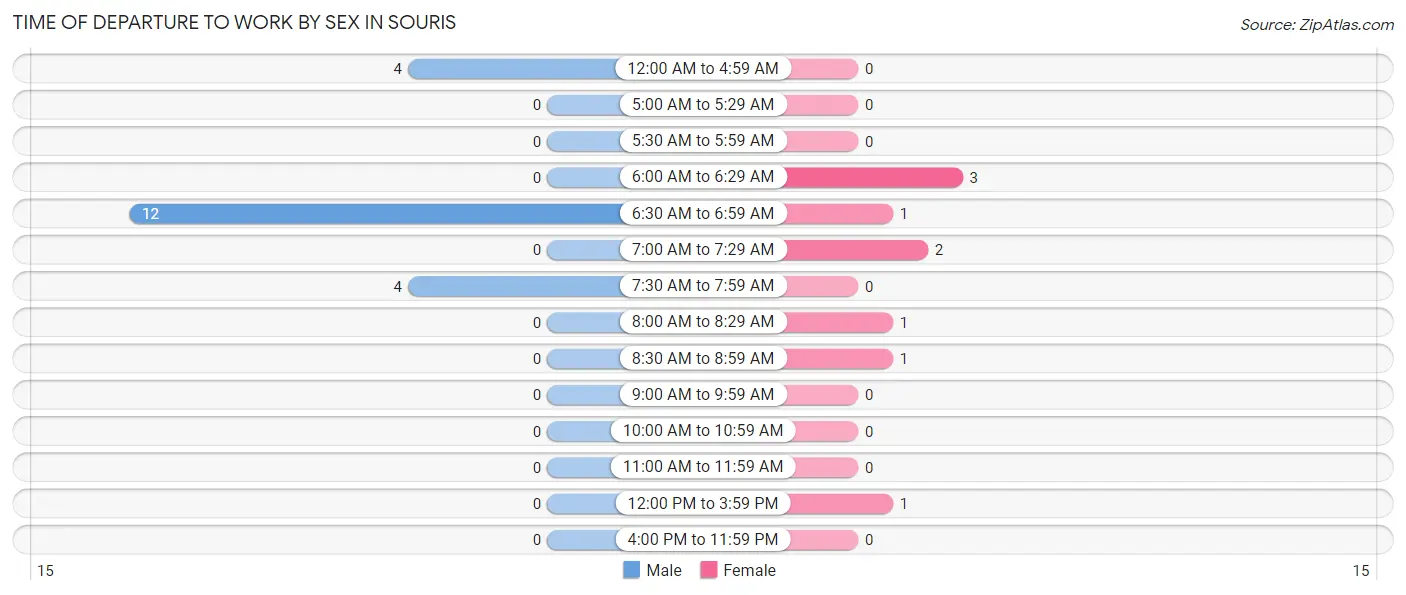
| Time of Departure | Male | Female |
| 12:00 AM to 4:59 AM | 4 (20.0%) | 0 (0.0%) |
| 5:00 AM to 5:29 AM | 0 (0.0%) | 0 (0.0%) |
| 5:30 AM to 5:59 AM | 0 (0.0%) | 0 (0.0%) |
| 6:00 AM to 6:29 AM | 0 (0.0%) | 3 (33.3%) |
| 6:30 AM to 6:59 AM | 12 (60.0%) | 1 (11.1%) |
| 7:00 AM to 7:29 AM | 0 (0.0%) | 2 (22.2%) |
| 7:30 AM to 7:59 AM | 4 (20.0%) | 0 (0.0%) |
| 8:00 AM to 8:29 AM | 0 (0.0%) | 1 (11.1%) |
| 8:30 AM to 8:59 AM | 0 (0.0%) | 1 (11.1%) |
| 9:00 AM to 9:59 AM | 0 (0.0%) | 0 (0.0%) |
| 10:00 AM to 10:59 AM | 0 (0.0%) | 0 (0.0%) |
| 11:00 AM to 11:59 AM | 0 (0.0%) | 0 (0.0%) |
| 12:00 PM to 3:59 PM | 0 (0.0%) | 1 (11.1%) |
| 4:00 PM to 11:59 PM | 0 (0.0%) | 0 (0.0%) |
| Total | 20 (100.0%) | 9 (100.0%) |
Housing Occupancy in Souris
Occupancy by Ownership in Souris
Of the total 37 dwellings in Souris, owner-occupied units account for 24 (64.9%), while renter-occupied units make up 13 (35.1%).
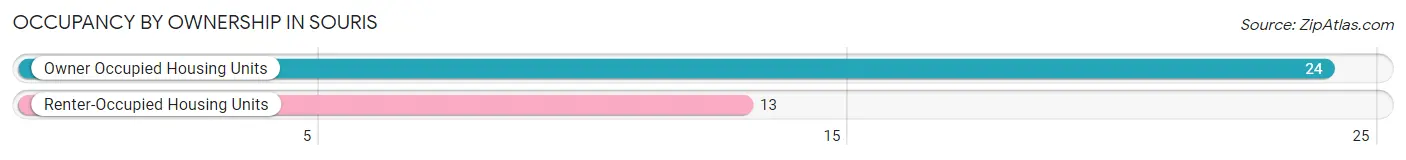
| Occupancy | # Housing Units | % Housing Units |
| Owner Occupied Housing Units | 24 | 64.9% |
| Renter-Occupied Housing Units | 13 | 35.1% |
| Total Occupied Housing Units | 37 | 100.0% |
Occupancy by Household Size in Souris
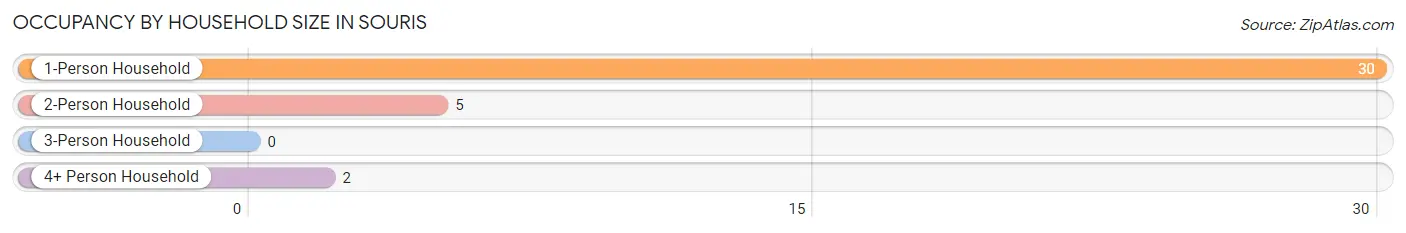
| Household Size | # Housing Units | % Housing Units |
| 1-Person Household | 30 | 81.1% |
| 2-Person Household | 5 | 13.5% |
| 3-Person Household | 0 | 0.0% |
| 4+ Person Household | 2 | 5.4% |
| Total Housing Units | 37 | 100.0% |
Occupancy by Ownership by Household Size in Souris
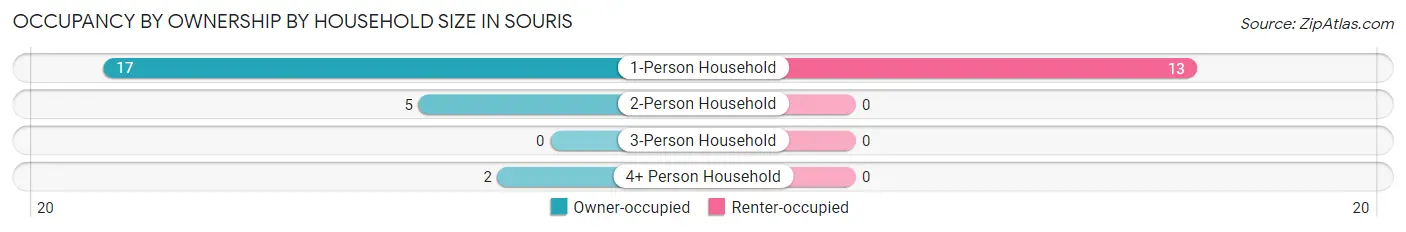
| Household Size | Owner-occupied | Renter-occupied |
| 1-Person Household | 17 (56.7%) | 13 (43.3%) |
| 2-Person Household | 5 (100.0%) | 0 (0.0%) |
| 3-Person Household | 0 (0.0%) | 0 (0.0%) |
| 4+ Person Household | 2 (100.0%) | 0 (0.0%) |
| Total Housing Units | 24 (64.9%) | 13 (35.1%) |
Occupancy by Educational Attainment in Souris
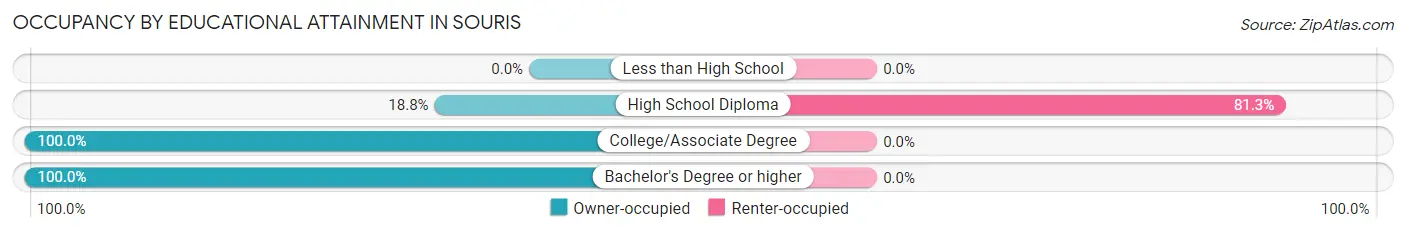
| Household Size | Owner-occupied | Renter-occupied |
| Less than High School | 0 (0.0%) | 0 (0.0%) |
| High School Diploma | 3 (18.8%) | 13 (81.2%) |
| College/Associate Degree | 20 (100.0%) | 0 (0.0%) |
| Bachelor's Degree or higher | 1 (100.0%) | 0 (0.0%) |
Occupancy by Age of Householder in Souris
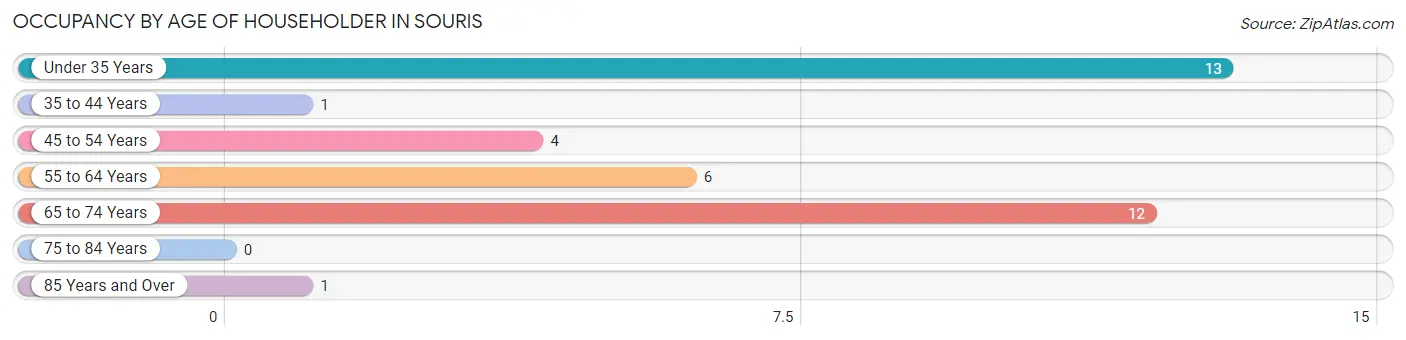
| Age Bracket | # Households | % Households |
| Under 35 Years | 13 | 35.1% |
| 35 to 44 Years | 1 | 2.7% |
| 45 to 54 Years | 4 | 10.8% |
| 55 to 64 Years | 6 | 16.2% |
| 65 to 74 Years | 12 | 32.4% |
| 75 to 84 Years | 0 | 0.0% |
| 85 Years and Over | 1 | 2.7% |
| Total | 37 | 100.0% |
Housing Finances in Souris
Median Income by Occupancy in Souris
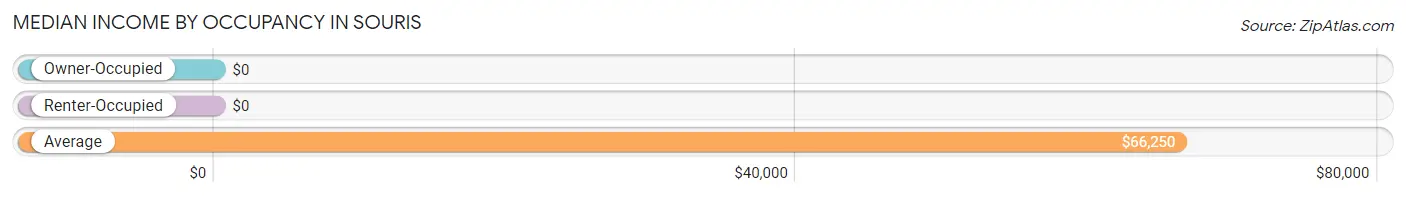
| Occupancy Type | # Households | Median Income |
| Owner-Occupied | 24 (64.9%) | $0 |
| Renter-Occupied | 13 (35.1%) | $0 |
| Average | 37 (100.0%) | $66,250 |
Occupancy by Householder Income Bracket in Souris
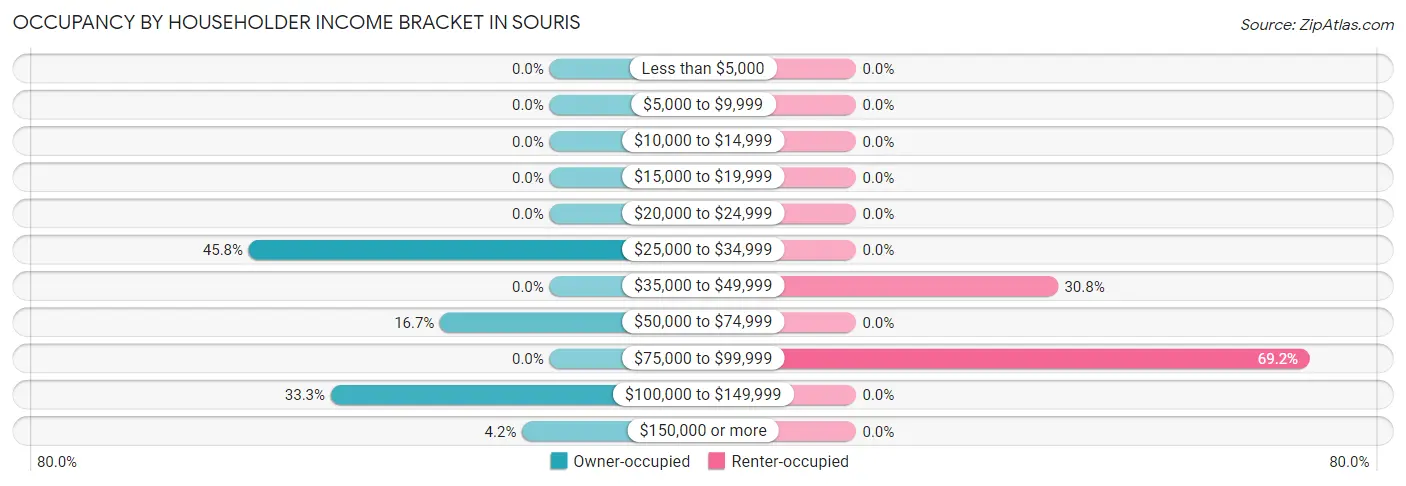
| Income Bracket | Owner-occupied | Renter-occupied |
| Less than $5,000 | 0 (0.0%) | 0 (0.0%) |
| $5,000 to $9,999 | 0 (0.0%) | 0 (0.0%) |
| $10,000 to $14,999 | 0 (0.0%) | 0 (0.0%) |
| $15,000 to $19,999 | 0 (0.0%) | 0 (0.0%) |
| $20,000 to $24,999 | 0 (0.0%) | 0 (0.0%) |
| $25,000 to $34,999 | 11 (45.8%) | 0 (0.0%) |
| $35,000 to $49,999 | 0 (0.0%) | 4 (30.8%) |
| $50,000 to $74,999 | 4 (16.7%) | 0 (0.0%) |
| $75,000 to $99,999 | 0 (0.0%) | 9 (69.2%) |
| $100,000 to $149,999 | 8 (33.3%) | 0 (0.0%) |
| $150,000 or more | 1 (4.2%) | 0 (0.0%) |
| Total | 24 (100.0%) | 13 (100.0%) |
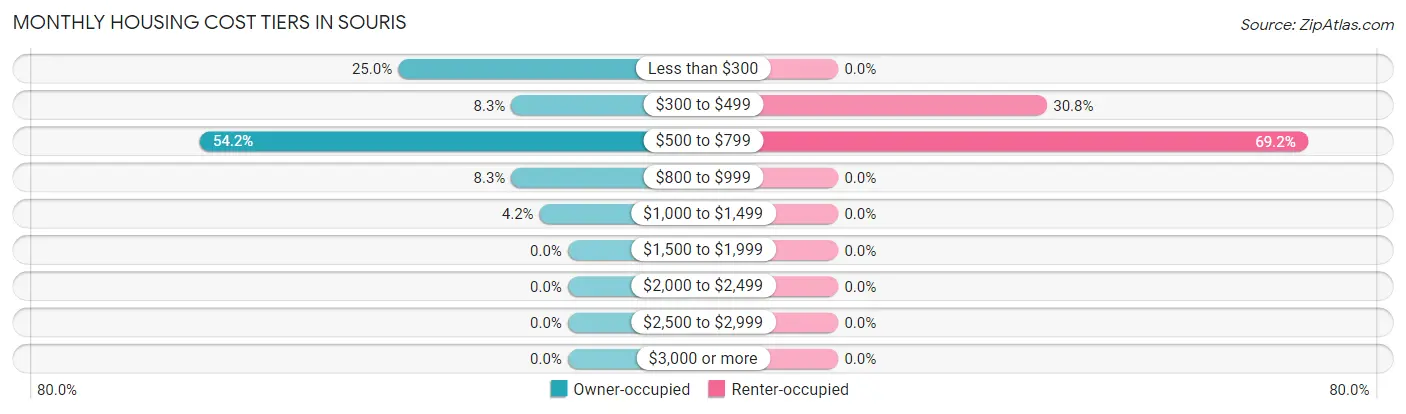
Monthly Housing Cost Tiers in Souris
| Monthly Cost | Owner-occupied | Renter-occupied |
| Less than $300 | 6 (25.0%) | 0 (0.0%) |
| $300 to $499 | 2 (8.3%) | 4 (30.8%) |
| $500 to $799 | 13 (54.2%) | 9 (69.2%) |
| $800 to $999 | 2 (8.3%) | 0 (0.0%) |
| $1,000 to $1,499 | 1 (4.2%) | 0 (0.0%) |
| $1,500 to $1,999 | 0 (0.0%) | 0 (0.0%) |
| $2,000 to $2,499 | 0 (0.0%) | 0 (0.0%) |
| $2,500 to $2,999 | 0 (0.0%) | 0 (0.0%) |
| $3,000 or more | 0 (0.0%) | 0 (0.0%) |
| Total | 24 (100.0%) | 13 (100.0%) |
Physical Housing Characteristics in Souris
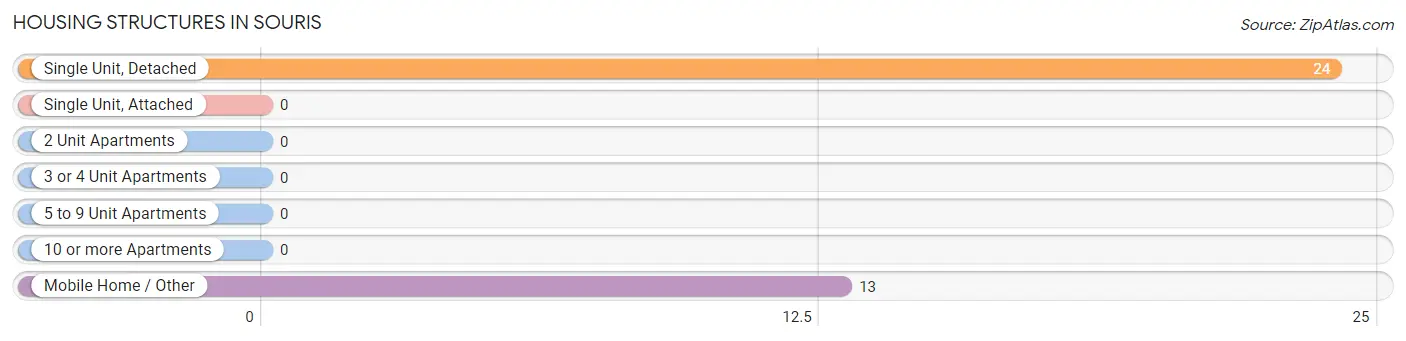
Housing Structures in Souris
| Structure Type | # Housing Units | % Housing Units |
| Single Unit, Detached | 24 | 64.9% |
| Single Unit, Attached | 0 | 0.0% |
| 2 Unit Apartments | 0 | 0.0% |
| 3 or 4 Unit Apartments | 0 | 0.0% |
| 5 to 9 Unit Apartments | 0 | 0.0% |
| 10 or more Apartments | 0 | 0.0% |
| Mobile Home / Other | 13 | 35.1% |
| Total | 37 | 100.0% |
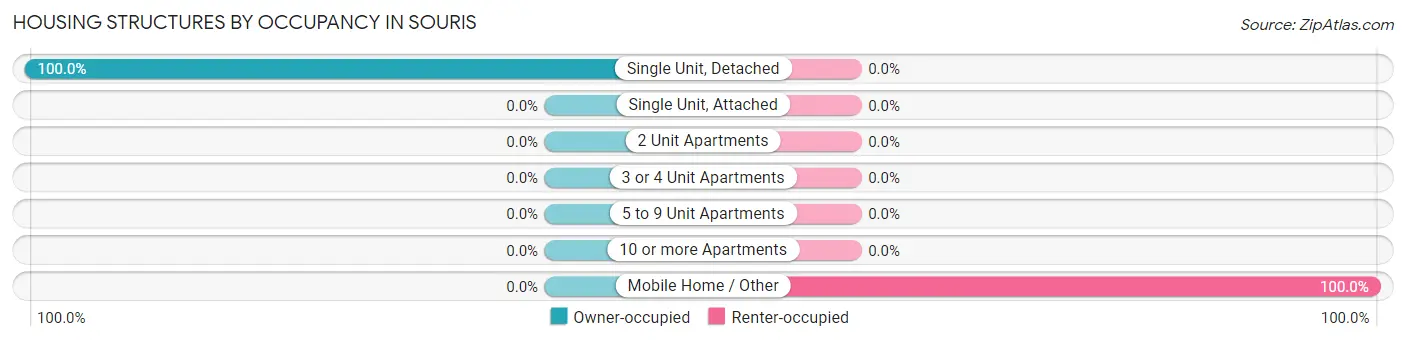
Housing Structures by Occupancy in Souris
| Structure Type | Owner-occupied | Renter-occupied |
| Single Unit, Detached | 24 (100.0%) | 0 (0.0%) |
| Single Unit, Attached | 0 (0.0%) | 0 (0.0%) |
| 2 Unit Apartments | 0 (0.0%) | 0 (0.0%) |
| 3 or 4 Unit Apartments | 0 (0.0%) | 0 (0.0%) |
| 5 to 9 Unit Apartments | 0 (0.0%) | 0 (0.0%) |
| 10 or more Apartments | 0 (0.0%) | 0 (0.0%) |
| Mobile Home / Other | 0 (0.0%) | 13 (100.0%) |
| Total | 24 (64.9%) | 13 (35.1%) |
Housing Structures by Number of Rooms in Souris
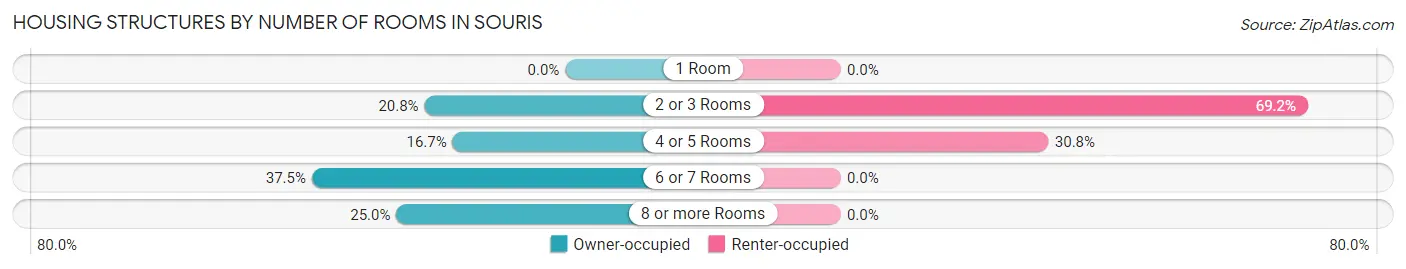
| Number of Rooms | Owner-occupied | Renter-occupied |
| 1 Room | 0 (0.0%) | 0 (0.0%) |
| 2 or 3 Rooms | 5 (20.8%) | 9 (69.2%) |
| 4 or 5 Rooms | 4 (16.7%) | 4 (30.8%) |
| 6 or 7 Rooms | 9 (37.5%) | 0 (0.0%) |
| 8 or more Rooms | 6 (25.0%) | 0 (0.0%) |
| Total | 24 (100.0%) | 13 (100.0%) |
Housing Structure by Heating Type in Souris
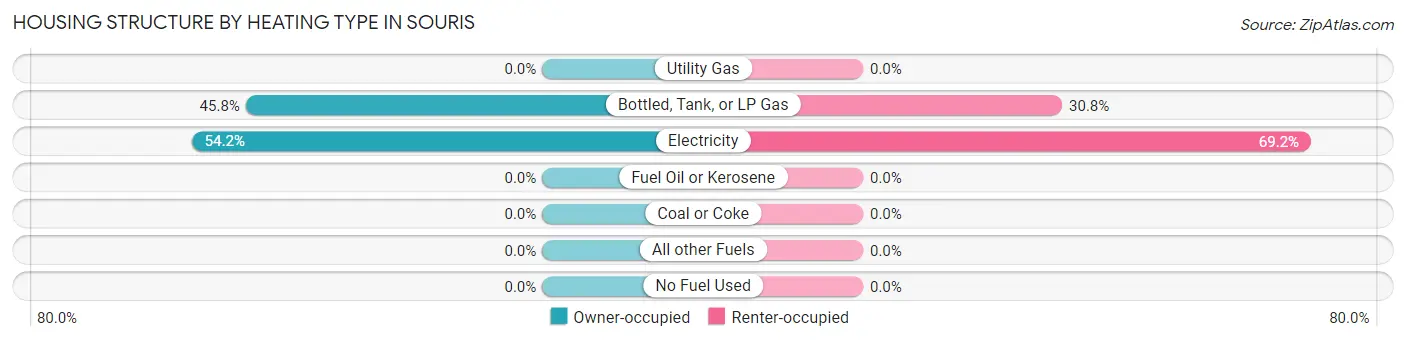
| Heating Type | Owner-occupied | Renter-occupied |
| Utility Gas | 0 (0.0%) | 0 (0.0%) |
| Bottled, Tank, or LP Gas | 11 (45.8%) | 4 (30.8%) |
| Electricity | 13 (54.2%) | 9 (69.2%) |
| Fuel Oil or Kerosene | 0 (0.0%) | 0 (0.0%) |
| Coal or Coke | 0 (0.0%) | 0 (0.0%) |
| All other Fuels | 0 (0.0%) | 0 (0.0%) |
| No Fuel Used | 0 (0.0%) | 0 (0.0%) |
| Total | 24 (100.0%) | 13 (100.0%) |
Household Vehicle Usage in Souris
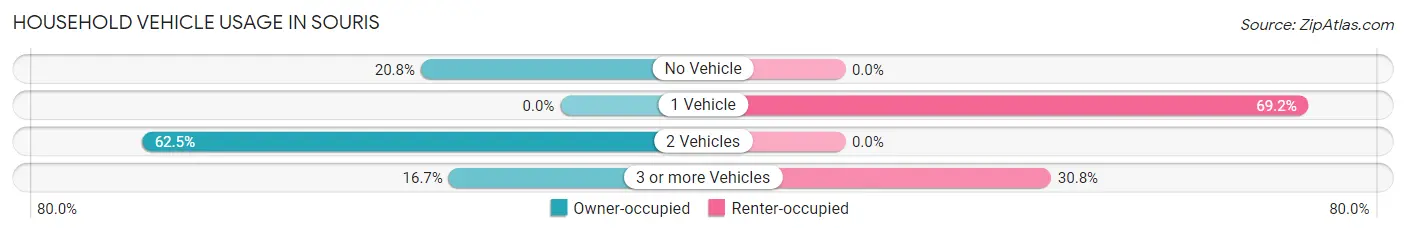
| Vehicles per Household | Owner-occupied | Renter-occupied |
| No Vehicle | 5 (20.8%) | 0 (0.0%) |
| 1 Vehicle | 0 (0.0%) | 9 (69.2%) |
| 2 Vehicles | 15 (62.5%) | 0 (0.0%) |
| 3 or more Vehicles | 4 (16.7%) | 4 (30.8%) |
| Total | 24 (100.0%) | 13 (100.0%) |
Real Estate & Mortgages in Souris
Real Estate and Mortgage Overview in Souris
| Characteristic | Without Mortgage | With Mortgage |
| Housing Units | 18 | 6 |
| Median Property Value | - | - |
| Median Household Income | - | - |
| Monthly Housing Costs | $518 | $0 |
| Real Estate Taxes | - | - |
Property Value by Mortgage Status in Souris
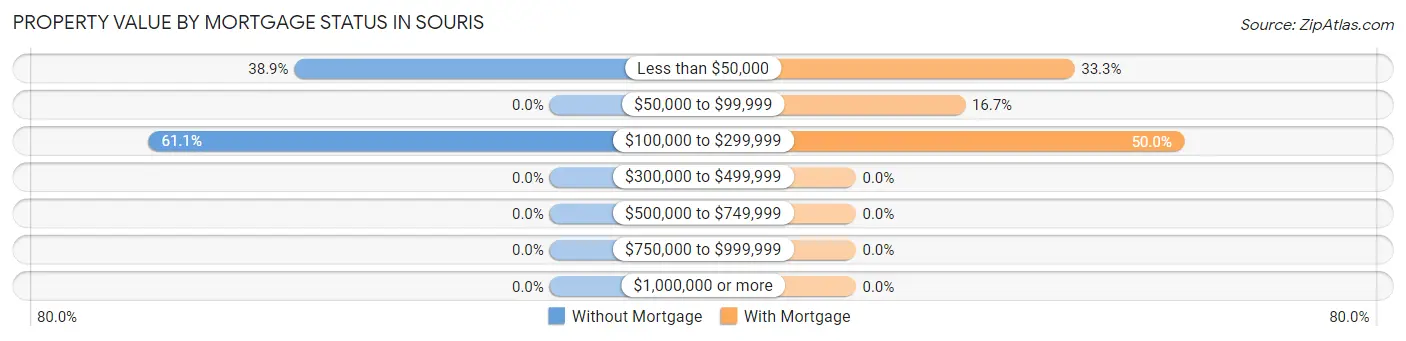
| Property Value | Without Mortgage | With Mortgage |
| Less than $50,000 | 7 (38.9%) | 2 (33.3%) |
| $50,000 to $99,999 | 0 (0.0%) | 1 (16.7%) |
| $100,000 to $299,999 | 11 (61.1%) | 3 (50.0%) |
| $300,000 to $499,999 | 0 (0.0%) | 0 (0.0%) |
| $500,000 to $749,999 | 0 (0.0%) | 0 (0.0%) |
| $750,000 to $999,999 | 0 (0.0%) | 0 (0.0%) |
| $1,000,000 or more | 0 (0.0%) | 0 (0.0%) |
| Total | 18 (100.0%) | 6 (100.0%) |
Household Income by Mortgage Status in Souris
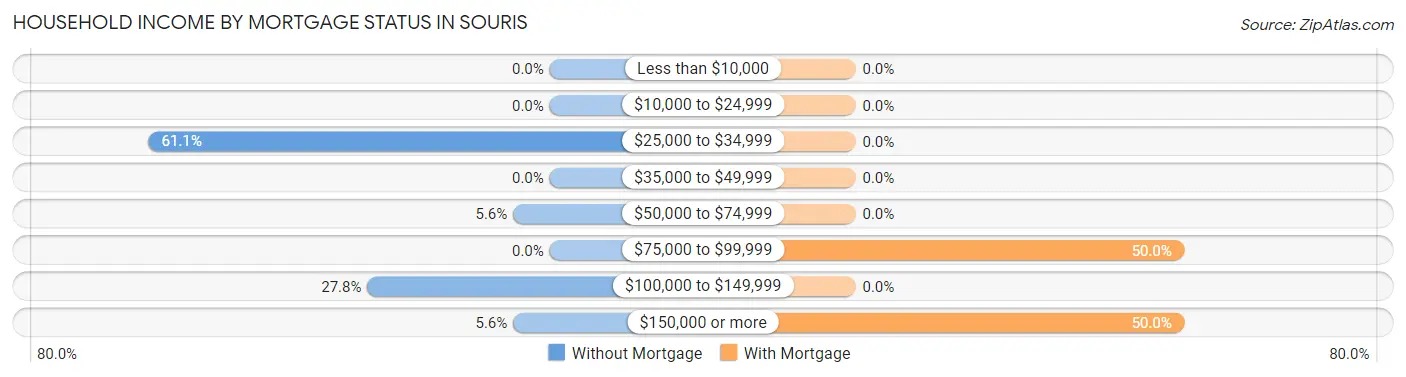
| Household Income | Without Mortgage | With Mortgage |
| Less than $10,000 | 0 (0.0%) | 0 (0.0%) |
| $10,000 to $24,999 | 0 (0.0%) | 0 (0.0%) |
| $25,000 to $34,999 | 11 (61.1%) | 0 (0.0%) |
| $35,000 to $49,999 | 0 (0.0%) | 0 (0.0%) |
| $50,000 to $74,999 | 1 (5.6%) | 0 (0.0%) |
| $75,000 to $99,999 | 0 (0.0%) | 3 (50.0%) |
| $100,000 to $149,999 | 5 (27.8%) | 0 (0.0%) |
| $150,000 or more | 1 (5.6%) | 3 (50.0%) |
| Total | 18 (100.0%) | 6 (100.0%) |
Property Value to Household Income Ratio in Souris
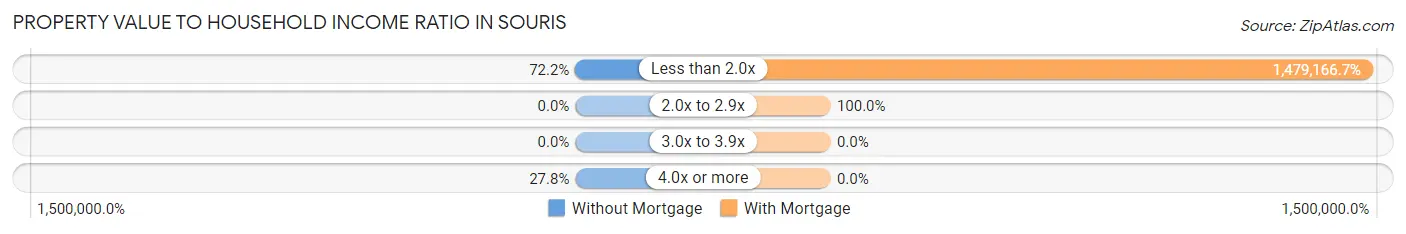
| Value-to-Income Ratio | Without Mortgage | With Mortgage |
| Less than 2.0x | 13 (72.2%) | 88,750 (1,479,166.7%) |
| 2.0x to 2.9x | 0 (0.0%) | 6 (100.0%) |
| 3.0x to 3.9x | 0 (0.0%) | 0 (0.0%) |
| 4.0x or more | 5 (27.8%) | 0 (0.0%) |
| Total | 18 (100.0%) | 6 (100.0%) |
Real Estate Taxes by Mortgage Status in Souris
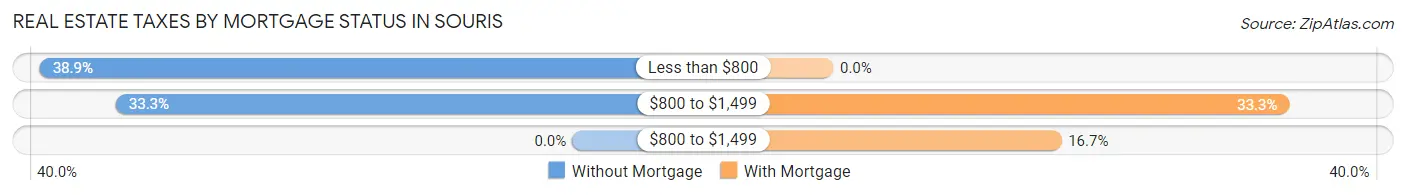
| Property Taxes | Without Mortgage | With Mortgage |
| Less than $800 | 7 (38.9%) | 0 (0.0%) |
| $800 to $1,499 | 6 (33.3%) | 2 (33.3%) |
| $800 to $1,499 | 0 (0.0%) | 1 (16.7%) |
| Total | 18 (100.0%) | 6 (100.0%) |
Health & Disability in Souris
Health Insurance Coverage by Age in Souris
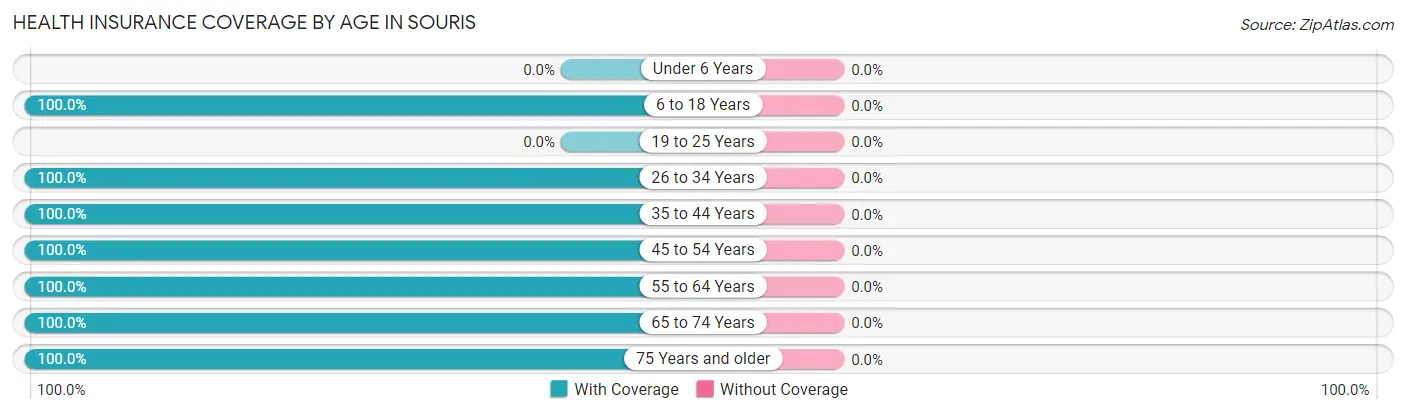
| Age Bracket | With Coverage | Without Coverage |
| Under 6 Years | 0 (0.0%) | 0 (0.0%) |
| 6 to 18 Years | 9 (100.0%) | 0 (0.0%) |
| 19 to 25 Years | 0 (0.0%) | 0 (0.0%) |
| 26 to 34 Years | 13 (100.0%) | 0 (0.0%) |
| 35 to 44 Years | 2 (100.0%) | 0 (0.0%) |
| 45 to 54 Years | 7 (100.0%) | 0 (0.0%) |
| 55 to 64 Years | 11 (100.0%) | 0 (0.0%) |
| 65 to 74 Years | 14 (100.0%) | 0 (0.0%) |
| 75 Years and older | 1 (100.0%) | 0 (0.0%) |
| Total | 57 (100.0%) | 0 (0.0%) |
Health Insurance Coverage by Citizenship Status in Souris
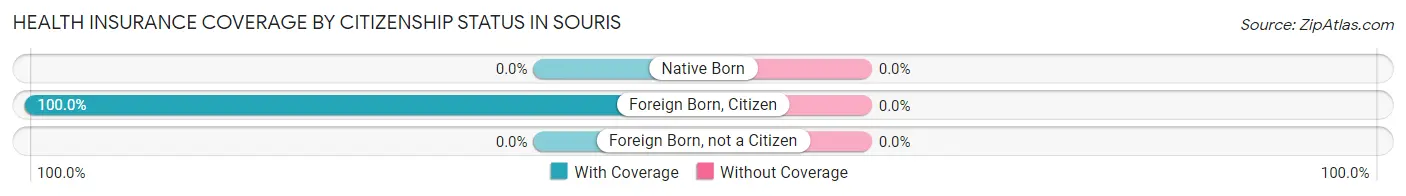
| Citizenship Status | With Coverage | Without Coverage |
| Native Born | 0 (0.0%) | 0 (0.0%) |
| Foreign Born, Citizen | 9 (100.0%) | 0 (0.0%) |
| Foreign Born, not a Citizen | 0 (0.0%) | 0 (0.0%) |
Health Insurance Coverage by Household Income in Souris
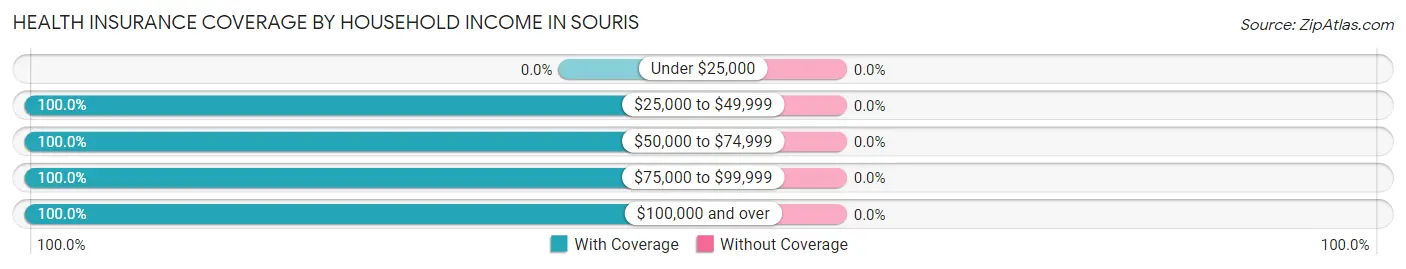
| Household Income | With Coverage | Without Coverage |
| Under $25,000 | 0 (0.0%) | 0 (0.0%) |
| $25,000 to $49,999 | 15 (100.0%) | 0 (0.0%) |
| $50,000 to $74,999 | 19 (100.0%) | 0 (0.0%) |
| $75,000 to $99,999 | 9 (100.0%) | 0 (0.0%) |
| $100,000 and over | 14 (100.0%) | 0 (0.0%) |
Public vs Private Health Insurance Coverage by Age in Souris
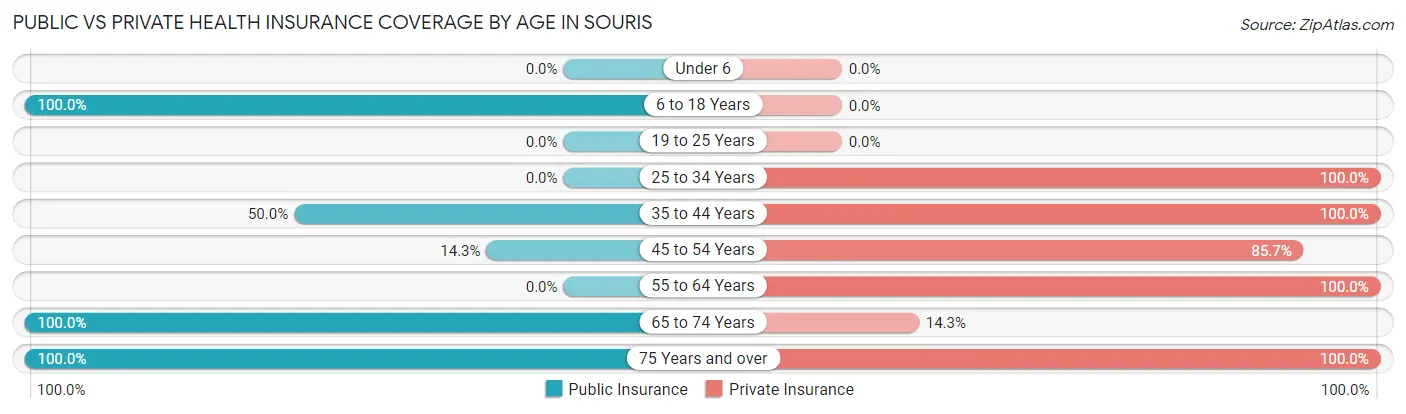
| Age Bracket | Public Insurance | Private Insurance |
| Under 6 | 0 (0.0%) | 0 (0.0%) |
| 6 to 18 Years | 9 (100.0%) | 0 (0.0%) |
| 19 to 25 Years | 0 (0.0%) | 0 (0.0%) |
| 25 to 34 Years | 0 (0.0%) | 13 (100.0%) |
| 35 to 44 Years | 1 (50.0%) | 2 (100.0%) |
| 45 to 54 Years | 1 (14.3%) | 6 (85.7%) |
| 55 to 64 Years | 0 (0.0%) | 11 (100.0%) |
| 65 to 74 Years | 14 (100.0%) | 2 (14.3%) |
| 75 Years and over | 1 (100.0%) | 1 (100.0%) |
| Total | 26 (45.6%) | 35 (61.4%) |
Disability Status by Sex by Age in Souris
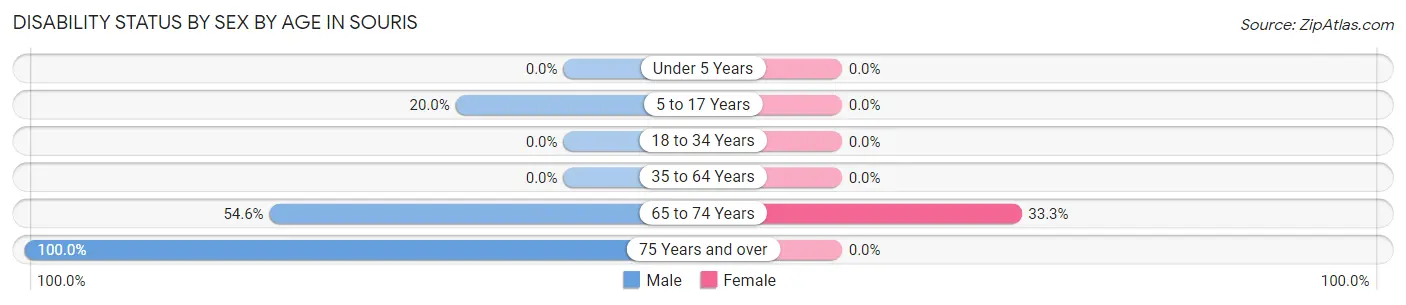
| Age Bracket | Male | Female |
| Under 5 Years | 0 (0.0%) | 0 (0.0%) |
| 5 to 17 Years | 1 (20.0%) | 0 (0.0%) |
| 18 to 34 Years | 0 (0.0%) | 0 (0.0%) |
| 35 to 64 Years | 0 (0.0%) | 0 (0.0%) |
| 65 to 74 Years | 6 (54.5%) | 1 (33.3%) |
| 75 Years and over | 1 (100.0%) | 0 (0.0%) |
Disability Class by Sex by Age in Souris
Disability Class: Hearing Difficulty
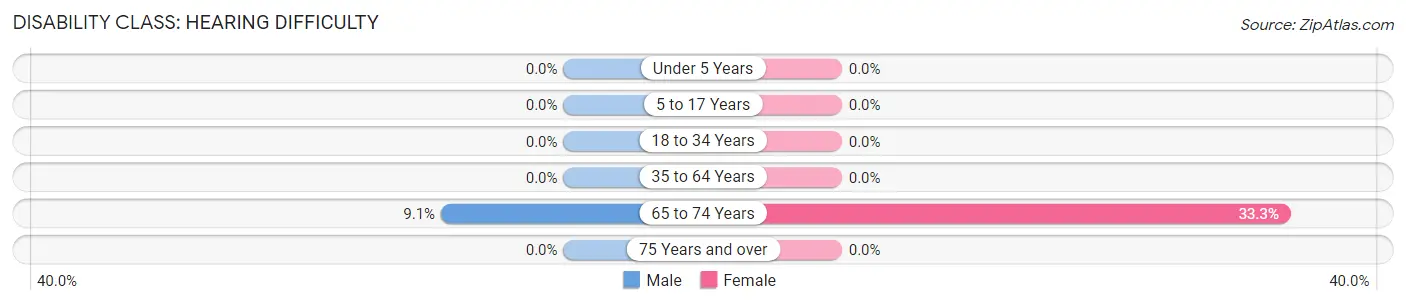
| Age Bracket | Male | Female |
| Under 5 Years | 0 (0.0%) | 0 (0.0%) |
| 5 to 17 Years | 0 (0.0%) | 0 (0.0%) |
| 18 to 34 Years | 0 (0.0%) | 0 (0.0%) |
| 35 to 64 Years | 0 (0.0%) | 0 (0.0%) |
| 65 to 74 Years | 1 (9.1%) | 1 (33.3%) |
| 75 Years and over | 0 (0.0%) | 0 (0.0%) |
Disability Class: Vision Difficulty
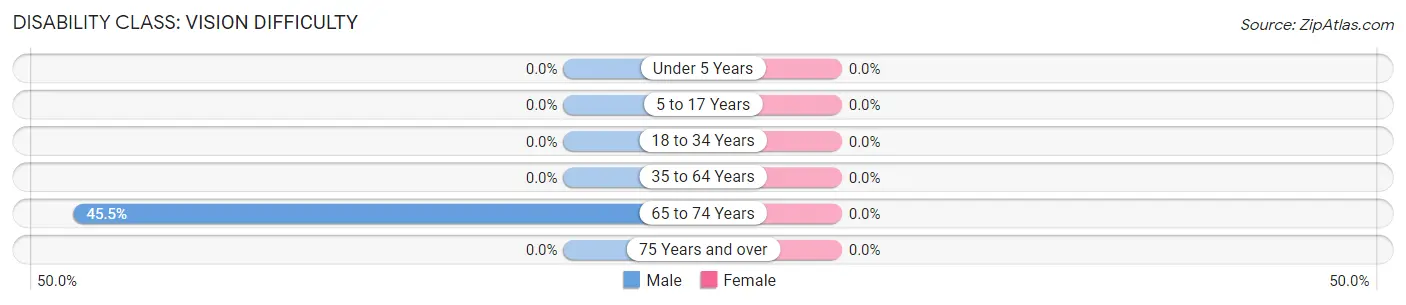
| Age Bracket | Male | Female |
| Under 5 Years | 0 (0.0%) | 0 (0.0%) |
| 5 to 17 Years | 0 (0.0%) | 0 (0.0%) |
| 18 to 34 Years | 0 (0.0%) | 0 (0.0%) |
| 35 to 64 Years | 0 (0.0%) | 0 (0.0%) |
| 65 to 74 Years | 5 (45.5%) | 0 (0.0%) |
| 75 Years and over | 0 (0.0%) | 0 (0.0%) |
Disability Class: Cognitive Difficulty
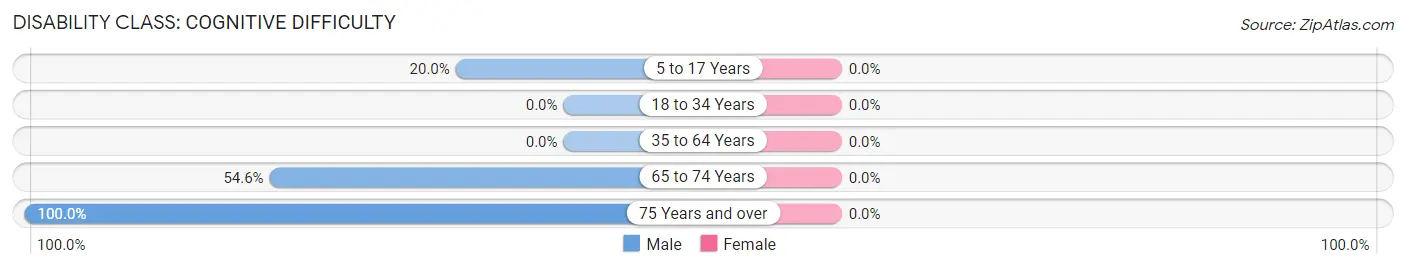
| Age Bracket | Male | Female |
| 5 to 17 Years | 1 (20.0%) | 0 (0.0%) |
| 18 to 34 Years | 0 (0.0%) | 0 (0.0%) |
| 35 to 64 Years | 0 (0.0%) | 0 (0.0%) |
| 65 to 74 Years | 6 (54.5%) | 0 (0.0%) |
| 75 Years and over | 1 (100.0%) | 0 (0.0%) |
Disability Class: Ambulatory Difficulty
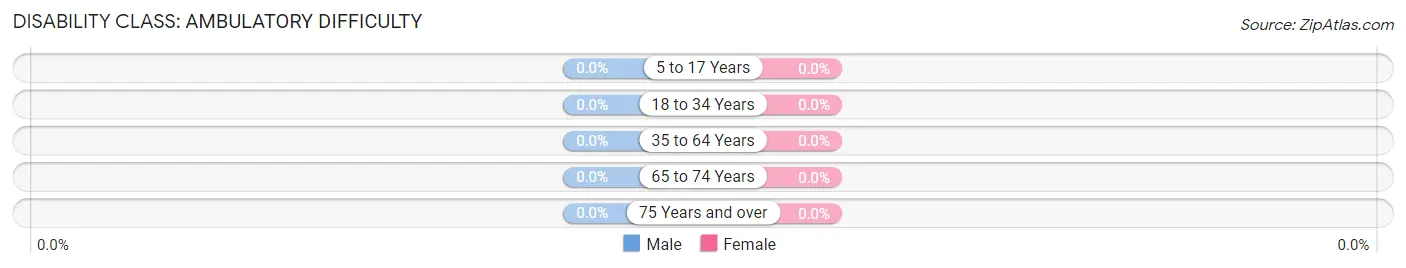
| Age Bracket | Male | Female |
| 5 to 17 Years | 0 (0.0%) | 0 (0.0%) |
| 18 to 34 Years | 0 (0.0%) | 0 (0.0%) |
| 35 to 64 Years | 0 (0.0%) | 0 (0.0%) |
| 65 to 74 Years | 0 (0.0%) | 0 (0.0%) |
| 75 Years and over | 0 (0.0%) | 0 (0.0%) |
Disability Class: Self-Care Difficulty
| Age Bracket | Male | Female |
| 5 to 17 Years | 0 (0.0%) | 0 (0.0%) |
| 18 to 34 Years | 0 (0.0%) | 0 (0.0%) |
| 35 to 64 Years | 0 (0.0%) | 0 (0.0%) |
| 65 to 74 Years | 0 (0.0%) | 0 (0.0%) |
| 75 Years and over | 0 (0.0%) | 0 (0.0%) |
Technology Access in Souris
Computing Device Access in Souris
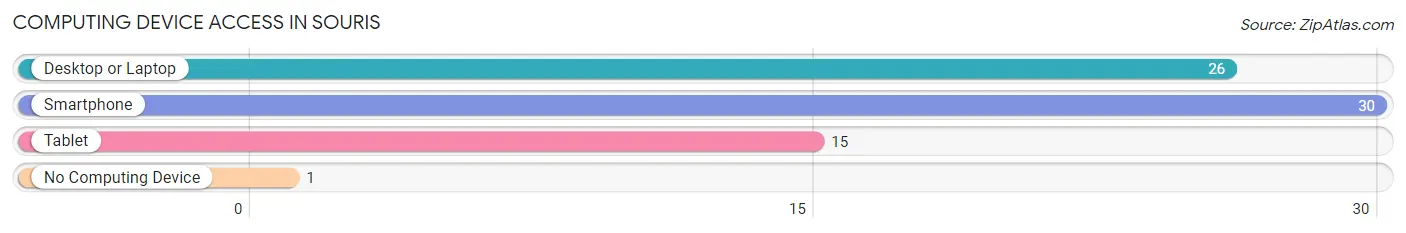
| Device Type | # Households | % Households |
| Desktop or Laptop | 26 | 70.3% |
| Smartphone | 30 | 81.1% |
| Tablet | 15 | 40.5% |
| No Computing Device | 1 | 2.7% |
| Total | 37 | 100.0% |
Internet Access in Souris
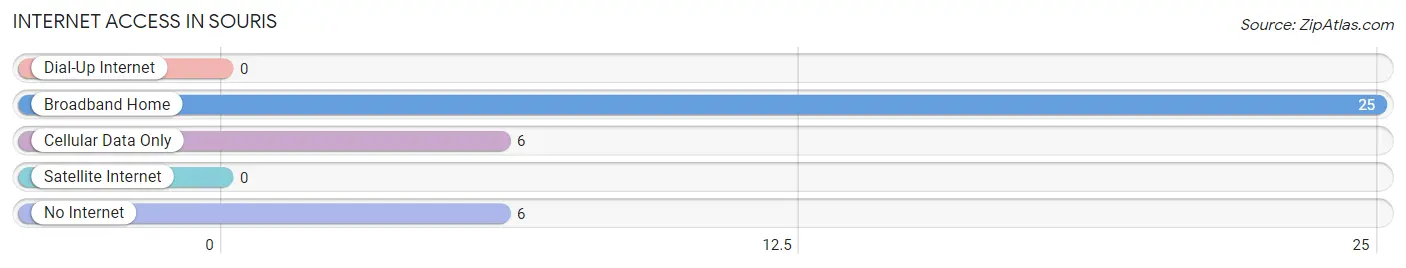
| Internet Type | # Households | % Households |
| Dial-Up Internet | 0 | 0.0% |
| Broadband Home | 25 | 67.6% |
| Cellular Data Only | 6 | 16.2% |
| Satellite Internet | 0 | 0.0% |
| No Internet | 6 | 16.2% |
| Total | 37 | 100.0% |
Souris Summary
Souris is a small town located in the Canadian province of Manitoba. It is situated in the southwestern corner of the province, near the border with Saskatchewan and North Dakota. The town is located on the Souris River, which is a tributary of the Assiniboine River. The town was founded in 1882 and is the oldest settlement in the area.
History
The area around Souris was first settled by the Cree and Assiniboine First Nations. The first European settlers arrived in the area in the late 1800s, and the town was officially founded in 1882. The town was named after the nearby Souris River, which was named by French fur traders in the 1700s. The town was initially a trading post and a stopping point for travelers.
In the early 1900s, the town began to grow and develop. The Canadian Pacific Railway built a line through the town in 1906, which helped to spur economic growth. The town also became a major agricultural center, with many farmers settling in the area.
Geography
Souris is located in the southwestern corner of Manitoba, near the border with Saskatchewan and North Dakota. The town is situated on the Souris River, which is a tributary of the Assiniboine River. The town is located in the Souris Plain, which is a flat, fertile plain that is ideal for farming. The town is surrounded by rolling hills and grasslands.
The climate in Souris is continental, with cold winters and warm summers. The average temperature in the winter is -14°C (7°F), and the average temperature in the summer is 21°C (70°F). The town receives an average of 25 cm (10 in) of precipitation per year.
Economy
The economy of Souris is largely based on agriculture. The town is located in the heart of the Souris Plain, which is an ideal area for farming. The main crops grown in the area are wheat, barley, oats, and canola. The town is also home to several livestock farms, which raise cattle, sheep, and pigs.
In addition to agriculture, the town is home to several small businesses. These include restaurants, retail stores, and service providers. The town is also home to a number of manufacturing companies, which produce a variety of products, including furniture, clothing, and food products.
Demographics
As of the 2016 census, the population of Souris was 1,845. The town has a diverse population, with people of various ethnic backgrounds. The largest ethnic group in the town is Canadian, followed by German, Ukrainian, and French. The town also has a small First Nations population.
The majority of the population is Christian, with the largest denominations being Catholic, United Church, and Lutheran. The town also has a small Jewish population. The median age in the town is 44.5 years, and the median household income is $45,000.
Conclusion
Souris is a small town located in the Canadian province of Manitoba. It is situated in the southwestern corner of the province, near the border with Saskatchewan and North Dakota. The town was founded in 1882 and is the oldest settlement in the area. The economy of Souris is largely based on agriculture, and the town is home to a diverse population. The town is also home to several small businesses, and manufacturing companies.
Common Questions
What is Per Capita Income in Souris?
Per Capita income in Souris is $50,888.
What is the Median Family Income in Souris?
Median Family Income in Souris is $111,250.
What is the Median Household income in Souris?
Median Household Income in Souris is $66,250.
What is Inequality or Gini Index in Souris?
Inequality or Gini Index in Souris is 0.33.
What is the Total Population of Souris?
Total Population of Souris is 57.
What is the Total Male Population of Souris?
Total Male Population of Souris is 44.
What is the Total Female Population of Souris?
Total Female Population of Souris is 13.
What is the Ratio of Males per 100 Females in Souris?
There are 338.46 Males per 100 Females in Souris.
What is the Ratio of Females per 100 Males in Souris?
There are 29.55 Females per 100 Males in Souris.
What is the Median Population Age in Souris?
Median Population Age in Souris is 53.3 Years.
What is the Average Family Size in Souris
Average Family Size in Souris is 3.4 People.
What is the Average Household Size in Souris
Average Household Size in Souris is 1.5 People.
How Large is the Labor Force in Souris?
There are 29 People in the Labor Forcein in Souris.
What is the Percentage of People in the Labor Force in Souris?
56.9% of People are in the Labor Force in Souris.