Logan, ND Map & Demographics
Logan Map
Logan Overview
$37,083
PER CAPITA INCOME
$108,523
AVG FAMILY INCOME
$108,750
AVG HOUSEHOLD INCOME
25.8%
WAGE / INCOME GAP [ % ]
74.2¢/ $1
WAGE / INCOME GAP [ $ ]
0.25
INEQUALITY / GINI INDEX
258
TOTAL POPULATION
149
MALE POPULATION
109
FEMALE POPULATION
136.70
MALES / 100 FEMALES
73.15
FEMALES / 100 MALES
43.6
MEDIAN AGE
3.7
AVG FAMILY SIZE
3.3
AVG HOUSEHOLD SIZE
102
LABOR FORCE [ PEOPLE ]
67.5%
PERCENT IN LABOR FORCE
Income in Logan
Income Overview in Logan
Per Capita Income in Logan is $37,083, while median incomes of families and households are $108,523 and $108,750 respectively.
| Characteristic | Number | Measure |
| Per Capita Income | 258 | $37,083 |
| Median Family Income | 62 | $108,523 |
| Mean Family Income | 62 | $126,994 |
| Median Household Income | 78 | $108,750 |
| Mean Household Income | 78 | $118,932 |
| Income Deficit | 62 | $0 |
| Wage / Income Gap (%) | 258 | 25.76% |
| Wage / Income Gap ($) | 258 | 74.24¢ per $1 |
| Gini / Inequality Index | 258 | 0.25 |
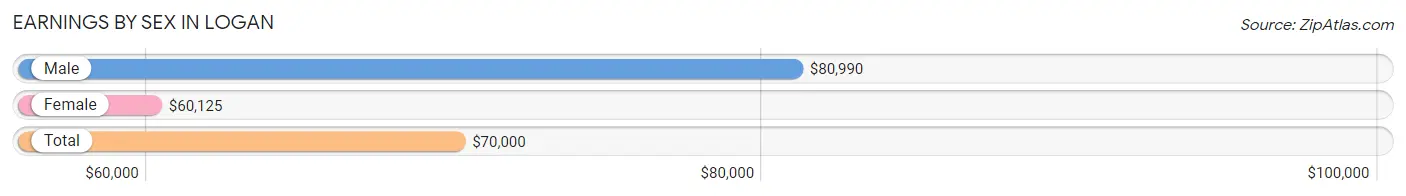
Earnings by Sex in Logan
Average Earnings in Logan are $70,000, $80,990 for men and $60,125 for women, a difference of 25.8%.
| Sex | Number | Average Earnings |
| Male | 67 (65.7%) | $80,990 |
| Female | 35 (34.3%) | $60,125 |
| Total | 102 (100.0%) | $70,000 |
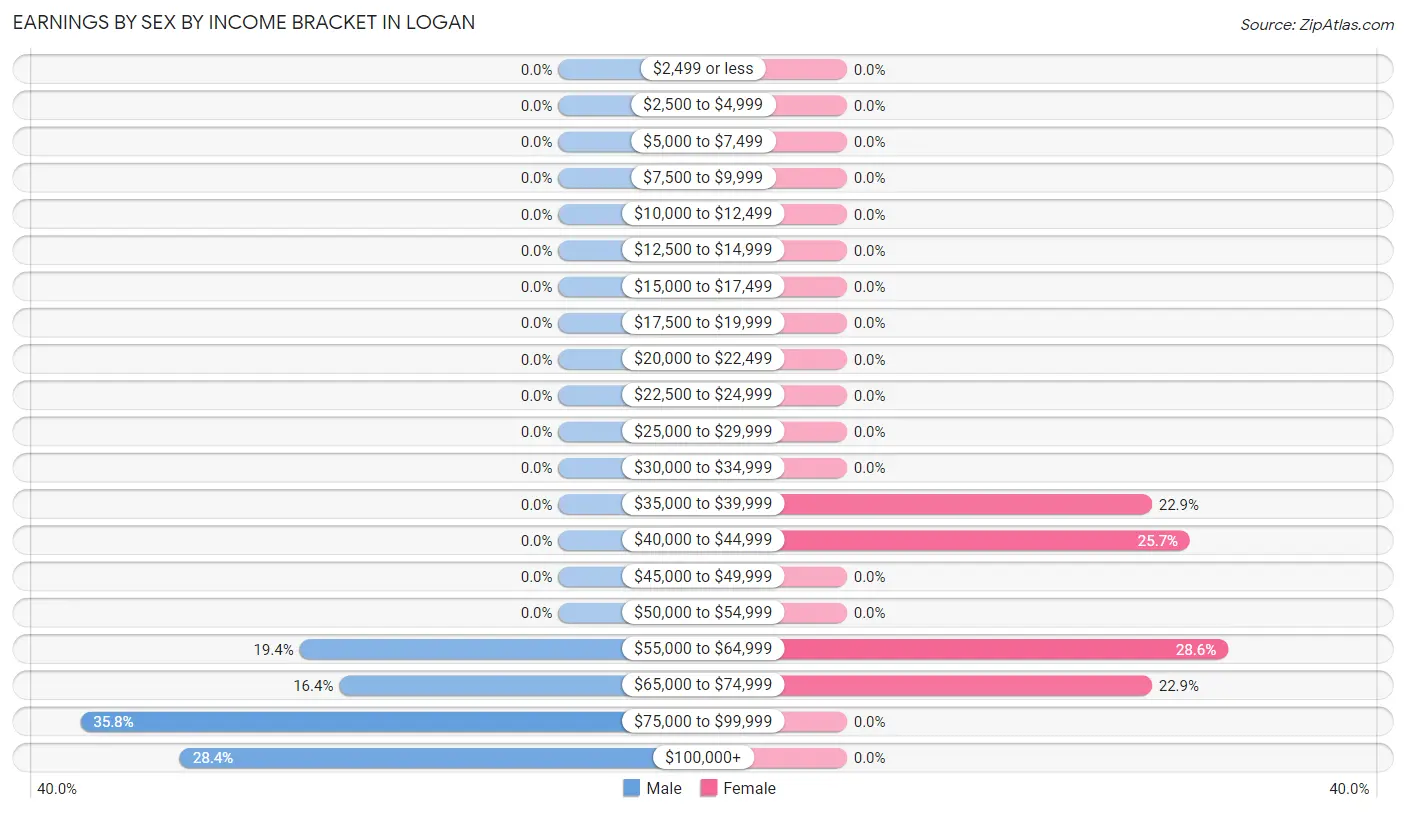
Earnings by Sex by Income Bracket in Logan
The most common earnings brackets in Logan are $75,000 to $99,999 for men (24 | 35.8%) and $55,000 to $64,999 for women (10 | 28.6%).
| Income | Male | Female |
| $2,499 or less | 0 (0.0%) | 0 (0.0%) |
| $2,500 to $4,999 | 0 (0.0%) | 0 (0.0%) |
| $5,000 to $7,499 | 0 (0.0%) | 0 (0.0%) |
| $7,500 to $9,999 | 0 (0.0%) | 0 (0.0%) |
| $10,000 to $12,499 | 0 (0.0%) | 0 (0.0%) |
| $12,500 to $14,999 | 0 (0.0%) | 0 (0.0%) |
| $15,000 to $17,499 | 0 (0.0%) | 0 (0.0%) |
| $17,500 to $19,999 | 0 (0.0%) | 0 (0.0%) |
| $20,000 to $22,499 | 0 (0.0%) | 0 (0.0%) |
| $22,500 to $24,999 | 0 (0.0%) | 0 (0.0%) |
| $25,000 to $29,999 | 0 (0.0%) | 0 (0.0%) |
| $30,000 to $34,999 | 0 (0.0%) | 0 (0.0%) |
| $35,000 to $39,999 | 0 (0.0%) | 8 (22.9%) |
| $40,000 to $44,999 | 0 (0.0%) | 9 (25.7%) |
| $45,000 to $49,999 | 0 (0.0%) | 0 (0.0%) |
| $50,000 to $54,999 | 0 (0.0%) | 0 (0.0%) |
| $55,000 to $64,999 | 13 (19.4%) | 10 (28.6%) |
| $65,000 to $74,999 | 11 (16.4%) | 8 (22.9%) |
| $75,000 to $99,999 | 24 (35.8%) | 0 (0.0%) |
| $100,000+ | 19 (28.4%) | 0 (0.0%) |
| Total | 67 (100.0%) | 35 (100.0%) |
Earnings by Sex by Educational Attainment in Logan
| Educational Attainment | Male Income | Female Income |
| Less than High School | - | - |
| High School Diploma | - | - |
| College or Associate's Degree | - | - |
| Bachelor's Degree | - | - |
| Graduate Degree | - | - |
| Total | $80,990 | $60,125 |
Family Income in Logan
Family Income Brackets in Logan
According to the Logan family income data, there are 31 families falling into the $100,000 to $149,999 income range, which is the most common income bracket and makes up 50.0% of all families.
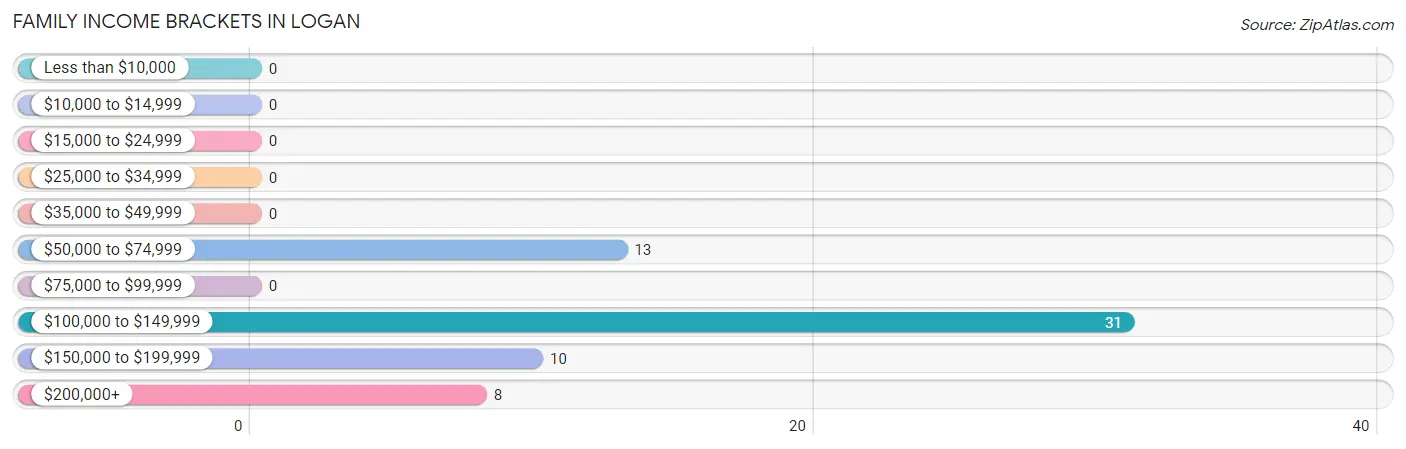
| Income Bracket | # Families | % Families |
| Less than $10,000 | 0 | 0.0% |
| $10,000 to $14,999 | 0 | 0.0% |
| $15,000 to $24,999 | 0 | 0.0% |
| $25,000 to $34,999 | 0 | 0.0% |
| $35,000 to $49,999 | 0 | 0.0% |
| $50,000 to $74,999 | 13 | 21.0% |
| $75,000 to $99,999 | 0 | 0.0% |
| $100,000 to $149,999 | 31 | 50.0% |
| $150,000 to $199,999 | 10 | 16.1% |
| $200,000+ | 8 | 12.9% |
Family Income by Famaliy Size in Logan
| Income Bracket | # Families | Median Income |
| 2-Person Families | 22 (35.5%) | $0 |
| 3-Person Families | 0 (0.0%) | $0 |
| 4-Person Families | 40 (64.5%) | $0 |
| 5-Person Families | 0 (0.0%) | $0 |
| 6-Person Families | 0 (0.0%) | $0 |
| 7+ Person Families | 0 (0.0%) | $0 |
| Total | 62 (100.0%) | $108,523 |
Family Income by Number of Earners in Logan
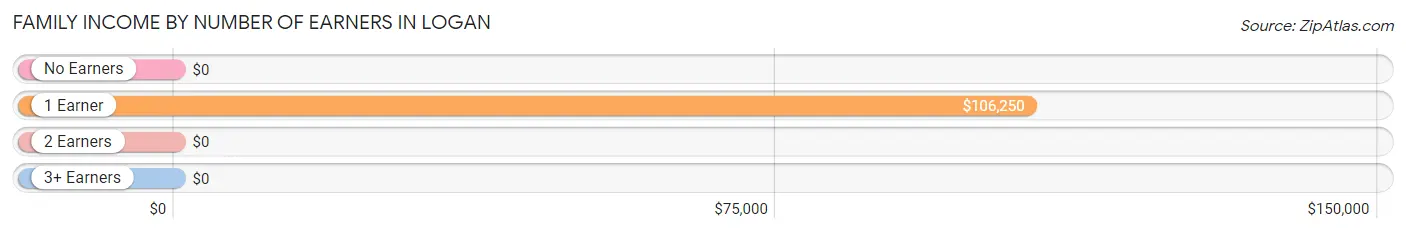
| Number of Earners | # Families | Median Income |
| No Earners | 0 (0.0%) | $0 |
| 1 Earner | 44 (71.0%) | $106,250 |
| 2 Earners | 18 (29.0%) | $0 |
| 3+ Earners | 0 (0.0%) | $0 |
| Total | 62 (100.0%) | $108,523 |
Household Income in Logan
Household Income Brackets in Logan
With 41 households falling in the category, the $100,000 to $149,999 income range is the most frequent in Logan, accounting for 52.6% of all households.
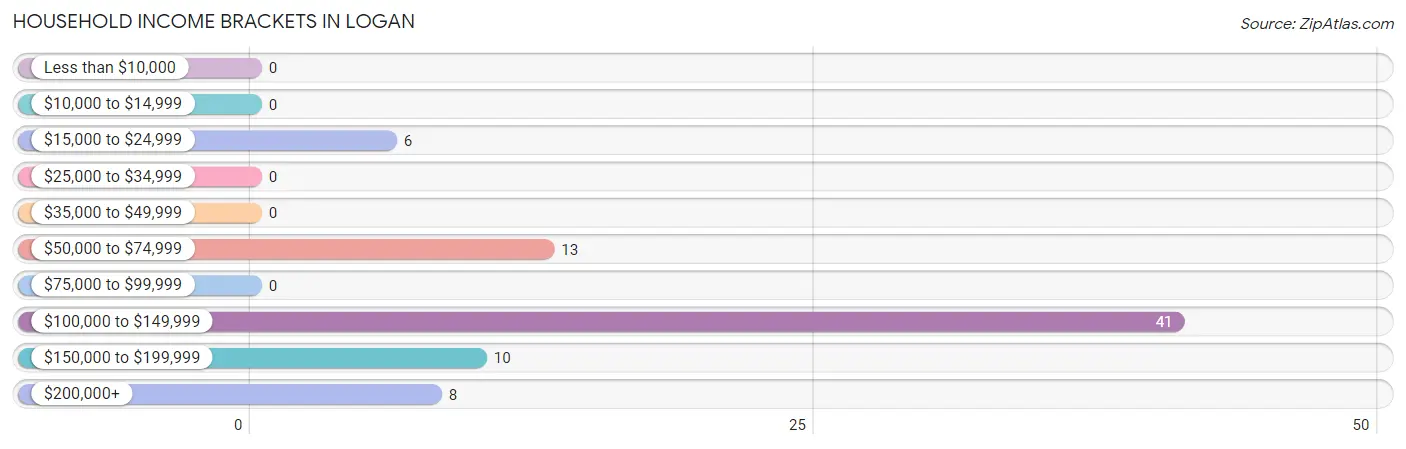
| Income Bracket | # Households | % Households |
| Less than $10,000 | 0 | 0.0% |
| $10,000 to $14,999 | 0 | 0.0% |
| $15,000 to $24,999 | 6 | 7.7% |
| $25,000 to $34,999 | 0 | 0.0% |
| $35,000 to $49,999 | 0 | 0.0% |
| $50,000 to $74,999 | 13 | 16.7% |
| $75,000 to $99,999 | 0 | 0.0% |
| $100,000 to $149,999 | 41 | 52.6% |
| $150,000 to $199,999 | 10 | 12.8% |
| $200,000+ | 8 | 10.3% |
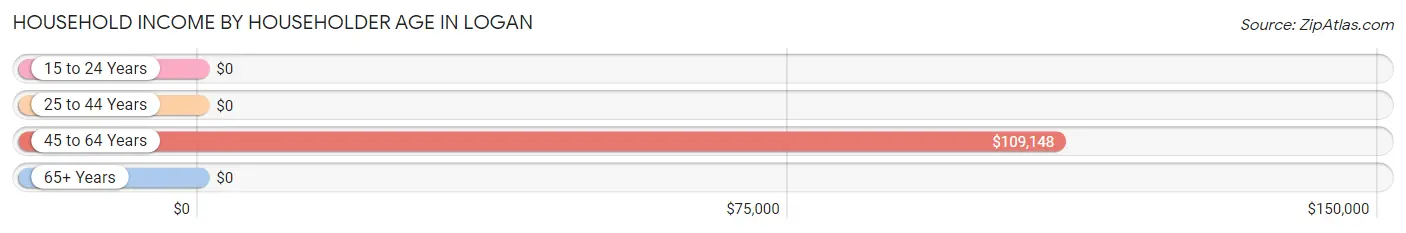
Household Income by Householder Age in Logan
The median household income in Logan is $108,750, with the highest median household income of $109,148 found in the 45 to 64 years age bracket for the primary householder. A total of 55 households (70.5%) fall into this category.
| Income Bracket | # Households | Median Income |
| 15 to 24 Years | 0 (0.0%) | $0 |
| 25 to 44 Years | 8 (10.3%) | $0 |
| 45 to 64 Years | 55 (70.5%) | $109,148 |
| 65+ Years | 15 (19.2%) | $0 |
| Total | 78 (100.0%) | $108,750 |
Poverty in Logan
Income Below Poverty by Sex and Age in Logan
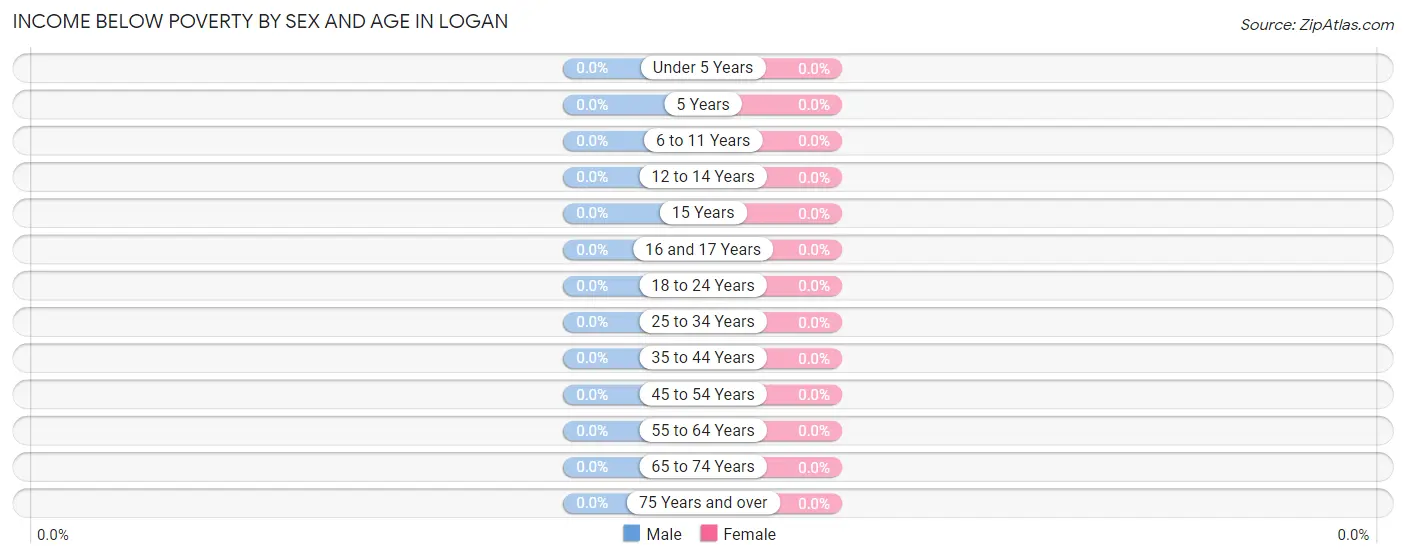
| Age Bracket | Male | Female |
| Under 5 Years | 0 (0.0%) | 0 (0.0%) |
| 5 Years | 0 (0.0%) | 0 (0.0%) |
| 6 to 11 Years | 0 (0.0%) | 0 (0.0%) |
| 12 to 14 Years | 0 (0.0%) | 0 (0.0%) |
| 15 Years | 0 (0.0%) | 0 (0.0%) |
| 16 and 17 Years | 0 (0.0%) | 0 (0.0%) |
| 18 to 24 Years | 0 (0.0%) | 0 (0.0%) |
| 25 to 34 Years | 0 (0.0%) | 0 (0.0%) |
| 35 to 44 Years | 0 (0.0%) | 0 (0.0%) |
| 45 to 54 Years | 0 (0.0%) | 0 (0.0%) |
| 55 to 64 Years | 0 (0.0%) | 0 (0.0%) |
| 65 to 74 Years | 0 (0.0%) | 0 (0.0%) |
| 75 Years and over | 0 (0.0%) | 0 (0.0%) |
| Total | 0 (0.0%) | 0 (0.0%) |
Income Above Poverty by Sex and Age in Logan
According to the poverty statistics in Logan, males aged under 5 years and females aged 6 to 11 years are the age groups that are most secure financially, with 100.0% of males and 100.0% of females in these age groups living above the poverty line.
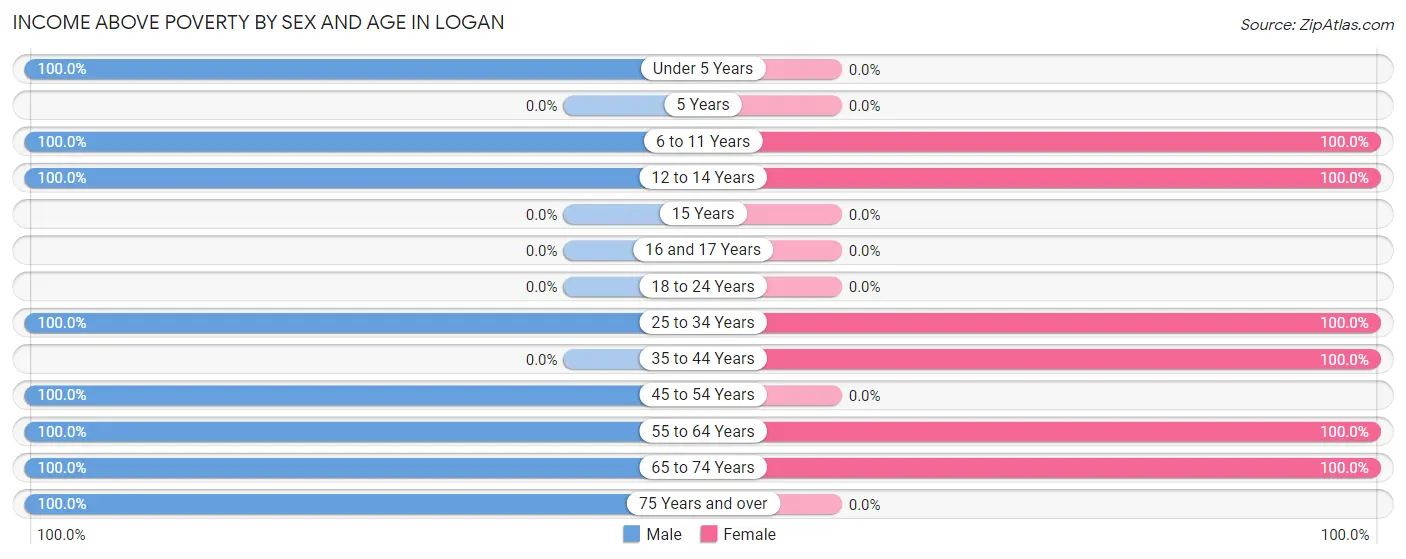
| Age Bracket | Male | Female |
| Under 5 Years | 26 (100.0%) | 0 (0.0%) |
| 5 Years | 0 (0.0%) | 0 (0.0%) |
| 6 to 11 Years | 12 (100.0%) | 31 (100.0%) |
| 12 to 14 Years | 29 (100.0%) | 9 (100.0%) |
| 15 Years | 0 (0.0%) | 0 (0.0%) |
| 16 and 17 Years | 0 (0.0%) | 0 (0.0%) |
| 18 to 24 Years | 0 (0.0%) | 0 (0.0%) |
| 25 to 34 Years | 9 (100.0%) | 8 (100.0%) |
| 35 to 44 Years | 0 (0.0%) | 8 (100.0%) |
| 45 to 54 Years | 10 (100.0%) | 0 (0.0%) |
| 55 to 64 Years | 48 (100.0%) | 44 (100.0%) |
| 65 to 74 Years | 9 (100.0%) | 9 (100.0%) |
| 75 Years and over | 6 (100.0%) | 0 (0.0%) |
| Total | 149 (100.0%) | 109 (100.0%) |
Income Below Poverty Among Married-Couple Families in Logan
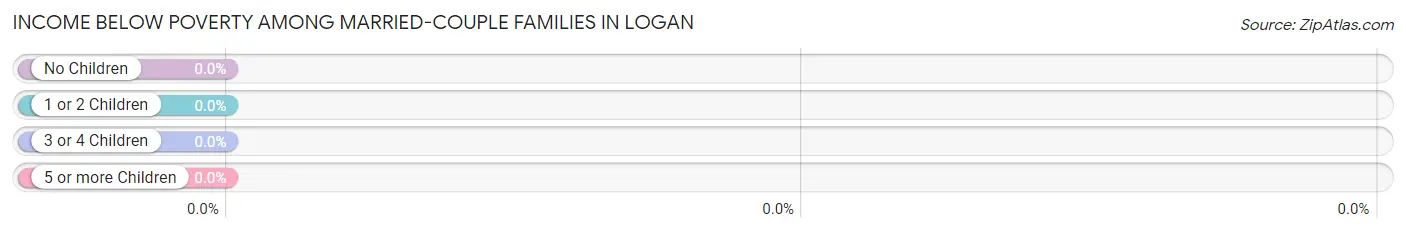
| Children | Above Poverty | Below Poverty |
| No Children | 22 (100.0%) | 0 (0.0%) |
| 1 or 2 Children | 40 (100.0%) | 0 (0.0%) |
| 3 or 4 Children | 0 (0.0%) | 0 (0.0%) |
| 5 or more Children | 0 (0.0%) | 0 (0.0%) |
| Total | 62 (100.0%) | 0 (0.0%) |
Income Below Poverty Among Single-Parent Households in Logan
| Children | Single Father | Single Mother |
| No Children | 0 (0.0%) | 0 (0.0%) |
| 1 or 2 Children | 0 (0.0%) | 0 (0.0%) |
| 3 or 4 Children | 0 (0.0%) | 0 (0.0%) |
| 5 or more Children | 0 (0.0%) | 0 (0.0%) |
| Total | 0 (0.0%) | 0 (0.0%) |
Income Below Poverty Among Married-Couple vs Single-Parent Households in Logan
| Children | Married-Couple Families | Single-Parent Households |
| No Children | 0 (0.0%) | 0 (0.0%) |
| 1 or 2 Children | 0 (0.0%) | 0 (0.0%) |
| 3 or 4 Children | 0 (0.0%) | 0 (0.0%) |
| 5 or more Children | 0 (0.0%) | 0 (0.0%) |
| Total | 0 (0.0%) | 0 (0.0%) |
Race in Logan
The most populous races in Logan are White / Caucasian (198 | 76.7%), and Two or more Races (60 | 23.3%).
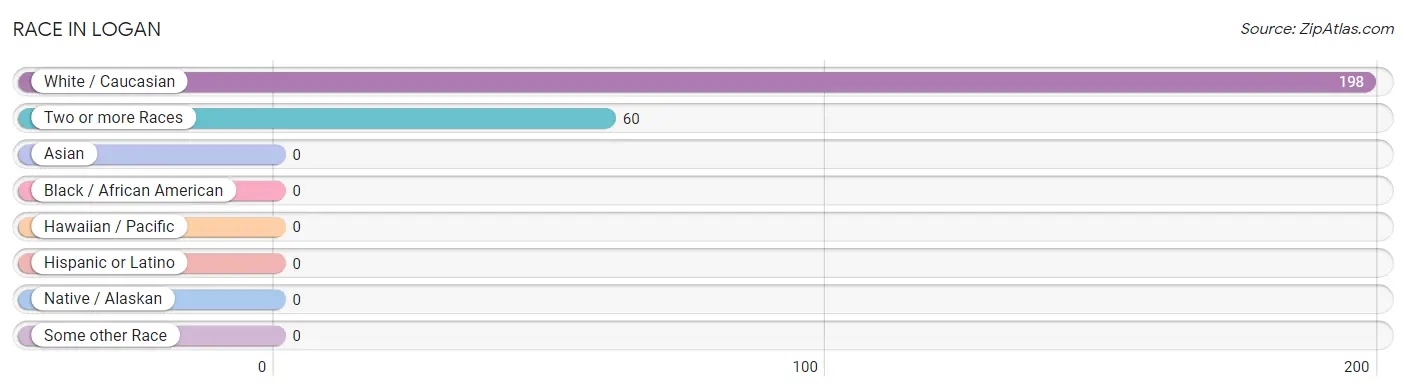
| Race | # Population | % Population |
| Asian | 0 | 0.0% |
| Black / African American | 0 | 0.0% |
| Hawaiian / Pacific | 0 | 0.0% |
| Hispanic or Latino | 0 | 0.0% |
| Native / Alaskan | 0 | 0.0% |
| White / Caucasian | 198 | 76.7% |
| Two or more Races | 60 | 23.3% |
| Some other Race | 0 | 0.0% |
| Total | 258 | 100.0% |
Ancestry in Logan
The most populous ancestries reported in Logan are Norwegian (198 | 76.7%), German (38 | 14.7%), and Dutch (10 | 3.9%), together accounting for 95.4% of all Logan residents.
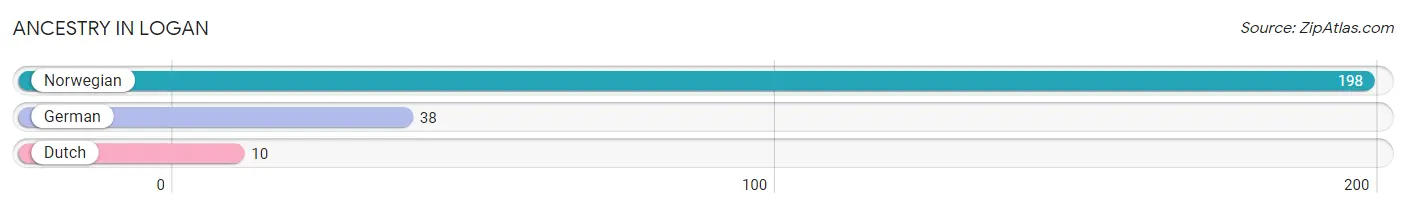
| Ancestry | # Population | % Population |
| Dutch | 10 | 3.9% |
| German | 38 | 14.7% |
| Norwegian | 198 | 76.7% | View All 3 Rows |
Immigrants in Logan

| Immigration Origin | # Population | % Population | View All 0 Rows |
Sex and Age in Logan
Sex and Age in Logan
The most populous age groups in Logan are 60 to 64 Years (37 | 24.8%) for men and 60 to 64 Years (34 | 31.2%) for women.
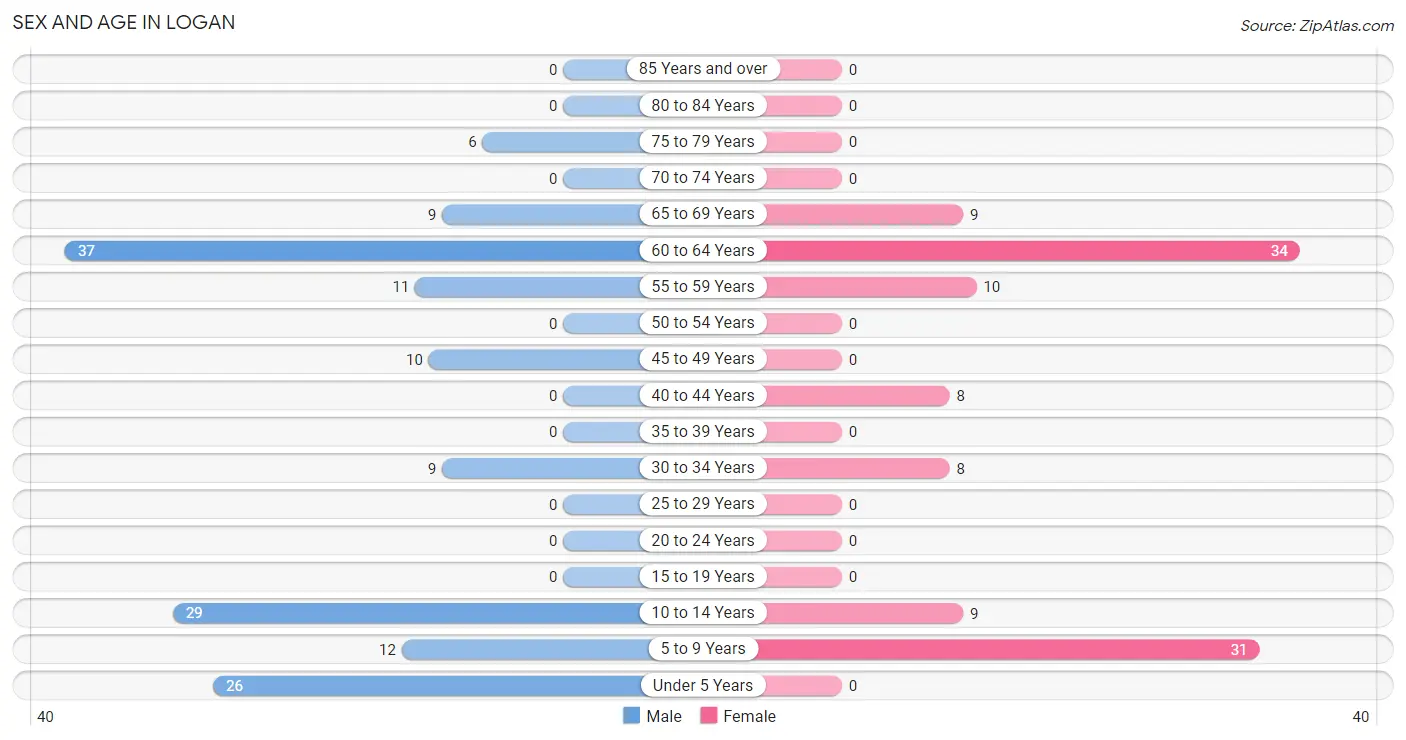
| Age Bracket | Male | Female |
| Under 5 Years | 26 (17.4%) | 0 (0.0%) |
| 5 to 9 Years | 12 (8.1%) | 31 (28.4%) |
| 10 to 14 Years | 29 (19.5%) | 9 (8.3%) |
| 15 to 19 Years | 0 (0.0%) | 0 (0.0%) |
| 20 to 24 Years | 0 (0.0%) | 0 (0.0%) |
| 25 to 29 Years | 0 (0.0%) | 0 (0.0%) |
| 30 to 34 Years | 9 (6.0%) | 8 (7.3%) |
| 35 to 39 Years | 0 (0.0%) | 0 (0.0%) |
| 40 to 44 Years | 0 (0.0%) | 8 (7.3%) |
| 45 to 49 Years | 10 (6.7%) | 0 (0.0%) |
| 50 to 54 Years | 0 (0.0%) | 0 (0.0%) |
| 55 to 59 Years | 11 (7.4%) | 10 (9.2%) |
| 60 to 64 Years | 37 (24.8%) | 34 (31.2%) |
| 65 to 69 Years | 9 (6.0%) | 9 (8.3%) |
| 70 to 74 Years | 0 (0.0%) | 0 (0.0%) |
| 75 to 79 Years | 6 (4.0%) | 0 (0.0%) |
| 80 to 84 Years | 0 (0.0%) | 0 (0.0%) |
| 85 Years and over | 0 (0.0%) | 0 (0.0%) |
| Total | 149 (100.0%) | 109 (100.0%) |
Families and Households in Logan
Median Family Size in Logan
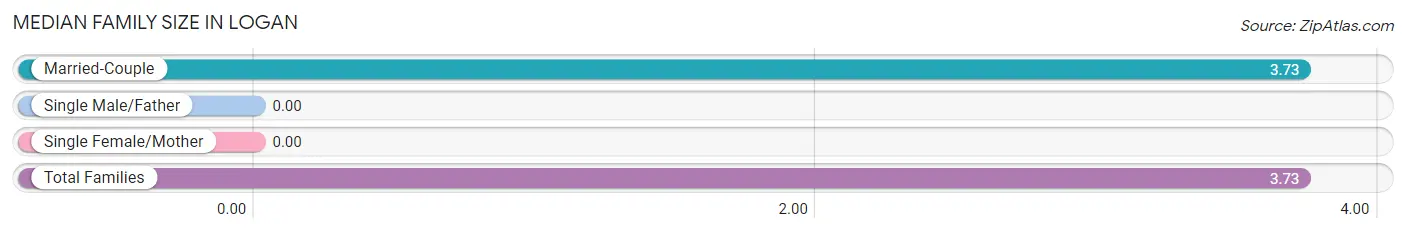
| Family Type | # Families | Family Size |
| Married-Couple | 62 (100.0%) | 3.73 |
| Single Male/Father | 0 (0.0%) | - |
| Single Female/Mother | 0 (0.0%) | - |
| Total Families | 62 (100.0%) | 3.73 |
Median Household Size in Logan
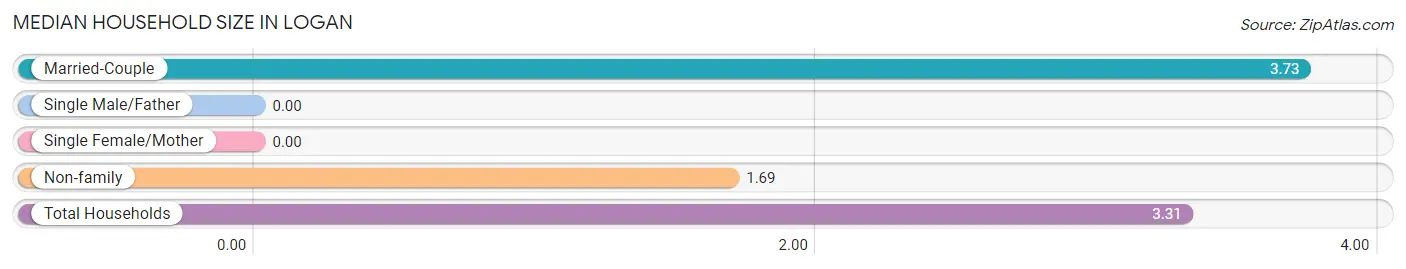
| Household Type | # Households | Household Size |
| Married-Couple | 62 (79.5%) | 3.73 |
| Single Male/Father | 0 (0.0%) | - |
| Single Female/Mother | 0 (0.0%) | - |
| Non-family | 16 (20.5%) | 1.69 |
| Total Households | 78 (100.0%) | 3.31 |
Household Size by Marriage Status in Logan
Out of a total of 78 households in Logan, 62 (79.5%) are family households, while 16 (20.5%) are nonfamily households. The most numerous type of family households are 4-person households, comprising 40, and the most common type of nonfamily households are 2-person households, comprising 10.
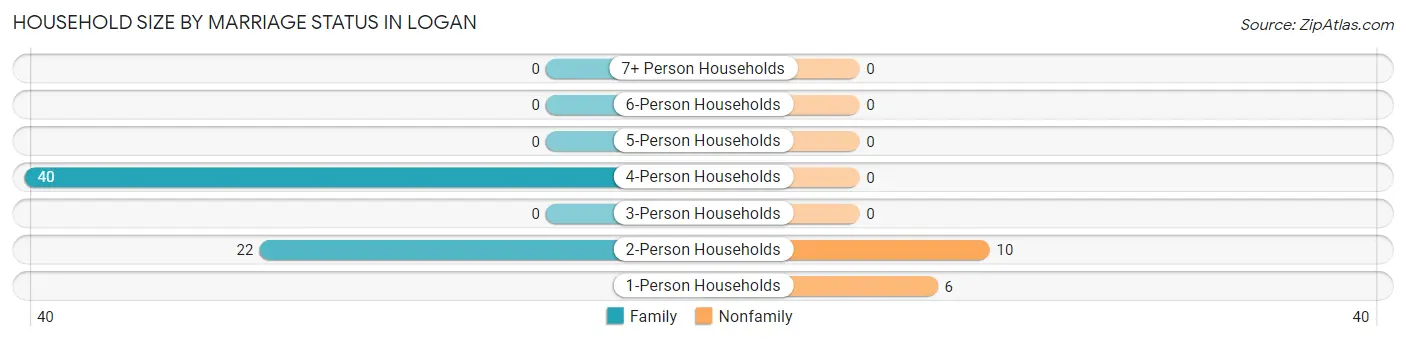
| Household Size | Family Households | Nonfamily Households |
| 1-Person Households | - | 6 (7.7%) |
| 2-Person Households | 22 (28.2%) | 10 (12.8%) |
| 3-Person Households | 0 (0.0%) | 0 (0.0%) |
| 4-Person Households | 40 (51.3%) | 0 (0.0%) |
| 5-Person Households | 0 (0.0%) | 0 (0.0%) |
| 6-Person Households | 0 (0.0%) | 0 (0.0%) |
| 7+ Person Households | 0 (0.0%) | 0 (0.0%) |
| Total | 62 (79.5%) | 16 (20.5%) |
Female Fertility in Logan
Fertility by Age in Logan
| Age Bracket | Women with Births | Births / 1,000 Women |
| 15 to 19 years | 0 (0.0%) | 0.0 |
| 20 to 34 years | 0 (0.0%) | 0.0 |
| 35 to 50 years | 0 (0.0%) | 0.0 |
| Total | 0 (0.0%) | 0.0 |
Fertility by Age by Marriage Status in Logan
| Age Bracket | Married | Unmarried |
| 15 to 19 years | 0 (0.0%) | 0 (0.0%) |
| 20 to 34 years | 0 (0.0%) | 0 (0.0%) |
| 35 to 50 years | 0 (0.0%) | 0 (0.0%) |
| Total | 0 (0.0%) | 0 (0.0%) |
Fertility by Education in Logan
| Educational Attainment | Women with Births | Births / 1,000 Women |
| Less than High School | 0 (0.0%) | 0.0 |
| High School Diploma | 0 (0.0%) | 0.0 |
| College or Associate's Degree | 0 (0.0%) | 0.0 |
| Bachelor's Degree | 0 (0.0%) | 0.0 |
| Graduate Degree | 0 (0.0%) | 0.0 |
| Total | 0 (0.0%) | 0.0 |
Fertility by Education by Marriage Status in Logan
| Educational Attainment | Married | Unmarried |
| Less than High School | 0 (0.0%) | 0 (0.0%) |
| High School Diploma | 0 (0.0%) | 0 (0.0%) |
| College or Associate's Degree | 0 (0.0%) | 0 (0.0%) |
| Bachelor's Degree | 0 (0.0%) | 0 (0.0%) |
| Graduate Degree | 0 (0.0%) | 0 (0.0%) |
| Total | 0 (0.0%) | 0 (0.0%) |
Employment Characteristics in Logan
Employment by Class of Employer in Logan
Among the 94 employed individuals in Logan, private company employees (41 | 43.6%), self-employed (not incorporated) (33 | 35.1%), and self-employed (incorporated) (10 | 10.6%) make up the most common classes of employment.
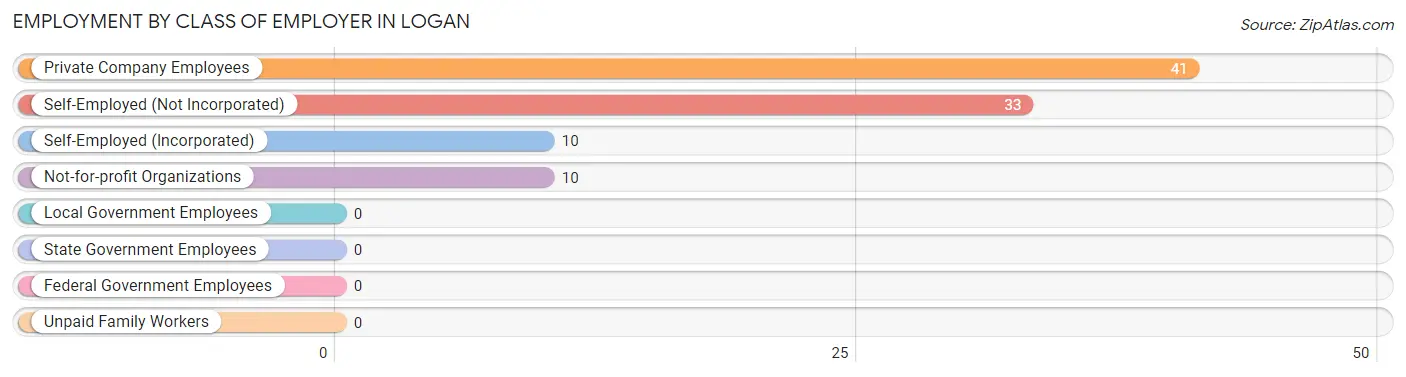
| Employer Class | # Employees | % Employees |
| Private Company Employees | 41 | 43.6% |
| Self-Employed (Incorporated) | 10 | 10.6% |
| Self-Employed (Not Incorporated) | 33 | 35.1% |
| Not-for-profit Organizations | 10 | 10.6% |
| Local Government Employees | 0 | 0.0% |
| State Government Employees | 0 | 0.0% |
| Federal Government Employees | 0 | 0.0% |
| Unpaid Family Workers | 0 | 0.0% |
| Total | 94 | 100.0% |
Employment Status by Age in Logan
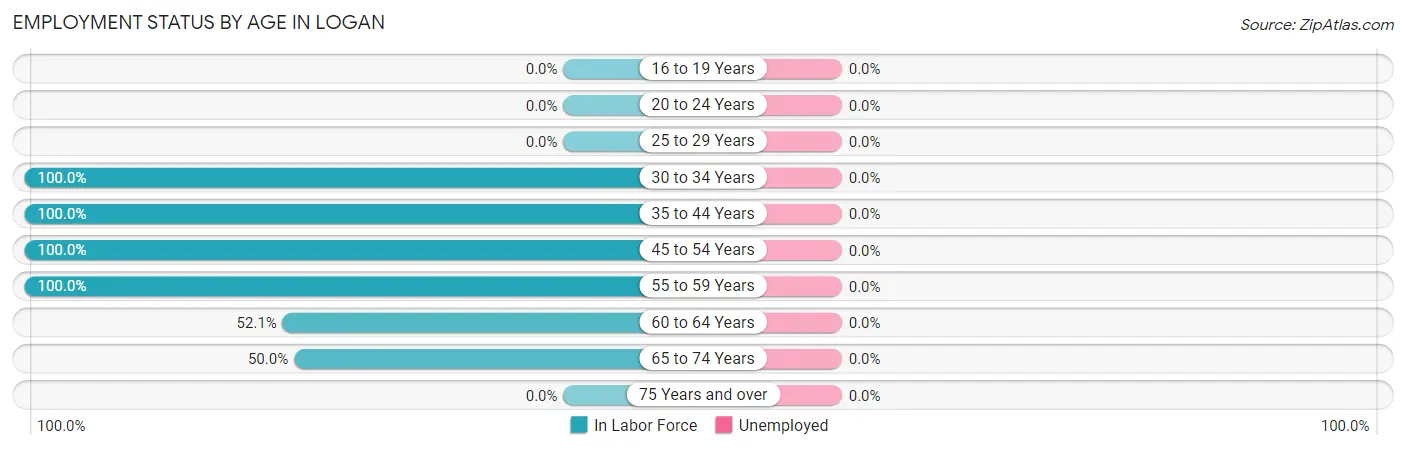
| Age Bracket | In Labor Force | Unemployed |
| 16 to 19 Years | 0 (0.0%) | 0 (0.0%) |
| 20 to 24 Years | 0 (0.0%) | 0 (0.0%) |
| 25 to 29 Years | 0 (0.0%) | 0 (0.0%) |
| 30 to 34 Years | 17 (100.0%) | 0 (0.0%) |
| 35 to 44 Years | 8 (100.0%) | 0 (0.0%) |
| 45 to 54 Years | 10 (100.0%) | 0 (0.0%) |
| 55 to 59 Years | 21 (100.0%) | 0 (0.0%) |
| 60 to 64 Years | 37 (52.1%) | 0 (0.0%) |
| 65 to 74 Years | 9 (50.0%) | 0 (0.0%) |
| 75 Years and over | 0 (0.0%) | 0 (0.0%) |
| Total | 102 (67.5%) | 0 (0.0%) |
Employment Status by Educational Attainment in Logan
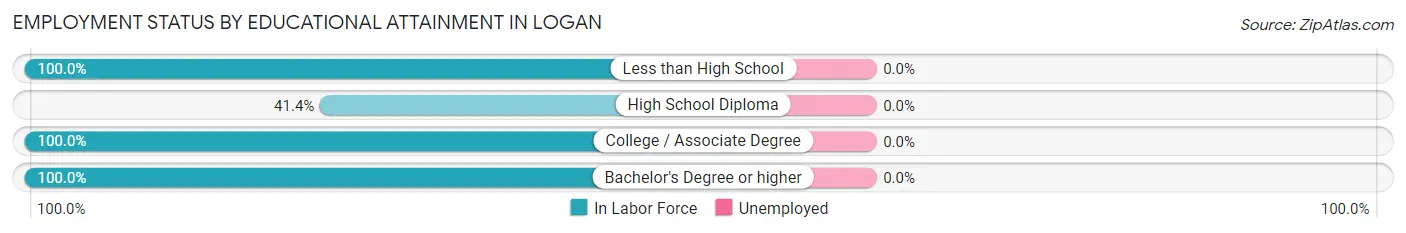
| Educational Attainment | In Labor Force | Unemployed |
| Less than High School | 24 (100.0%) | 0 (0.0%) |
| High School Diploma | 24 (41.4%) | 0 (0.0%) |
| College / Associate Degree | 18 (100.0%) | 0 (0.0%) |
| Bachelor's Degree or higher | 27 (100.0%) | 0 (0.0%) |
| Total | 93 (73.2%) | 0 (0.0%) |
Employment Occupations by Sex in Logan
Management, Business, Science and Arts Occupations
The most common Management, Business, Science and Arts occupations in Logan are Management (45 | 44.1%), Health Diagnosing & Treating (10 | 9.8%), Community & Social Service (8 | 7.8%), and Education Instruction & Library (8 | 7.8%).
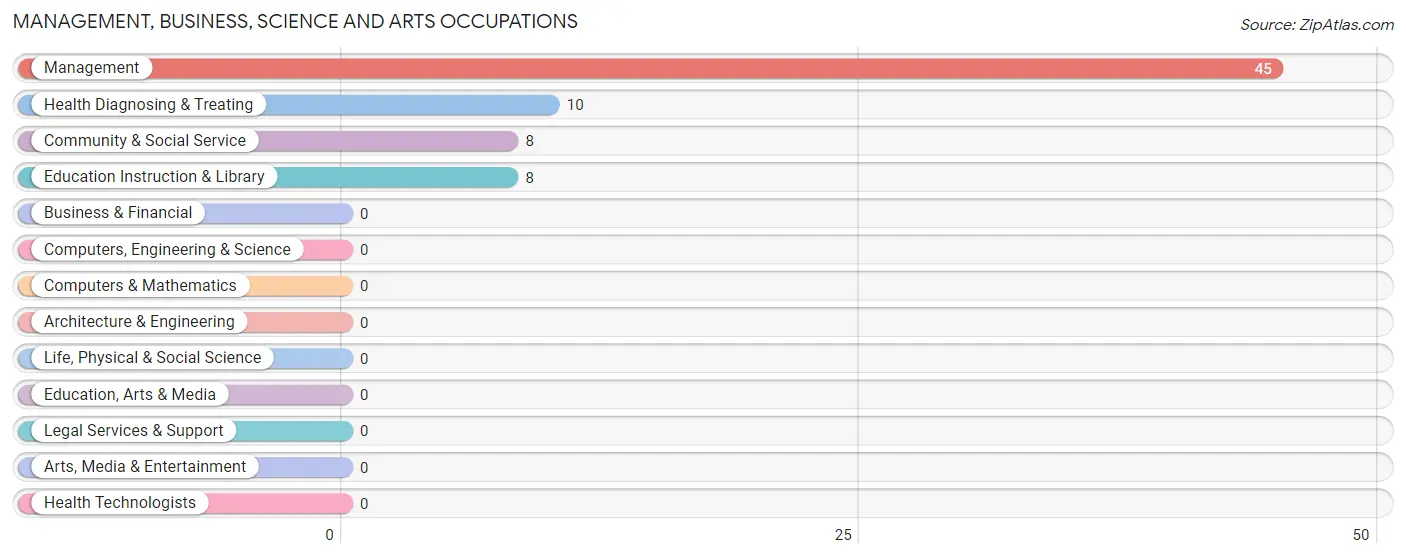
Management, Business, Science and Arts Occupations by Sex
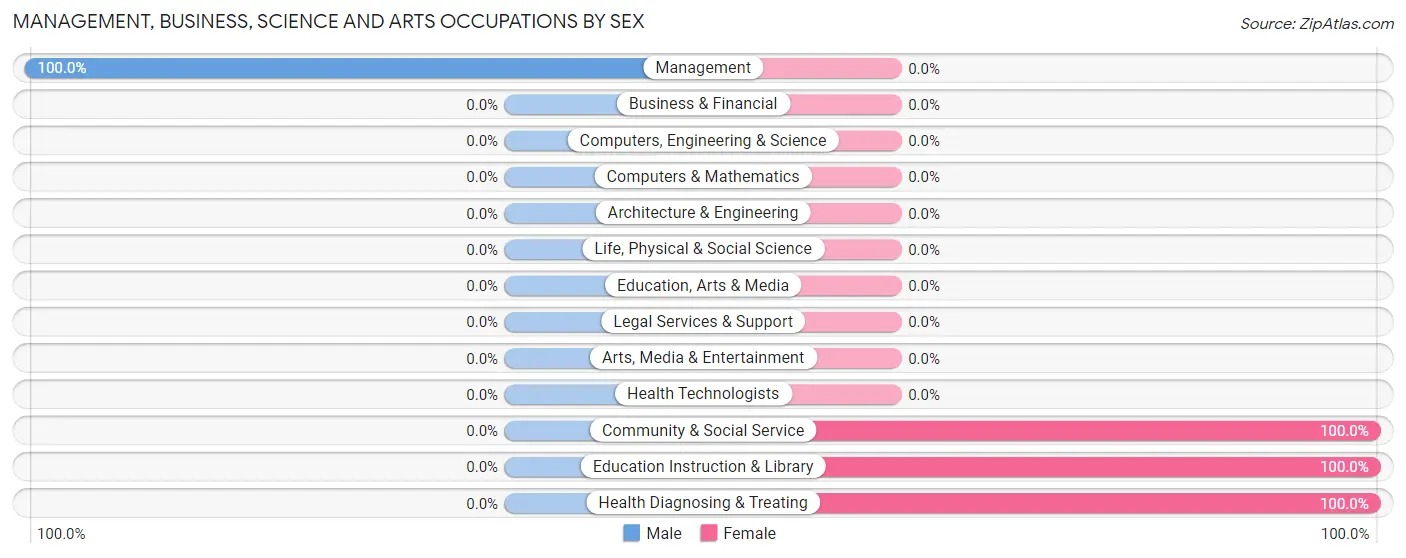
| Occupation | Male | Female |
| Management | 45 (100.0%) | 0 (0.0%) |
| Business & Financial | 0 (0.0%) | 0 (0.0%) |
| Computers, Engineering & Science | 0 (0.0%) | 0 (0.0%) |
| Computers & Mathematics | 0 (0.0%) | 0 (0.0%) |
| Architecture & Engineering | 0 (0.0%) | 0 (0.0%) |
| Life, Physical & Social Science | 0 (0.0%) | 0 (0.0%) |
| Community & Social Service | 0 (0.0%) | 8 (100.0%) |
| Education, Arts & Media | 0 (0.0%) | 0 (0.0%) |
| Legal Services & Support | 0 (0.0%) | 0 (0.0%) |
| Education Instruction & Library | 0 (0.0%) | 8 (100.0%) |
| Arts, Media & Entertainment | 0 (0.0%) | 0 (0.0%) |
| Health Diagnosing & Treating | 0 (0.0%) | 10 (100.0%) |
| Health Technologists | 0 (0.0%) | 0 (0.0%) |
| Total (Category) | 45 (71.4%) | 18 (28.6%) |
| Total (Overall) | 67 (65.7%) | 35 (34.3%) |
Services Occupations
Services Occupations by Sex
| Occupation | Male | Female |
| Healthcare Support | 0 (0.0%) | 0 (0.0%) |
| Security & Protection | 0 (0.0%) | 0 (0.0%) |
| Firefighting & Prevention | 0 (0.0%) | 0 (0.0%) |
| Law Enforcement | 0 (0.0%) | 0 (0.0%) |
| Food Preparation & Serving | 0 (0.0%) | 0 (0.0%) |
| Cleaning & Maintenance | 0 (0.0%) | 0 (0.0%) |
| Personal Care & Service | 0 (0.0%) | 0 (0.0%) |
| Total (Category) | 0 (0.0%) | 0 (0.0%) |
| Total (Overall) | 67 (65.7%) | 35 (34.3%) |
Sales and Office Occupations
The most common Sales and Office occupations in Logan are , and Office & Administration (8 | 7.8%).
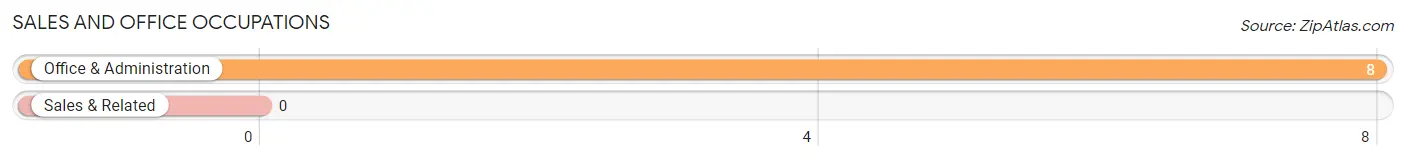
Sales and Office Occupations by Sex
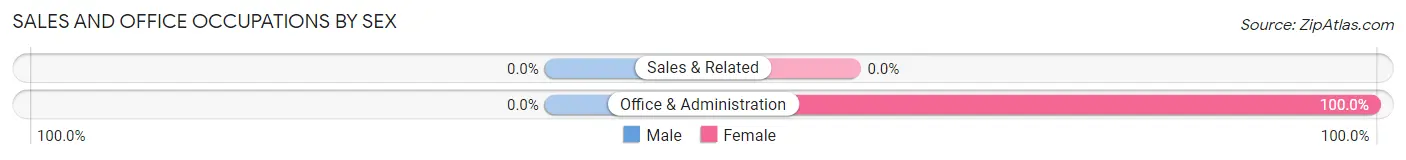
| Occupation | Male | Female |
| Sales & Related | 0 (0.0%) | 0 (0.0%) |
| Office & Administration | 0 (0.0%) | 8 (100.0%) |
| Total (Category) | 0 (0.0%) | 8 (100.0%) |
| Total (Overall) | 67 (65.7%) | 35 (34.3%) |
Natural Resources, Construction and Maintenance Occupations
The most common Natural Resources, Construction and Maintenance occupations in Logan are , and Construction & Extraction (22 | 21.6%).
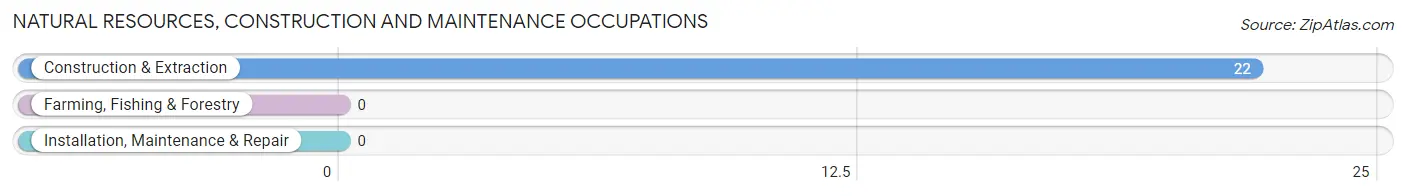
Natural Resources, Construction and Maintenance Occupations by Sex
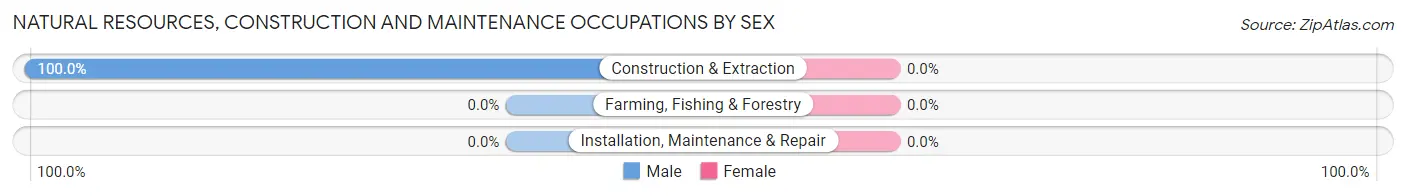
| Occupation | Male | Female |
| Farming, Fishing & Forestry | 0 (0.0%) | 0 (0.0%) |
| Construction & Extraction | 22 (100.0%) | 0 (0.0%) |
| Installation, Maintenance & Repair | 0 (0.0%) | 0 (0.0%) |
| Total (Category) | 22 (100.0%) | 0 (0.0%) |
| Total (Overall) | 67 (65.7%) | 35 (34.3%) |
Production, Transportation and Moving Occupations
The most common Production, Transportation and Moving occupations in Logan are , and Production (9 | 8.8%).
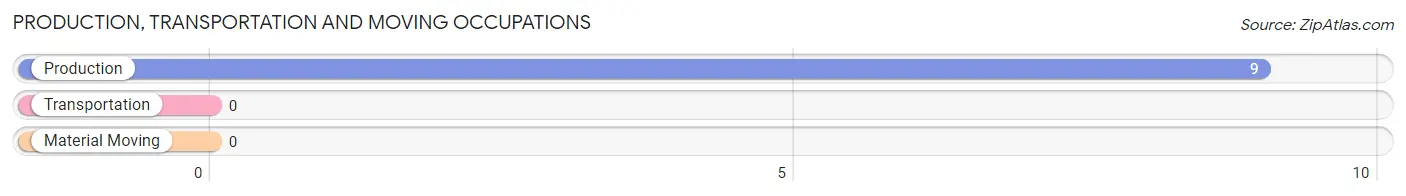
Production, Transportation and Moving Occupations by Sex
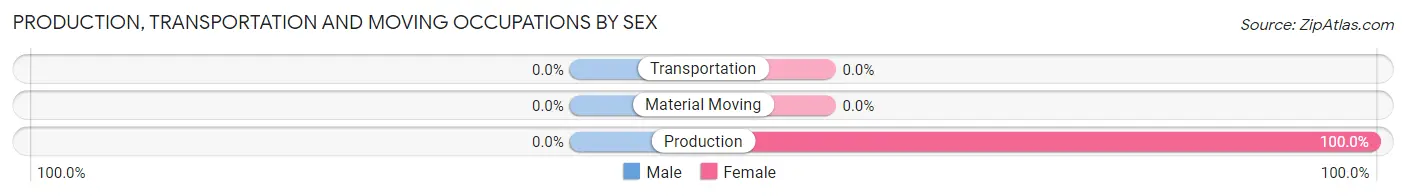
| Occupation | Male | Female |
| Production | 0 (0.0%) | 9 (100.0%) |
| Transportation | 0 (0.0%) | 0 (0.0%) |
| Material Moving | 0 (0.0%) | 0 (0.0%) |
| Total (Category) | 0 (0.0%) | 9 (100.0%) |
| Total (Overall) | 67 (65.7%) | 35 (34.3%) |
Employment Industries by Sex in Logan
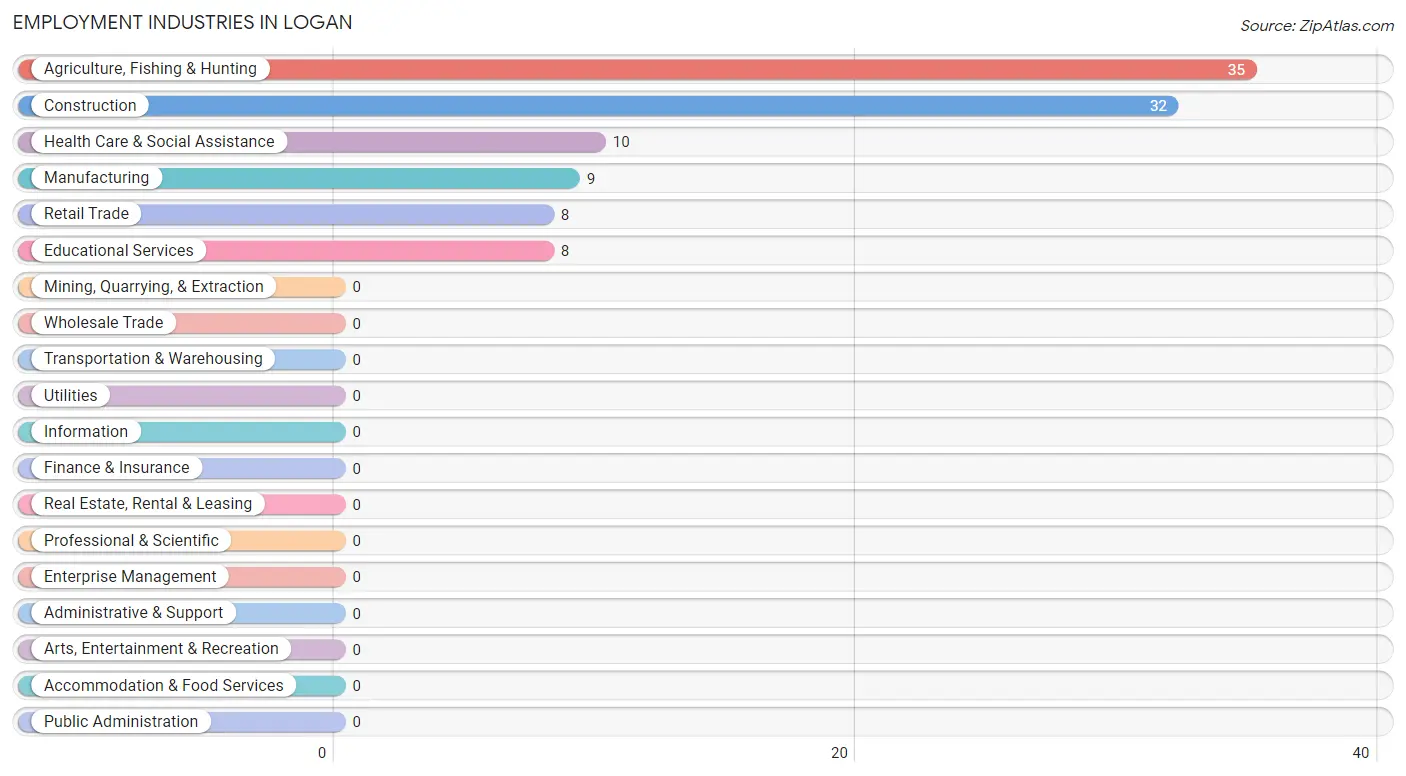
Employment Industries in Logan
The major employment industries in Logan include Agriculture, Fishing & Hunting (35 | 34.3%), Construction (32 | 31.4%), Health Care & Social Assistance (10 | 9.8%), Manufacturing (9 | 8.8%), and Retail Trade (8 | 7.8%).
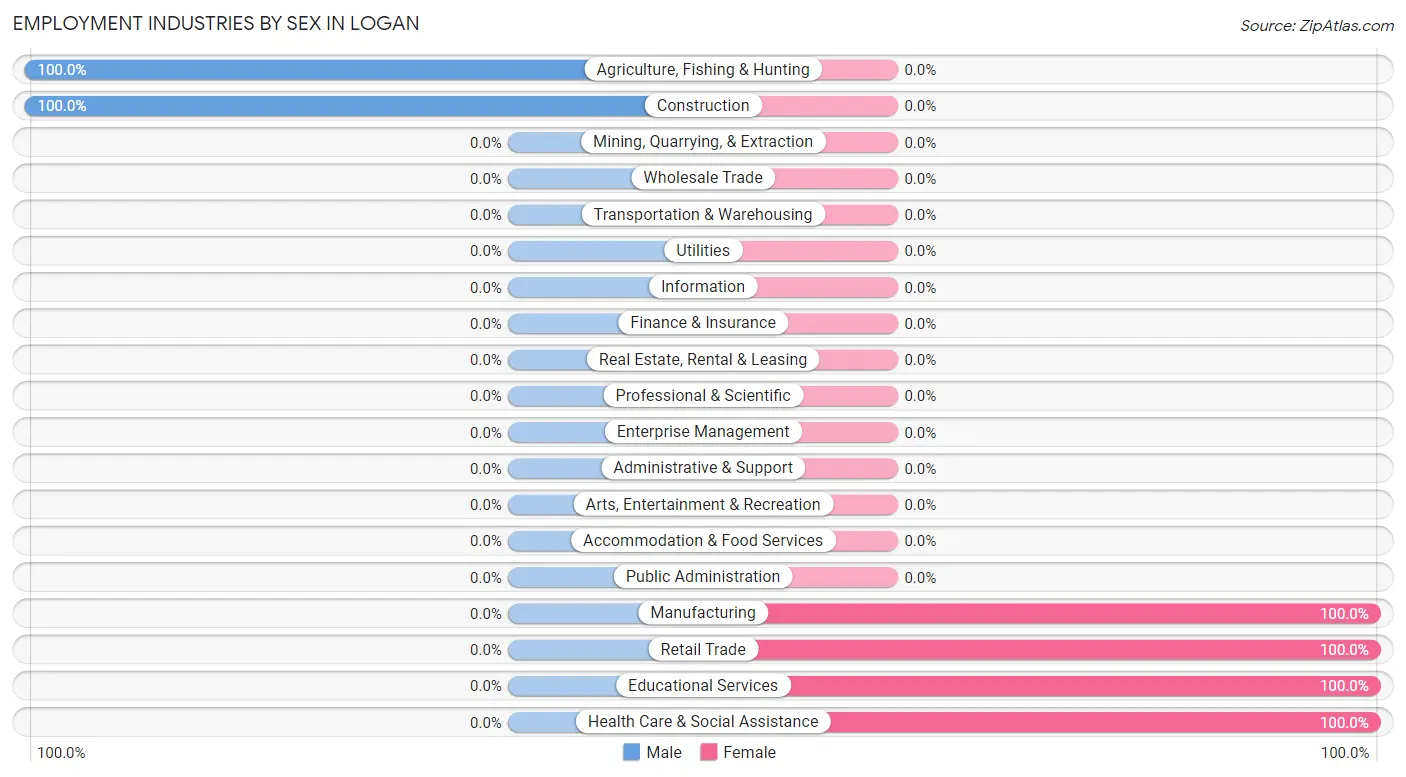
Employment Industries by Sex in Logan
The Logan industries that see more men than women are Agriculture, Fishing & Hunting (100.0%), and Construction (100.0%), whereas the industries that tend to have a higher number of women are Manufacturing (100.0%), Retail Trade (100.0%), and Educational Services (100.0%).
| Industry | Male | Female |
| Agriculture, Fishing & Hunting | 35 (100.0%) | 0 (0.0%) |
| Mining, Quarrying, & Extraction | 0 (0.0%) | 0 (0.0%) |
| Construction | 32 (100.0%) | 0 (0.0%) |
| Manufacturing | 0 (0.0%) | 9 (100.0%) |
| Wholesale Trade | 0 (0.0%) | 0 (0.0%) |
| Retail Trade | 0 (0.0%) | 8 (100.0%) |
| Transportation & Warehousing | 0 (0.0%) | 0 (0.0%) |
| Utilities | 0 (0.0%) | 0 (0.0%) |
| Information | 0 (0.0%) | 0 (0.0%) |
| Finance & Insurance | 0 (0.0%) | 0 (0.0%) |
| Real Estate, Rental & Leasing | 0 (0.0%) | 0 (0.0%) |
| Professional & Scientific | 0 (0.0%) | 0 (0.0%) |
| Enterprise Management | 0 (0.0%) | 0 (0.0%) |
| Administrative & Support | 0 (0.0%) | 0 (0.0%) |
| Educational Services | 0 (0.0%) | 8 (100.0%) |
| Health Care & Social Assistance | 0 (0.0%) | 10 (100.0%) |
| Arts, Entertainment & Recreation | 0 (0.0%) | 0 (0.0%) |
| Accommodation & Food Services | 0 (0.0%) | 0 (0.0%) |
| Public Administration | 0 (0.0%) | 0 (0.0%) |
| Total | 67 (65.7%) | 35 (34.3%) |
Education in Logan
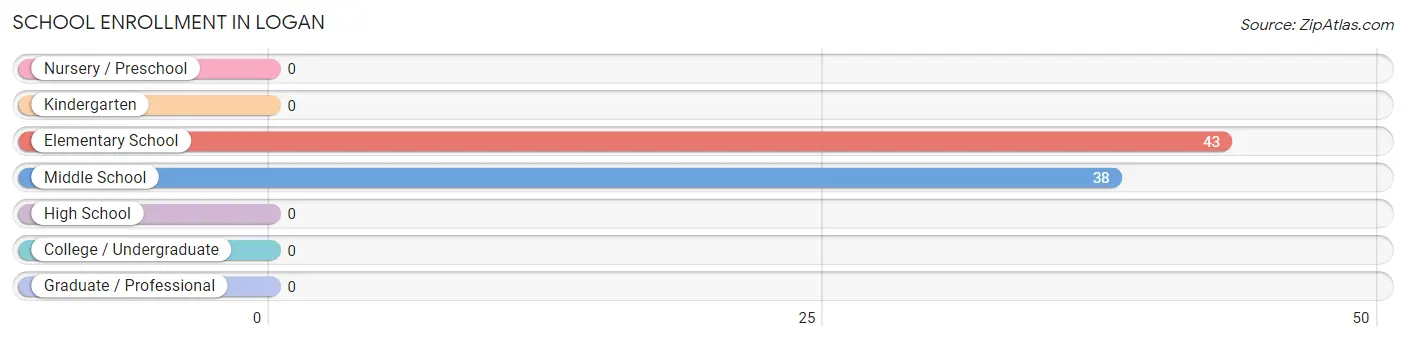
School Enrollment in Logan
The most common levels of schooling among the 81 students in Logan are elementary school (43 | 53.1%), and middle school (38 | 46.9%).
| School Level | # Students | % Students |
| Nursery / Preschool | 0 | 0.0% |
| Kindergarten | 0 | 0.0% |
| Elementary School | 43 | 53.1% |
| Middle School | 38 | 46.9% |
| High School | 0 | 0.0% |
| College / Undergraduate | 0 | 0.0% |
| Graduate / Professional | 0 | 0.0% |
| Total | 81 | 100.0% |
School Enrollment by Age by Funding Source in Logan
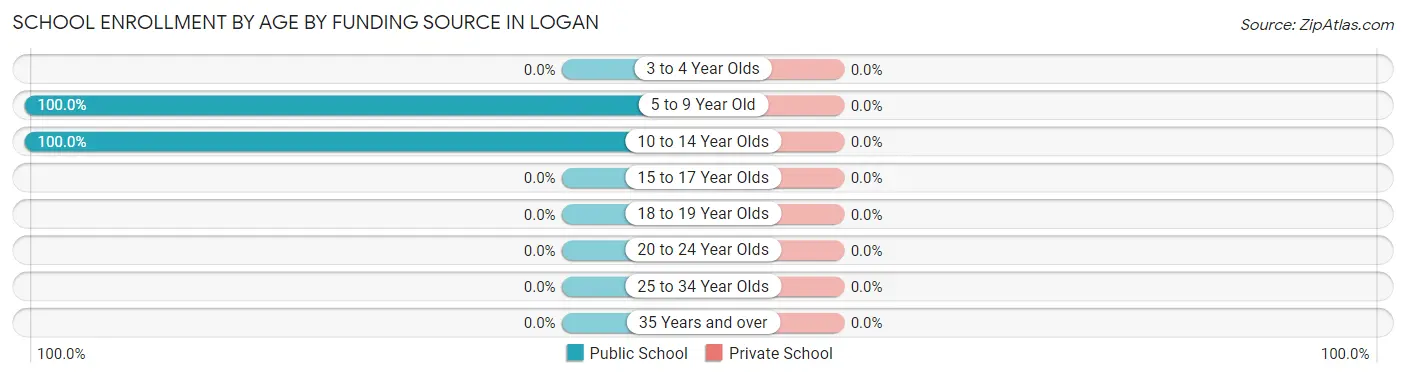
| Age Bracket | Public School | Private School |
| 3 to 4 Year Olds | 0 (0.0%) | 0 (0.0%) |
| 5 to 9 Year Old | 43 (100.0%) | 0 (0.0%) |
| 10 to 14 Year Olds | 38 (100.0%) | 0 (0.0%) |
| 15 to 17 Year Olds | 0 (0.0%) | 0 (0.0%) |
| 18 to 19 Year Olds | 0 (0.0%) | 0 (0.0%) |
| 20 to 24 Year Olds | 0 (0.0%) | 0 (0.0%) |
| 25 to 34 Year Olds | 0 (0.0%) | 0 (0.0%) |
| 35 Years and over | 0 (0.0%) | 0 (0.0%) |
| Total | 81 (100.0%) | 0 (0.0%) |
Educational Attainment by Field of Study in Logan
Business (10 | 37.0%), engineering (9 | 33.3%), and education (8 | 29.6%) are the most common fields of study among 27 individuals in Logan who have obtained a bachelor's degree or higher.
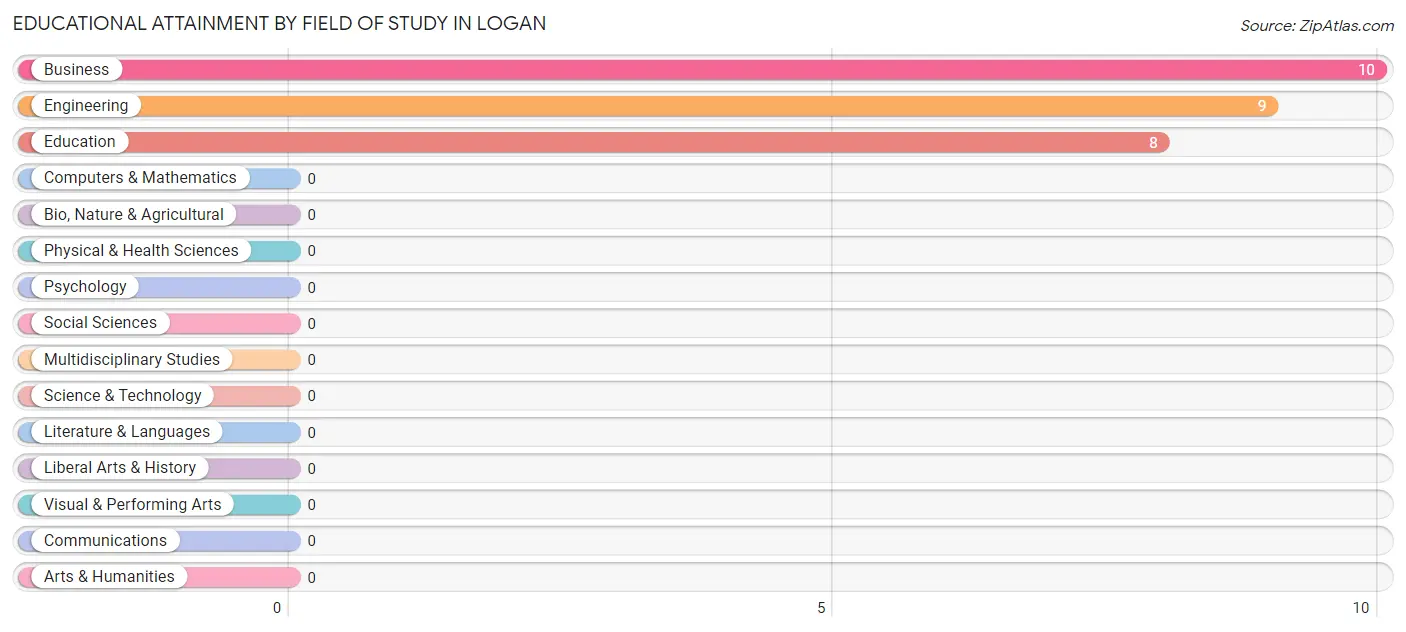
| Field of Study | # Graduates | % Graduates |
| Computers & Mathematics | 0 | 0.0% |
| Bio, Nature & Agricultural | 0 | 0.0% |
| Physical & Health Sciences | 0 | 0.0% |
| Psychology | 0 | 0.0% |
| Social Sciences | 0 | 0.0% |
| Engineering | 9 | 33.3% |
| Multidisciplinary Studies | 0 | 0.0% |
| Science & Technology | 0 | 0.0% |
| Business | 10 | 37.0% |
| Education | 8 | 29.6% |
| Literature & Languages | 0 | 0.0% |
| Liberal Arts & History | 0 | 0.0% |
| Visual & Performing Arts | 0 | 0.0% |
| Communications | 0 | 0.0% |
| Arts & Humanities | 0 | 0.0% |
| Total | 27 | 100.0% |
Transportation & Commute in Logan
Vehicle Availability by Sex in Logan
The most prevalent vehicle ownership categories in Logan are males with 2 vehicles (32, accounting for 47.8%) and females with 2 vehicles (17, making up 118.5%).
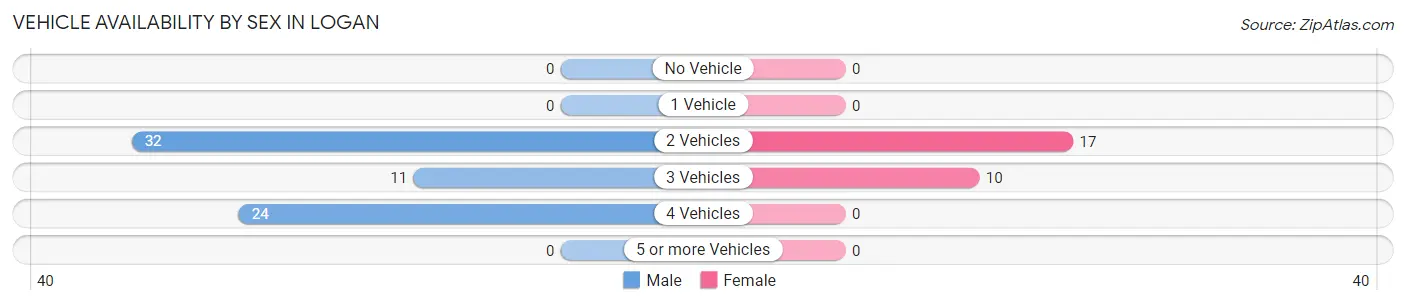
| Vehicles Available | Male | Female |
| No Vehicle | 0 (0.0%) | 0 (0.0%) |
| 1 Vehicle | 0 (0.0%) | 0 (0.0%) |
| 2 Vehicles | 32 (47.8%) | 17 (63.0%) |
| 3 Vehicles | 11 (16.4%) | 10 (37.0%) |
| 4 Vehicles | 24 (35.8%) | 0 (0.0%) |
| 5 or more Vehicles | 0 (0.0%) | 0 (0.0%) |
| Total | 67 (100.0%) | 27 (100.0%) |
Commute Time in Logan
The most frequently occuring commute durations in Logan are 20 to 24 minutes (27 commuters, 28.7%), 90 or more minutes (24 commuters, 25.5%), and 15 to 19 minutes (13 commuters, 13.8%).
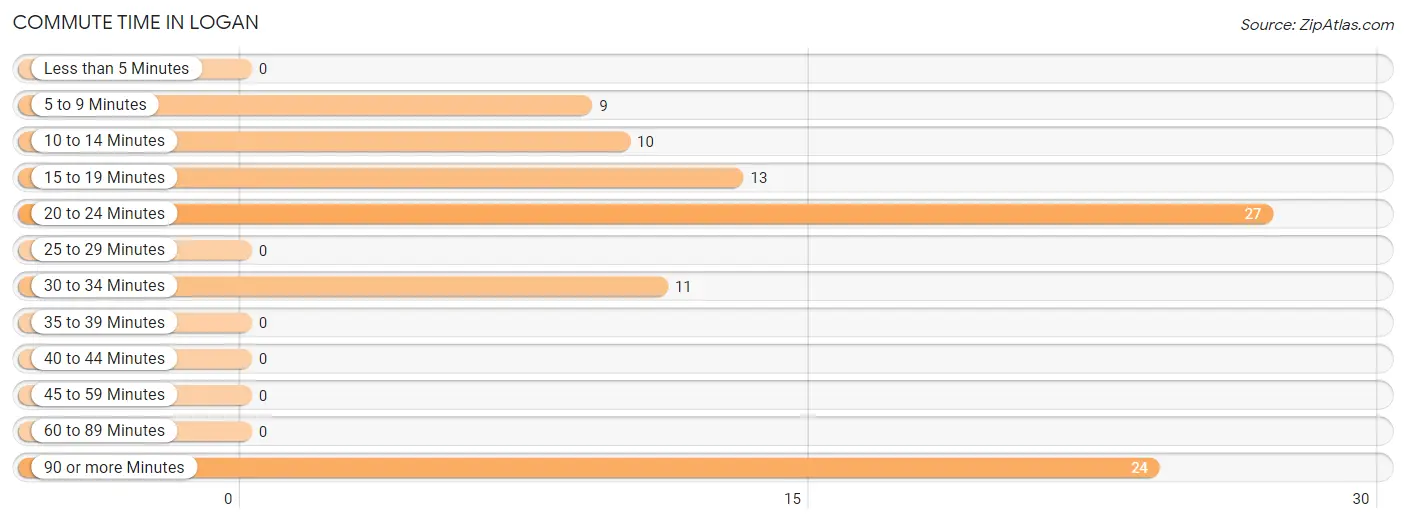
| Commute Time | # Commuters | % Commuters |
| Less than 5 Minutes | 0 | 0.0% |
| 5 to 9 Minutes | 9 | 9.6% |
| 10 to 14 Minutes | 10 | 10.6% |
| 15 to 19 Minutes | 13 | 13.8% |
| 20 to 24 Minutes | 27 | 28.7% |
| 25 to 29 Minutes | 0 | 0.0% |
| 30 to 34 Minutes | 11 | 11.7% |
| 35 to 39 Minutes | 0 | 0.0% |
| 40 to 44 Minutes | 0 | 0.0% |
| 45 to 59 Minutes | 0 | 0.0% |
| 60 to 89 Minutes | 0 | 0.0% |
| 90 or more Minutes | 24 | 25.5% |
Commute Time by Sex in Logan
The most common commute times in Logan are 90 or more minutes (24 commuters, 35.8%) for males and 20 to 24 minutes (17 commuters, 63.0%) for females.
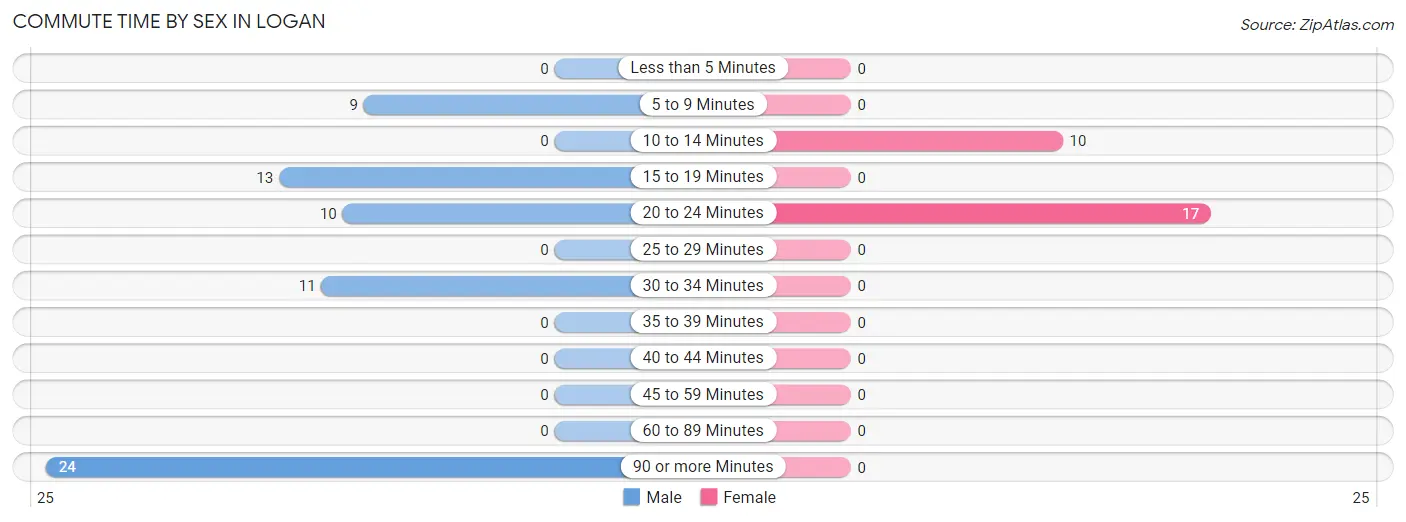
| Commute Time | Male | Female |
| Less than 5 Minutes | 0 (0.0%) | 0 (0.0%) |
| 5 to 9 Minutes | 9 (13.4%) | 0 (0.0%) |
| 10 to 14 Minutes | 0 (0.0%) | 10 (37.0%) |
| 15 to 19 Minutes | 13 (19.4%) | 0 (0.0%) |
| 20 to 24 Minutes | 10 (14.9%) | 17 (63.0%) |
| 25 to 29 Minutes | 0 (0.0%) | 0 (0.0%) |
| 30 to 34 Minutes | 11 (16.4%) | 0 (0.0%) |
| 35 to 39 Minutes | 0 (0.0%) | 0 (0.0%) |
| 40 to 44 Minutes | 0 (0.0%) | 0 (0.0%) |
| 45 to 59 Minutes | 0 (0.0%) | 0 (0.0%) |
| 60 to 89 Minutes | 0 (0.0%) | 0 (0.0%) |
| 90 or more Minutes | 24 (35.8%) | 0 (0.0%) |
Time of Departure to Work by Sex in Logan
The most frequent times of departure to work in Logan are 7:00 AM to 7:29 AM (33, 49.2%) for males and 7:00 AM to 7:29 AM (10, 37.0%) for females.
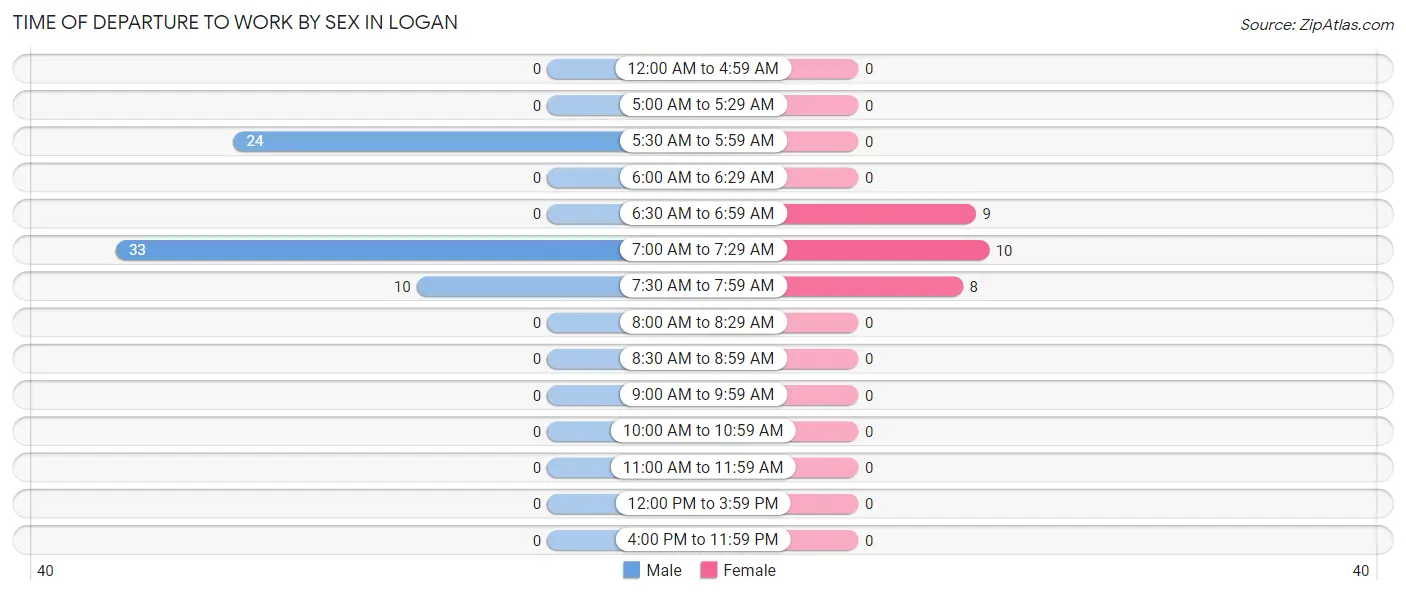
| Time of Departure | Male | Female |
| 12:00 AM to 4:59 AM | 0 (0.0%) | 0 (0.0%) |
| 5:00 AM to 5:29 AM | 0 (0.0%) | 0 (0.0%) |
| 5:30 AM to 5:59 AM | 24 (35.8%) | 0 (0.0%) |
| 6:00 AM to 6:29 AM | 0 (0.0%) | 0 (0.0%) |
| 6:30 AM to 6:59 AM | 0 (0.0%) | 9 (33.3%) |
| 7:00 AM to 7:29 AM | 33 (49.2%) | 10 (37.0%) |
| 7:30 AM to 7:59 AM | 10 (14.9%) | 8 (29.6%) |
| 8:00 AM to 8:29 AM | 0 (0.0%) | 0 (0.0%) |
| 8:30 AM to 8:59 AM | 0 (0.0%) | 0 (0.0%) |
| 9:00 AM to 9:59 AM | 0 (0.0%) | 0 (0.0%) |
| 10:00 AM to 10:59 AM | 0 (0.0%) | 0 (0.0%) |
| 11:00 AM to 11:59 AM | 0 (0.0%) | 0 (0.0%) |
| 12:00 PM to 3:59 PM | 0 (0.0%) | 0 (0.0%) |
| 4:00 PM to 11:59 PM | 0 (0.0%) | 0 (0.0%) |
| Total | 67 (100.0%) | 27 (100.0%) |
Housing Occupancy in Logan
Occupancy by Ownership in Logan
Of the total 78 dwellings in Logan, owner-occupied units account for 78 (100.0%), while renter-occupied units make up 0 (0.0%).
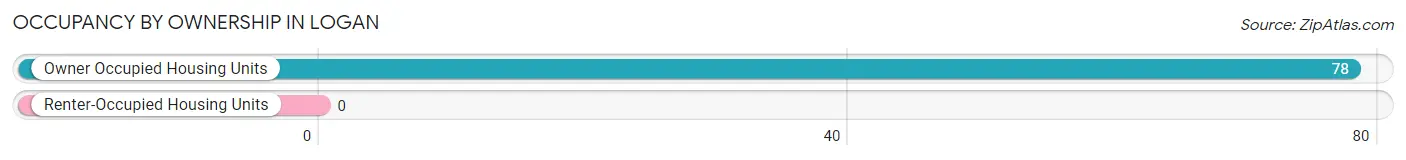
| Occupancy | # Housing Units | % Housing Units |
| Owner Occupied Housing Units | 78 | 100.0% |
| Renter-Occupied Housing Units | 0 | 0.0% |
| Total Occupied Housing Units | 78 | 100.0% |
Occupancy by Household Size in Logan
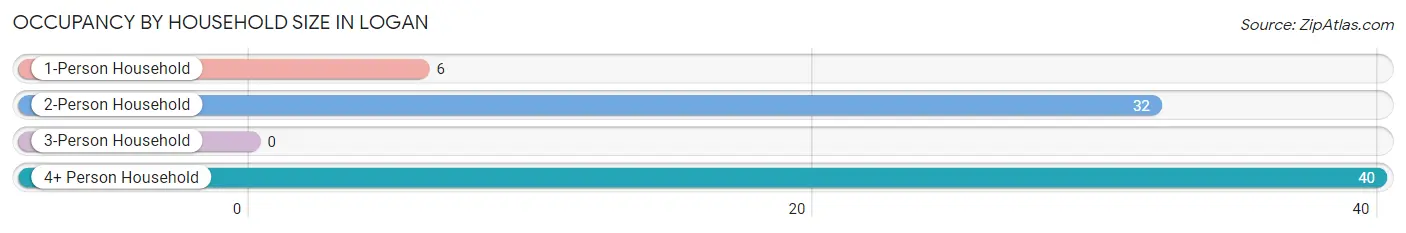
| Household Size | # Housing Units | % Housing Units |
| 1-Person Household | 6 | 7.7% |
| 2-Person Household | 32 | 41.0% |
| 3-Person Household | 0 | 0.0% |
| 4+ Person Household | 40 | 51.3% |
| Total Housing Units | 78 | 100.0% |
Occupancy by Ownership by Household Size in Logan
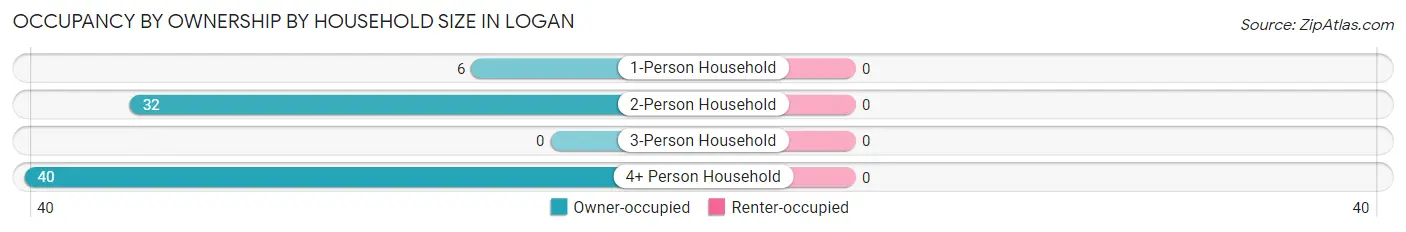
| Household Size | Owner-occupied | Renter-occupied |
| 1-Person Household | 6 (100.0%) | 0 (0.0%) |
| 2-Person Household | 32 (100.0%) | 0 (0.0%) |
| 3-Person Household | 0 (0.0%) | 0 (0.0%) |
| 4+ Person Household | 40 (100.0%) | 0 (0.0%) |
| Total Housing Units | 78 (100.0%) | 0 (0.0%) |
Occupancy by Educational Attainment in Logan
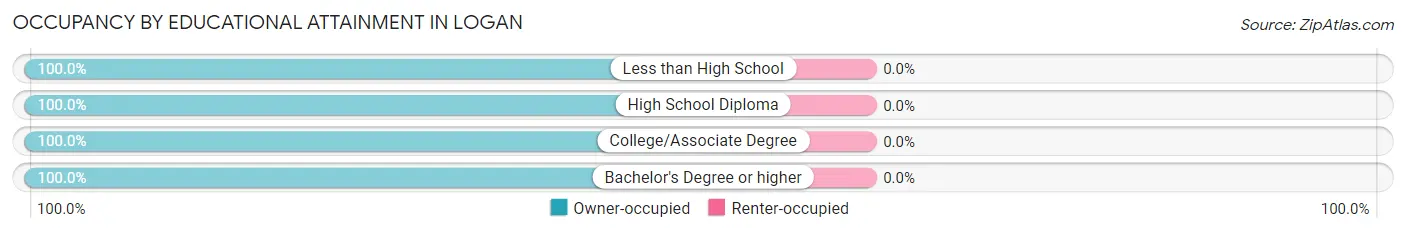
| Household Size | Owner-occupied | Renter-occupied |
| Less than High School | 13 (100.0%) | 0 (0.0%) |
| High School Diploma | 28 (100.0%) | 0 (0.0%) |
| College/Associate Degree | 19 (100.0%) | 0 (0.0%) |
| Bachelor's Degree or higher | 18 (100.0%) | 0 (0.0%) |
Occupancy by Age of Householder in Logan
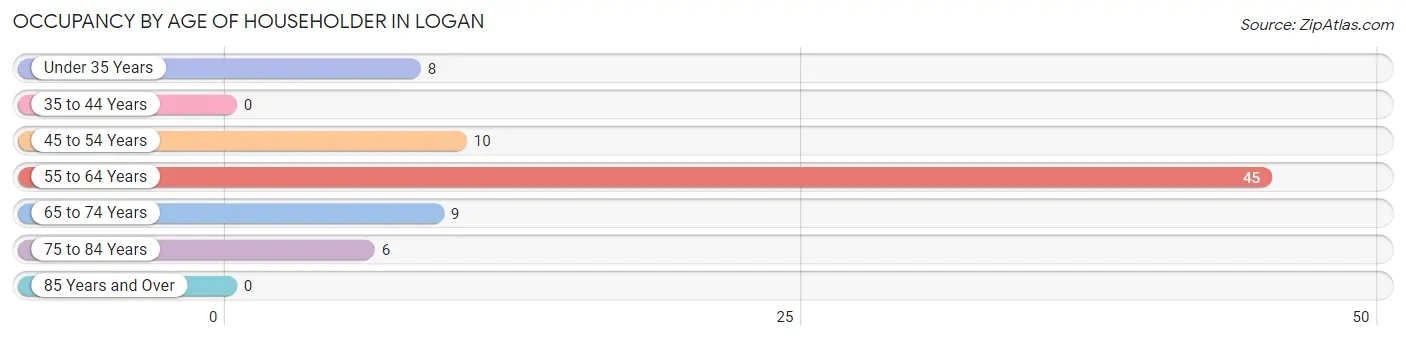
| Age Bracket | # Households | % Households |
| Under 35 Years | 8 | 10.3% |
| 35 to 44 Years | 0 | 0.0% |
| 45 to 54 Years | 10 | 12.8% |
| 55 to 64 Years | 45 | 57.7% |
| 65 to 74 Years | 9 | 11.5% |
| 75 to 84 Years | 6 | 7.7% |
| 85 Years and Over | 0 | 0.0% |
| Total | 78 | 100.0% |
Housing Finances in Logan
Median Income by Occupancy in Logan
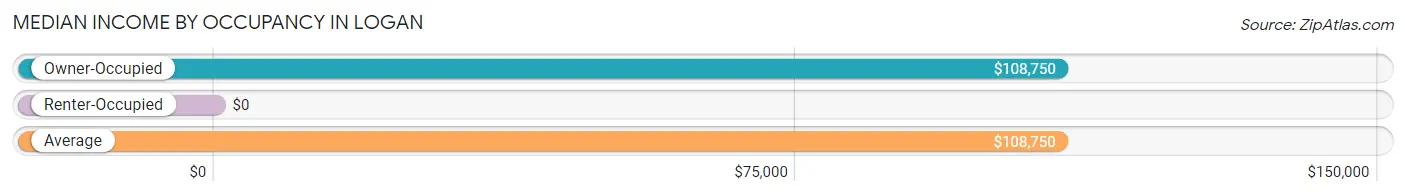
| Occupancy Type | # Households | Median Income |
| Owner-Occupied | 78 (100.0%) | $108,750 |
| Renter-Occupied | 0 (0.0%) | $0 |
| Average | 78 (100.0%) | $108,750 |
Occupancy by Householder Income Bracket in Logan
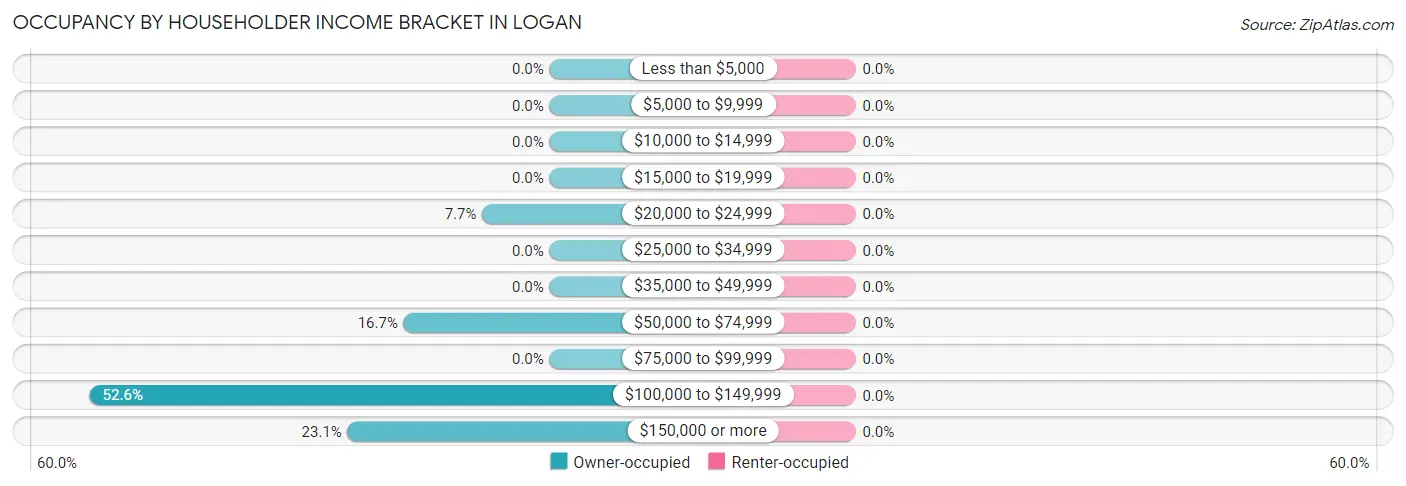
| Income Bracket | Owner-occupied | Renter-occupied |
| Less than $5,000 | 0 (0.0%) | 0 (0.0%) |
| $5,000 to $9,999 | 0 (0.0%) | 0 (0.0%) |
| $10,000 to $14,999 | 0 (0.0%) | 0 (0.0%) |
| $15,000 to $19,999 | 0 (0.0%) | 0 (0.0%) |
| $20,000 to $24,999 | 6 (7.7%) | 0 (0.0%) |
| $25,000 to $34,999 | 0 (0.0%) | 0 (0.0%) |
| $35,000 to $49,999 | 0 (0.0%) | 0 (0.0%) |
| $50,000 to $74,999 | 13 (16.7%) | 0 (0.0%) |
| $75,000 to $99,999 | 0 (0.0%) | 0 (0.0%) |
| $100,000 to $149,999 | 41 (52.6%) | 0 (0.0%) |
| $150,000 or more | 18 (23.1%) | 0 (0.0%) |
| Total | 78 (100.0%) | 0 (0.0%) |
Monthly Housing Cost Tiers in Logan
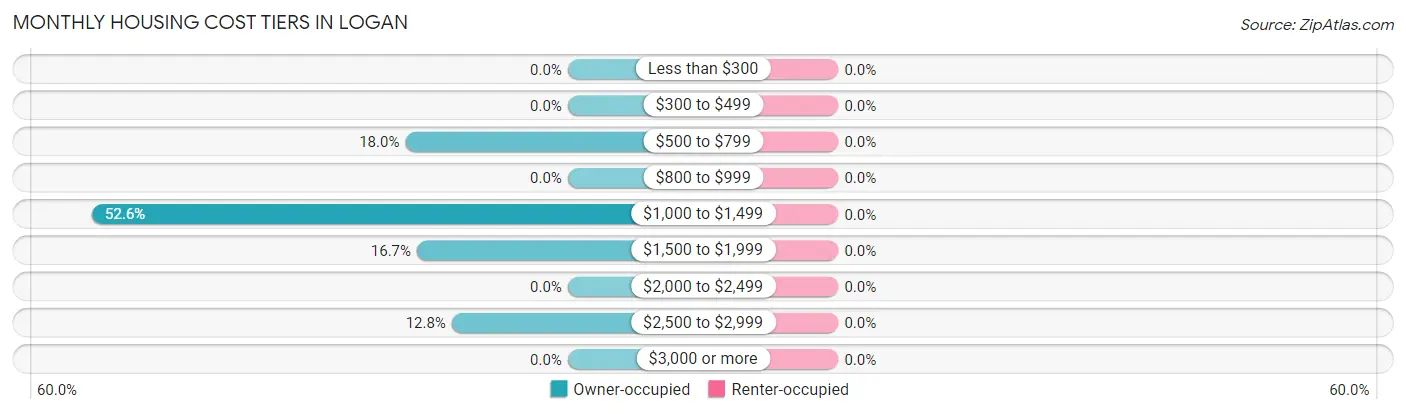
| Monthly Cost | Owner-occupied | Renter-occupied |
| Less than $300 | 0 (0.0%) | 0 (0.0%) |
| $300 to $499 | 0 (0.0%) | 0 (0.0%) |
| $500 to $799 | 14 (17.9%) | 0 (0.0%) |
| $800 to $999 | 0 (0.0%) | 0 (0.0%) |
| $1,000 to $1,499 | 41 (52.6%) | 0 (0.0%) |
| $1,500 to $1,999 | 13 (16.7%) | 0 (0.0%) |
| $2,000 to $2,499 | 0 (0.0%) | 0 (0.0%) |
| $2,500 to $2,999 | 10 (12.8%) | 0 (0.0%) |
| $3,000 or more | 0 (0.0%) | 0 (0.0%) |
| Total | 78 (100.0%) | 0 (0.0%) |
Physical Housing Characteristics in Logan
Housing Structures in Logan
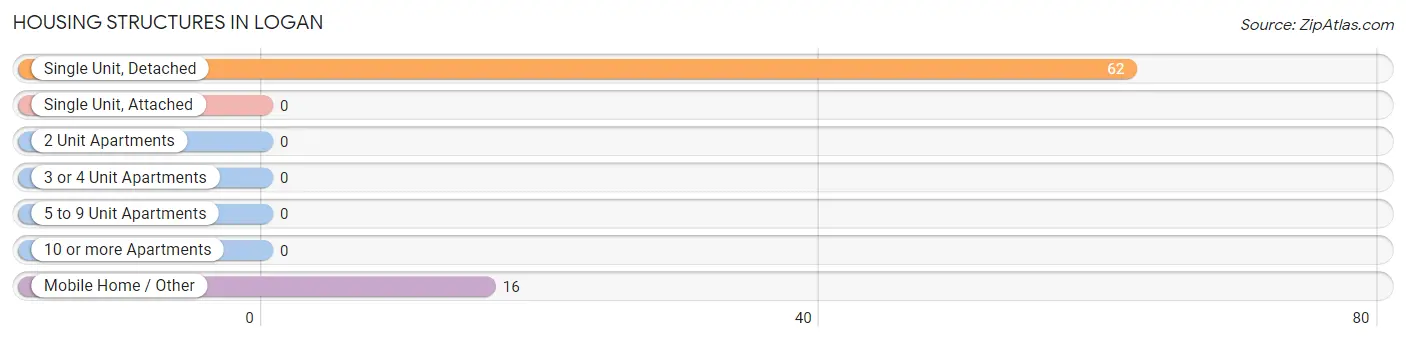
| Structure Type | # Housing Units | % Housing Units |
| Single Unit, Detached | 62 | 79.5% |
| Single Unit, Attached | 0 | 0.0% |
| 2 Unit Apartments | 0 | 0.0% |
| 3 or 4 Unit Apartments | 0 | 0.0% |
| 5 to 9 Unit Apartments | 0 | 0.0% |
| 10 or more Apartments | 0 | 0.0% |
| Mobile Home / Other | 16 | 20.5% |
| Total | 78 | 100.0% |
Housing Structures by Occupancy in Logan
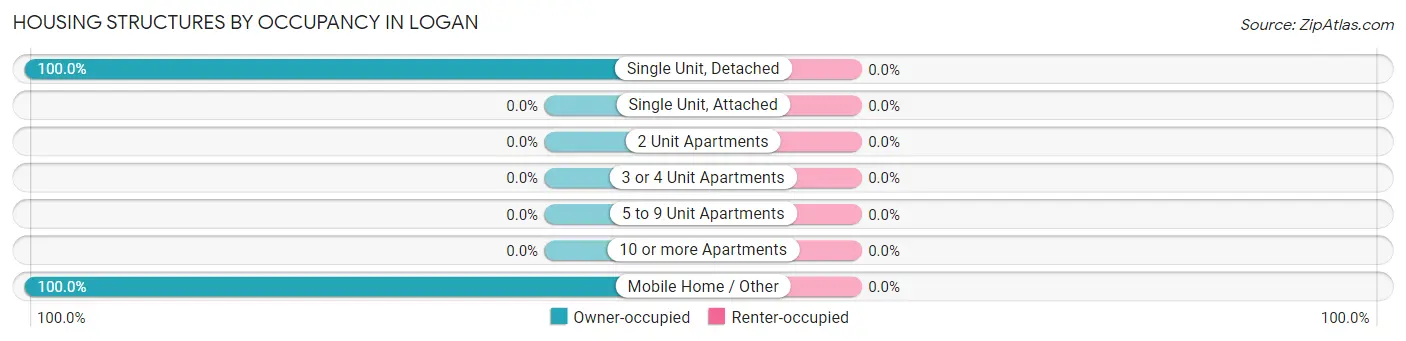
| Structure Type | Owner-occupied | Renter-occupied |
| Single Unit, Detached | 62 (100.0%) | 0 (0.0%) |
| Single Unit, Attached | 0 (0.0%) | 0 (0.0%) |
| 2 Unit Apartments | 0 (0.0%) | 0 (0.0%) |
| 3 or 4 Unit Apartments | 0 (0.0%) | 0 (0.0%) |
| 5 to 9 Unit Apartments | 0 (0.0%) | 0 (0.0%) |
| 10 or more Apartments | 0 (0.0%) | 0 (0.0%) |
| Mobile Home / Other | 16 (100.0%) | 0 (0.0%) |
| Total | 78 (100.0%) | 0 (0.0%) |
Housing Structures by Number of Rooms in Logan
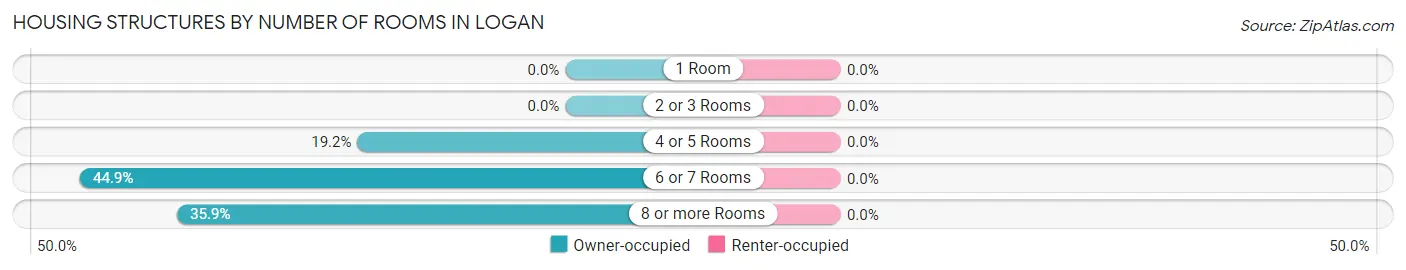
| Number of Rooms | Owner-occupied | Renter-occupied |
| 1 Room | 0 (0.0%) | 0 (0.0%) |
| 2 or 3 Rooms | 0 (0.0%) | 0 (0.0%) |
| 4 or 5 Rooms | 15 (19.2%) | 0 (0.0%) |
| 6 or 7 Rooms | 35 (44.9%) | 0 (0.0%) |
| 8 or more Rooms | 28 (35.9%) | 0 (0.0%) |
| Total | 78 (100.0%) | 0 (0.0%) |
Housing Structure by Heating Type in Logan
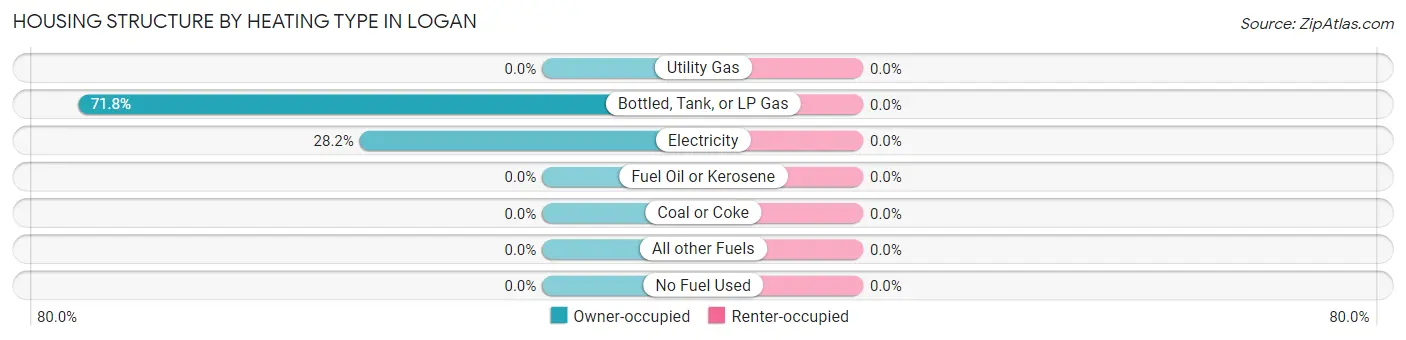
| Heating Type | Owner-occupied | Renter-occupied |
| Utility Gas | 0 (0.0%) | 0 (0.0%) |
| Bottled, Tank, or LP Gas | 56 (71.8%) | 0 (0.0%) |
| Electricity | 22 (28.2%) | 0 (0.0%) |
| Fuel Oil or Kerosene | 0 (0.0%) | 0 (0.0%) |
| Coal or Coke | 0 (0.0%) | 0 (0.0%) |
| All other Fuels | 0 (0.0%) | 0 (0.0%) |
| No Fuel Used | 0 (0.0%) | 0 (0.0%) |
| Total | 78 (100.0%) | 0 (0.0%) |
Household Vehicle Usage in Logan
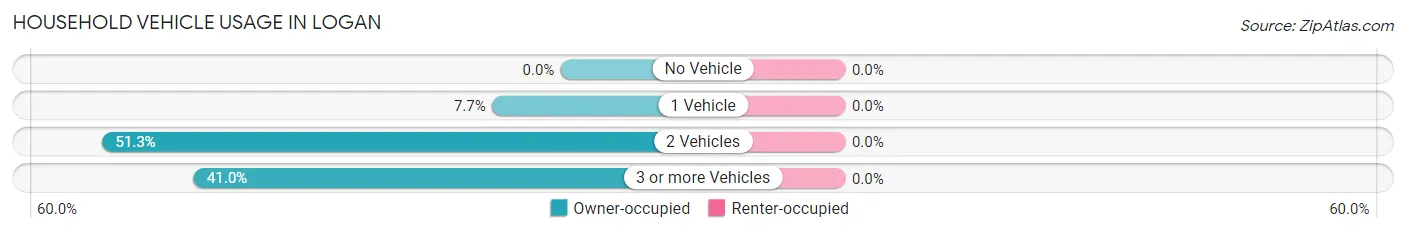
| Vehicles per Household | Owner-occupied | Renter-occupied |
| No Vehicle | 0 (0.0%) | 0 (0.0%) |
| 1 Vehicle | 6 (7.7%) | 0 (0.0%) |
| 2 Vehicles | 40 (51.3%) | 0 (0.0%) |
| 3 or more Vehicles | 32 (41.0%) | 0 (0.0%) |
| Total | 78 (100.0%) | 0 (0.0%) |
Real Estate & Mortgages in Logan
Real Estate and Mortgage Overview in Logan
| Characteristic | Without Mortgage | With Mortgage |
| Housing Units | 36 | 42 |
| Median Property Value | $1,045,500 | $315,400 |
| Median Household Income | $108,864 | $10 |
| Monthly Housing Costs | $1,018 | $0 |
| Real Estate Taxes | $1,773 | $0 |
Property Value by Mortgage Status in Logan
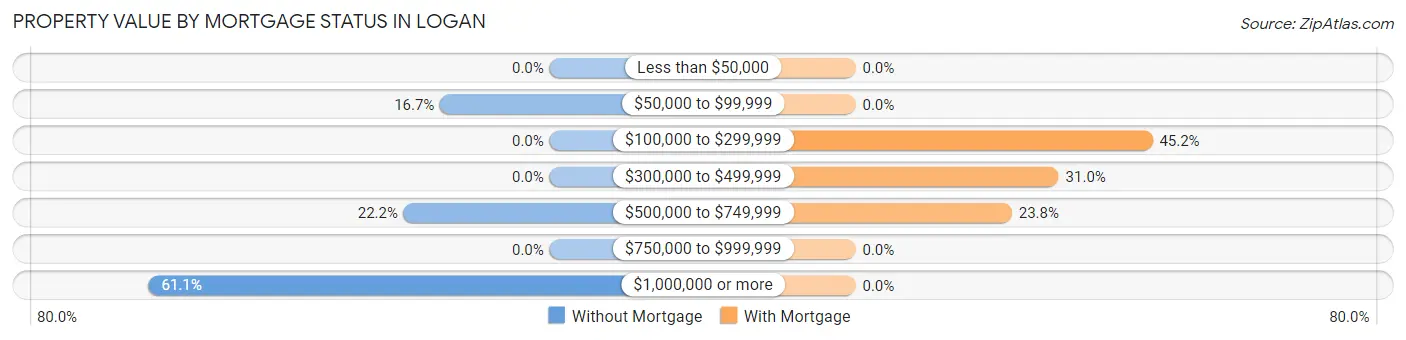
| Property Value | Without Mortgage | With Mortgage |
| Less than $50,000 | 0 (0.0%) | 0 (0.0%) |
| $50,000 to $99,999 | 6 (16.7%) | 0 (0.0%) |
| $100,000 to $299,999 | 0 (0.0%) | 19 (45.2%) |
| $300,000 to $499,999 | 0 (0.0%) | 13 (30.9%) |
| $500,000 to $749,999 | 8 (22.2%) | 10 (23.8%) |
| $750,000 to $999,999 | 0 (0.0%) | 0 (0.0%) |
| $1,000,000 or more | 22 (61.1%) | 0 (0.0%) |
| Total | 36 (100.0%) | 42 (100.0%) |
Household Income by Mortgage Status in Logan
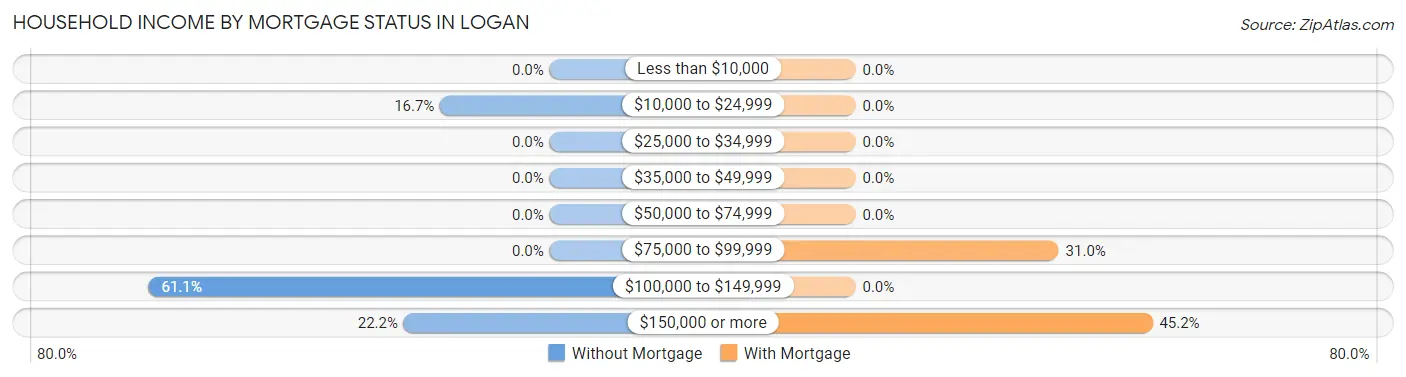
| Household Income | Without Mortgage | With Mortgage |
| Less than $10,000 | 0 (0.0%) | 0 (0.0%) |
| $10,000 to $24,999 | 6 (16.7%) | 0 (0.0%) |
| $25,000 to $34,999 | 0 (0.0%) | 0 (0.0%) |
| $35,000 to $49,999 | 0 (0.0%) | 0 (0.0%) |
| $50,000 to $74,999 | 0 (0.0%) | 0 (0.0%) |
| $75,000 to $99,999 | 0 (0.0%) | 13 (30.9%) |
| $100,000 to $149,999 | 22 (61.1%) | 0 (0.0%) |
| $150,000 or more | 8 (22.2%) | 19 (45.2%) |
| Total | 36 (100.0%) | 42 (100.0%) |
Property Value to Household Income Ratio in Logan
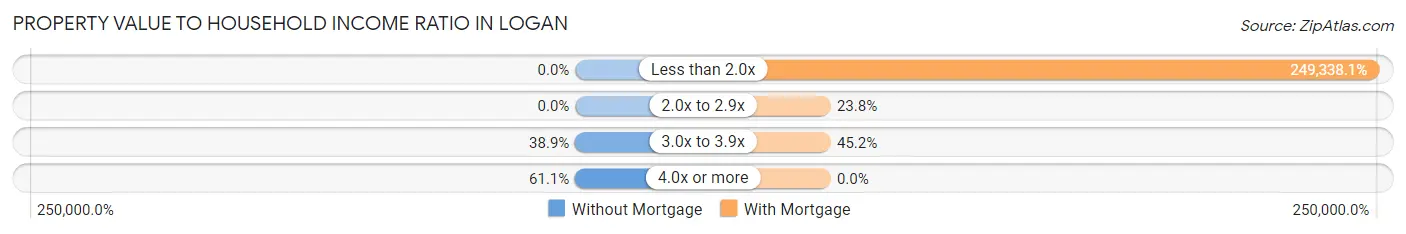
| Value-to-Income Ratio | Without Mortgage | With Mortgage |
| Less than 2.0x | 0 (0.0%) | 104,722 (249,338.1%) |
| 2.0x to 2.9x | 0 (0.0%) | 10 (23.8%) |
| 3.0x to 3.9x | 14 (38.9%) | 19 (45.2%) |
| 4.0x or more | 22 (61.1%) | 0 (0.0%) |
| Total | 36 (100.0%) | 42 (100.0%) |
Real Estate Taxes by Mortgage Status in Logan
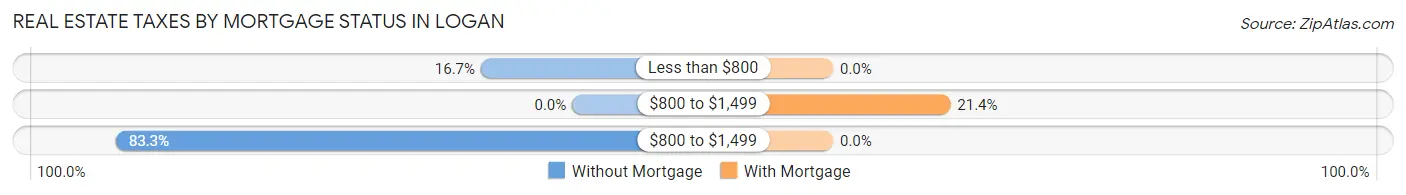
| Property Taxes | Without Mortgage | With Mortgage |
| Less than $800 | 6 (16.7%) | 0 (0.0%) |
| $800 to $1,499 | 0 (0.0%) | 9 (21.4%) |
| $800 to $1,499 | 30 (83.3%) | 0 (0.0%) |
| Total | 36 (100.0%) | 42 (100.0%) |
Health & Disability in Logan
Health Insurance Coverage by Age in Logan
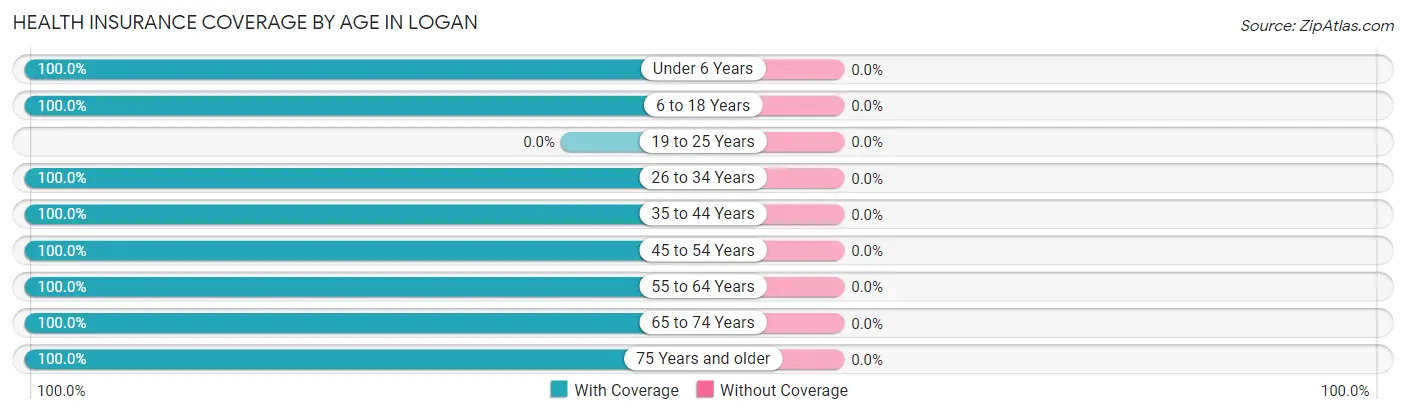
| Age Bracket | With Coverage | Without Coverage |
| Under 6 Years | 26 (100.0%) | 0 (0.0%) |
| 6 to 18 Years | 81 (100.0%) | 0 (0.0%) |
| 19 to 25 Years | 0 (0.0%) | 0 (0.0%) |
| 26 to 34 Years | 17 (100.0%) | 0 (0.0%) |
| 35 to 44 Years | 8 (100.0%) | 0 (0.0%) |
| 45 to 54 Years | 10 (100.0%) | 0 (0.0%) |
| 55 to 64 Years | 92 (100.0%) | 0 (0.0%) |
| 65 to 74 Years | 18 (100.0%) | 0 (0.0%) |
| 75 Years and older | 6 (100.0%) | 0 (0.0%) |
| Total | 258 (100.0%) | 0 (0.0%) |
Health Insurance Coverage by Citizenship Status in Logan
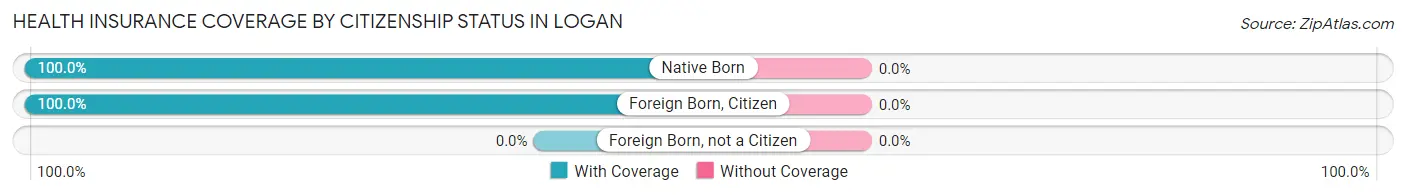
| Citizenship Status | With Coverage | Without Coverage |
| Native Born | 26 (100.0%) | 0 (0.0%) |
| Foreign Born, Citizen | 81 (100.0%) | 0 (0.0%) |
| Foreign Born, not a Citizen | 0 (0.0%) | 0 (0.0%) |
Health Insurance Coverage by Household Income in Logan
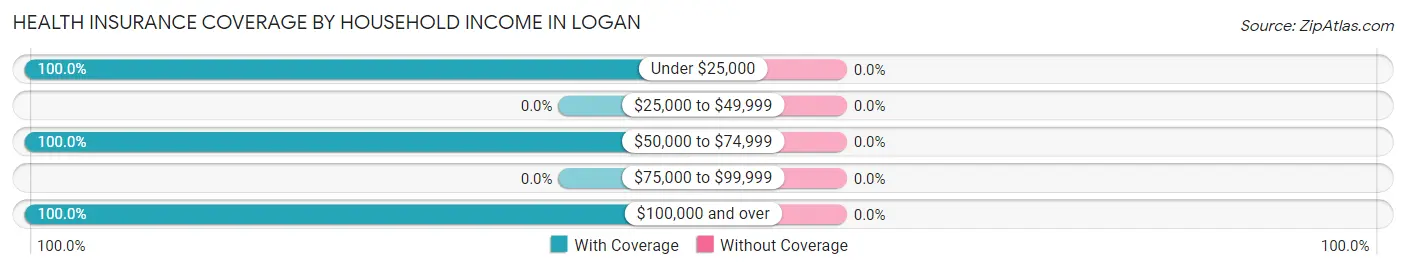
| Household Income | With Coverage | Without Coverage |
| Under $25,000 | 6 (100.0%) | 0 (0.0%) |
| $25,000 to $49,999 | 0 (0.0%) | 0 (0.0%) |
| $50,000 to $74,999 | 25 (100.0%) | 0 (0.0%) |
| $75,000 to $99,999 | 0 (0.0%) | 0 (0.0%) |
| $100,000 and over | 227 (100.0%) | 0 (0.0%) |
Public vs Private Health Insurance Coverage by Age in Logan
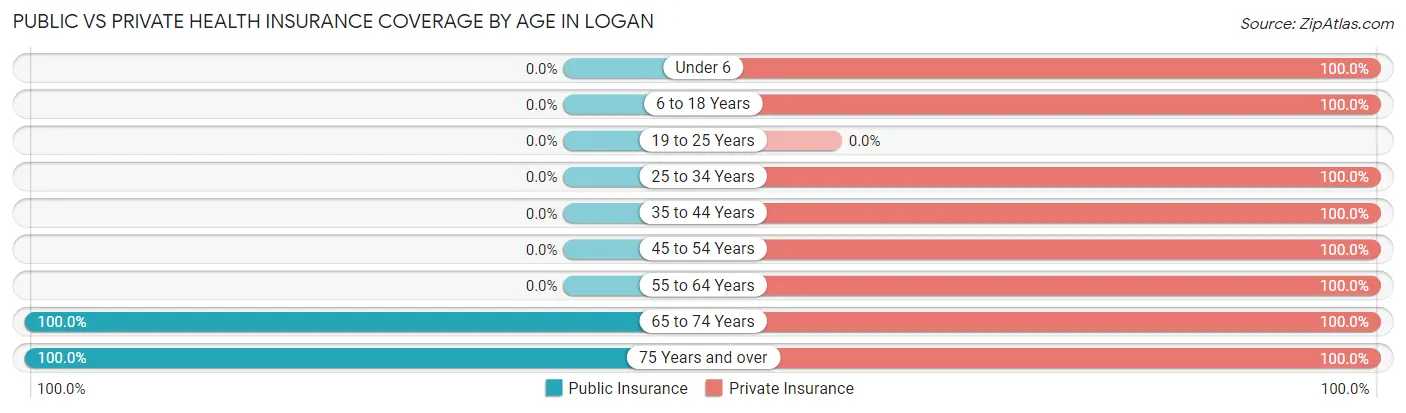
| Age Bracket | Public Insurance | Private Insurance |
| Under 6 | 0 (0.0%) | 26 (100.0%) |
| 6 to 18 Years | 0 (0.0%) | 81 (100.0%) |
| 19 to 25 Years | 0 (0.0%) | 0 (0.0%) |
| 25 to 34 Years | 0 (0.0%) | 17 (100.0%) |
| 35 to 44 Years | 0 (0.0%) | 8 (100.0%) |
| 45 to 54 Years | 0 (0.0%) | 10 (100.0%) |
| 55 to 64 Years | 0 (0.0%) | 92 (100.0%) |
| 65 to 74 Years | 18 (100.0%) | 18 (100.0%) |
| 75 Years and over | 6 (100.0%) | 6 (100.0%) |
| Total | 24 (9.3%) | 258 (100.0%) |
Disability Status by Sex by Age in Logan
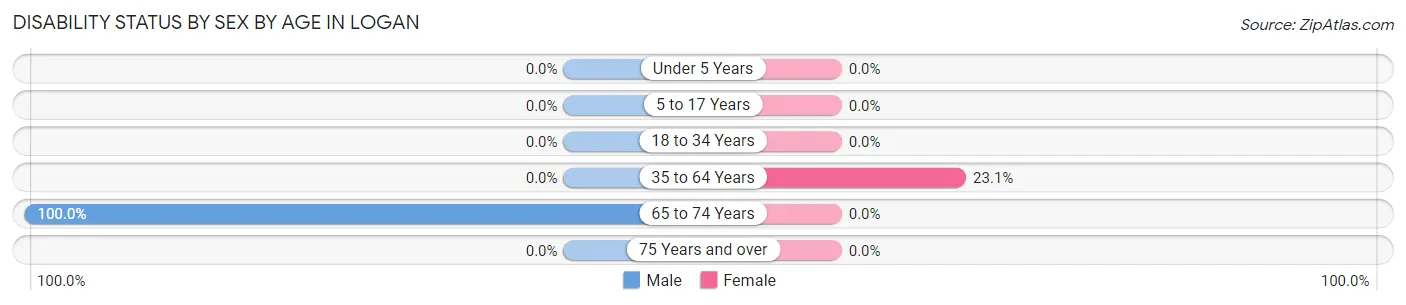
| Age Bracket | Male | Female |
| Under 5 Years | 0 (0.0%) | 0 (0.0%) |
| 5 to 17 Years | 0 (0.0%) | 0 (0.0%) |
| 18 to 34 Years | 0 (0.0%) | 0 (0.0%) |
| 35 to 64 Years | 0 (0.0%) | 12 (23.1%) |
| 65 to 74 Years | 9 (100.0%) | 0 (0.0%) |
| 75 Years and over | 0 (0.0%) | 0 (0.0%) |
Disability Class by Sex by Age in Logan
Disability Class: Hearing Difficulty
| Age Bracket | Male | Female |
| Under 5 Years | 0 (0.0%) | 0 (0.0%) |
| 5 to 17 Years | 0 (0.0%) | 0 (0.0%) |
| 18 to 34 Years | 0 (0.0%) | 0 (0.0%) |
| 35 to 64 Years | 0 (0.0%) | 0 (0.0%) |
| 65 to 74 Years | 0 (0.0%) | 0 (0.0%) |
| 75 Years and over | 0 (0.0%) | 0 (0.0%) |
Disability Class: Vision Difficulty
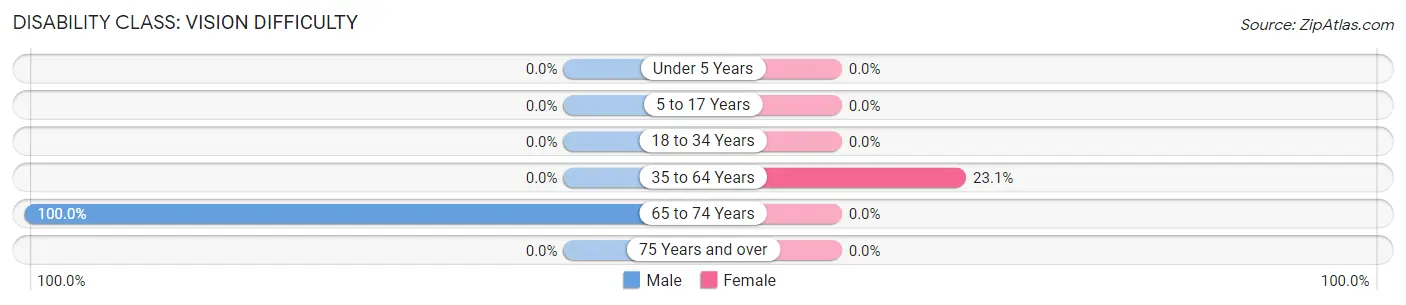
| Age Bracket | Male | Female |
| Under 5 Years | 0 (0.0%) | 0 (0.0%) |
| 5 to 17 Years | 0 (0.0%) | 0 (0.0%) |
| 18 to 34 Years | 0 (0.0%) | 0 (0.0%) |
| 35 to 64 Years | 0 (0.0%) | 12 (23.1%) |
| 65 to 74 Years | 9 (100.0%) | 0 (0.0%) |
| 75 Years and over | 0 (0.0%) | 0 (0.0%) |
Disability Class: Cognitive Difficulty
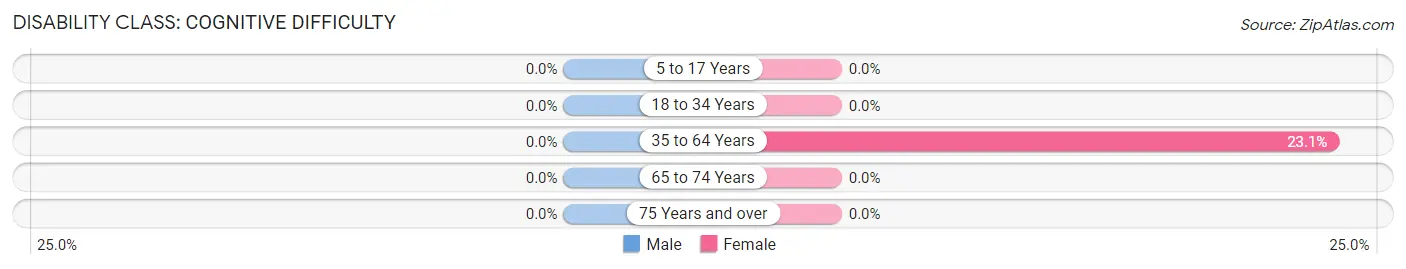
| Age Bracket | Male | Female |
| 5 to 17 Years | 0 (0.0%) | 0 (0.0%) |
| 18 to 34 Years | 0 (0.0%) | 0 (0.0%) |
| 35 to 64 Years | 0 (0.0%) | 12 (23.1%) |
| 65 to 74 Years | 0 (0.0%) | 0 (0.0%) |
| 75 Years and over | 0 (0.0%) | 0 (0.0%) |
Disability Class: Ambulatory Difficulty
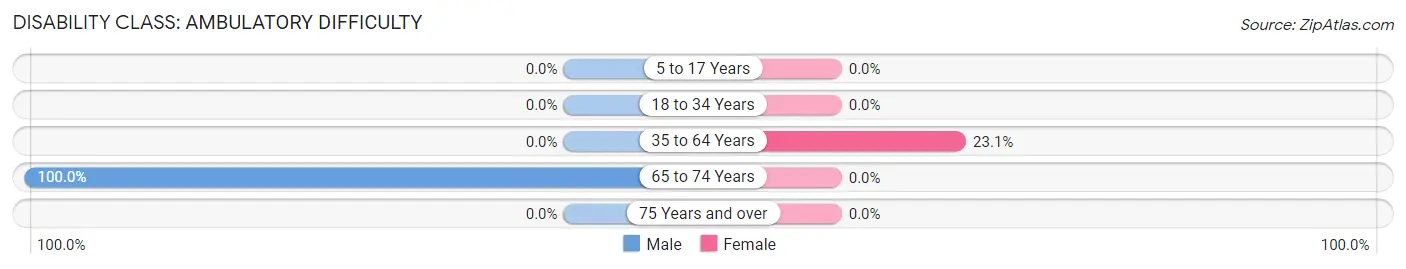
| Age Bracket | Male | Female |
| 5 to 17 Years | 0 (0.0%) | 0 (0.0%) |
| 18 to 34 Years | 0 (0.0%) | 0 (0.0%) |
| 35 to 64 Years | 0 (0.0%) | 12 (23.1%) |
| 65 to 74 Years | 9 (100.0%) | 0 (0.0%) |
| 75 Years and over | 0 (0.0%) | 0 (0.0%) |
Disability Class: Self-Care Difficulty
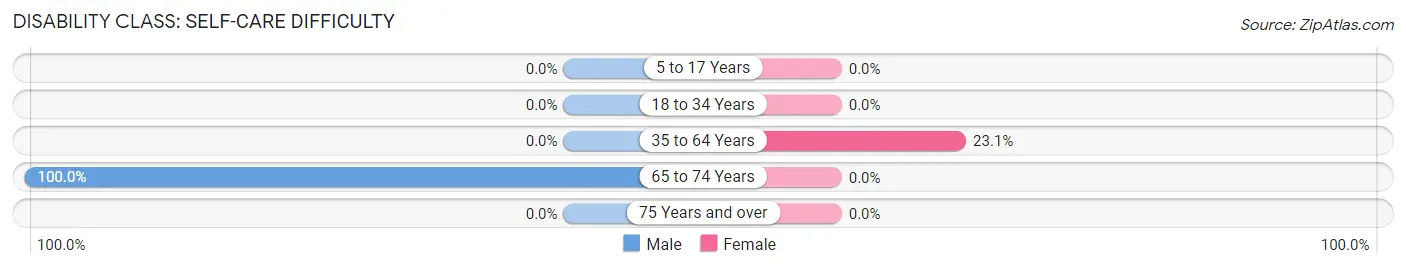
| Age Bracket | Male | Female |
| 5 to 17 Years | 0 (0.0%) | 0 (0.0%) |
| 18 to 34 Years | 0 (0.0%) | 0 (0.0%) |
| 35 to 64 Years | 0 (0.0%) | 12 (23.1%) |
| 65 to 74 Years | 9 (100.0%) | 0 (0.0%) |
| 75 Years and over | 0 (0.0%) | 0 (0.0%) |
Technology Access in Logan
Computing Device Access in Logan
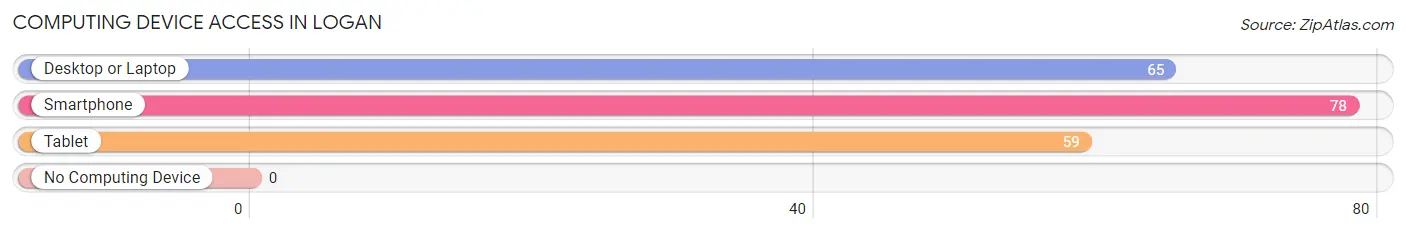
| Device Type | # Households | % Households |
| Desktop or Laptop | 65 | 83.3% |
| Smartphone | 78 | 100.0% |
| Tablet | 59 | 75.6% |
| No Computing Device | 0 | 0.0% |
| Total | 78 | 100.0% |
Internet Access in Logan
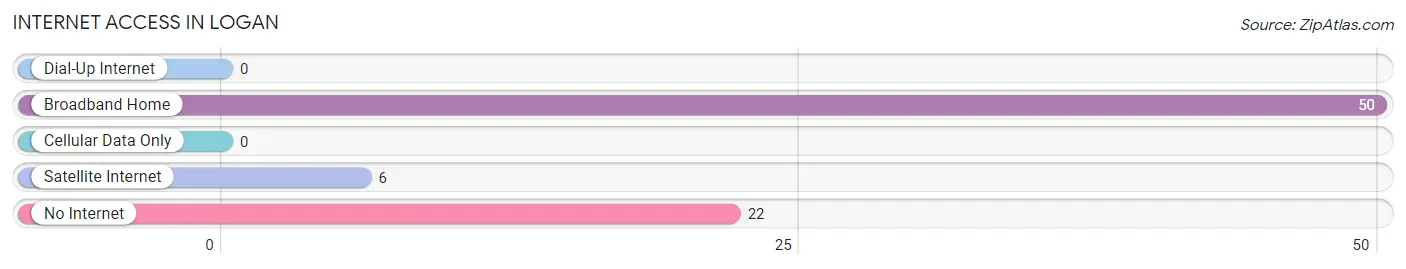
| Internet Type | # Households | % Households |
| Dial-Up Internet | 0 | 0.0% |
| Broadband Home | 50 | 64.1% |
| Cellular Data Only | 0 | 0.0% |
| Satellite Internet | 6 | 7.7% |
| No Internet | 22 | 28.2% |
| Total | 78 | 100.0% |
Logan Summary
Logan is a small city located in the state of North Dakota, United States. It is located in the southwestern part of the state, in the county of McLean. The city has a population of approximately 1,000 people, and is part of the Minot Metropolitan Statistical Area.
History
The area that is now Logan was first settled in 1883 by a group of homesteaders from Wisconsin. The town was originally named “Loganville” after the first settler, John Logan. The town was officially incorporated in 1887, and the name was changed to Logan.
The city was originally a farming community, and the main crops grown were wheat, oats, barley, and flax. The town also had a small sawmill and a flour mill. In the early 1900s, the town began to grow and develop, and the population increased.
In the 1920s, the city was connected to the Great Northern Railway, which allowed for the transportation of goods and people. This helped to further develop the city and the surrounding area.
In the 1950s, the city began to experience a population decline, as many of the residents moved away to larger cities. However, in the late 1970s, the city began to experience a population increase, as people began to move back to the area.
Geography
Logan is located in the southwestern part of North Dakota, in the county of McLean. The city is situated on the banks of the Missouri River, and is surrounded by rolling hills and prairies. The city has a total area of 0.7 square miles, all of which is land.
The climate in Logan is classified as a humid continental climate, with cold winters and hot summers. The average annual temperature is around 45 degrees Fahrenheit, and the average annual precipitation is around 17 inches.
Economy
The economy of Logan is largely based on agriculture. The main crops grown in the area are wheat, oats, barley, and flax. The city also has a small sawmill and a flour mill.
In addition to agriculture, the city also has a few small businesses, including a grocery store, a hardware store, and a few restaurants. The city also has a few small manufacturing companies, which produce a variety of products.
Demographics
As of the 2010 census, the population of Logan was 1,000 people. The racial makeup of the city was 97.2% White, 0.7% Native American, 0.3% Asian, 0.2% from other races, and 1.6% from two or more races.
The median household income in Logan was $41,250, and the median family income was $50,000. The per capita income in the city was $20,000. About 8.3% of the population was below the poverty line.
Conclusion
Logan is a small city located in the southwestern part of North Dakota. The city has a population of approximately 1,000 people, and is part of the Minot Metropolitan Statistical Area. The economy of Logan is largely based on agriculture, and the city also has a few small businesses. The racial makeup of the city is mostly White, with a small percentage of Native American and Asian residents. The median household income in Logan is $41,250, and the per capita income is $20,000.
Common Questions
What is Per Capita Income in Logan?
Per Capita income in Logan is $37,083.
What is the Median Family Income in Logan?
Median Family Income in Logan is $108,523.
What is the Median Household income in Logan?
Median Household Income in Logan is $108,750.
What is Income or Wage Gap in Logan?
Income or Wage Gap in Logan is 25.8%.
Women in Logan earn 74.2 cents for every dollar earned by a man.
What is Inequality or Gini Index in Logan?
Inequality or Gini Index in Logan is 0.25.
What is the Total Population of Logan?
Total Population of Logan is 258.
What is the Total Male Population of Logan?
Total Male Population of Logan is 149.
What is the Total Female Population of Logan?
Total Female Population of Logan is 109.
What is the Ratio of Males per 100 Females in Logan?
There are 136.70 Males per 100 Females in Logan.
What is the Ratio of Females per 100 Males in Logan?
There are 73.15 Females per 100 Males in Logan.
What is the Median Population Age in Logan?
Median Population Age in Logan is 43.6 Years.
What is the Average Family Size in Logan
Average Family Size in Logan is 3.7 People.
What is the Average Household Size in Logan
Average Household Size in Logan is 3.3 People.
How Large is the Labor Force in Logan?
There are 102 People in the Labor Forcein in Logan.
What is the Percentage of People in the Labor Force in Logan?
67.5% of People are in the Labor Force in Logan.