Zip Codes with the Highest Percentage of Population Employed in Computer & Mathematics in North Dakota
RELATED REPORTS & OPTIONS
Computer & Mathematics
North Dakota
Compare Zip Codes
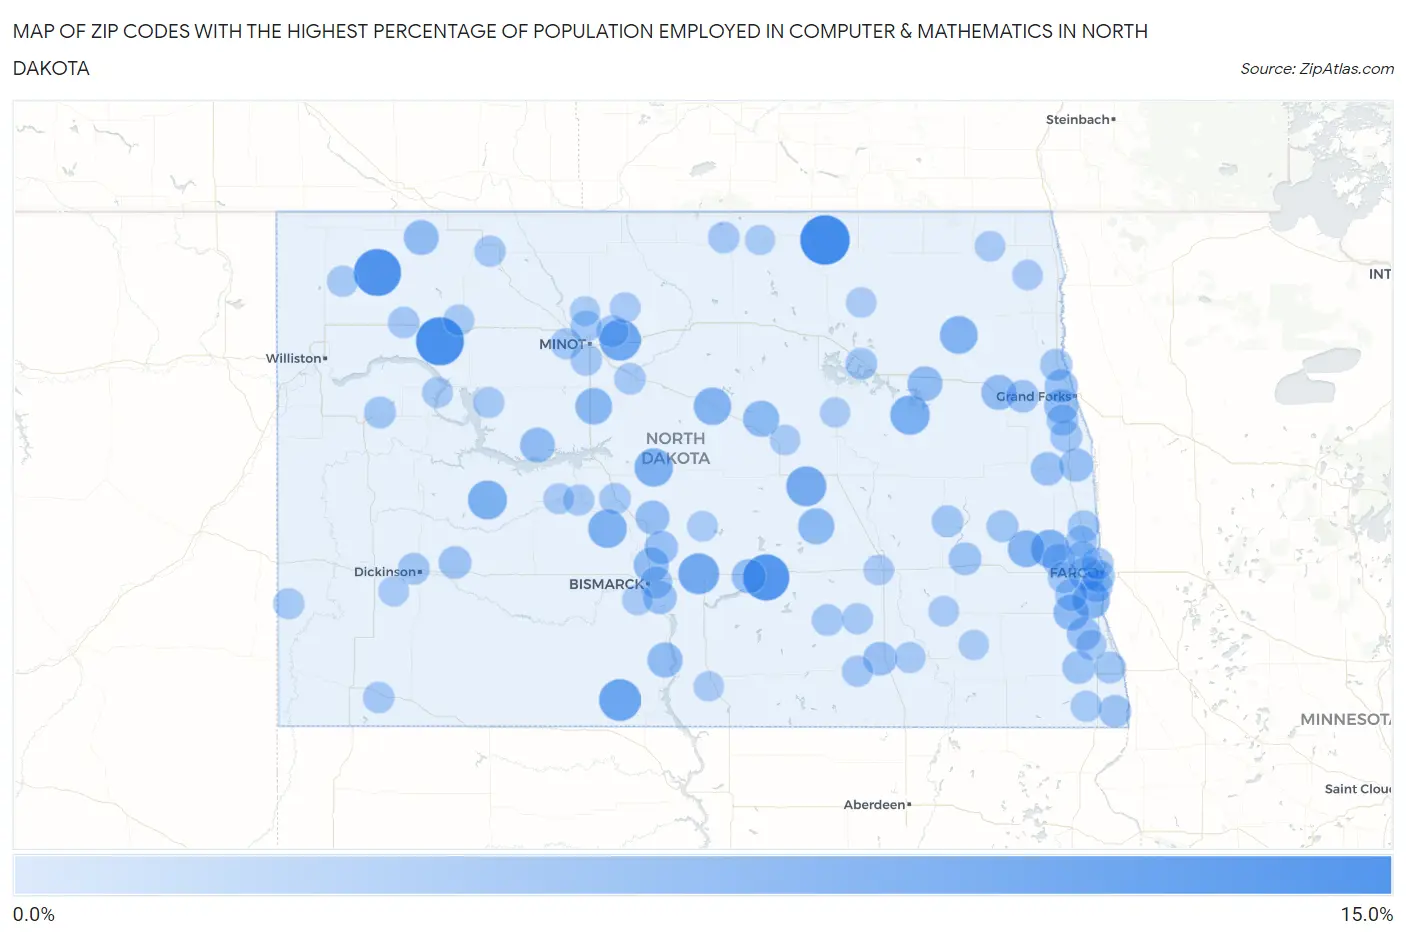
Map of Zip Codes with the Highest Percentage of Population Employed in Computer & Mathematics in North Dakota
0.0%
15.0%
Zip Codes with the Highest Percentage of Population Employed in Computer & Mathematics in North Dakota
| Zip Code | % Employed | vs State | vs National | |
| 1. | 58365 | 13.3% | 1.8%(+11.5)#1 | 3.5%(+9.81)#341 |
| 2. | 58776 | 12.3% | 1.8%(+10.5)#2 | 3.5%(+8.79)#413 |
| 3. | 58795 | 11.8% | 1.8%(+9.95)#3 | 3.5%(+8.24)#469 |
| 4. | 58428 | 11.1% | 1.8%(+9.30)#4 | 3.5%(+7.59)#549 |
| 5. | 58568 | 8.3% | 1.8%(+6.45)#5 | 3.5%(+4.73)#1,133 |
| 6. | 58768 | 7.7% | 1.8%(+5.93)#6 | 3.5%(+4.21)#1,302 |
| 7. | 58572 | 7.6% | 1.8%(+5.75)#7 | 3.5%(+4.03)#1,367 |
| 8. | 58486 | 7.1% | 1.8%(+5.26)#8 | 3.5%(+3.55)#1,586 |
| 9. | 58380 | 6.7% | 1.8%(+4.86)#9 | 3.5%(+3.14)#1,821 |
| 10. | 58625 | 6.4% | 1.8%(+4.60)#10 | 3.5%(+2.89)#2,000 |
| 11. | 58530 | 6.1% | 1.8%(+4.26)#11 | 3.5%(+2.55)#2,253 |
| 12. | 58559 | 6.0% | 1.8%(+4.22)#12 | 3.5%(+2.51)#2,289 |
| 13. | 58004 | 5.8% | 1.8%(+3.97)#13 | 3.5%(+2.26)#2,507 |
| 14. | 58250 | 5.6% | 1.8%(+3.74)#14 | 3.5%(+2.03)#2,726 |
| 15. | 58710 | 5.4% | 1.8%(+3.55)#15 | 3.5%(+1.84)#2,937 |
| 16. | 58047 | 5.2% | 1.8%(+3.39)#16 | 3.5%(+1.68)#3,125 |
| 17. | 58007 | 5.0% | 1.8%(+3.19)#17 | 3.5%(+1.48)#3,353 |
| 18. | 58759 | 4.8% | 1.8%(+3.03)#18 | 3.5%(+1.31)#3,587 |
| 19. | 58496 | 4.5% | 1.8%(+2.68)#19 | 3.5%(+0.970)#4,085 |
| 20. | 58341 | 4.5% | 1.8%(+2.67)#20 | 3.5%(+0.960)#4,102 |
| 21. | 58051 | 4.2% | 1.8%(+2.37)#21 | 3.5%(+0.660)#4,639 |
| 22. | 58503 | 3.8% | 1.8%(+2.00)#22 | 3.5%(+0.289)#5,446 |
| 23. | 58528 | 3.8% | 1.8%(+2.00)#23 | 3.5%(+0.285)#5,457 |
| 24. | 58251 | 3.8% | 1.8%(+1.97)#24 | 3.5%(+0.254)#5,537 |
| 25. | 58727 | 3.8% | 1.8%(+1.96)#25 | 3.5%(+0.249)#5,553 |
| 26. | 58540 | 3.7% | 1.8%(+1.87)#26 | 3.5%(+0.155)#5,782 |
| 27. | 58344 | 3.7% | 1.8%(+1.84)#27 | 3.5%(+0.131)#5,826 |
| 28. | 58482 | 3.3% | 1.8%(+1.53)#28 | 3.5%(-0.184)#6,647 |
| 29. | 58201 | 3.3% | 1.8%(+1.51)#29 | 3.5%(-0.200)#6,704 |
| 30. | 58078 | 3.3% | 1.8%(+1.46)#30 | 3.5%(-0.257)#6,882 |
| 31. | 58579 | 3.2% | 1.8%(+1.36)#31 | 3.5%(-0.350)#7,176 |
| 32. | 58433 | 3.0% | 1.8%(+1.16)#32 | 3.5%(-0.549)#7,827 |
| 33. | 58077 | 2.9% | 1.8%(+1.12)#33 | 3.5%(-0.598)#8,011 |
| 34. | 58223 | 2.9% | 1.8%(+1.05)#34 | 3.5%(-0.667)#8,262 |
| 35. | 58521 | 2.8% | 1.8%(+0.979)#35 | 3.5%(-0.734)#8,484 |
| 36. | 58257 | 2.8% | 1.8%(+0.968)#36 | 3.5%(-0.745)#8,522 |
| 37. | 58504 | 2.7% | 1.8%(+0.933)#37 | 3.5%(-0.780)#8,649 |
| 38. | 58203 | 2.7% | 1.8%(+0.888)#38 | 3.5%(-0.825)#8,821 |
| 39. | 58012 | 2.6% | 1.8%(+0.777)#39 | 3.5%(-0.936)#9,252 |
| 40. | 58008 | 2.4% | 1.8%(+0.588)#40 | 3.5%(-1.12)#10,039 |
| 41. | 58072 | 2.4% | 1.8%(+0.588)#41 | 3.5%(-1.13)#10,042 |
| 42. | 58656 | 2.3% | 1.8%(+0.514)#42 | 3.5%(-1.20)#10,344 |
| 43. | 58214 | 2.3% | 1.8%(+0.444)#43 | 3.5%(-1.27)#10,655 |
| 44. | 58104 | 2.2% | 1.8%(+0.426)#44 | 3.5%(-1.29)#10,723 |
| 45. | 58030 | 2.2% | 1.8%(+0.419)#45 | 3.5%(-1.29)#10,758 |
| 46. | 58103 | 2.2% | 1.8%(+0.394)#46 | 3.5%(-1.32)#10,861 |
| 47. | 58256 | 2.1% | 1.8%(+0.316)#47 | 3.5%(-1.40)#11,222 |
| 48. | 58501 | 2.0% | 1.8%(+0.228)#48 | 3.5%(-1.49)#11,616 |
| 49. | 58785 | 2.0% | 1.8%(+0.188)#49 | 3.5%(-1.52)#11,797 |
| 50. | 58102 | 2.0% | 1.8%(+0.174)#50 | 3.5%(-1.54)#11,862 |
| 51. | 58275 | 2.0% | 1.8%(+0.149)#51 | 3.5%(-1.56)#11,988 |
| 52. | 58021 | 1.9% | 1.8%(+0.136)#52 | 3.5%(-1.58)#12,051 |
| 53. | 58064 | 1.9% | 1.8%(+0.049)#53 | 3.5%(-1.66)#12,481 |
| 54. | 58036 | 1.9% | 1.8%(+0.049)#54 | 3.5%(-1.66)#12,482 |
| 55. | 58059 | 1.8% | 1.8%(+0.015)#55 | 3.5%(-1.70)#12,636 |
| 56. | 58075 | 1.8% | 1.8%(-0.039)#56 | 3.5%(-1.75)#12,876 |
| 57. | 58854 | 1.7% | 1.8%(-0.065)#57 | 3.5%(-1.78)#12,990 |
| 58. | 58601 | 1.7% | 1.8%(-0.077)#58 | 3.5%(-1.79)#13,062 |
| 59. | 58429 | 1.7% | 1.8%(-0.102)#59 | 3.5%(-1.82)#13,202 |
| 60. | 58278 | 1.7% | 1.8%(-0.138)#60 | 3.5%(-1.85)#13,403 |
| 61. | 58301 | 1.7% | 1.8%(-0.161)#61 | 3.5%(-1.87)#13,516 |
| 62. | 58442 | 1.6% | 1.8%(-0.181)#62 | 3.5%(-1.89)#13,636 |
| 63. | 58790 | 1.6% | 1.8%(-0.208)#63 | 3.5%(-1.92)#13,784 |
| 64. | 58329 | 1.6% | 1.8%(-0.229)#64 | 3.5%(-1.94)#13,904 |
| 65. | 58852 | 1.6% | 1.8%(-0.234)#65 | 3.5%(-1.95)#13,939 |
| 66. | 58577 | 1.5% | 1.8%(-0.279)#66 | 3.5%(-1.99)#14,185 |
| 67. | 58701 | 1.5% | 1.8%(-0.295)#67 | 3.5%(-2.01)#14,262 |
| 68. | 58653 | 1.5% | 1.8%(-0.352)#68 | 3.5%(-2.06)#14,616 |
| 69. | 58005 | 1.5% | 1.8%(-0.353)#69 | 3.5%(-2.07)#14,624 |
| 70. | 58703 | 1.4% | 1.8%(-0.384)#70 | 3.5%(-2.10)#14,792 |
| 71. | 58746 | 1.4% | 1.8%(-0.398)#71 | 3.5%(-2.11)#14,856 |
| 72. | 58456 | 1.4% | 1.8%(-0.413)#72 | 3.5%(-2.13)#14,967 |
| 73. | 58722 | 1.4% | 1.8%(-0.417)#73 | 3.5%(-2.13)#14,988 |
| 74. | 58041 | 1.3% | 1.8%(-0.468)#74 | 3.5%(-2.18)#15,275 |
| 75. | 58571 | 1.3% | 1.8%(-0.492)#75 | 3.5%(-2.20)#15,416 |
| 76. | 58632 | 1.3% | 1.8%(-0.504)#76 | 3.5%(-2.22)#15,490 |
| 77. | 58830 | 1.3% | 1.8%(-0.513)#77 | 3.5%(-2.23)#15,530 |
| 78. | 58454 | 1.3% | 1.8%(-0.530)#78 | 3.5%(-2.24)#15,636 |
| 79. | 58415 | 1.3% | 1.8%(-0.530)#79 | 3.5%(-2.24)#15,637 |
| 80. | 58770 | 1.3% | 1.8%(-0.540)#80 | 3.5%(-2.25)#15,709 |
| 81. | 58784 | 1.3% | 1.8%(-0.558)#81 | 3.5%(-2.27)#15,807 |
| 82. | 58042 | 1.2% | 1.8%(-0.603)#82 | 3.5%(-2.32)#16,083 |
| 83. | 58763 | 1.2% | 1.8%(-0.618)#83 | 3.5%(-2.33)#16,167 |
| 84. | 58545 | 1.1% | 1.8%(-0.710)#84 | 3.5%(-2.42)#16,743 |
| 85. | 58461 | 1.0% | 1.8%(-0.807)#85 | 3.5%(-2.52)#17,352 |
| 86. | 58018 | 1.0% | 1.8%(-0.812)#86 | 3.5%(-2.52)#17,392 |
| 87. | 58494 | 0.99% | 1.8%(-0.826)#87 | 3.5%(-2.54)#17,477 |
| 88. | 58731 | 0.99% | 1.8%(-0.826)#88 | 3.5%(-2.54)#17,478 |
| 89. | 58655 | 0.97% | 1.8%(-0.841)#89 | 3.5%(-2.55)#17,554 |
| 90. | 58554 | 0.95% | 1.8%(-0.863)#90 | 3.5%(-2.58)#17,703 |
| 91. | 58220 | 0.94% | 1.8%(-0.870)#91 | 3.5%(-2.58)#17,749 |
| 92. | 58438 | 0.94% | 1.8%(-0.870)#92 | 3.5%(-2.58)#17,755 |
| 93. | 58401 | 0.90% | 1.8%(-0.908)#93 | 3.5%(-2.62)#18,017 |
| 94. | 58276 | 0.90% | 1.8%(-0.911)#94 | 3.5%(-2.62)#18,036 |
| 95. | 58316 | 0.88% | 1.8%(-0.934)#95 | 3.5%(-2.65)#18,166 |
| 96. | 58377 | 0.87% | 1.8%(-0.942)#96 | 3.5%(-2.66)#18,216 |
| 97. | 58552 | 0.85% | 1.8%(-0.958)#97 | 3.5%(-2.67)#18,316 |
| 98. | 58374 | 0.85% | 1.8%(-0.964)#98 | 3.5%(-2.68)#18,352 |
| 99. | 58033 | 0.81% | 1.8%(-1.00)#99 | 3.5%(-2.71)#18,586 |
| 100. | 58704 | 0.76% | 1.8%(-1.05)#100 | 3.5%(-2.76)#18,874 |
Common Questions
What are the Top 10 Zip Codes with the Highest Percentage of Population Employed in Computer & Mathematics in North Dakota?
Top 10 Zip Codes with the Highest Percentage of Population Employed in Computer & Mathematics in North Dakota are:
What zip code has the Highest Percentage of Population Employed in Computer & Mathematics in North Dakota?
58365 has the Highest Percentage of Population Employed in Computer & Mathematics in North Dakota with 13.3%.
What is the Percentage of Population Employed in Computer & Mathematics in the State of North Dakota?
Percentage of Population Employed in Computer & Mathematics in North Dakota is 1.8%.
What is the Percentage of Population Employed in Computer & Mathematics in the United States?
Percentage of Population Employed in Computer & Mathematics in the United States is 3.5%.