Fort Ransom, ND Map & Demographics
Fort Ransom Map
Fort Ransom Overview
$42,615
PER CAPITA INCOME
$102,500
AVG FAMILY INCOME
$80,000
AVG HOUSEHOLD INCOME
0.55
INEQUALITY / GINI INDEX
106
TOTAL POPULATION
68
MALE POPULATION
38
FEMALE POPULATION
178.95
MALES / 100 FEMALES
55.88
FEMALES / 100 MALES
35.0
MEDIAN AGE
3.3
AVG FAMILY SIZE
2.5
AVG HOUSEHOLD SIZE
49
LABOR FORCE [ PEOPLE ]
59.8%
PERCENT IN LABOR FORCE
4.1%
UNEMPLOYMENT RATE
Fort Ransom Zip Codes
Fort Ransom Area Codes
Income in Fort Ransom
Income Overview in Fort Ransom
Per Capita Income in Fort Ransom is $42,615, while median incomes of families and households are $102,500 and $80,000 respectively.
| Characteristic | Number | Measure |
| Per Capita Income | 106 | $42,615 |
| Median Family Income | 26 | $102,500 |
| Mean Family Income | 26 | $157,012 |
| Median Household Income | 42 | $80,000 |
| Mean Household Income | 42 | $106,526 |
| Income Deficit | 26 | $0 |
| Wage / Income Gap (%) | 106 | 0.00% |
| Wage / Income Gap ($) | 106 | 100.00¢ per $1 |
| Gini / Inequality Index | 106 | 0.55 |
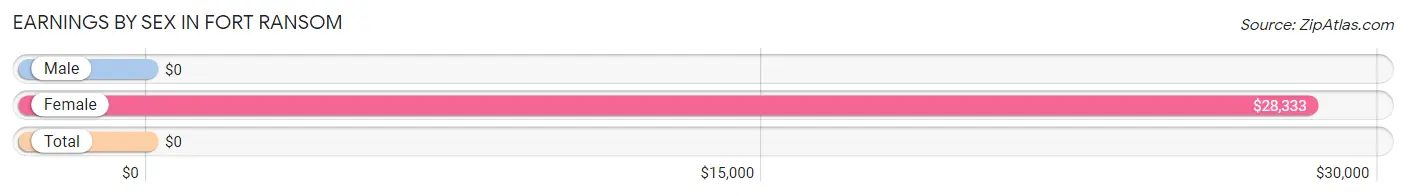
Earnings by Sex in Fort Ransom
| Sex | Number | Average Earnings |
| Male | 31 (60.8%) | $0 |
| Female | 20 (39.2%) | $28,333 |
| Total | 51 (100.0%) | $0 |
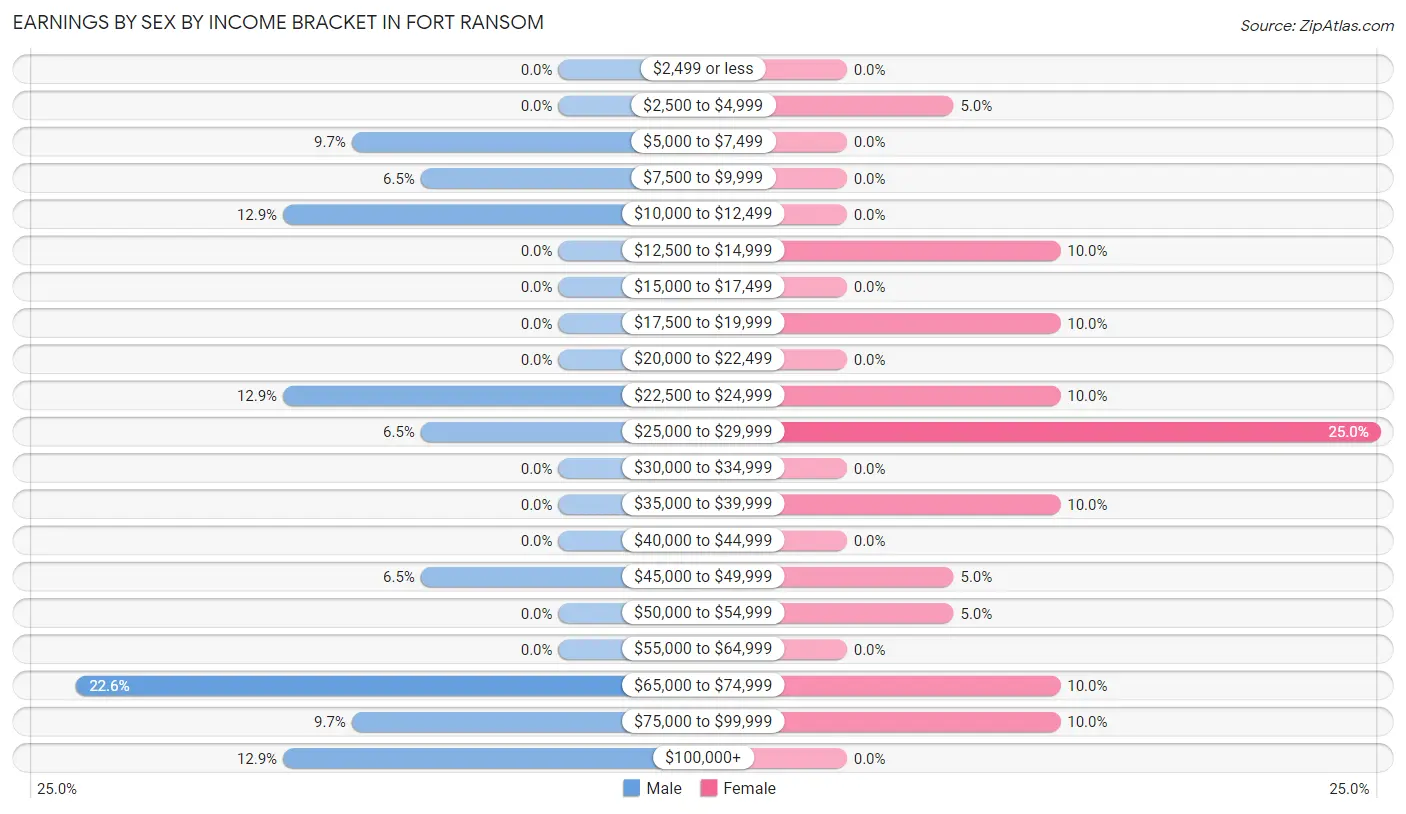
Earnings by Sex by Income Bracket in Fort Ransom
The most common earnings brackets in Fort Ransom are $65,000 to $74,999 for men (7 | 22.6%) and $25,000 to $29,999 for women (5 | 25.0%).
| Income | Male | Female |
| $2,499 or less | 0 (0.0%) | 0 (0.0%) |
| $2,500 to $4,999 | 0 (0.0%) | 1 (5.0%) |
| $5,000 to $7,499 | 3 (9.7%) | 0 (0.0%) |
| $7,500 to $9,999 | 2 (6.5%) | 0 (0.0%) |
| $10,000 to $12,499 | 4 (12.9%) | 0 (0.0%) |
| $12,500 to $14,999 | 0 (0.0%) | 2 (10.0%) |
| $15,000 to $17,499 | 0 (0.0%) | 0 (0.0%) |
| $17,500 to $19,999 | 0 (0.0%) | 2 (10.0%) |
| $20,000 to $22,499 | 0 (0.0%) | 0 (0.0%) |
| $22,500 to $24,999 | 4 (12.9%) | 2 (10.0%) |
| $25,000 to $29,999 | 2 (6.5%) | 5 (25.0%) |
| $30,000 to $34,999 | 0 (0.0%) | 0 (0.0%) |
| $35,000 to $39,999 | 0 (0.0%) | 2 (10.0%) |
| $40,000 to $44,999 | 0 (0.0%) | 0 (0.0%) |
| $45,000 to $49,999 | 2 (6.5%) | 1 (5.0%) |
| $50,000 to $54,999 | 0 (0.0%) | 1 (5.0%) |
| $55,000 to $64,999 | 0 (0.0%) | 0 (0.0%) |
| $65,000 to $74,999 | 7 (22.6%) | 2 (10.0%) |
| $75,000 to $99,999 | 3 (9.7%) | 2 (10.0%) |
| $100,000+ | 4 (12.9%) | 0 (0.0%) |
| Total | 31 (100.0%) | 20 (100.0%) |
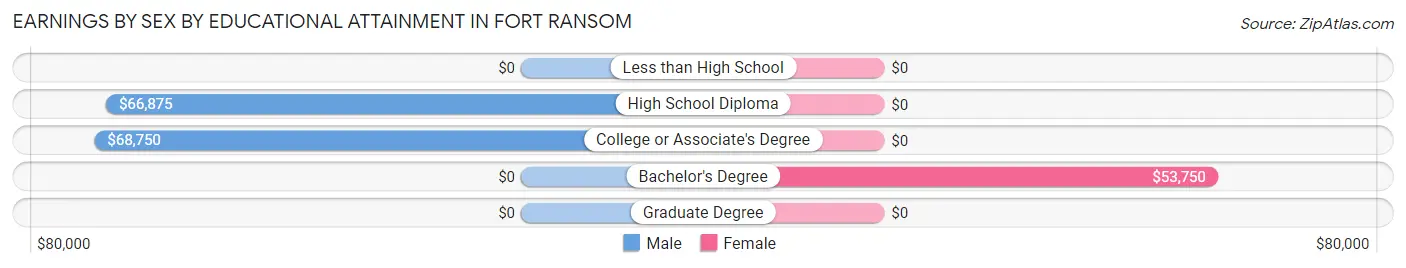
Earnings by Sex by Educational Attainment in Fort Ransom
Average earnings in Fort Ransom are $68,000 for men and $38,125 for women, a difference of 43.9%. Men with an educational attainment of college or associate's degree enjoy the highest average annual earnings of $68,750, while those with high school diploma education earn the least with $66,875. Women with an educational attainment of bachelor's degree earn the most with the average annual earnings of $53,750, while those with bachelor's degree education have the smallest earnings of $53,750.
| Educational Attainment | Male Income | Female Income |
| Less than High School | - | - |
| High School Diploma | $66,875 | $0 |
| College or Associate's Degree | $68,750 | $0 |
| Bachelor's Degree | - | - |
| Graduate Degree | - | - |
| Total | $68,000 | $38,125 |
Family Income in Fort Ransom
Family Income Brackets in Fort Ransom
According to the Fort Ransom family income data, there are 10 families falling into the $100,000 to $149,999 income range, which is the most common income bracket and makes up 38.5% of all families.
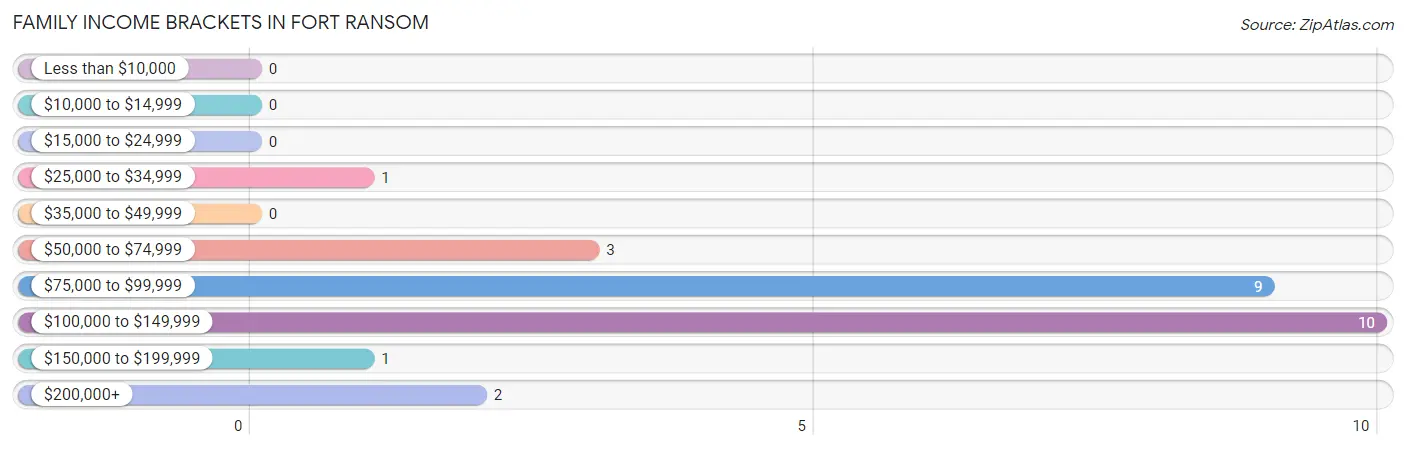
| Income Bracket | # Families | % Families |
| Less than $10,000 | 0 | 0.0% |
| $10,000 to $14,999 | 0 | 0.0% |
| $15,000 to $24,999 | 0 | 0.0% |
| $25,000 to $34,999 | 1 | 3.8% |
| $35,000 to $49,999 | 0 | 0.0% |
| $50,000 to $74,999 | 3 | 11.5% |
| $75,000 to $99,999 | 9 | 34.6% |
| $100,000 to $149,999 | 10 | 38.5% |
| $150,000 to $199,999 | 1 | 3.8% |
| $200,000+ | 2 | 7.7% |
Family Income by Famaliy Size in Fort Ransom
4-person families (6 | 23.1%) account for the highest median family income in Fort Ransom with $105,000 per family, while 2-person families (10 | 38.5%) have the highest median income of $40,000 per family member.
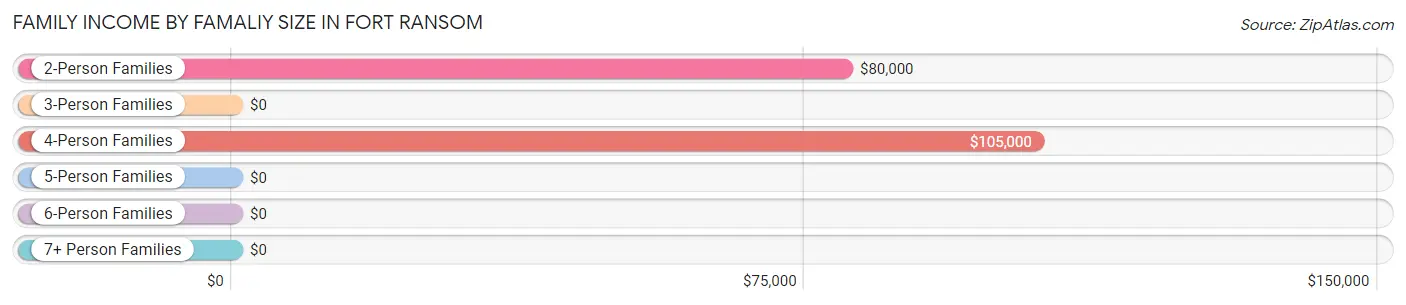
| Income Bracket | # Families | Median Income |
| 2-Person Families | 10 (38.5%) | $80,000 |
| 3-Person Families | 4 (15.4%) | $0 |
| 4-Person Families | 6 (23.1%) | $105,000 |
| 5-Person Families | 6 (23.1%) | $0 |
| 6-Person Families | 0 (0.0%) | $0 |
| 7+ Person Families | 0 (0.0%) | $0 |
| Total | 26 (100.0%) | $102,500 |
Family Income by Number of Earners in Fort Ransom
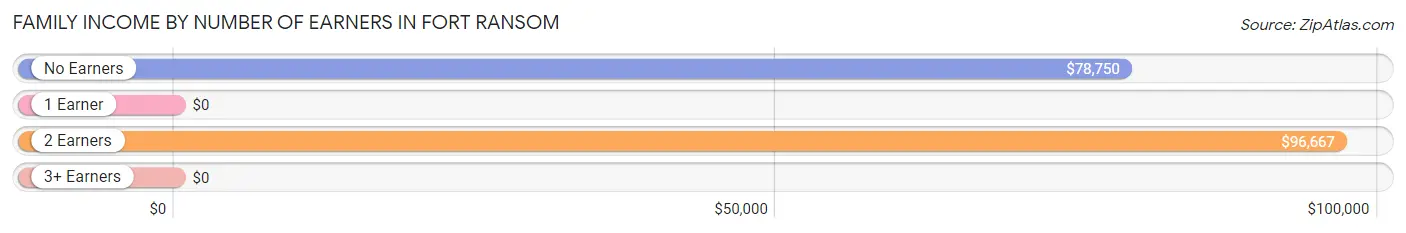
| Number of Earners | # Families | Median Income |
| No Earners | 5 (19.2%) | $78,750 |
| 1 Earner | 5 (19.2%) | $0 |
| 2 Earners | 14 (53.8%) | $96,667 |
| 3+ Earners | 2 (7.7%) | $0 |
| Total | 26 (100.0%) | $102,500 |
Household Income in Fort Ransom
Household Income Brackets in Fort Ransom
With 13 households falling in the category, the $100,000 to $149,999 income range is the most frequent in Fort Ransom, accounting for 30.9% of all households. In contrast, only 1 households (2.4%) fall into the $150,000 to $199,999 income bracket, making it the least populous group.
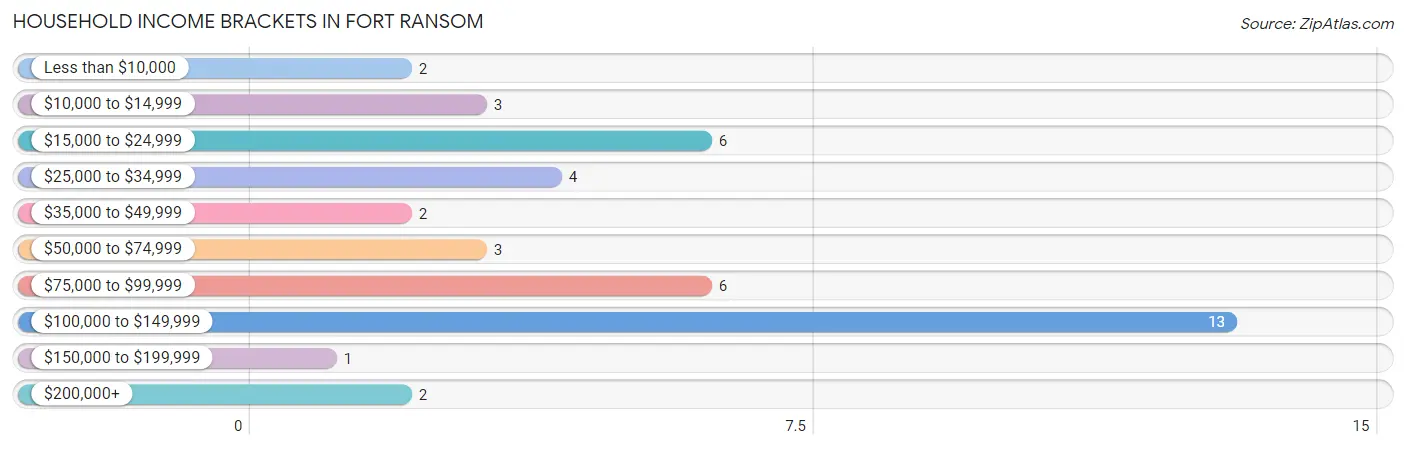
| Income Bracket | # Households | % Households |
| Less than $10,000 | 2 | 4.8% |
| $10,000 to $14,999 | 3 | 7.1% |
| $15,000 to $24,999 | 6 | 14.3% |
| $25,000 to $34,999 | 4 | 9.5% |
| $35,000 to $49,999 | 2 | 4.8% |
| $50,000 to $74,999 | 3 | 7.1% |
| $75,000 to $99,999 | 6 | 14.3% |
| $100,000 to $149,999 | 13 | 31.0% |
| $150,000 to $199,999 | 1 | 2.4% |
| $200,000+ | 2 | 4.8% |
Household Income by Householder Age in Fort Ransom
The median household income in Fort Ransom is $80,000, with the highest median household income of $115,000 found in the 45 to 64 years age bracket for the primary householder. A total of 8 households (19.1%) fall into this category. Meanwhile, the 15 to 24 years age bracket for the primary householder has the lowest median household income of $0, with 9 households (21.4%) in this group.
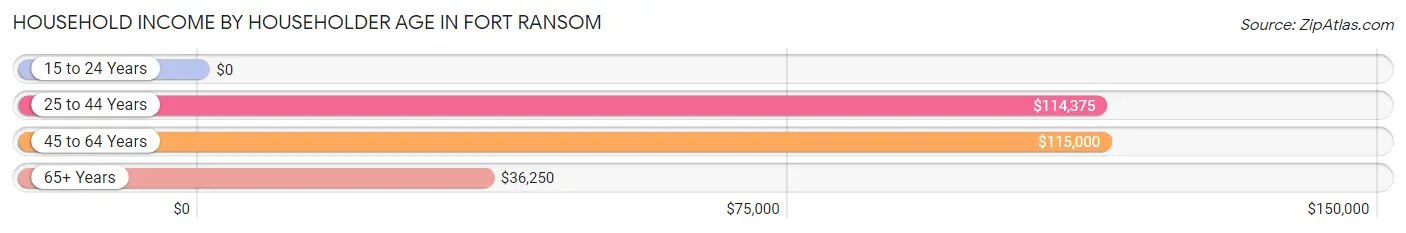
| Income Bracket | # Households | Median Income |
| 15 to 24 Years | 9 (21.4%) | $0 |
| 25 to 44 Years | 11 (26.2%) | $114,375 |
| 45 to 64 Years | 8 (19.1%) | $115,000 |
| 65+ Years | 14 (33.3%) | $36,250 |
| Total | 42 (100.0%) | $80,000 |
Poverty in Fort Ransom
Income Below Poverty by Sex and Age in Fort Ransom
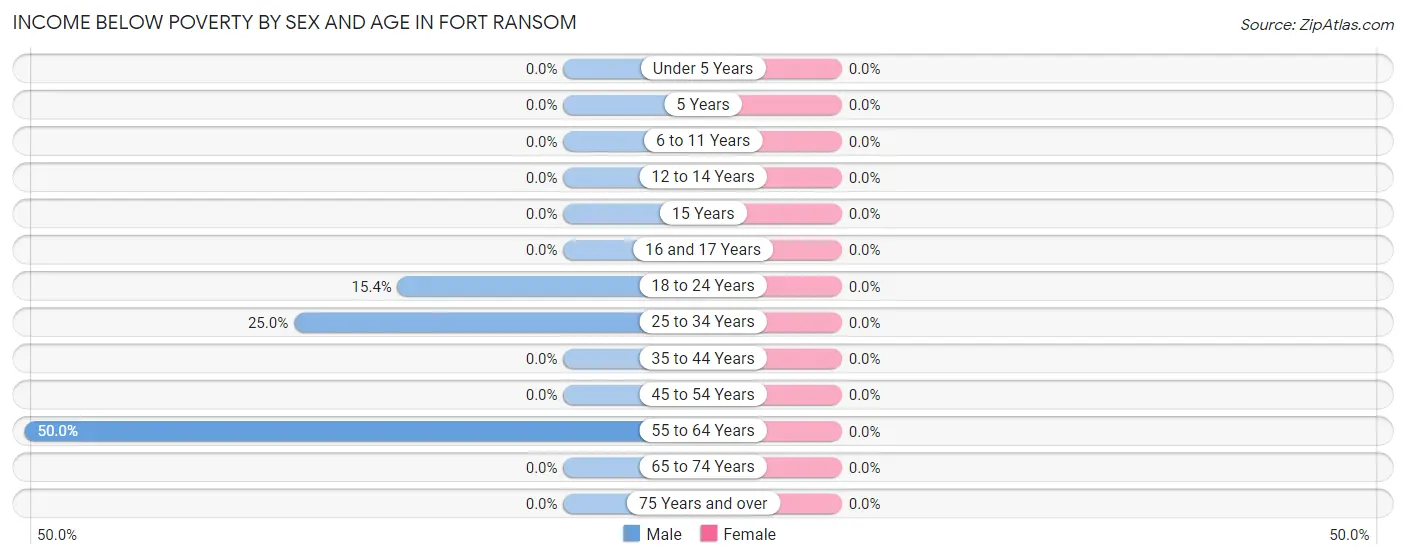
| Age Bracket | Male | Female |
| Under 5 Years | 0 (0.0%) | 0 (0.0%) |
| 5 Years | 0 (0.0%) | 0 (0.0%) |
| 6 to 11 Years | 0 (0.0%) | 0 (0.0%) |
| 12 to 14 Years | 0 (0.0%) | 0 (0.0%) |
| 15 Years | 0 (0.0%) | 0 (0.0%) |
| 16 and 17 Years | 0 (0.0%) | 0 (0.0%) |
| 18 to 24 Years | 2 (15.4%) | 0 (0.0%) |
| 25 to 34 Years | 2 (25.0%) | 0 (0.0%) |
| 35 to 44 Years | 0 (0.0%) | 0 (0.0%) |
| 45 to 54 Years | 0 (0.0%) | 0 (0.0%) |
| 55 to 64 Years | 2 (50.0%) | 0 (0.0%) |
| 65 to 74 Years | 0 (0.0%) | 0 (0.0%) |
| 75 Years and over | 0 (0.0%) | 0 (0.0%) |
| Total | 6 (8.8%) | 0 (0.0%) |
Income Above Poverty by Sex and Age in Fort Ransom
According to the poverty statistics in Fort Ransom, males aged under 5 years and females aged under 5 years are the age groups that are most secure financially, with 100.0% of males and 100.0% of females in these age groups living above the poverty line.
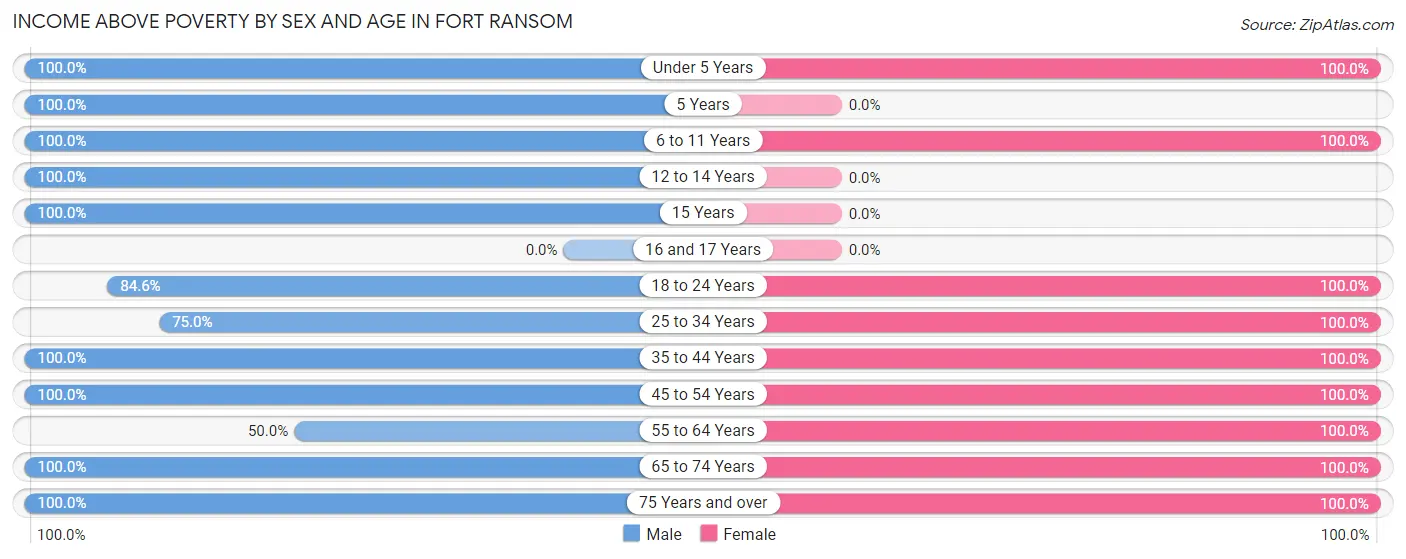
| Age Bracket | Male | Female |
| Under 5 Years | 4 (100.0%) | 2 (100.0%) |
| 5 Years | 1 (100.0%) | 0 (0.0%) |
| 6 to 11 Years | 8 (100.0%) | 4 (100.0%) |
| 12 to 14 Years | 2 (100.0%) | 0 (0.0%) |
| 15 Years | 3 (100.0%) | 0 (0.0%) |
| 16 and 17 Years | 0 (0.0%) | 0 (0.0%) |
| 18 to 24 Years | 11 (84.6%) | 5 (100.0%) |
| 25 to 34 Years | 6 (75.0%) | 3 (100.0%) |
| 35 to 44 Years | 7 (100.0%) | 7 (100.0%) |
| 45 to 54 Years | 2 (100.0%) | 2 (100.0%) |
| 55 to 64 Years | 2 (50.0%) | 6 (100.0%) |
| 65 to 74 Years | 14 (100.0%) | 4 (100.0%) |
| 75 Years and over | 2 (100.0%) | 5 (100.0%) |
| Total | 62 (91.2%) | 38 (100.0%) |
Income Below Poverty Among Married-Couple Families in Fort Ransom
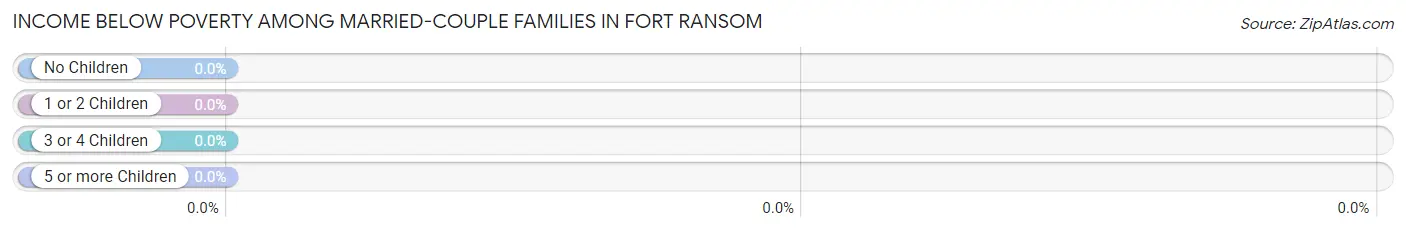
| Children | Above Poverty | Below Poverty |
| No Children | 12 (100.0%) | 0 (0.0%) |
| 1 or 2 Children | 12 (100.0%) | 0 (0.0%) |
| 3 or 4 Children | 2 (100.0%) | 0 (0.0%) |
| 5 or more Children | 0 (0.0%) | 0 (0.0%) |
| Total | 26 (100.0%) | 0 (0.0%) |
Income Below Poverty Among Single-Parent Households in Fort Ransom
| Children | Single Father | Single Mother |
| No Children | 0 (0.0%) | 0 (0.0%) |
| 1 or 2 Children | 0 (0.0%) | 0 (0.0%) |
| 3 or 4 Children | 0 (0.0%) | 0 (0.0%) |
| 5 or more Children | 0 (0.0%) | 0 (0.0%) |
| Total | 0 (0.0%) | 0 (0.0%) |
Income Below Poverty Among Married-Couple vs Single-Parent Households in Fort Ransom
| Children | Married-Couple Families | Single-Parent Households |
| No Children | 0 (0.0%) | 0 (0.0%) |
| 1 or 2 Children | 0 (0.0%) | 0 (0.0%) |
| 3 or 4 Children | 0 (0.0%) | 0 (0.0%) |
| 5 or more Children | 0 (0.0%) | 0 (0.0%) |
| Total | 0 (0.0%) | 0 (0.0%) |
Race in Fort Ransom
The most populous races in Fort Ransom are , and White / Caucasian (106 | 100.0%).
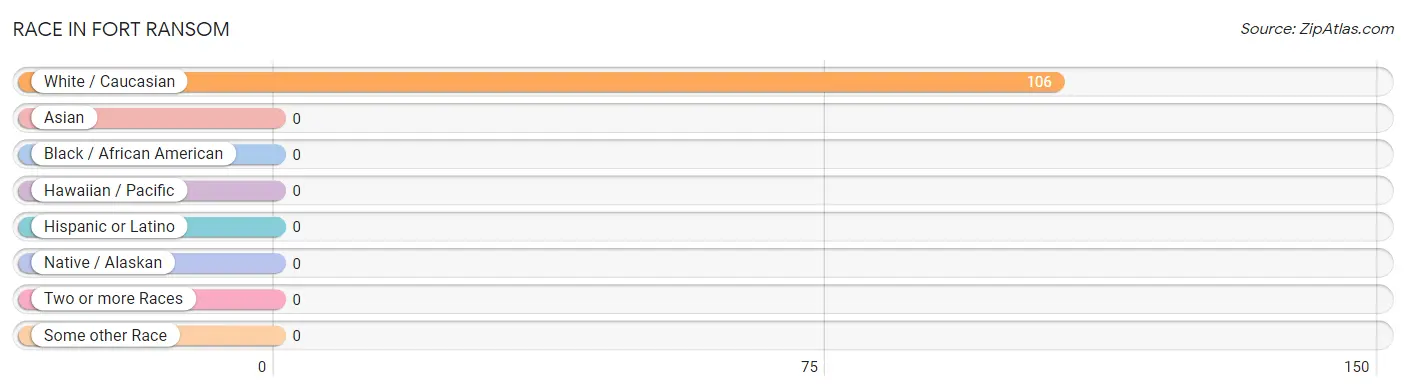
| Race | # Population | % Population |
| Asian | 0 | 0.0% |
| Black / African American | 0 | 0.0% |
| Hawaiian / Pacific | 0 | 0.0% |
| Hispanic or Latino | 0 | 0.0% |
| Native / Alaskan | 0 | 0.0% |
| White / Caucasian | 106 | 100.0% |
| Two or more Races | 0 | 0.0% |
| Some other Race | 0 | 0.0% |
| Total | 106 | 100.0% |
Ancestry in Fort Ransom
The most populous ancestries reported in Fort Ransom are Norwegian (45 | 42.4%), German (28 | 26.4%), English (7 | 6.6%), American (6 | 5.7%), and Irish (5 | 4.7%), together accounting for 85.8% of all Fort Ransom residents.
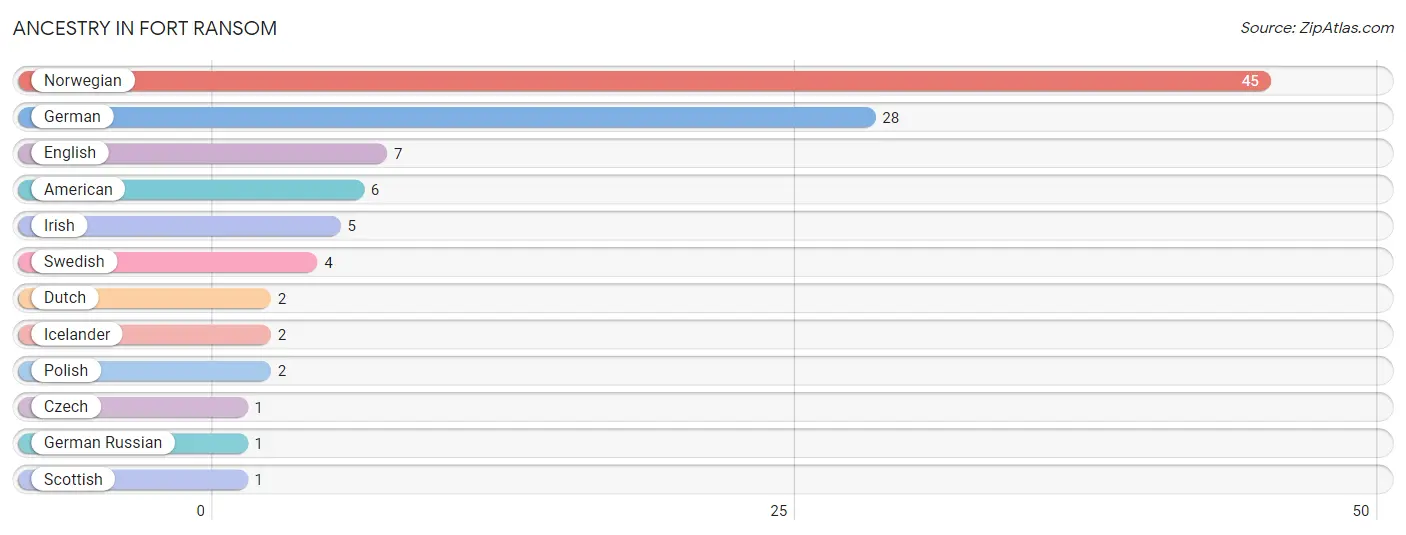
| Ancestry | # Population | % Population |
| American | 6 | 5.7% |
| Czech | 1 | 0.9% |
| Dutch | 2 | 1.9% |
| English | 7 | 6.6% |
| German | 28 | 26.4% |
| German Russian | 1 | 0.9% |
| Icelander | 2 | 1.9% |
| Irish | 5 | 4.7% |
| Norwegian | 45 | 42.4% |
| Polish | 2 | 1.9% |
| Scottish | 1 | 0.9% |
| Swedish | 4 | 3.8% | View All 12 Rows |
Immigrants in Fort Ransom

| Immigration Origin | # Population | % Population | View All 0 Rows |
Sex and Age in Fort Ransom
Sex and Age in Fort Ransom
The most populous age groups in Fort Ransom are 15 to 19 Years (10 | 14.7%) for men and 20 to 24 Years (5 | 13.2%) for women.
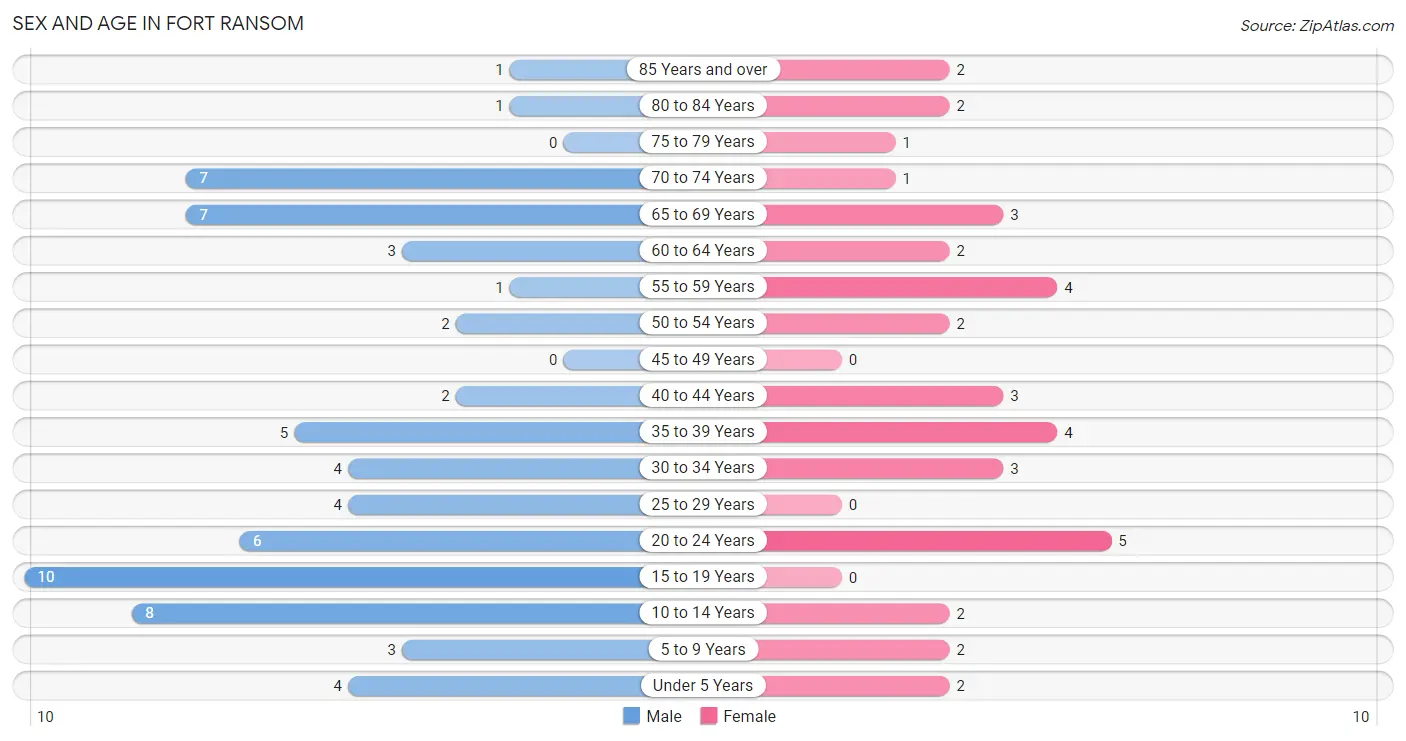
| Age Bracket | Male | Female |
| Under 5 Years | 4 (5.9%) | 2 (5.3%) |
| 5 to 9 Years | 3 (4.4%) | 2 (5.3%) |
| 10 to 14 Years | 8 (11.8%) | 2 (5.3%) |
| 15 to 19 Years | 10 (14.7%) | 0 (0.0%) |
| 20 to 24 Years | 6 (8.8%) | 5 (13.2%) |
| 25 to 29 Years | 4 (5.9%) | 0 (0.0%) |
| 30 to 34 Years | 4 (5.9%) | 3 (7.9%) |
| 35 to 39 Years | 5 (7.3%) | 4 (10.5%) |
| 40 to 44 Years | 2 (2.9%) | 3 (7.9%) |
| 45 to 49 Years | 0 (0.0%) | 0 (0.0%) |
| 50 to 54 Years | 2 (2.9%) | 2 (5.3%) |
| 55 to 59 Years | 1 (1.5%) | 4 (10.5%) |
| 60 to 64 Years | 3 (4.4%) | 2 (5.3%) |
| 65 to 69 Years | 7 (10.3%) | 3 (7.9%) |
| 70 to 74 Years | 7 (10.3%) | 1 (2.6%) |
| 75 to 79 Years | 0 (0.0%) | 1 (2.6%) |
| 80 to 84 Years | 1 (1.5%) | 2 (5.3%) |
| 85 Years and over | 1 (1.5%) | 2 (5.3%) |
| Total | 68 (100.0%) | 38 (100.0%) |
Families and Households in Fort Ransom
Median Family Size in Fort Ransom
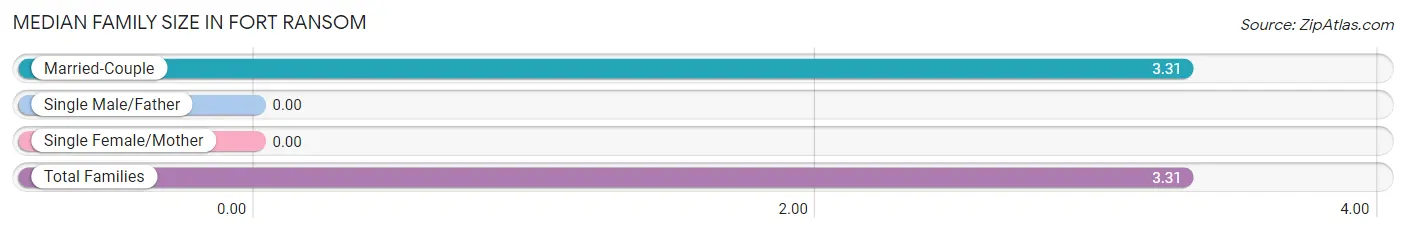
| Family Type | # Families | Family Size |
| Married-Couple | 26 (100.0%) | 3.31 |
| Single Male/Father | 0 (0.0%) | - |
| Single Female/Mother | 0 (0.0%) | - |
| Total Families | 26 (100.0%) | 3.31 |
Median Household Size in Fort Ransom
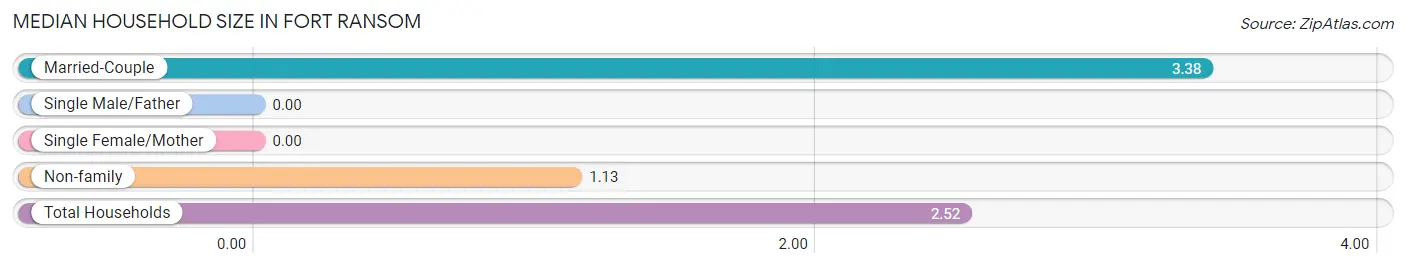
| Household Type | # Households | Household Size |
| Married-Couple | 26 (61.9%) | 3.38 |
| Single Male/Father | 0 (0.0%) | - |
| Single Female/Mother | 0 (0.0%) | - |
| Non-family | 16 (38.1%) | 1.13 |
| Total Households | 42 (100.0%) | 2.52 |
Household Size by Marriage Status in Fort Ransom
Out of a total of 42 households in Fort Ransom, 26 (61.9%) are family households, while 16 (38.1%) are nonfamily households. The most numerous type of family households are 2-person households, comprising 10, and the most common type of nonfamily households are 1-person households, comprising 14.
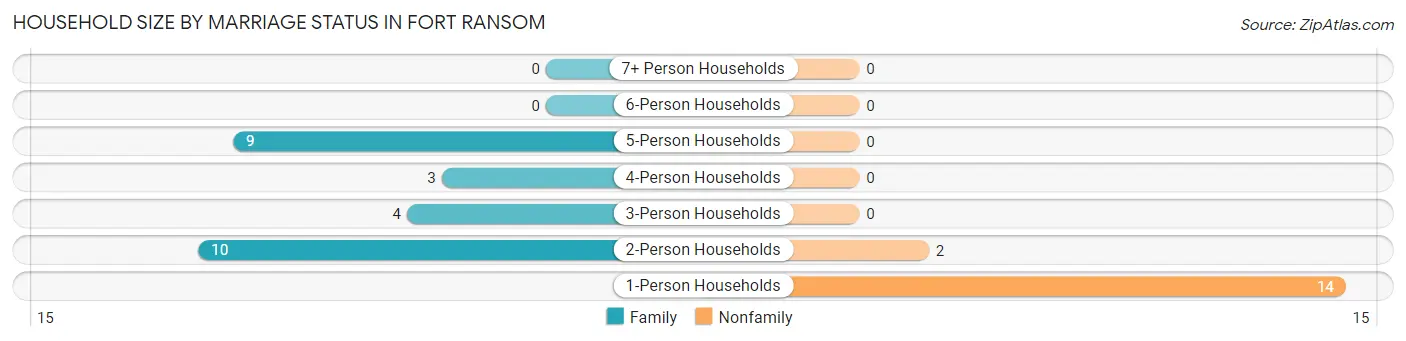
| Household Size | Family Households | Nonfamily Households |
| 1-Person Households | - | 14 (33.3%) |
| 2-Person Households | 10 (23.8%) | 2 (4.8%) |
| 3-Person Households | 4 (9.5%) | 0 (0.0%) |
| 4-Person Households | 3 (7.1%) | 0 (0.0%) |
| 5-Person Households | 9 (21.4%) | 0 (0.0%) |
| 6-Person Households | 0 (0.0%) | 0 (0.0%) |
| 7+ Person Households | 0 (0.0%) | 0 (0.0%) |
| Total | 26 (61.9%) | 16 (38.1%) |
Female Fertility in Fort Ransom
Fertility by Age in Fort Ransom
| Age Bracket | Women with Births | Births / 1,000 Women |
| 15 to 19 years | 0 (0.0%) | 0.0 |
| 20 to 34 years | 0 (0.0%) | 0.0 |
| 35 to 50 years | 0 (0.0%) | 0.0 |
| Total | 0 (0.0%) | 0.0 |
Fertility by Age by Marriage Status in Fort Ransom
| Age Bracket | Married | Unmarried |
| 15 to 19 years | 0 (0.0%) | 0 (0.0%) |
| 20 to 34 years | 0 (0.0%) | 0 (0.0%) |
| 35 to 50 years | 0 (0.0%) | 0 (0.0%) |
| Total | 0 (0.0%) | 0 (0.0%) |
Fertility by Education in Fort Ransom
| Educational Attainment | Women with Births | Births / 1,000 Women |
| Less than High School | 0 (0.0%) | 0.0 |
| High School Diploma | 0 (0.0%) | 0.0 |
| College or Associate's Degree | 0 (0.0%) | 0.0 |
| Bachelor's Degree | 0 (0.0%) | 0.0 |
| Graduate Degree | 0 (0.0%) | 0.0 |
| Total | 0 (0.0%) | 0.0 |
Fertility by Education by Marriage Status in Fort Ransom
| Educational Attainment | Married | Unmarried |
| Less than High School | 0 (0.0%) | 0 (0.0%) |
| High School Diploma | 0 (0.0%) | 0 (0.0%) |
| College or Associate's Degree | 0 (0.0%) | 0 (0.0%) |
| Bachelor's Degree | 0 (0.0%) | 0 (0.0%) |
| Graduate Degree | 0 (0.0%) | 0 (0.0%) |
| Total | 0 (0.0%) | 0 (0.0%) |
Employment Characteristics in Fort Ransom
Employment by Class of Employer in Fort Ransom
Among the 47 employed individuals in Fort Ransom, private company employees (21 | 44.7%), not-for-profit organizations (7 | 14.9%), and federal government employees (5 | 10.6%) make up the most common classes of employment.
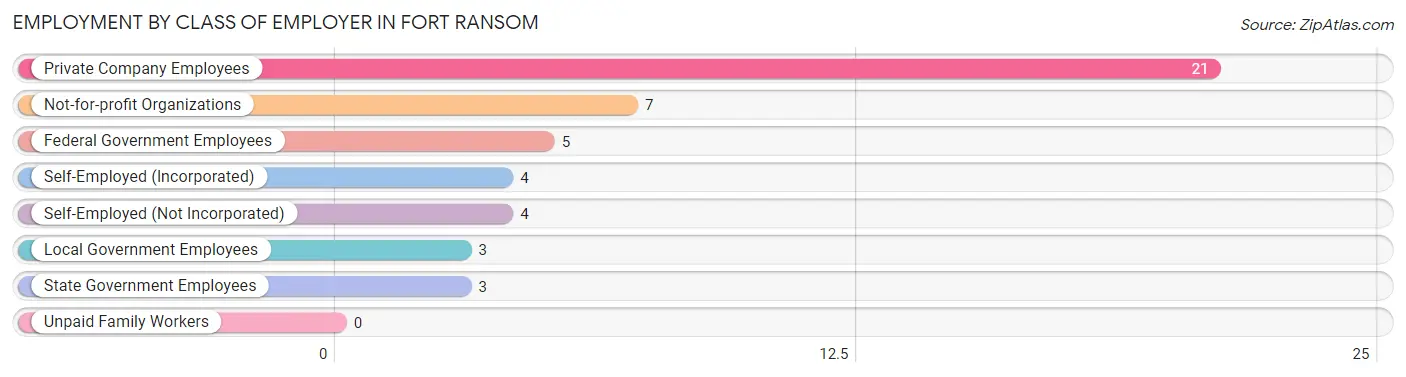
| Employer Class | # Employees | % Employees |
| Private Company Employees | 21 | 44.7% |
| Self-Employed (Incorporated) | 4 | 8.5% |
| Self-Employed (Not Incorporated) | 4 | 8.5% |
| Not-for-profit Organizations | 7 | 14.9% |
| Local Government Employees | 3 | 6.4% |
| State Government Employees | 3 | 6.4% |
| Federal Government Employees | 5 | 10.6% |
| Unpaid Family Workers | 0 | 0.0% |
| Total | 47 | 100.0% |
Employment Status by Age in Fort Ransom
According to the labor force statistics for Fort Ransom, out of the total population over 16 years of age (82), 59.8% or 49 individuals are in the labor force, with 4.1% or 2 of them unemployed. The age group with the highest labor force participation rate is 20 to 24 years, with 100.0% or 11 individuals in the labor force. Within the labor force, the 20 to 24 years age range has the highest percentage of unemployed individuals, with 18.2% or 2 of them being unemployed.
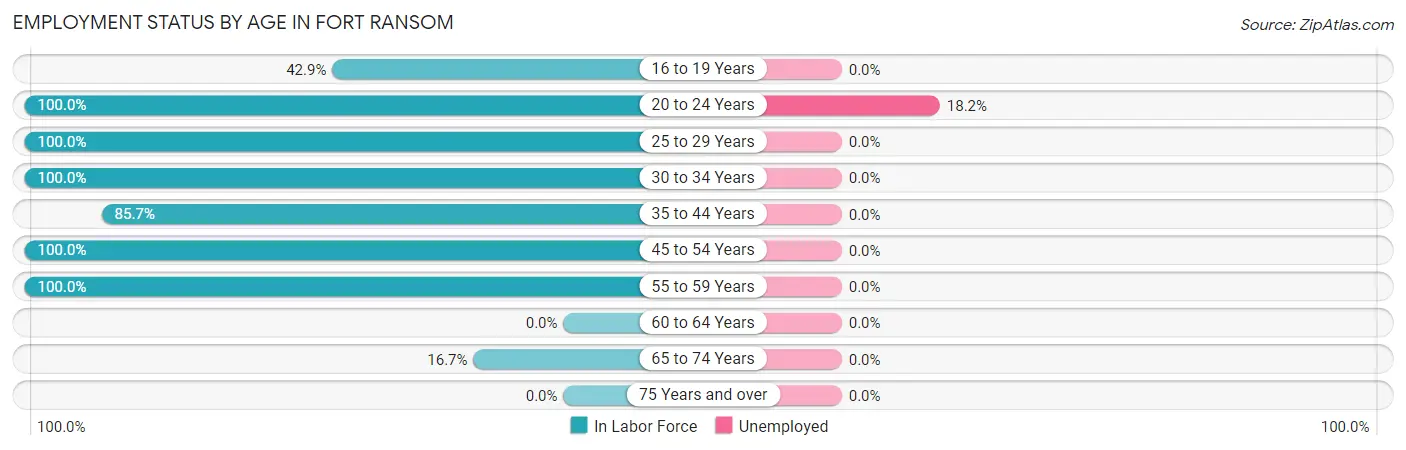
| Age Bracket | In Labor Force | Unemployed |
| 16 to 19 Years | 3 (42.9%) | 0 (0.0%) |
| 20 to 24 Years | 11 (100.0%) | 2 (18.2%) |
| 25 to 29 Years | 4 (100.0%) | 0 (0.0%) |
| 30 to 34 Years | 7 (100.0%) | 0 (0.0%) |
| 35 to 44 Years | 12 (85.7%) | 0 (0.0%) |
| 45 to 54 Years | 4 (100.0%) | 0 (0.0%) |
| 55 to 59 Years | 5 (100.0%) | 0 (0.0%) |
| 60 to 64 Years | 0 (0.0%) | 0 (0.0%) |
| 65 to 74 Years | 3 (16.7%) | 0 (0.0%) |
| 75 Years and over | 0 (0.0%) | 0 (0.0%) |
| Total | 49 (59.8%) | 2 (4.1%) |
Employment Status by Educational Attainment in Fort Ransom
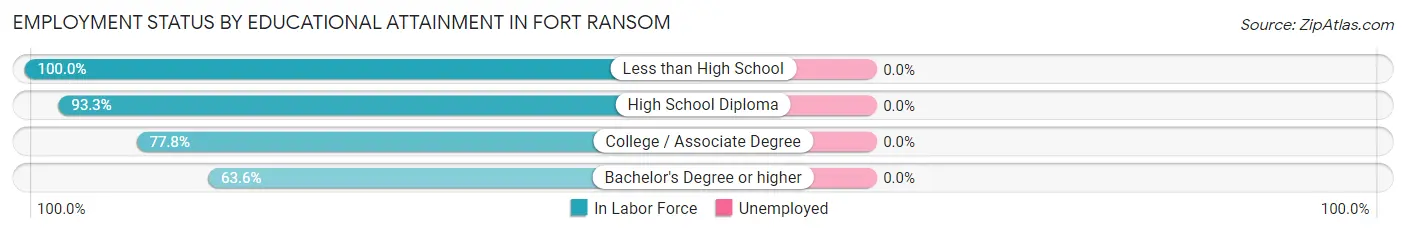
| Educational Attainment | In Labor Force | Unemployed |
| Less than High School | 4 (100.0%) | 0 (0.0%) |
| High School Diploma | 14 (93.3%) | 0 (0.0%) |
| College / Associate Degree | 7 (77.8%) | 0 (0.0%) |
| Bachelor's Degree or higher | 7 (63.6%) | 0 (0.0%) |
| Total | 32 (82.1%) | 0 (0.0%) |
Employment Occupations by Sex in Fort Ransom
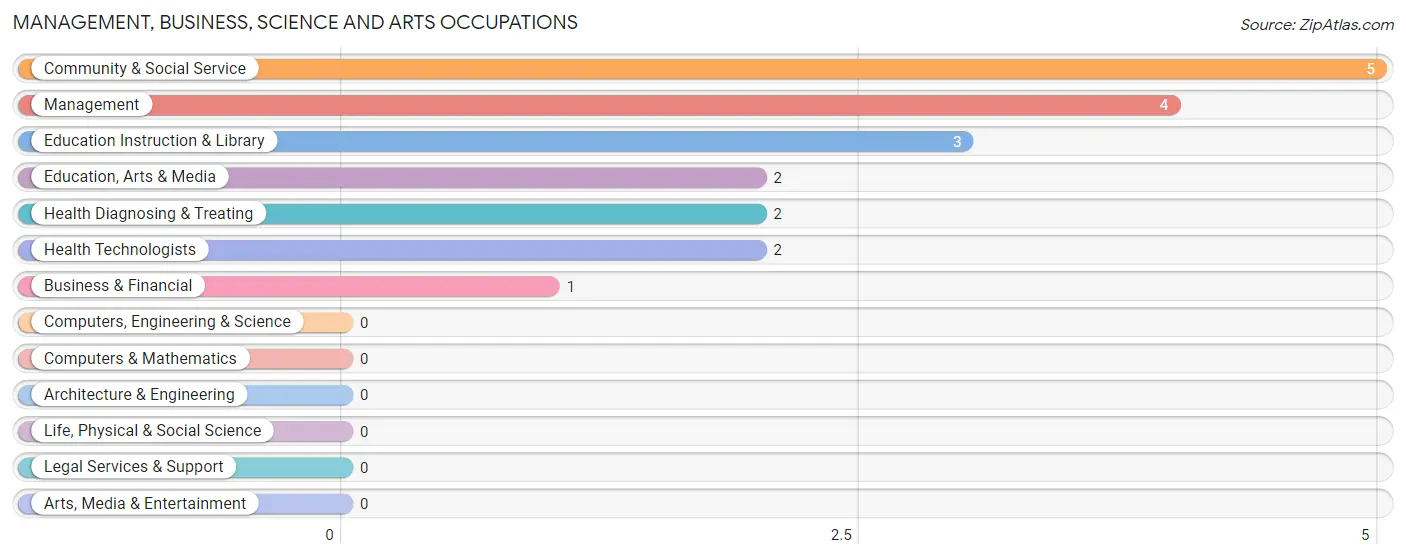
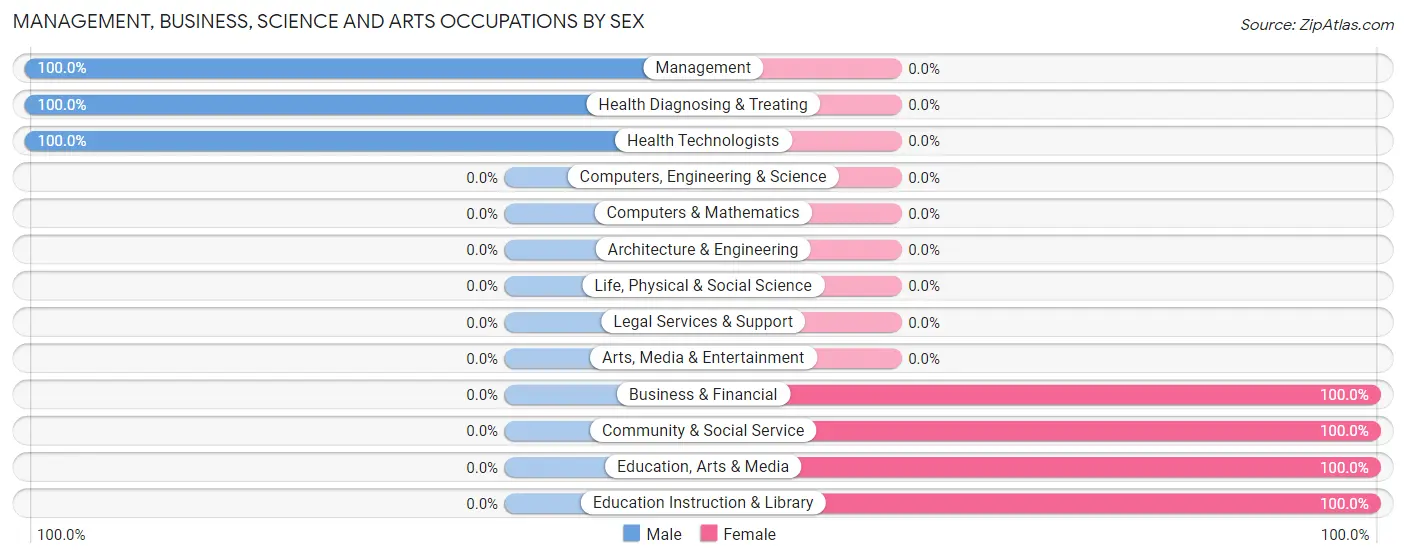
Management, Business, Science and Arts Occupations
The most common Management, Business, Science and Arts occupations in Fort Ransom are Community & Social Service (5 | 10.6%), Management (4 | 8.5%), Education Instruction & Library (3 | 6.4%), Education, Arts & Media (2 | 4.3%), and Health Diagnosing & Treating (2 | 4.3%).
Management, Business, Science and Arts Occupations by Sex
Within the Management, Business, Science and Arts occupations in Fort Ransom, the most male-oriented occupations are Management (100.0%), Health Diagnosing & Treating (100.0%), and Health Technologists (100.0%), while the most female-oriented occupations are Business & Financial (100.0%), Community & Social Service (100.0%), and Education, Arts & Media (100.0%).
| Occupation | Male | Female |
| Management | 4 (100.0%) | 0 (0.0%) |
| Business & Financial | 0 (0.0%) | 1 (100.0%) |
| Computers, Engineering & Science | 0 (0.0%) | 0 (0.0%) |
| Computers & Mathematics | 0 (0.0%) | 0 (0.0%) |
| Architecture & Engineering | 0 (0.0%) | 0 (0.0%) |
| Life, Physical & Social Science | 0 (0.0%) | 0 (0.0%) |
| Community & Social Service | 0 (0.0%) | 5 (100.0%) |
| Education, Arts & Media | 0 (0.0%) | 2 (100.0%) |
| Legal Services & Support | 0 (0.0%) | 0 (0.0%) |
| Education Instruction & Library | 0 (0.0%) | 3 (100.0%) |
| Arts, Media & Entertainment | 0 (0.0%) | 0 (0.0%) |
| Health Diagnosing & Treating | 2 (100.0%) | 0 (0.0%) |
| Health Technologists | 2 (100.0%) | 0 (0.0%) |
| Total (Category) | 6 (50.0%) | 6 (50.0%) |
| Total (Overall) | 27 (57.5%) | 20 (42.5%) |
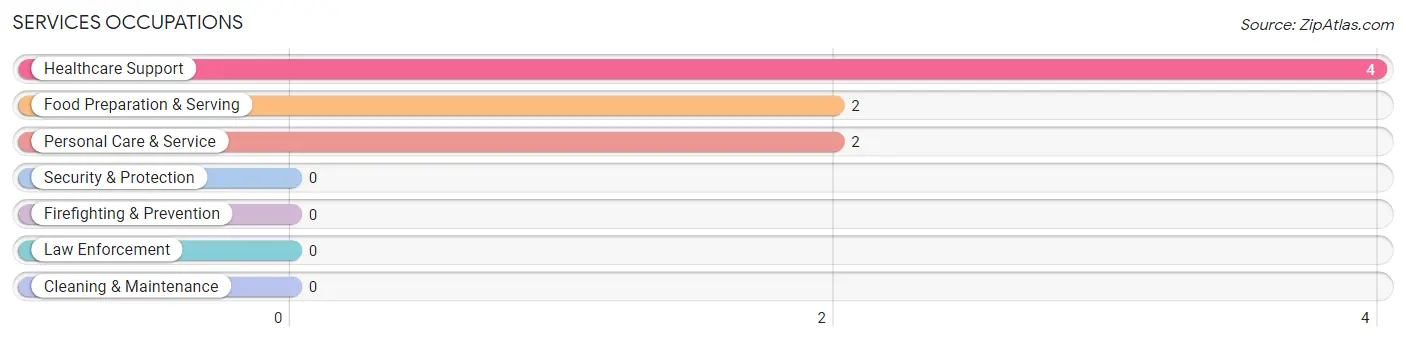
Services Occupations
The most common Services occupations in Fort Ransom are Healthcare Support (4 | 8.5%), Food Preparation & Serving (2 | 4.3%), and Personal Care & Service (2 | 4.3%).
Services Occupations by Sex
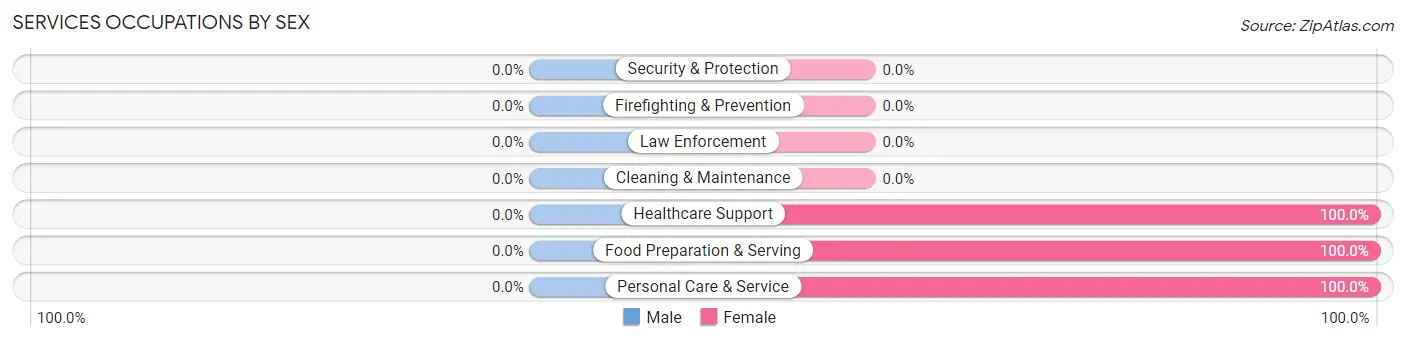
| Occupation | Male | Female |
| Healthcare Support | 0 (0.0%) | 4 (100.0%) |
| Security & Protection | 0 (0.0%) | 0 (0.0%) |
| Firefighting & Prevention | 0 (0.0%) | 0 (0.0%) |
| Law Enforcement | 0 (0.0%) | 0 (0.0%) |
| Food Preparation & Serving | 0 (0.0%) | 2 (100.0%) |
| Cleaning & Maintenance | 0 (0.0%) | 0 (0.0%) |
| Personal Care & Service | 0 (0.0%) | 2 (100.0%) |
| Total (Category) | 0 (0.0%) | 8 (100.0%) |
| Total (Overall) | 27 (57.5%) | 20 (42.5%) |
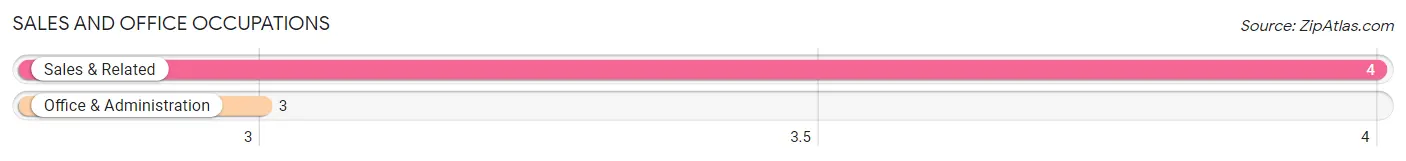
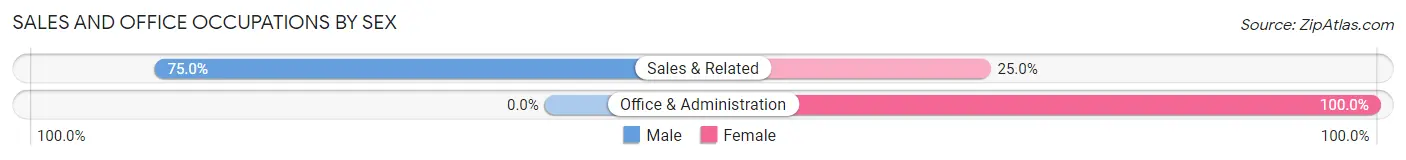
Sales and Office Occupations
The most common Sales and Office occupations in Fort Ransom are Sales & Related (4 | 8.5%), and Office & Administration (3 | 6.4%).
Sales and Office Occupations by Sex
| Occupation | Male | Female |
| Sales & Related | 3 (75.0%) | 1 (25.0%) |
| Office & Administration | 0 (0.0%) | 3 (100.0%) |
| Total (Category) | 3 (42.9%) | 4 (57.1%) |
| Total (Overall) | 27 (57.5%) | 20 (42.5%) |
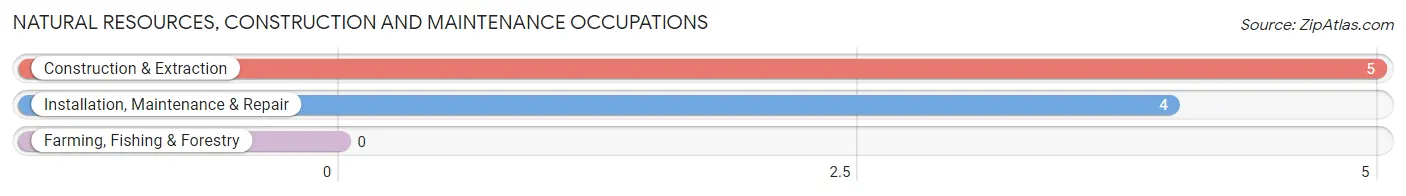
Natural Resources, Construction and Maintenance Occupations
The most common Natural Resources, Construction and Maintenance occupations in Fort Ransom are Construction & Extraction (5 | 10.6%), and Installation, Maintenance & Repair (4 | 8.5%).
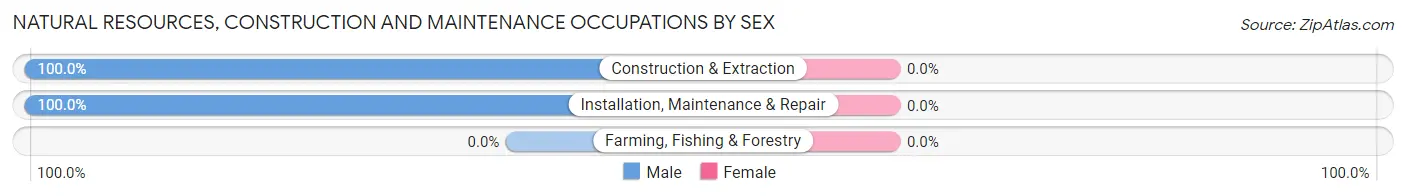
Natural Resources, Construction and Maintenance Occupations by Sex
| Occupation | Male | Female |
| Farming, Fishing & Forestry | 0 (0.0%) | 0 (0.0%) |
| Construction & Extraction | 5 (100.0%) | 0 (0.0%) |
| Installation, Maintenance & Repair | 4 (100.0%) | 0 (0.0%) |
| Total (Category) | 9 (100.0%) | 0 (0.0%) |
| Total (Overall) | 27 (57.5%) | 20 (42.5%) |
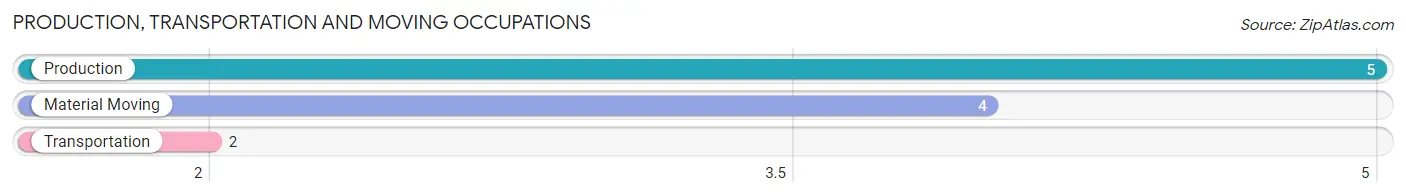
Production, Transportation and Moving Occupations
The most common Production, Transportation and Moving occupations in Fort Ransom are Production (5 | 10.6%), Material Moving (4 | 8.5%), and Transportation (2 | 4.3%).
Production, Transportation and Moving Occupations by Sex
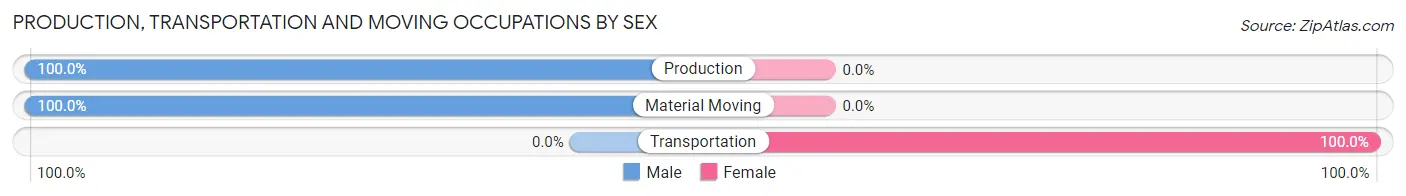
| Occupation | Male | Female |
| Production | 5 (100.0%) | 0 (0.0%) |
| Transportation | 0 (0.0%) | 2 (100.0%) |
| Material Moving | 4 (100.0%) | 0 (0.0%) |
| Total (Category) | 9 (81.8%) | 2 (18.2%) |
| Total (Overall) | 27 (57.5%) | 20 (42.5%) |
Employment Industries by Sex in Fort Ransom
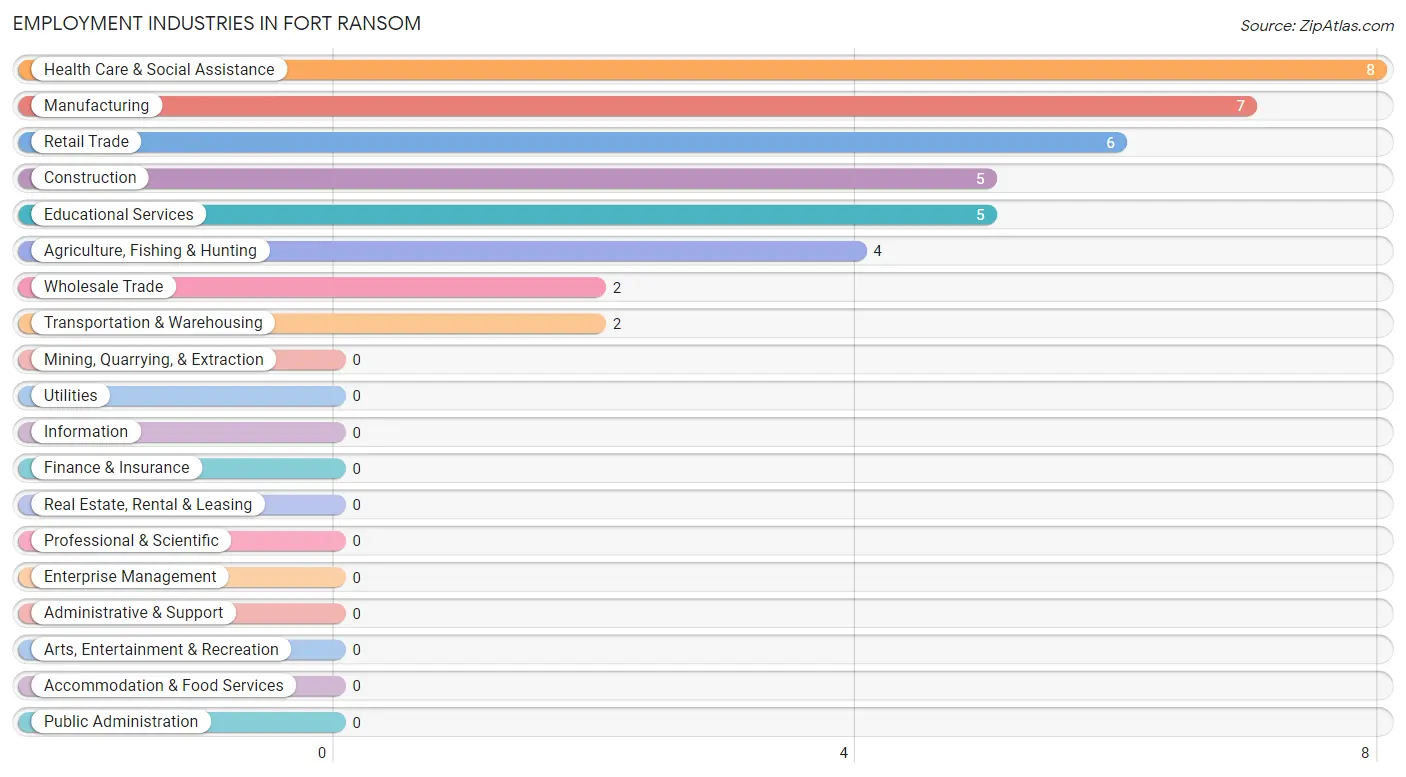
Employment Industries in Fort Ransom
The major employment industries in Fort Ransom include Health Care & Social Assistance (8 | 17.0%), Manufacturing (7 | 14.9%), Retail Trade (6 | 12.8%), Construction (5 | 10.6%), and Educational Services (5 | 10.6%).
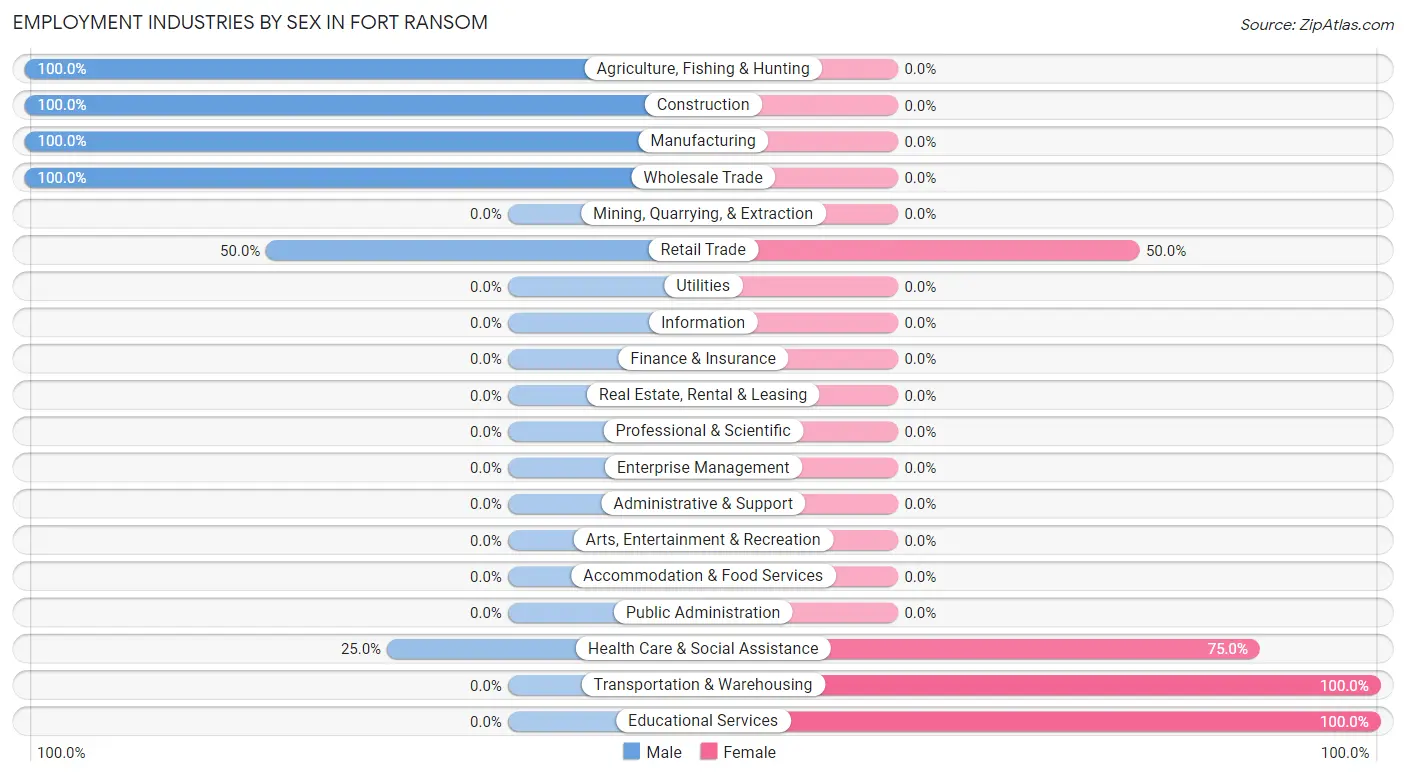
Employment Industries by Sex in Fort Ransom
The Fort Ransom industries that see more men than women are Agriculture, Fishing & Hunting (100.0%), Construction (100.0%), and Manufacturing (100.0%), whereas the industries that tend to have a higher number of women are Transportation & Warehousing (100.0%), Educational Services (100.0%), and Health Care & Social Assistance (75.0%).
| Industry | Male | Female |
| Agriculture, Fishing & Hunting | 4 (100.0%) | 0 (0.0%) |
| Mining, Quarrying, & Extraction | 0 (0.0%) | 0 (0.0%) |
| Construction | 5 (100.0%) | 0 (0.0%) |
| Manufacturing | 7 (100.0%) | 0 (0.0%) |
| Wholesale Trade | 2 (100.0%) | 0 (0.0%) |
| Retail Trade | 3 (50.0%) | 3 (50.0%) |
| Transportation & Warehousing | 0 (0.0%) | 2 (100.0%) |
| Utilities | 0 (0.0%) | 0 (0.0%) |
| Information | 0 (0.0%) | 0 (0.0%) |
| Finance & Insurance | 0 (0.0%) | 0 (0.0%) |
| Real Estate, Rental & Leasing | 0 (0.0%) | 0 (0.0%) |
| Professional & Scientific | 0 (0.0%) | 0 (0.0%) |
| Enterprise Management | 0 (0.0%) | 0 (0.0%) |
| Administrative & Support | 0 (0.0%) | 0 (0.0%) |
| Educational Services | 0 (0.0%) | 5 (100.0%) |
| Health Care & Social Assistance | 2 (25.0%) | 6 (75.0%) |
| Arts, Entertainment & Recreation | 0 (0.0%) | 0 (0.0%) |
| Accommodation & Food Services | 0 (0.0%) | 0 (0.0%) |
| Public Administration | 0 (0.0%) | 0 (0.0%) |
| Total | 27 (57.5%) | 20 (42.5%) |
Education in Fort Ransom
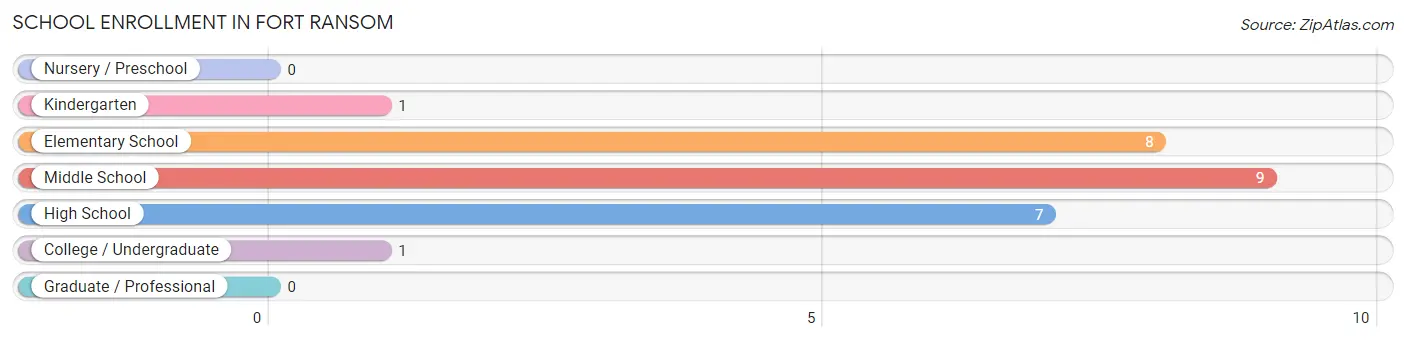
School Enrollment in Fort Ransom
The most common levels of schooling among the 26 students in Fort Ransom are middle school (9 | 34.6%), elementary school (8 | 30.8%), and high school (7 | 26.9%).
| School Level | # Students | % Students |
| Nursery / Preschool | 0 | 0.0% |
| Kindergarten | 1 | 3.8% |
| Elementary School | 8 | 30.8% |
| Middle School | 9 | 34.6% |
| High School | 7 | 26.9% |
| College / Undergraduate | 1 | 3.8% |
| Graduate / Professional | 0 | 0.0% |
| Total | 26 | 100.0% |
School Enrollment by Age by Funding Source in Fort Ransom
Out of a total of 26 students who are enrolled in schools in Fort Ransom, 9 (34.6%) attend a private institution, while the remaining 17 (65.4%) are enrolled in public schools. The age group of 15 to 17 year olds has the highest likelihood of being enrolled in private schools, with 3 (100.0% in the age bracket) enrolled. Conversely, the age group of 5 to 9 year old has the lowest likelihood of being enrolled in a private school, with 5 (100.0% in the age bracket) attending a public institution.
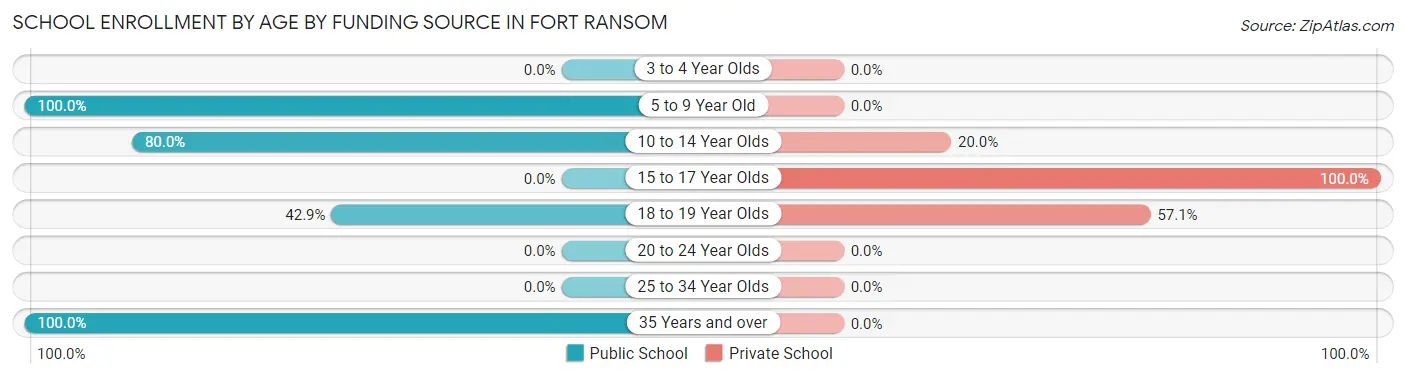
| Age Bracket | Public School | Private School |
| 3 to 4 Year Olds | 0 (0.0%) | 0 (0.0%) |
| 5 to 9 Year Old | 5 (100.0%) | 0 (0.0%) |
| 10 to 14 Year Olds | 8 (80.0%) | 2 (20.0%) |
| 15 to 17 Year Olds | 0 (0.0%) | 3 (100.0%) |
| 18 to 19 Year Olds | 3 (42.9%) | 4 (57.1%) |
| 20 to 24 Year Olds | 0 (0.0%) | 0 (0.0%) |
| 25 to 34 Year Olds | 0 (0.0%) | 0 (0.0%) |
| 35 Years and over | 1 (100.0%) | 0 (0.0%) |
| Total | 17 (65.4%) | 9 (34.6%) |
Educational Attainment by Field of Study in Fort Ransom
Education (5 | 35.7%), psychology (4 | 28.6%), arts & humanities (4 | 28.6%), and business (1 | 7.1%) are the most common fields of study among 14 individuals in Fort Ransom who have obtained a bachelor's degree or higher.
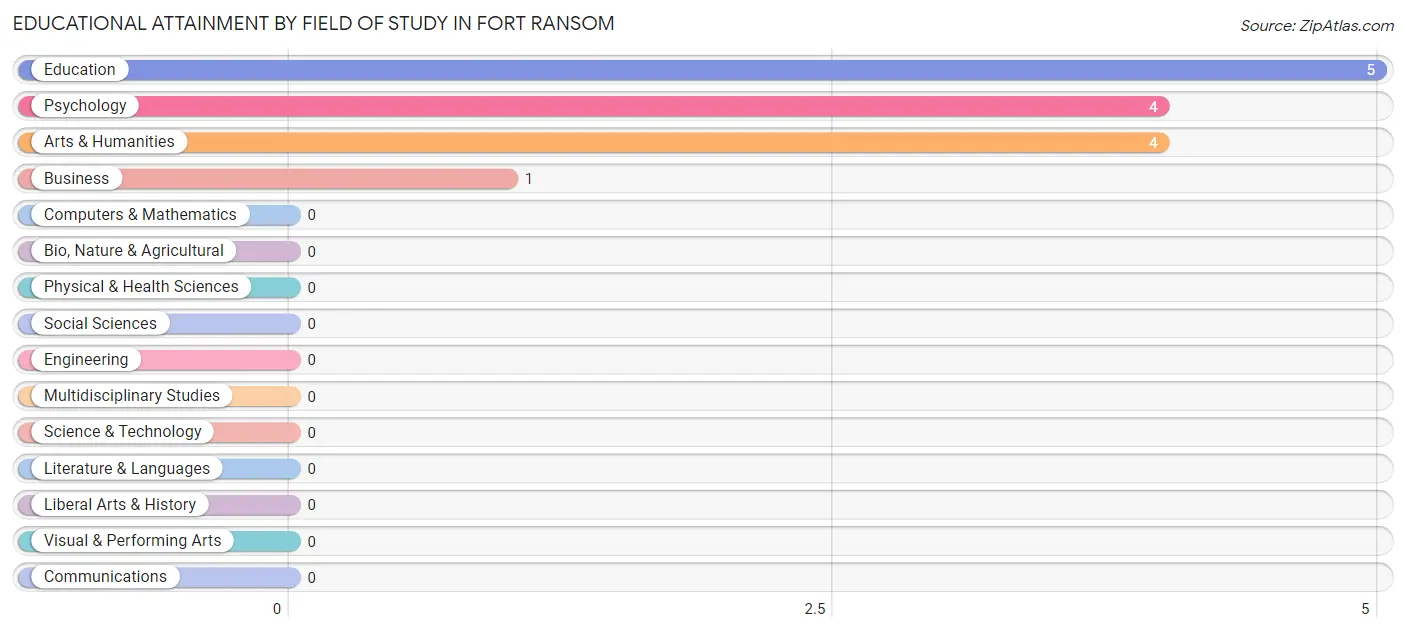
| Field of Study | # Graduates | % Graduates |
| Computers & Mathematics | 0 | 0.0% |
| Bio, Nature & Agricultural | 0 | 0.0% |
| Physical & Health Sciences | 0 | 0.0% |
| Psychology | 4 | 28.6% |
| Social Sciences | 0 | 0.0% |
| Engineering | 0 | 0.0% |
| Multidisciplinary Studies | 0 | 0.0% |
| Science & Technology | 0 | 0.0% |
| Business | 1 | 7.1% |
| Education | 5 | 35.7% |
| Literature & Languages | 0 | 0.0% |
| Liberal Arts & History | 0 | 0.0% |
| Visual & Performing Arts | 0 | 0.0% |
| Communications | 0 | 0.0% |
| Arts & Humanities | 4 | 28.6% |
| Total | 14 | 100.0% |
Transportation & Commute in Fort Ransom
Vehicle Availability by Sex in Fort Ransom
The most prevalent vehicle ownership categories in Fort Ransom are males with 2 vehicles (11, accounting for 40.7%) and females with 2 vehicles (10, making up 55.0%).
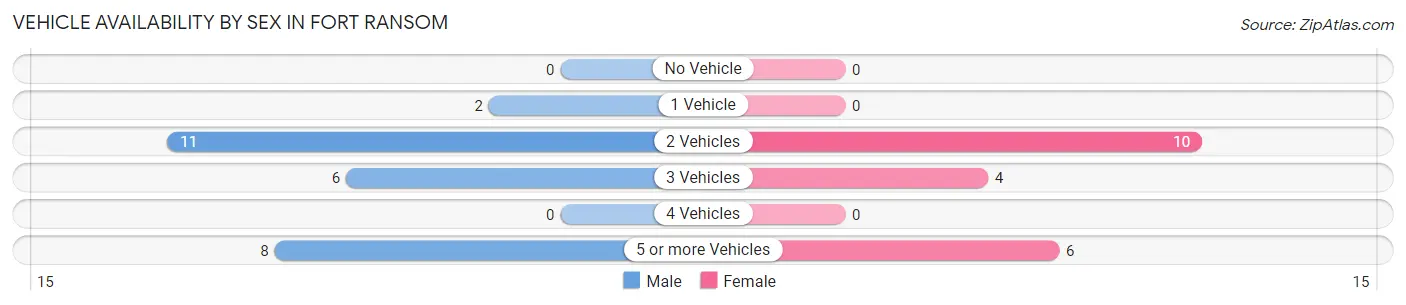
| Vehicles Available | Male | Female |
| No Vehicle | 0 (0.0%) | 0 (0.0%) |
| 1 Vehicle | 2 (7.4%) | 0 (0.0%) |
| 2 Vehicles | 11 (40.7%) | 10 (50.0%) |
| 3 Vehicles | 6 (22.2%) | 4 (20.0%) |
| 4 Vehicles | 0 (0.0%) | 0 (0.0%) |
| 5 or more Vehicles | 8 (29.6%) | 6 (30.0%) |
| Total | 27 (100.0%) | 20 (100.0%) |
Commute Time in Fort Ransom
The most frequently occuring commute durations in Fort Ransom are 20 to 24 minutes (12 commuters, 26.1%), 10 to 14 minutes (6 commuters, 13.0%), and 45 to 59 minutes (6 commuters, 13.0%).
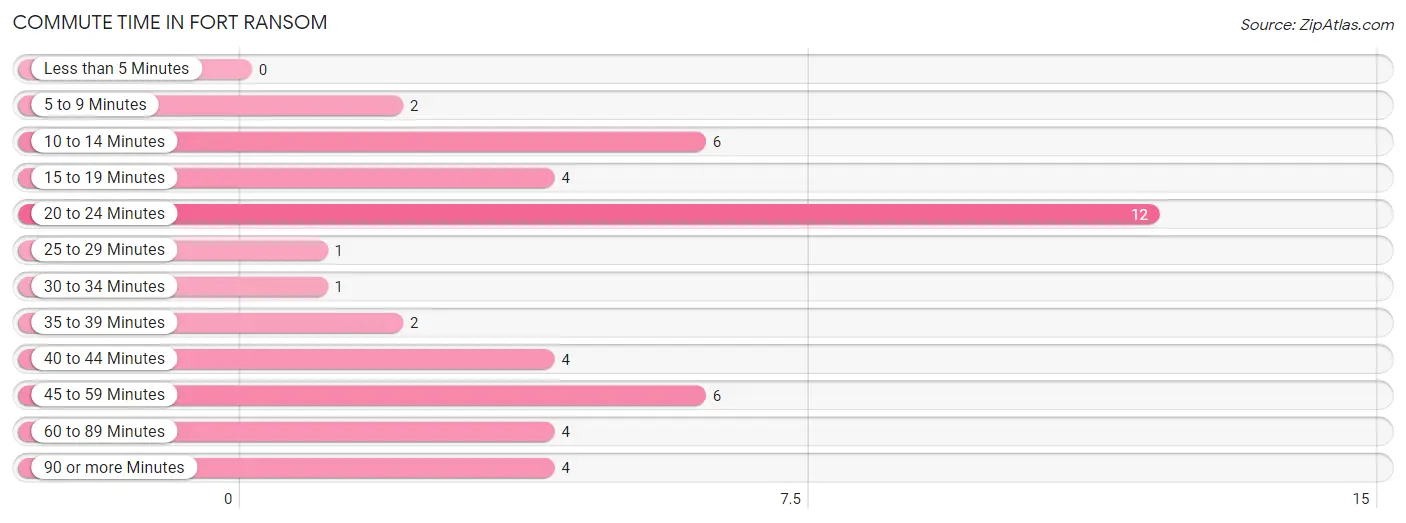
| Commute Time | # Commuters | % Commuters |
| Less than 5 Minutes | 0 | 0.0% |
| 5 to 9 Minutes | 2 | 4.3% |
| 10 to 14 Minutes | 6 | 13.0% |
| 15 to 19 Minutes | 4 | 8.7% |
| 20 to 24 Minutes | 12 | 26.1% |
| 25 to 29 Minutes | 1 | 2.2% |
| 30 to 34 Minutes | 1 | 2.2% |
| 35 to 39 Minutes | 2 | 4.3% |
| 40 to 44 Minutes | 4 | 8.7% |
| 45 to 59 Minutes | 6 | 13.0% |
| 60 to 89 Minutes | 4 | 8.7% |
| 90 or more Minutes | 4 | 8.7% |
Commute Time by Sex in Fort Ransom
The most common commute times in Fort Ransom are 10 to 14 minutes (5 commuters, 18.5%) for males and 20 to 24 minutes (9 commuters, 47.4%) for females.
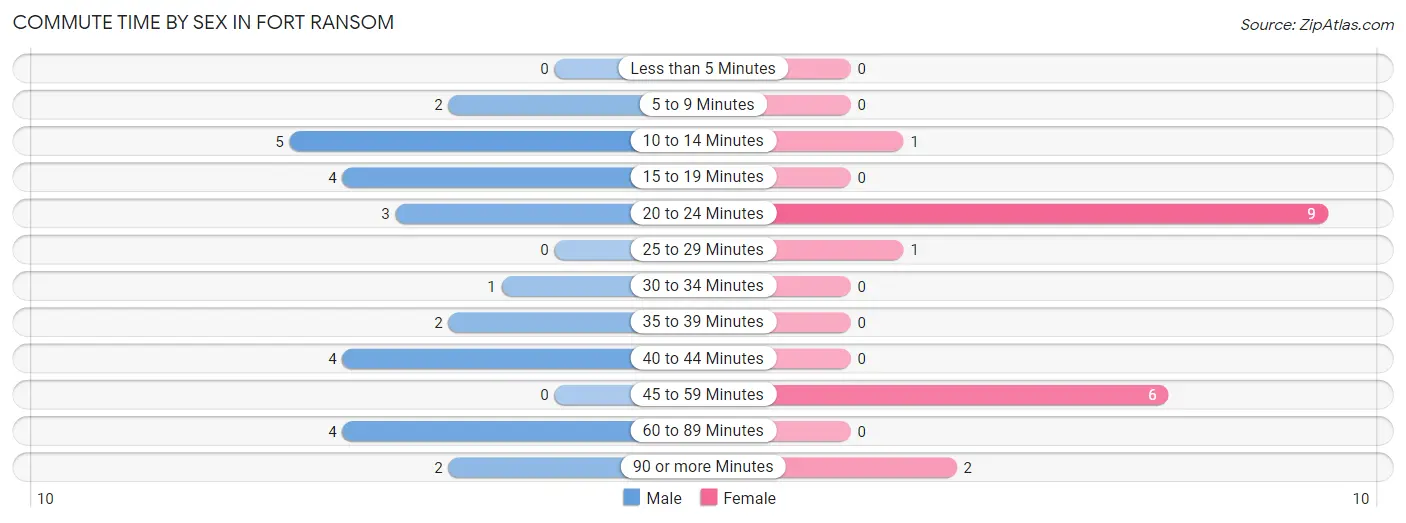
| Commute Time | Male | Female |
| Less than 5 Minutes | 0 (0.0%) | 0 (0.0%) |
| 5 to 9 Minutes | 2 (7.4%) | 0 (0.0%) |
| 10 to 14 Minutes | 5 (18.5%) | 1 (5.3%) |
| 15 to 19 Minutes | 4 (14.8%) | 0 (0.0%) |
| 20 to 24 Minutes | 3 (11.1%) | 9 (47.4%) |
| 25 to 29 Minutes | 0 (0.0%) | 1 (5.3%) |
| 30 to 34 Minutes | 1 (3.7%) | 0 (0.0%) |
| 35 to 39 Minutes | 2 (7.4%) | 0 (0.0%) |
| 40 to 44 Minutes | 4 (14.8%) | 0 (0.0%) |
| 45 to 59 Minutes | 0 (0.0%) | 6 (31.6%) |
| 60 to 89 Minutes | 4 (14.8%) | 0 (0.0%) |
| 90 or more Minutes | 2 (7.4%) | 2 (10.5%) |
Time of Departure to Work by Sex in Fort Ransom
The most frequent times of departure to work in Fort Ransom are 12:00 PM to 3:59 PM (7, 25.9%) for males and 6:30 AM to 6:59 AM (7, 36.8%) for females.
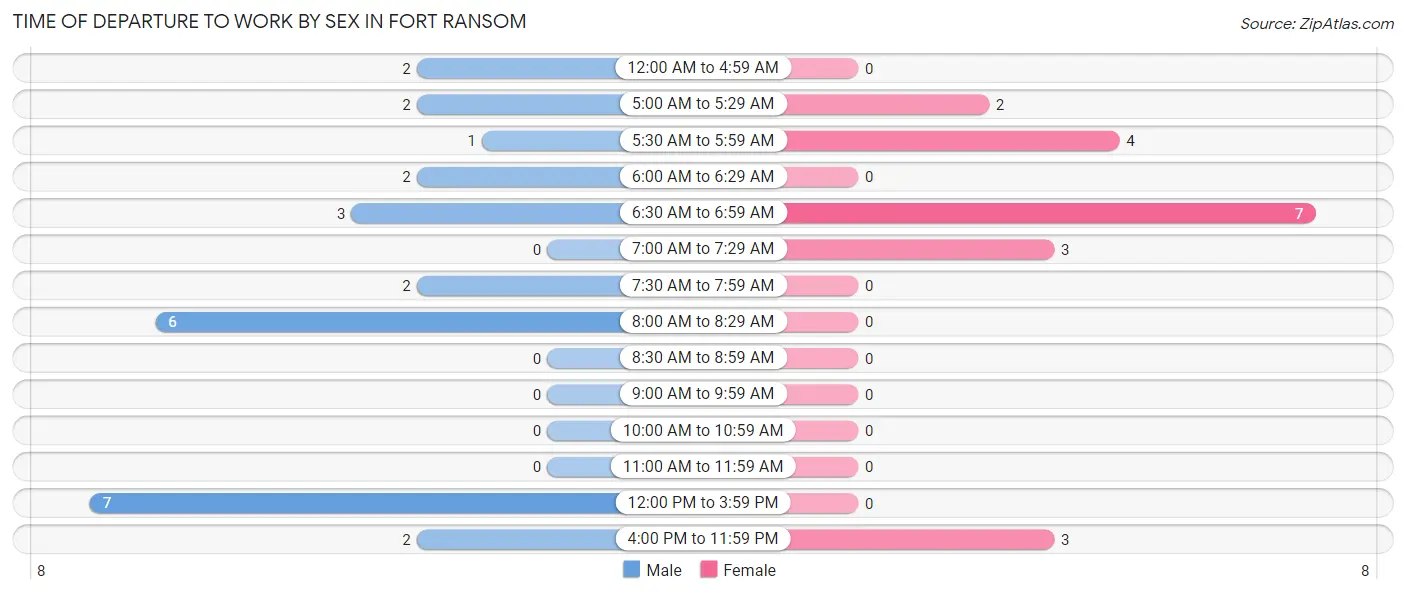
| Time of Departure | Male | Female |
| 12:00 AM to 4:59 AM | 2 (7.4%) | 0 (0.0%) |
| 5:00 AM to 5:29 AM | 2 (7.4%) | 2 (10.5%) |
| 5:30 AM to 5:59 AM | 1 (3.7%) | 4 (21.0%) |
| 6:00 AM to 6:29 AM | 2 (7.4%) | 0 (0.0%) |
| 6:30 AM to 6:59 AM | 3 (11.1%) | 7 (36.8%) |
| 7:00 AM to 7:29 AM | 0 (0.0%) | 3 (15.8%) |
| 7:30 AM to 7:59 AM | 2 (7.4%) | 0 (0.0%) |
| 8:00 AM to 8:29 AM | 6 (22.2%) | 0 (0.0%) |
| 8:30 AM to 8:59 AM | 0 (0.0%) | 0 (0.0%) |
| 9:00 AM to 9:59 AM | 0 (0.0%) | 0 (0.0%) |
| 10:00 AM to 10:59 AM | 0 (0.0%) | 0 (0.0%) |
| 11:00 AM to 11:59 AM | 0 (0.0%) | 0 (0.0%) |
| 12:00 PM to 3:59 PM | 7 (25.9%) | 0 (0.0%) |
| 4:00 PM to 11:59 PM | 2 (7.4%) | 3 (15.8%) |
| Total | 27 (100.0%) | 19 (100.0%) |
Housing Occupancy in Fort Ransom
Occupancy by Ownership in Fort Ransom
Of the total 42 dwellings in Fort Ransom, owner-occupied units account for 32 (76.2%), while renter-occupied units make up 10 (23.8%).
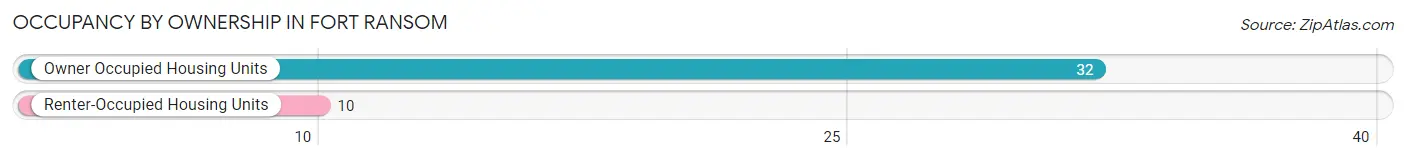
| Occupancy | # Housing Units | % Housing Units |
| Owner Occupied Housing Units | 32 | 76.2% |
| Renter-Occupied Housing Units | 10 | 23.8% |
| Total Occupied Housing Units | 42 | 100.0% |
Occupancy by Household Size in Fort Ransom
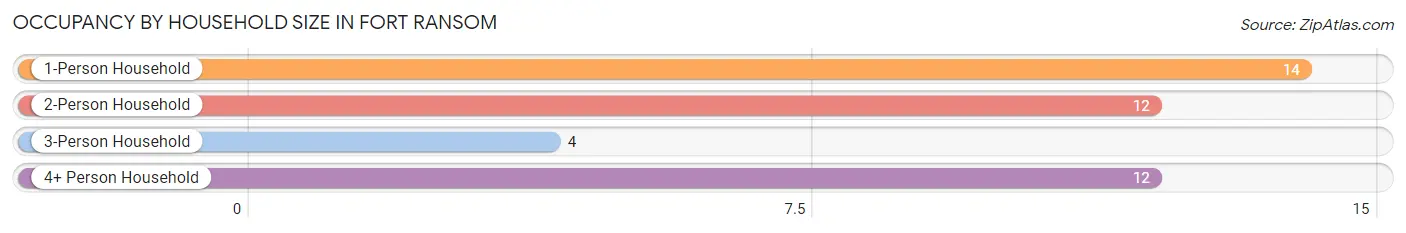
| Household Size | # Housing Units | % Housing Units |
| 1-Person Household | 14 | 33.3% |
| 2-Person Household | 12 | 28.6% |
| 3-Person Household | 4 | 9.5% |
| 4+ Person Household | 12 | 28.6% |
| Total Housing Units | 42 | 100.0% |
Occupancy by Ownership by Household Size in Fort Ransom
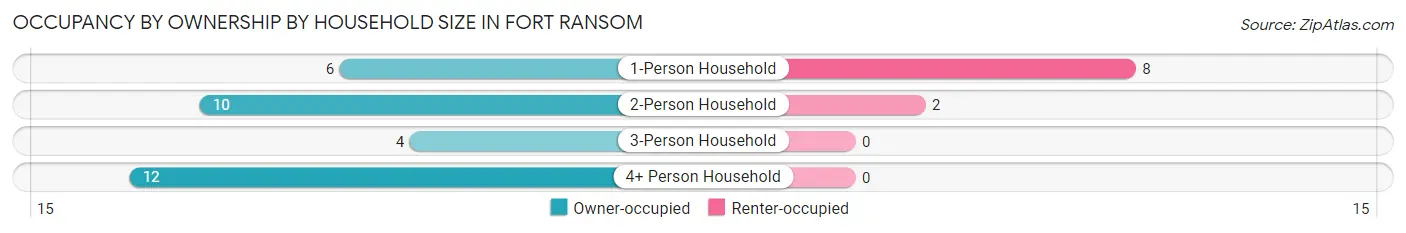
| Household Size | Owner-occupied | Renter-occupied |
| 1-Person Household | 6 (42.9%) | 8 (57.1%) |
| 2-Person Household | 10 (83.3%) | 2 (16.7%) |
| 3-Person Household | 4 (100.0%) | 0 (0.0%) |
| 4+ Person Household | 12 (100.0%) | 0 (0.0%) |
| Total Housing Units | 32 (76.2%) | 10 (23.8%) |
Occupancy by Educational Attainment in Fort Ransom
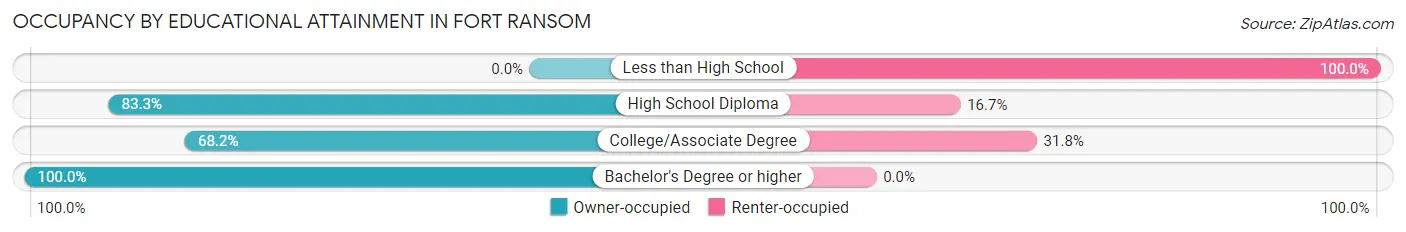
| Household Size | Owner-occupied | Renter-occupied |
| Less than High School | 0 (0.0%) | 1 (100.0%) |
| High School Diploma | 10 (83.3%) | 2 (16.7%) |
| College/Associate Degree | 15 (68.2%) | 7 (31.8%) |
| Bachelor's Degree or higher | 7 (100.0%) | 0 (0.0%) |
Occupancy by Age of Householder in Fort Ransom
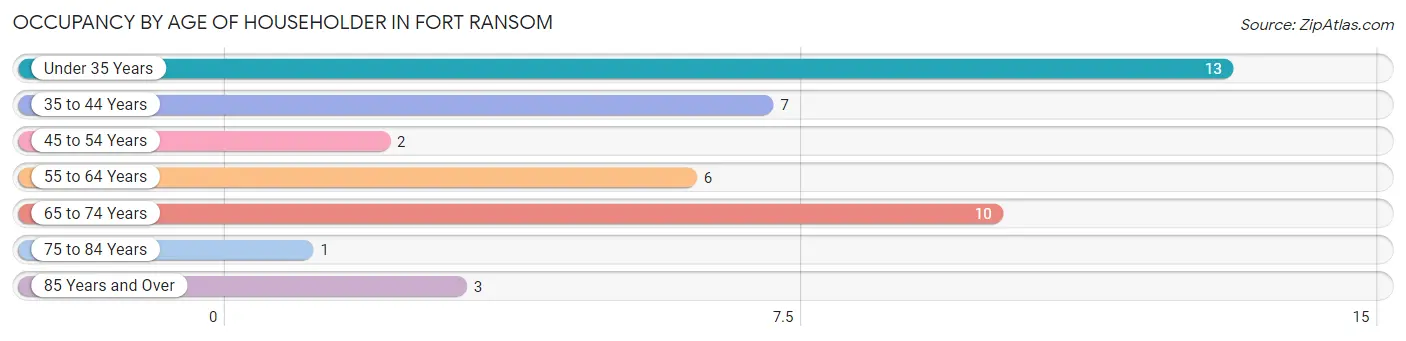
| Age Bracket | # Households | % Households |
| Under 35 Years | 13 | 30.9% |
| 35 to 44 Years | 7 | 16.7% |
| 45 to 54 Years | 2 | 4.8% |
| 55 to 64 Years | 6 | 14.3% |
| 65 to 74 Years | 10 | 23.8% |
| 75 to 84 Years | 1 | 2.4% |
| 85 Years and Over | 3 | 7.1% |
| Total | 42 | 100.0% |
Housing Finances in Fort Ransom
Median Income by Occupancy in Fort Ransom
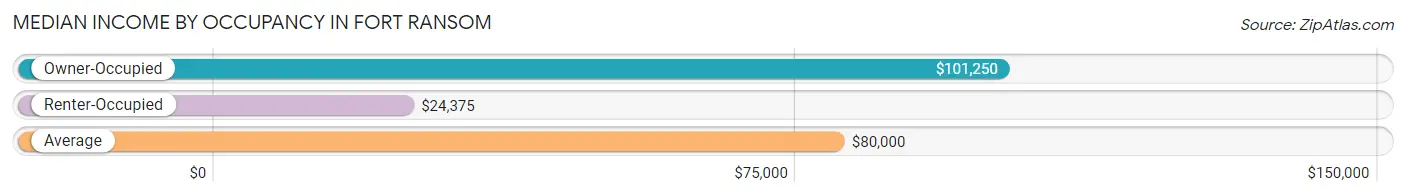
| Occupancy Type | # Households | Median Income |
| Owner-Occupied | 32 (76.2%) | $101,250 |
| Renter-Occupied | 10 (23.8%) | $24,375 |
| Average | 42 (100.0%) | $80,000 |
Occupancy by Householder Income Bracket in Fort Ransom
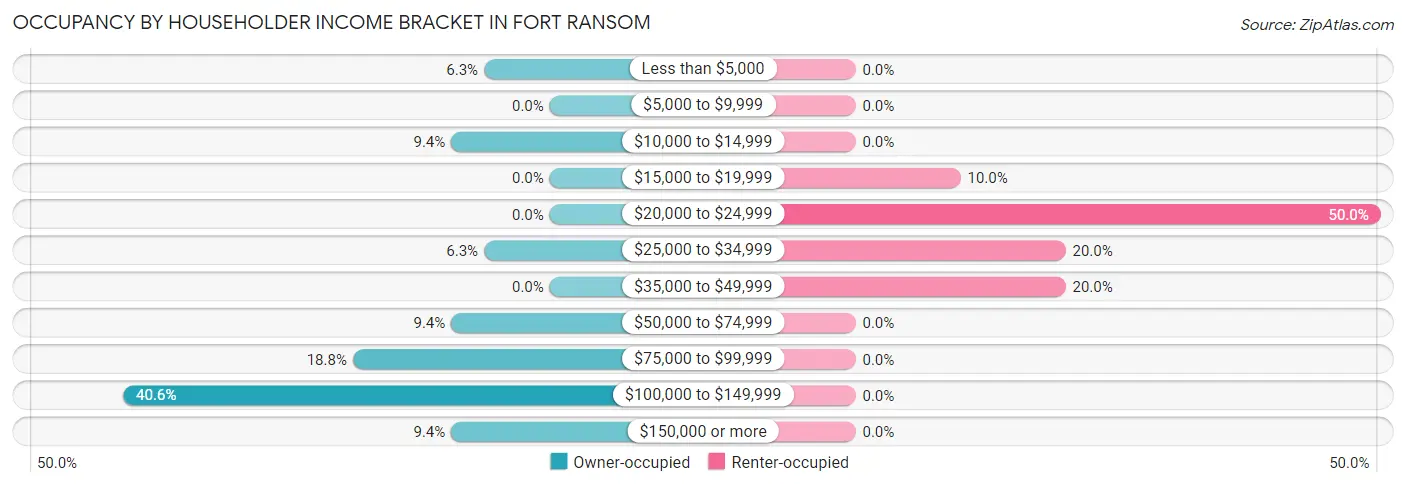
| Income Bracket | Owner-occupied | Renter-occupied |
| Less than $5,000 | 2 (6.2%) | 0 (0.0%) |
| $5,000 to $9,999 | 0 (0.0%) | 0 (0.0%) |
| $10,000 to $14,999 | 3 (9.4%) | 0 (0.0%) |
| $15,000 to $19,999 | 0 (0.0%) | 1 (10.0%) |
| $20,000 to $24,999 | 0 (0.0%) | 5 (50.0%) |
| $25,000 to $34,999 | 2 (6.2%) | 2 (20.0%) |
| $35,000 to $49,999 | 0 (0.0%) | 2 (20.0%) |
| $50,000 to $74,999 | 3 (9.4%) | 0 (0.0%) |
| $75,000 to $99,999 | 6 (18.8%) | 0 (0.0%) |
| $100,000 to $149,999 | 13 (40.6%) | 0 (0.0%) |
| $150,000 or more | 3 (9.4%) | 0 (0.0%) |
| Total | 32 (100.0%) | 10 (100.0%) |
Monthly Housing Cost Tiers in Fort Ransom
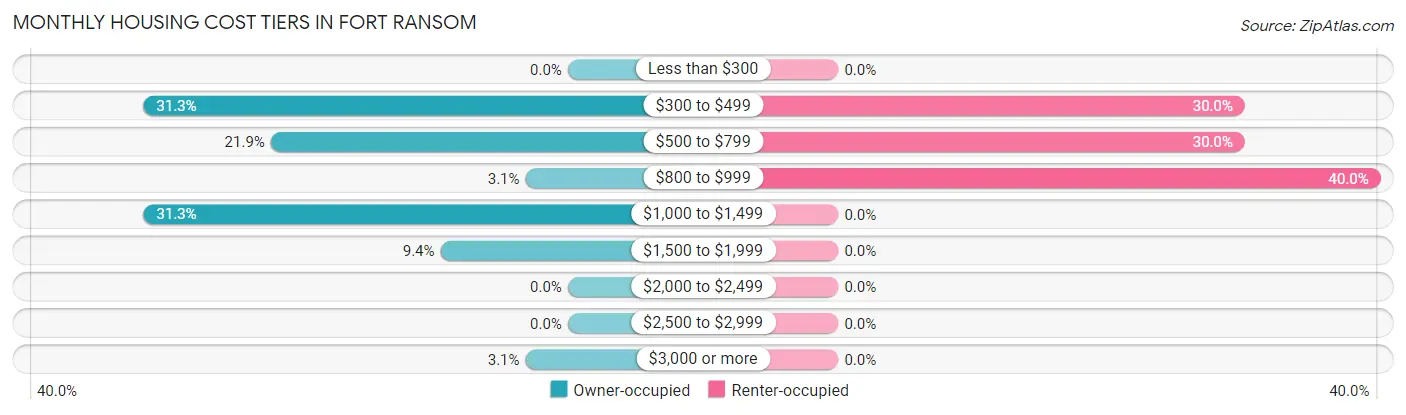
| Monthly Cost | Owner-occupied | Renter-occupied |
| Less than $300 | 0 (0.0%) | 0 (0.0%) |
| $300 to $499 | 10 (31.2%) | 3 (30.0%) |
| $500 to $799 | 7 (21.9%) | 3 (30.0%) |
| $800 to $999 | 1 (3.1%) | 4 (40.0%) |
| $1,000 to $1,499 | 10 (31.2%) | 0 (0.0%) |
| $1,500 to $1,999 | 3 (9.4%) | 0 (0.0%) |
| $2,000 to $2,499 | 0 (0.0%) | 0 (0.0%) |
| $2,500 to $2,999 | 0 (0.0%) | 0 (0.0%) |
| $3,000 or more | 1 (3.1%) | 0 (0.0%) |
| Total | 32 (100.0%) | 10 (100.0%) |
Physical Housing Characteristics in Fort Ransom
Housing Structures in Fort Ransom
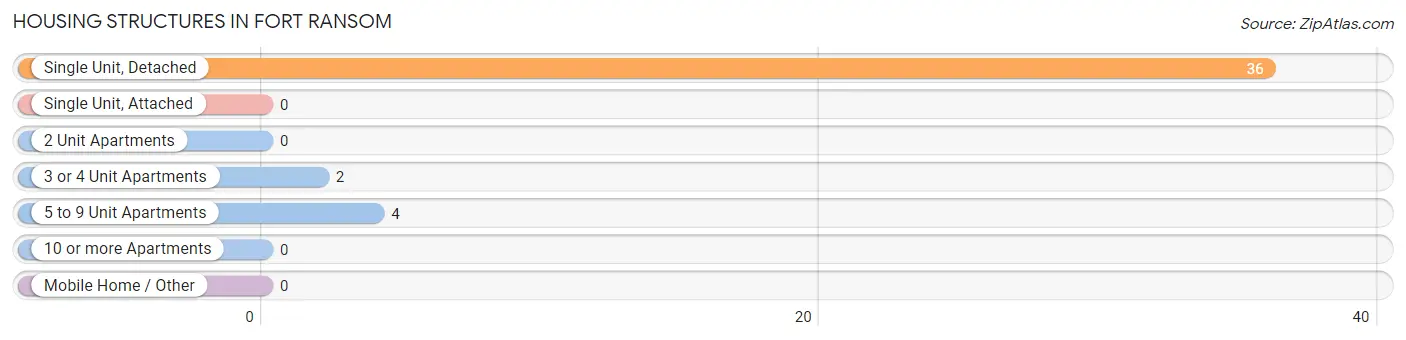
| Structure Type | # Housing Units | % Housing Units |
| Single Unit, Detached | 36 | 85.7% |
| Single Unit, Attached | 0 | 0.0% |
| 2 Unit Apartments | 0 | 0.0% |
| 3 or 4 Unit Apartments | 2 | 4.8% |
| 5 to 9 Unit Apartments | 4 | 9.5% |
| 10 or more Apartments | 0 | 0.0% |
| Mobile Home / Other | 0 | 0.0% |
| Total | 42 | 100.0% |
Housing Structures by Occupancy in Fort Ransom
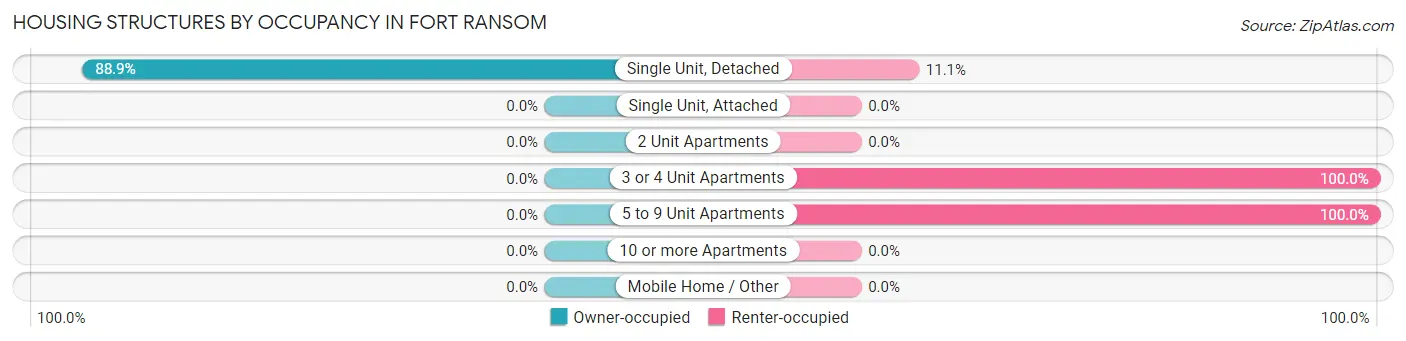
| Structure Type | Owner-occupied | Renter-occupied |
| Single Unit, Detached | 32 (88.9%) | 4 (11.1%) |
| Single Unit, Attached | 0 (0.0%) | 0 (0.0%) |
| 2 Unit Apartments | 0 (0.0%) | 0 (0.0%) |
| 3 or 4 Unit Apartments | 0 (0.0%) | 2 (100.0%) |
| 5 to 9 Unit Apartments | 0 (0.0%) | 4 (100.0%) |
| 10 or more Apartments | 0 (0.0%) | 0 (0.0%) |
| Mobile Home / Other | 0 (0.0%) | 0 (0.0%) |
| Total | 32 (76.2%) | 10 (23.8%) |
Housing Structures by Number of Rooms in Fort Ransom
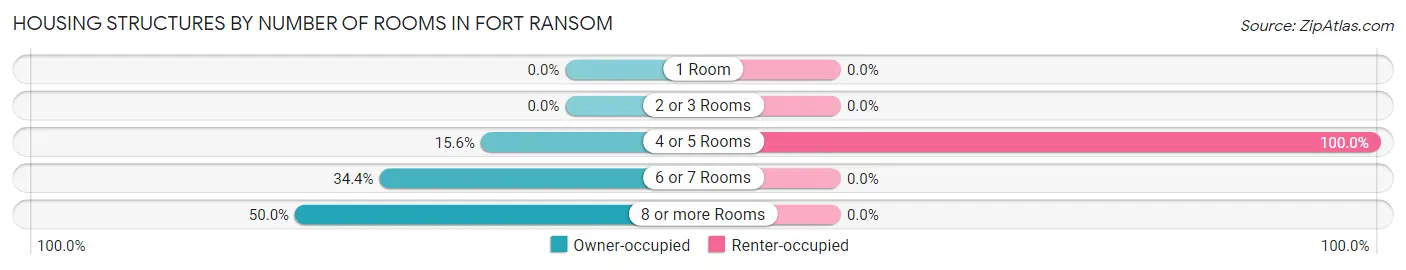
| Number of Rooms | Owner-occupied | Renter-occupied |
| 1 Room | 0 (0.0%) | 0 (0.0%) |
| 2 or 3 Rooms | 0 (0.0%) | 0 (0.0%) |
| 4 or 5 Rooms | 5 (15.6%) | 10 (100.0%) |
| 6 or 7 Rooms | 11 (34.4%) | 0 (0.0%) |
| 8 or more Rooms | 16 (50.0%) | 0 (0.0%) |
| Total | 32 (100.0%) | 10 (100.0%) |
Housing Structure by Heating Type in Fort Ransom
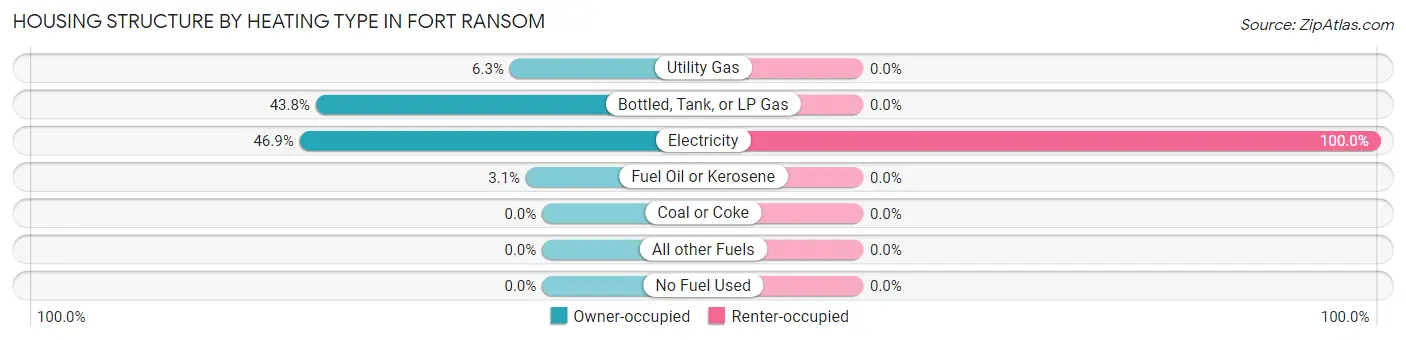
| Heating Type | Owner-occupied | Renter-occupied |
| Utility Gas | 2 (6.2%) | 0 (0.0%) |
| Bottled, Tank, or LP Gas | 14 (43.8%) | 0 (0.0%) |
| Electricity | 15 (46.9%) | 10 (100.0%) |
| Fuel Oil or Kerosene | 1 (3.1%) | 0 (0.0%) |
| Coal or Coke | 0 (0.0%) | 0 (0.0%) |
| All other Fuels | 0 (0.0%) | 0 (0.0%) |
| No Fuel Used | 0 (0.0%) | 0 (0.0%) |
| Total | 32 (100.0%) | 10 (100.0%) |
Household Vehicle Usage in Fort Ransom
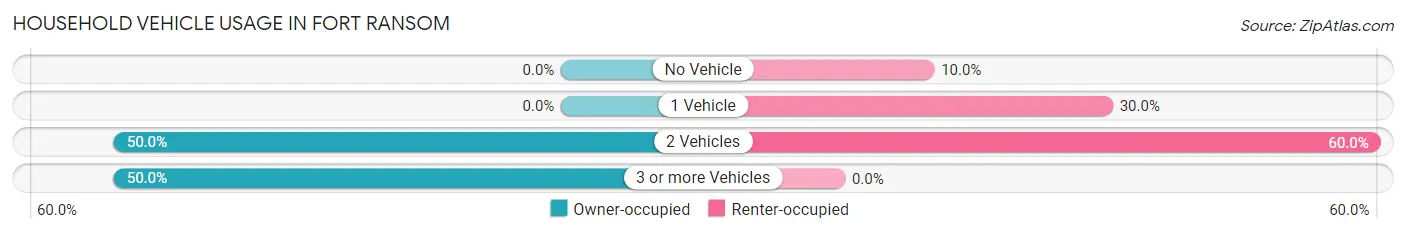
| Vehicles per Household | Owner-occupied | Renter-occupied |
| No Vehicle | 0 (0.0%) | 1 (10.0%) |
| 1 Vehicle | 0 (0.0%) | 3 (30.0%) |
| 2 Vehicles | 16 (50.0%) | 6 (60.0%) |
| 3 or more Vehicles | 16 (50.0%) | 0 (0.0%) |
| Total | 32 (100.0%) | 10 (100.0%) |
Real Estate & Mortgages in Fort Ransom
Real Estate and Mortgage Overview in Fort Ransom
| Characteristic | Without Mortgage | With Mortgage |
| Housing Units | 18 | 14 |
| Median Property Value | $162,500 | $187,500 |
| Median Household Income | $60,000 | $0 |
| Monthly Housing Costs | $475 | $1 |
| Real Estate Taxes | $1,188 | $0 |
Property Value by Mortgage Status in Fort Ransom
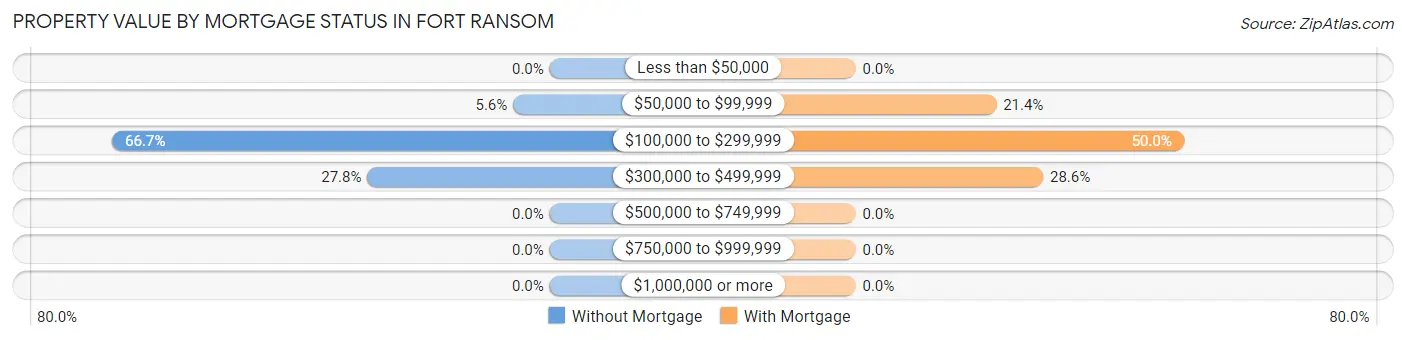
| Property Value | Without Mortgage | With Mortgage |
| Less than $50,000 | 0 (0.0%) | 0 (0.0%) |
| $50,000 to $99,999 | 1 (5.6%) | 3 (21.4%) |
| $100,000 to $299,999 | 12 (66.7%) | 7 (50.0%) |
| $300,000 to $499,999 | 5 (27.8%) | 4 (28.6%) |
| $500,000 to $749,999 | 0 (0.0%) | 0 (0.0%) |
| $750,000 to $999,999 | 0 (0.0%) | 0 (0.0%) |
| $1,000,000 or more | 0 (0.0%) | 0 (0.0%) |
| Total | 18 (100.0%) | 14 (100.0%) |
Household Income by Mortgage Status in Fort Ransom
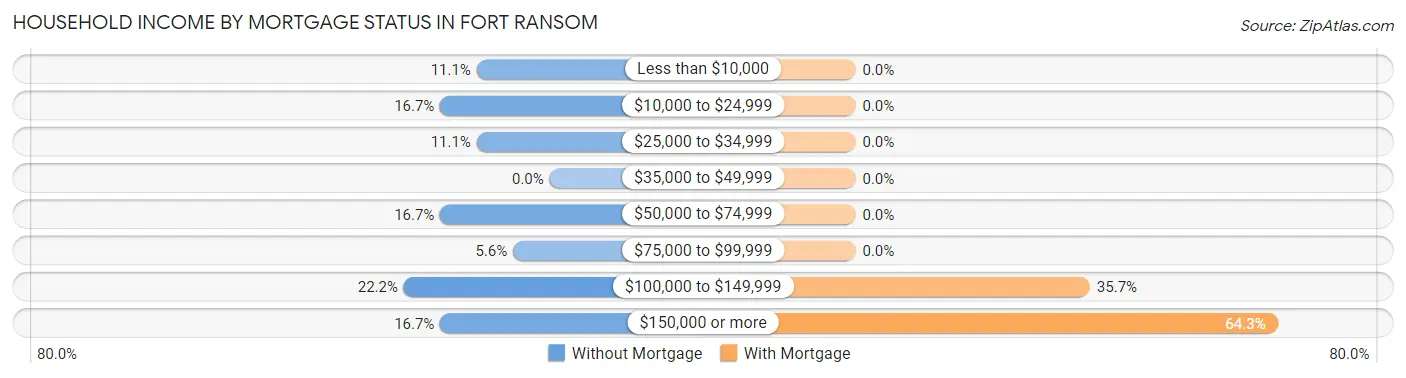
| Household Income | Without Mortgage | With Mortgage |
| Less than $10,000 | 2 (11.1%) | 0 (0.0%) |
| $10,000 to $24,999 | 3 (16.7%) | 0 (0.0%) |
| $25,000 to $34,999 | 2 (11.1%) | 0 (0.0%) |
| $35,000 to $49,999 | 0 (0.0%) | 0 (0.0%) |
| $50,000 to $74,999 | 3 (16.7%) | 0 (0.0%) |
| $75,000 to $99,999 | 1 (5.6%) | 0 (0.0%) |
| $100,000 to $149,999 | 4 (22.2%) | 5 (35.7%) |
| $150,000 or more | 3 (16.7%) | 9 (64.3%) |
| Total | 18 (100.0%) | 14 (100.0%) |
Property Value to Household Income Ratio in Fort Ransom
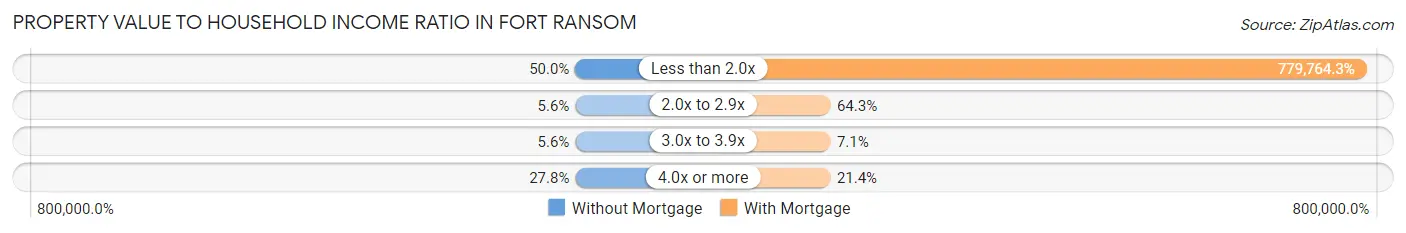
| Value-to-Income Ratio | Without Mortgage | With Mortgage |
| Less than 2.0x | 9 (50.0%) | 109,167 (779,764.3%) |
| 2.0x to 2.9x | 1 (5.6%) | 9 (64.3%) |
| 3.0x to 3.9x | 1 (5.6%) | 1 (7.1%) |
| 4.0x or more | 5 (27.8%) | 3 (21.4%) |
| Total | 18 (100.0%) | 14 (100.0%) |
Real Estate Taxes by Mortgage Status in Fort Ransom
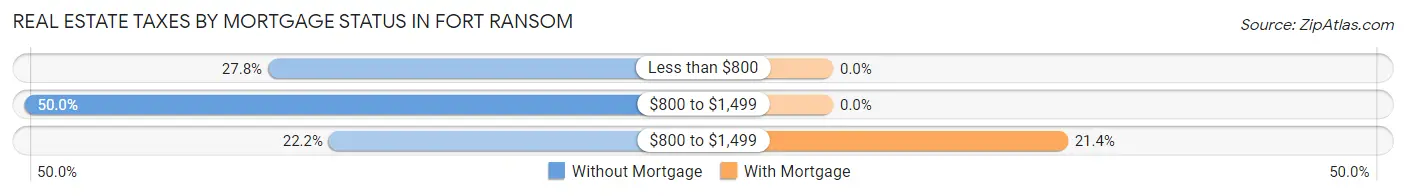
| Property Taxes | Without Mortgage | With Mortgage |
| Less than $800 | 5 (27.8%) | 0 (0.0%) |
| $800 to $1,499 | 9 (50.0%) | 0 (0.0%) |
| $800 to $1,499 | 4 (22.2%) | 3 (21.4%) |
| Total | 18 (100.0%) | 14 (100.0%) |
Health & Disability in Fort Ransom
Health Insurance Coverage by Age in Fort Ransom
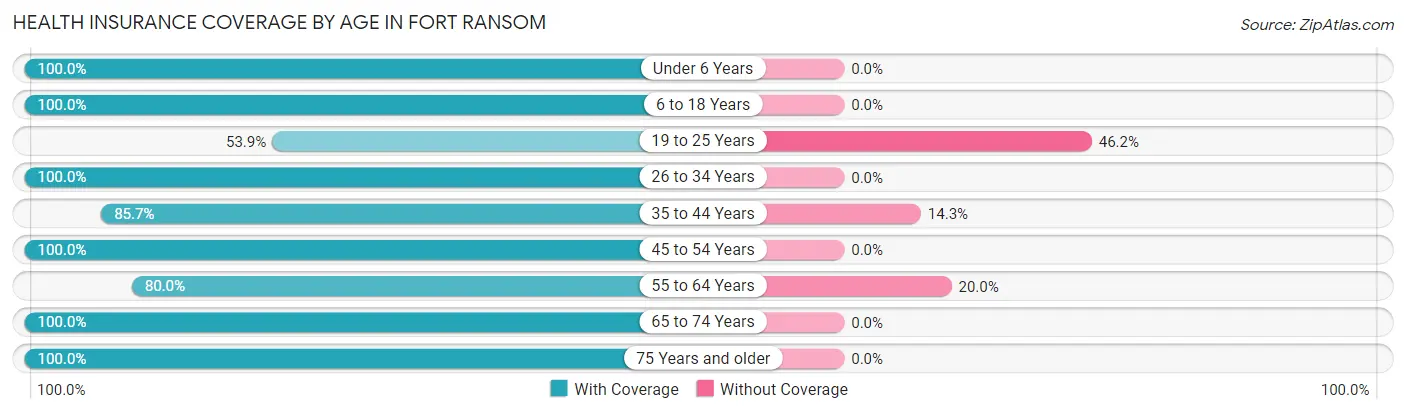
| Age Bracket | With Coverage | Without Coverage |
| Under 6 Years | 7 (100.0%) | 0 (0.0%) |
| 6 to 18 Years | 24 (100.0%) | 0 (0.0%) |
| 19 to 25 Years | 7 (53.8%) | 6 (46.2%) |
| 26 to 34 Years | 9 (100.0%) | 0 (0.0%) |
| 35 to 44 Years | 12 (85.7%) | 2 (14.3%) |
| 45 to 54 Years | 4 (100.0%) | 0 (0.0%) |
| 55 to 64 Years | 8 (80.0%) | 2 (20.0%) |
| 65 to 74 Years | 18 (100.0%) | 0 (0.0%) |
| 75 Years and older | 7 (100.0%) | 0 (0.0%) |
| Total | 96 (90.6%) | 10 (9.4%) |
Health Insurance Coverage by Citizenship Status in Fort Ransom
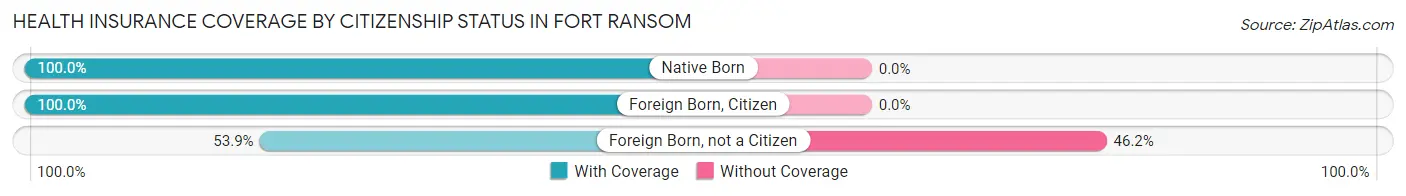
| Citizenship Status | With Coverage | Without Coverage |
| Native Born | 7 (100.0%) | 0 (0.0%) |
| Foreign Born, Citizen | 24 (100.0%) | 0 (0.0%) |
| Foreign Born, not a Citizen | 7 (53.8%) | 6 (46.2%) |
Health Insurance Coverage by Household Income in Fort Ransom
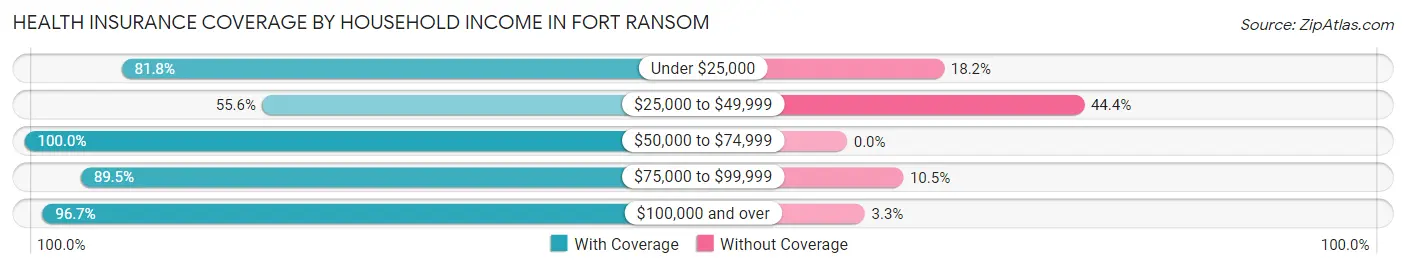
| Household Income | With Coverage | Without Coverage |
| Under $25,000 | 9 (81.8%) | 2 (18.2%) |
| $25,000 to $49,999 | 5 (55.6%) | 4 (44.4%) |
| $50,000 to $74,999 | 7 (100.0%) | 0 (0.0%) |
| $75,000 to $99,999 | 17 (89.5%) | 2 (10.5%) |
| $100,000 and over | 58 (96.7%) | 2 (3.3%) |
Public vs Private Health Insurance Coverage by Age in Fort Ransom
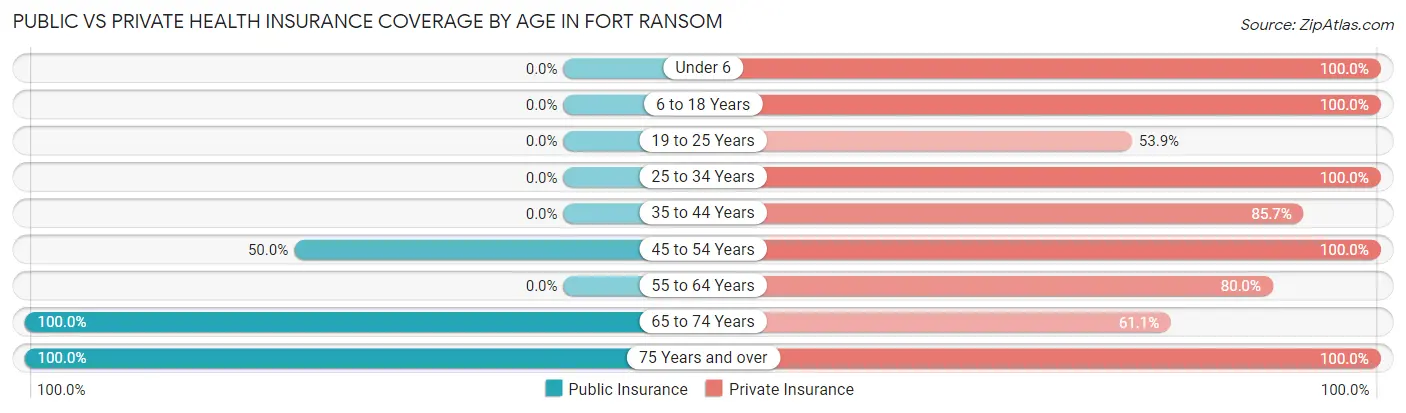
| Age Bracket | Public Insurance | Private Insurance |
| Under 6 | 0 (0.0%) | 7 (100.0%) |
| 6 to 18 Years | 0 (0.0%) | 24 (100.0%) |
| 19 to 25 Years | 0 (0.0%) | 7 (53.8%) |
| 25 to 34 Years | 0 (0.0%) | 9 (100.0%) |
| 35 to 44 Years | 0 (0.0%) | 12 (85.7%) |
| 45 to 54 Years | 2 (50.0%) | 4 (100.0%) |
| 55 to 64 Years | 0 (0.0%) | 8 (80.0%) |
| 65 to 74 Years | 18 (100.0%) | 11 (61.1%) |
| 75 Years and over | 7 (100.0%) | 7 (100.0%) |
| Total | 27 (25.5%) | 89 (84.0%) |
Disability Status by Sex by Age in Fort Ransom
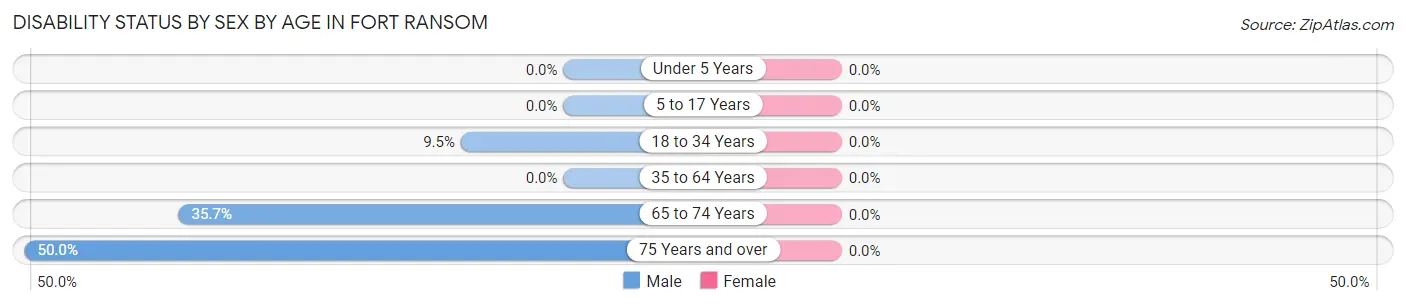
| Age Bracket | Male | Female |
| Under 5 Years | 0 (0.0%) | 0 (0.0%) |
| 5 to 17 Years | 0 (0.0%) | 0 (0.0%) |
| 18 to 34 Years | 2 (9.5%) | 0 (0.0%) |
| 35 to 64 Years | 0 (0.0%) | 0 (0.0%) |
| 65 to 74 Years | 5 (35.7%) | 0 (0.0%) |
| 75 Years and over | 1 (50.0%) | 0 (0.0%) |
Disability Class by Sex by Age in Fort Ransom
Disability Class: Hearing Difficulty
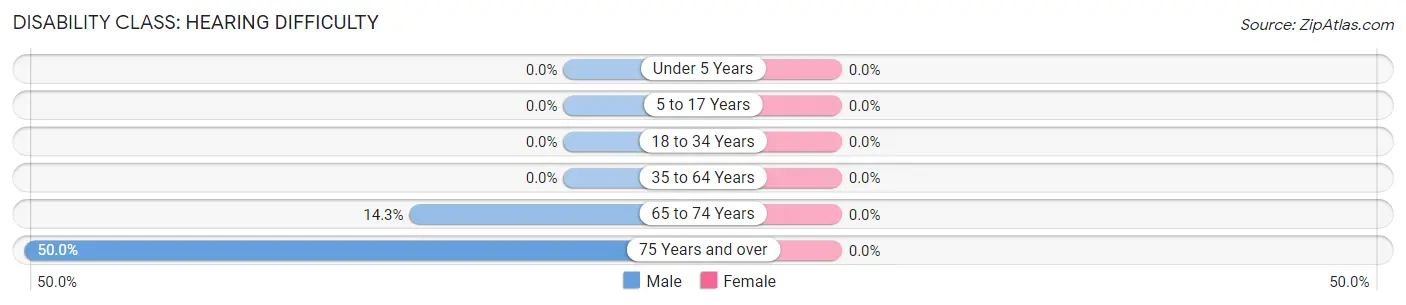
| Age Bracket | Male | Female |
| Under 5 Years | 0 (0.0%) | 0 (0.0%) |
| 5 to 17 Years | 0 (0.0%) | 0 (0.0%) |
| 18 to 34 Years | 0 (0.0%) | 0 (0.0%) |
| 35 to 64 Years | 0 (0.0%) | 0 (0.0%) |
| 65 to 74 Years | 2 (14.3%) | 0 (0.0%) |
| 75 Years and over | 1 (50.0%) | 0 (0.0%) |
Disability Class: Vision Difficulty
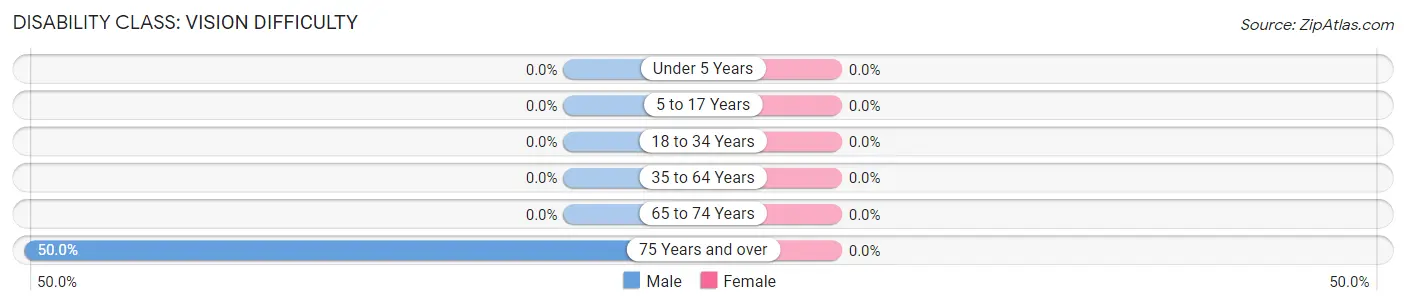
| Age Bracket | Male | Female |
| Under 5 Years | 0 (0.0%) | 0 (0.0%) |
| 5 to 17 Years | 0 (0.0%) | 0 (0.0%) |
| 18 to 34 Years | 0 (0.0%) | 0 (0.0%) |
| 35 to 64 Years | 0 (0.0%) | 0 (0.0%) |
| 65 to 74 Years | 0 (0.0%) | 0 (0.0%) |
| 75 Years and over | 1 (50.0%) | 0 (0.0%) |
Disability Class: Cognitive Difficulty
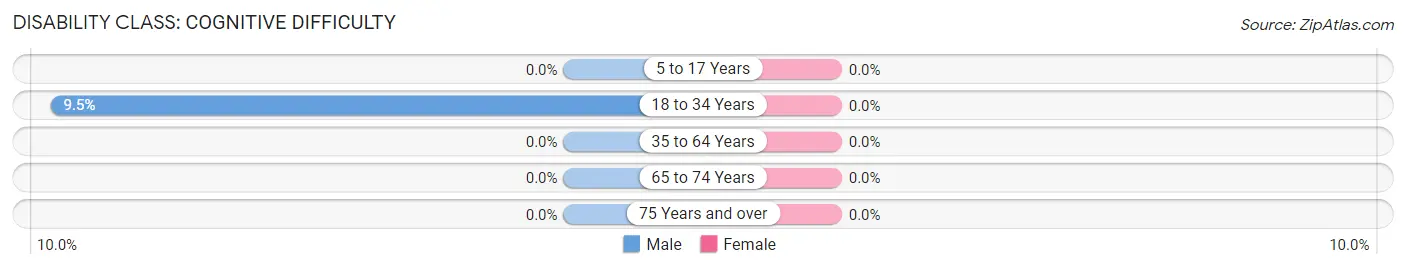
| Age Bracket | Male | Female |
| 5 to 17 Years | 0 (0.0%) | 0 (0.0%) |
| 18 to 34 Years | 2 (9.5%) | 0 (0.0%) |
| 35 to 64 Years | 0 (0.0%) | 0 (0.0%) |
| 65 to 74 Years | 0 (0.0%) | 0 (0.0%) |
| 75 Years and over | 0 (0.0%) | 0 (0.0%) |
Disability Class: Ambulatory Difficulty
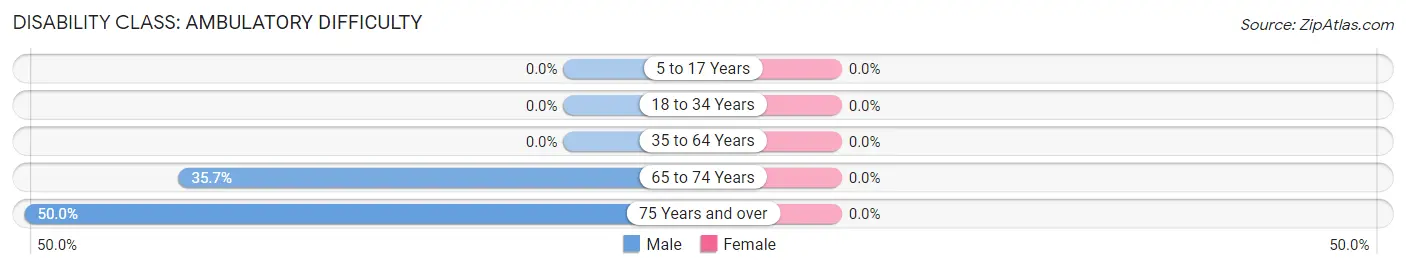
| Age Bracket | Male | Female |
| 5 to 17 Years | 0 (0.0%) | 0 (0.0%) |
| 18 to 34 Years | 0 (0.0%) | 0 (0.0%) |
| 35 to 64 Years | 0 (0.0%) | 0 (0.0%) |
| 65 to 74 Years | 5 (35.7%) | 0 (0.0%) |
| 75 Years and over | 1 (50.0%) | 0 (0.0%) |
Disability Class: Self-Care Difficulty
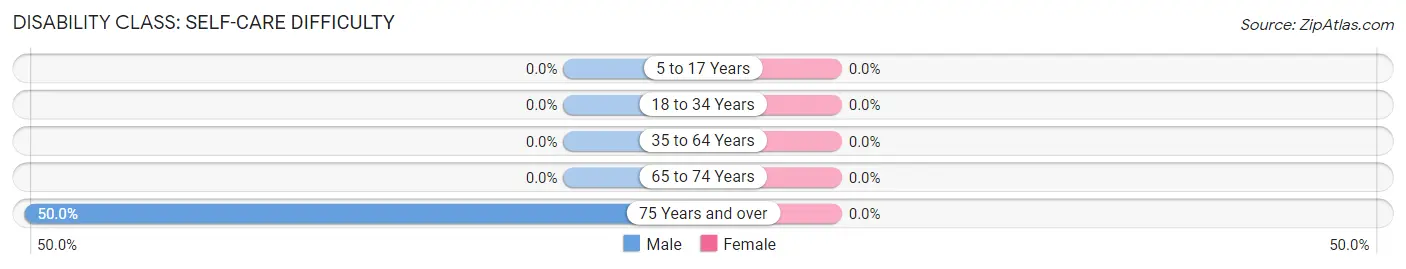
| Age Bracket | Male | Female |
| 5 to 17 Years | 0 (0.0%) | 0 (0.0%) |
| 18 to 34 Years | 0 (0.0%) | 0 (0.0%) |
| 35 to 64 Years | 0 (0.0%) | 0 (0.0%) |
| 65 to 74 Years | 0 (0.0%) | 0 (0.0%) |
| 75 Years and over | 1 (50.0%) | 0 (0.0%) |
Technology Access in Fort Ransom
Computing Device Access in Fort Ransom
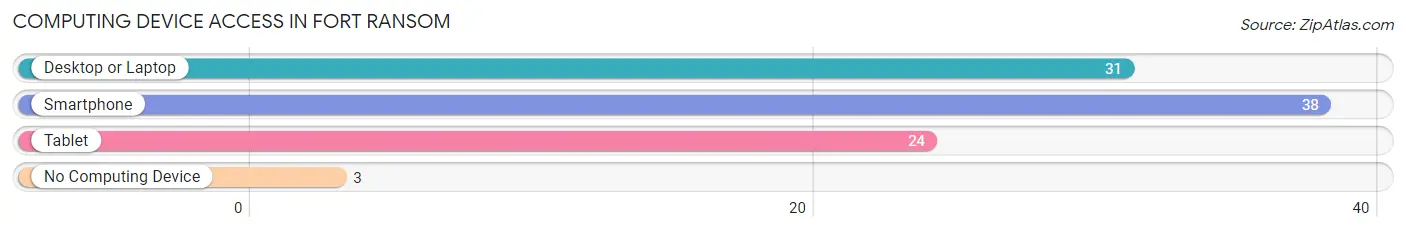
| Device Type | # Households | % Households |
| Desktop or Laptop | 31 | 73.8% |
| Smartphone | 38 | 90.5% |
| Tablet | 24 | 57.1% |
| No Computing Device | 3 | 7.1% |
| Total | 42 | 100.0% |
Internet Access in Fort Ransom
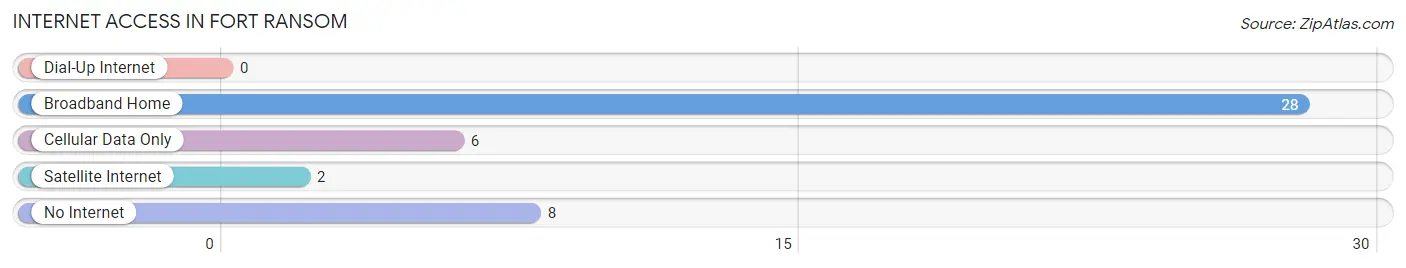
| Internet Type | # Households | % Households |
| Dial-Up Internet | 0 | 0.0% |
| Broadband Home | 28 | 66.7% |
| Cellular Data Only | 6 | 14.3% |
| Satellite Internet | 2 | 4.8% |
| No Internet | 8 | 19.1% |
| Total | 42 | 100.0% |
Fort Ransom Summary
Fort Ransom is a small town located in the southeastern corner of North Dakota, in the United States. It is situated in the Sheyenne River Valley, and is part of the Sheyenne River Valley National Scenic Byway. The town was founded in 1872, and is named after the nearby Fort Ransom, which was built in 1867 to protect settlers from Native American attacks.
Geography
Fort Ransom is located in southeastern North Dakota, in the Sheyenne River Valley. The town is situated on the banks of the Sheyenne River, and is surrounded by rolling hills and prairies. The town is located approximately 30 miles south of the city of Fargo, and is part of the Sheyenne River Valley National Scenic Byway.
The climate in Fort Ransom is typical of the Great Plains region, with hot summers and cold winters. The average annual temperature is around 50 degrees Fahrenheit, and the average annual precipitation is around 20 inches.
Economy
The economy of Fort Ransom is largely based on agriculture. The town is home to several farms, which produce a variety of crops, including wheat, corn, soybeans, and hay. The town also has a small manufacturing sector, which produces a variety of products, including furniture, clothing, and food products.
The town is also home to several small businesses, including restaurants, retail stores, and service providers. The town is also home to a number of tourist attractions, including the Fort Ransom State Historic Site, which is a preserved fort from the 1800s.
Demographics
As of the 2010 census, the population of Fort Ransom was 545. The racial makeup of the town was 97.3% White, 0.2% African American, 0.2% Native American, 0.2% Asian, 0.2% from other races, and 1.9% from two or more races. The median household income was $45,000, and the median family income was $50,000.
Conclusion
Fort Ransom is a small town located in the southeastern corner of North Dakota. The town was founded in 1872, and is named after the nearby Fort Ransom, which was built in 1867 to protect settlers from Native American attacks. The economy of Fort Ransom is largely based on agriculture, and the town is home to several small businesses. The population of Fort Ransom was 545 as of the 2010 census, and the median household income was $45,000.
Common Questions
What is Per Capita Income in Fort Ransom?
Per Capita income in Fort Ransom is $42,615.
What is the Median Family Income in Fort Ransom?
Median Family Income in Fort Ransom is $102,500.
What is the Median Household income in Fort Ransom?
Median Household Income in Fort Ransom is $80,000.
What is Inequality or Gini Index in Fort Ransom?
Inequality or Gini Index in Fort Ransom is 0.55.
What is the Total Population of Fort Ransom?
Total Population of Fort Ransom is 106.
What is the Total Male Population of Fort Ransom?
Total Male Population of Fort Ransom is 68.
What is the Total Female Population of Fort Ransom?
Total Female Population of Fort Ransom is 38.
What is the Ratio of Males per 100 Females in Fort Ransom?
There are 178.95 Males per 100 Females in Fort Ransom.
What is the Ratio of Females per 100 Males in Fort Ransom?
There are 55.88 Females per 100 Males in Fort Ransom.
What is the Median Population Age in Fort Ransom?
Median Population Age in Fort Ransom is 35.0 Years.
What is the Average Family Size in Fort Ransom
Average Family Size in Fort Ransom is 3.3 People.
What is the Average Household Size in Fort Ransom
Average Household Size in Fort Ransom is 2.5 People.
How Large is the Labor Force in Fort Ransom?
There are 49 People in the Labor Forcein in Fort Ransom.
What is the Percentage of People in the Labor Force in Fort Ransom?
59.8% of People are in the Labor Force in Fort Ransom.
What is the Unemployment Rate in Fort Ransom?
Unemployment Rate in Fort Ransom is 4.1%.