Sibley, LA Map & Demographics
Sibley Map
Sibley Overview
$18,741
PER CAPITA INCOME
$45,938
AVG FAMILY INCOME
$31,359
AVG HOUSEHOLD INCOME
36.6%
WAGE / INCOME GAP [ % ]
63.4¢/ $1
WAGE / INCOME GAP [ $ ]
0.47
INEQUALITY / GINI INDEX
1,323
TOTAL POPULATION
662
MALE POPULATION
661
FEMALE POPULATION
100.15
MALES / 100 FEMALES
99.85
FEMALES / 100 MALES
41.1
MEDIAN AGE
3.4
AVG FAMILY SIZE
2.6
AVG HOUSEHOLD SIZE
511
LABOR FORCE [ PEOPLE ]
49.1%
PERCENT IN LABOR FORCE
2.4%
UNEMPLOYMENT RATE
Sibley Zip Codes
Sibley Area Codes
Income in Sibley
Income Overview in Sibley
Per Capita Income in Sibley is $18,741, while median incomes of families and households are $45,938 and $31,359 respectively.
| Characteristic | Number | Measure |
| Per Capita Income | 1,323 | $18,741 |
| Median Family Income | 321 | $45,938 |
| Mean Family Income | 321 | $60,358 |
| Median Household Income | 507 | $31,359 |
| Mean Household Income | 507 | $48,590 |
| Income Deficit | 321 | $0 |
| Wage / Income Gap (%) | 1,323 | 36.58% |
| Wage / Income Gap ($) | 1,323 | 63.42¢ per $1 |
| Gini / Inequality Index | 1,323 | 0.47 |
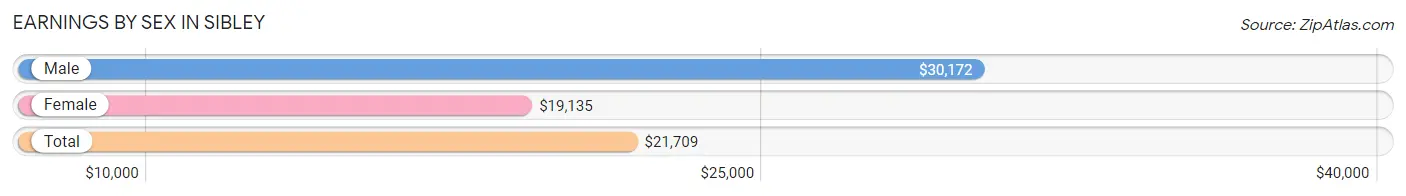
Earnings by Sex in Sibley
Average Earnings in Sibley are $21,709, $30,172 for men and $19,135 for women, a difference of 36.6%.
| Sex | Number | Average Earnings |
| Male | 276 (54.0%) | $30,172 |
| Female | 235 (46.0%) | $19,135 |
| Total | 511 (100.0%) | $21,709 |
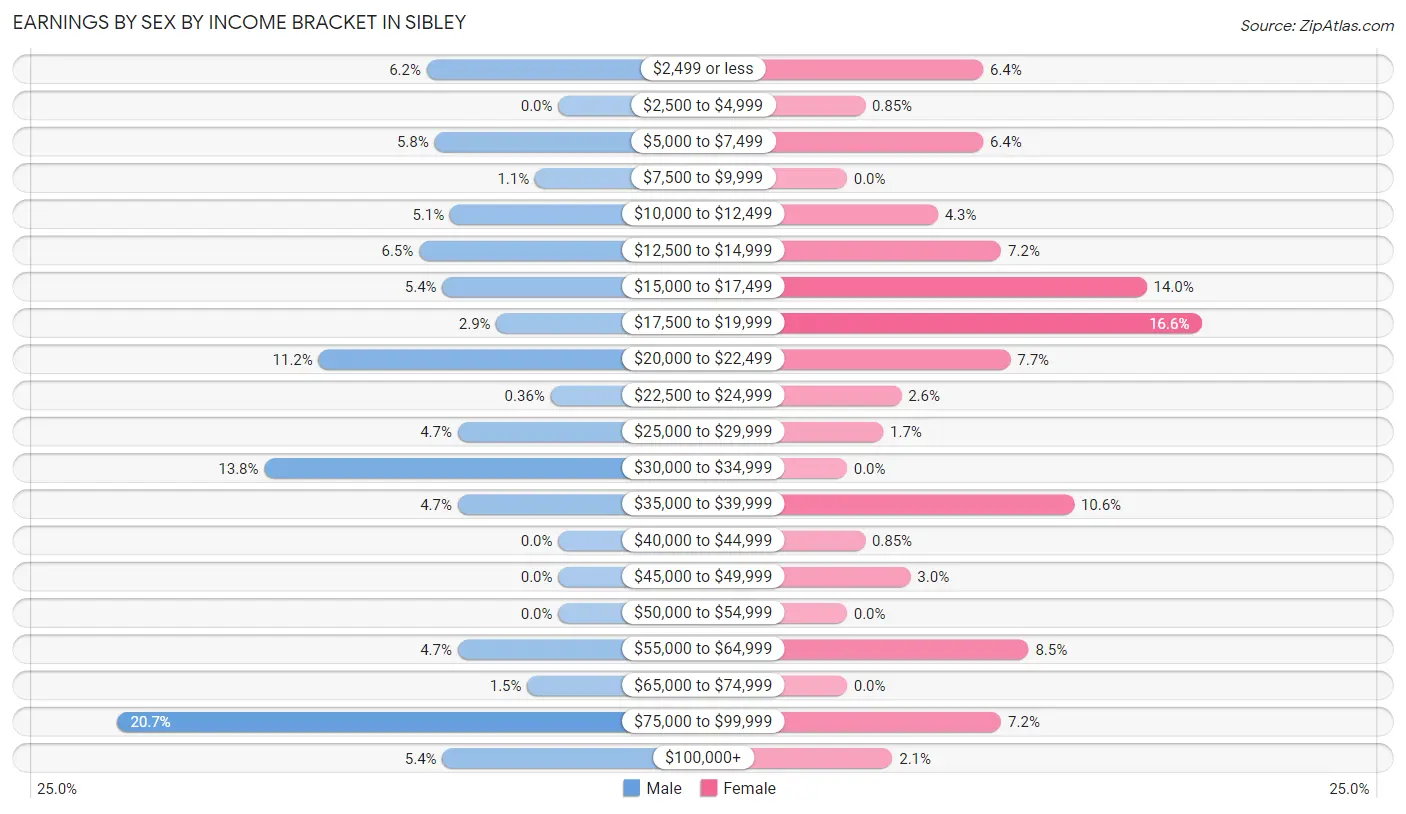
Earnings by Sex by Income Bracket in Sibley
The most common earnings brackets in Sibley are $75,000 to $99,999 for men (57 | 20.6%) and $17,500 to $19,999 for women (39 | 16.6%).
| Income | Male | Female |
| $2,499 or less | 17 (6.2%) | 15 (6.4%) |
| $2,500 to $4,999 | 0 (0.0%) | 2 (0.9%) |
| $5,000 to $7,499 | 16 (5.8%) | 15 (6.4%) |
| $7,500 to $9,999 | 3 (1.1%) | 0 (0.0%) |
| $10,000 to $12,499 | 14 (5.1%) | 10 (4.3%) |
| $12,500 to $14,999 | 18 (6.5%) | 17 (7.2%) |
| $15,000 to $17,499 | 15 (5.4%) | 33 (14.0%) |
| $17,500 to $19,999 | 8 (2.9%) | 39 (16.6%) |
| $20,000 to $22,499 | 31 (11.2%) | 18 (7.7%) |
| $22,500 to $24,999 | 1 (0.4%) | 6 (2.5%) |
| $25,000 to $29,999 | 13 (4.7%) | 4 (1.7%) |
| $30,000 to $34,999 | 38 (13.8%) | 0 (0.0%) |
| $35,000 to $39,999 | 13 (4.7%) | 25 (10.6%) |
| $40,000 to $44,999 | 0 (0.0%) | 2 (0.9%) |
| $45,000 to $49,999 | 0 (0.0%) | 7 (3.0%) |
| $50,000 to $54,999 | 0 (0.0%) | 0 (0.0%) |
| $55,000 to $64,999 | 13 (4.7%) | 20 (8.5%) |
| $65,000 to $74,999 | 4 (1.5%) | 0 (0.0%) |
| $75,000 to $99,999 | 57 (20.6%) | 17 (7.2%) |
| $100,000+ | 15 (5.4%) | 5 (2.1%) |
| Total | 276 (100.0%) | 235 (100.0%) |
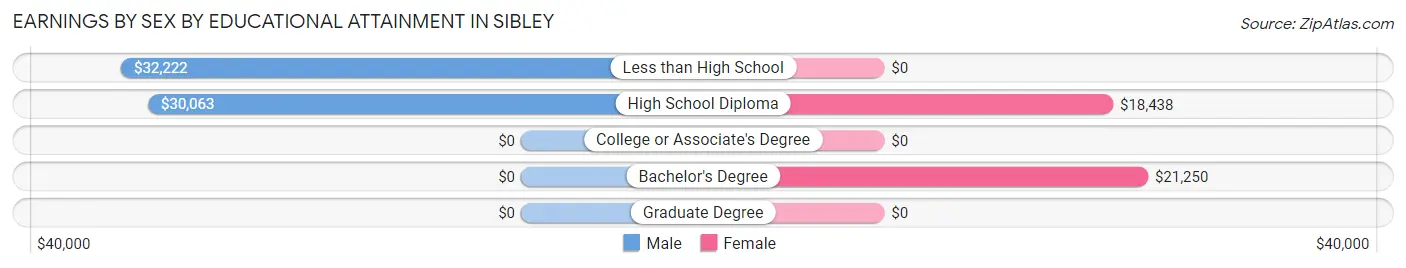
Earnings by Sex by Educational Attainment in Sibley
Average earnings in Sibley are $31,422 for men and $19,776 for women, a difference of 37.1%. Men with an educational attainment of less than high school enjoy the highest average annual earnings of $32,222, while those with high school diploma education earn the least with $30,063. Women with an educational attainment of bachelor's degree earn the most with the average annual earnings of $21,250, while those with high school diploma education have the smallest earnings of $18,438.
| Educational Attainment | Male Income | Female Income |
| Less than High School | $32,222 | $0 |
| High School Diploma | $30,063 | $18,438 |
| College or Associate's Degree | - | - |
| Bachelor's Degree | - | - |
| Graduate Degree | - | - |
| Total | $31,422 | $19,776 |
Family Income in Sibley
Family Income Brackets in Sibley
According to the Sibley family income data, there are 72 families falling into the $15,000 to $24,999 income range, which is the most common income bracket and makes up 22.4% of all families.
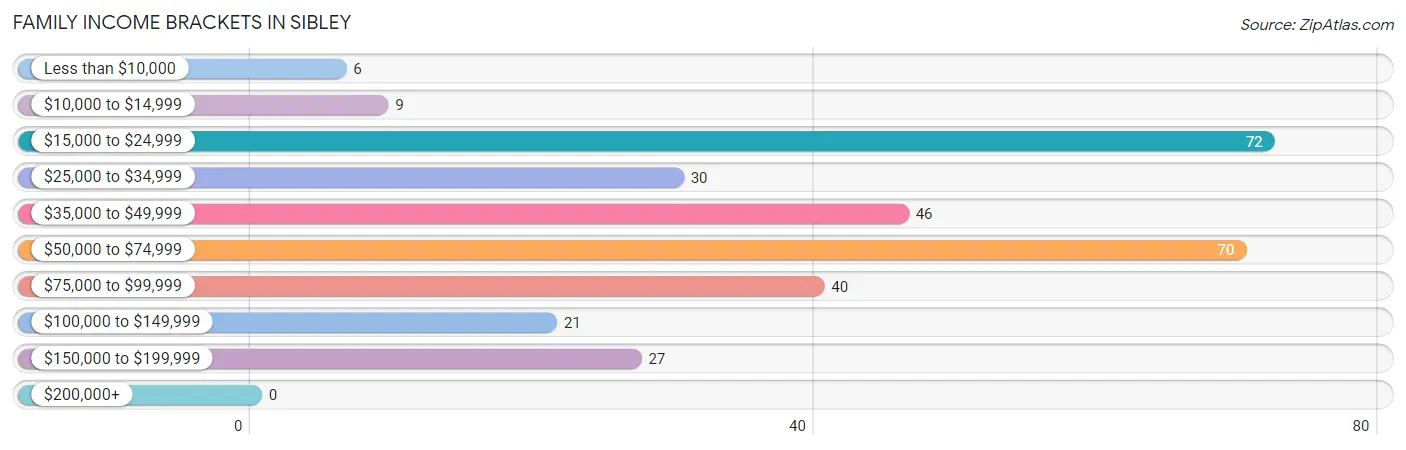
| Income Bracket | # Families | % Families |
| Less than $10,000 | 6 | 1.9% |
| $10,000 to $14,999 | 9 | 2.8% |
| $15,000 to $24,999 | 72 | 22.4% |
| $25,000 to $34,999 | 30 | 9.3% |
| $35,000 to $49,999 | 46 | 14.3% |
| $50,000 to $74,999 | 70 | 21.8% |
| $75,000 to $99,999 | 40 | 12.5% |
| $100,000 to $149,999 | 21 | 6.5% |
| $150,000 to $199,999 | 27 | 8.4% |
| $200,000+ | 0 | 0.0% |
Family Income by Famaliy Size in Sibley
4-person families (32 | 10.0%) account for the highest median family income in Sibley with $92,500 per family, while 2-person families (110 | 34.3%) have the highest median income of $23,125 per family member.
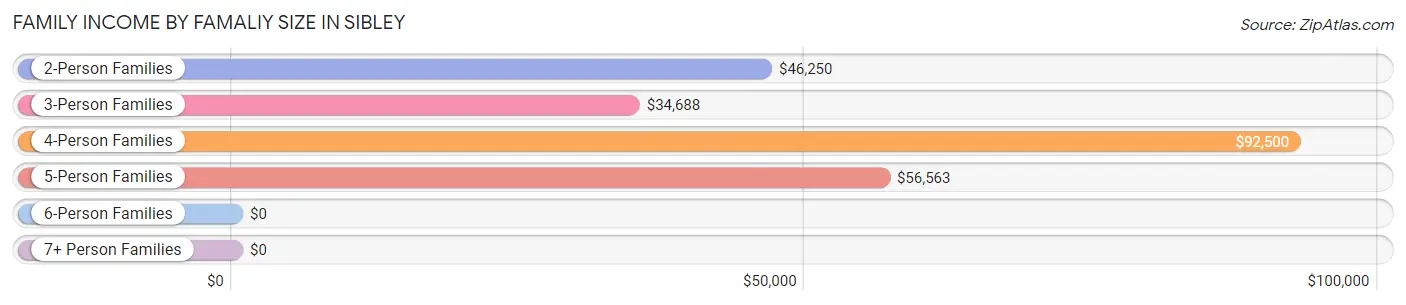
| Income Bracket | # Families | Median Income |
| 2-Person Families | 110 (34.3%) | $46,250 |
| 3-Person Families | 123 (38.3%) | $34,688 |
| 4-Person Families | 32 (10.0%) | $92,500 |
| 5-Person Families | 42 (13.1%) | $56,563 |
| 6-Person Families | 14 (4.4%) | $0 |
| 7+ Person Families | 0 (0.0%) | $0 |
| Total | 321 (100.0%) | $45,938 |
Family Income by Number of Earners in Sibley
The median family income in Sibley is $45,938, with families comprising 3+ earners (19) having the highest median family income of $81,250, while families with no earners (66) have the lowest median family income of $24,167, accounting for 5.9% and 20.6% of families, respectively.
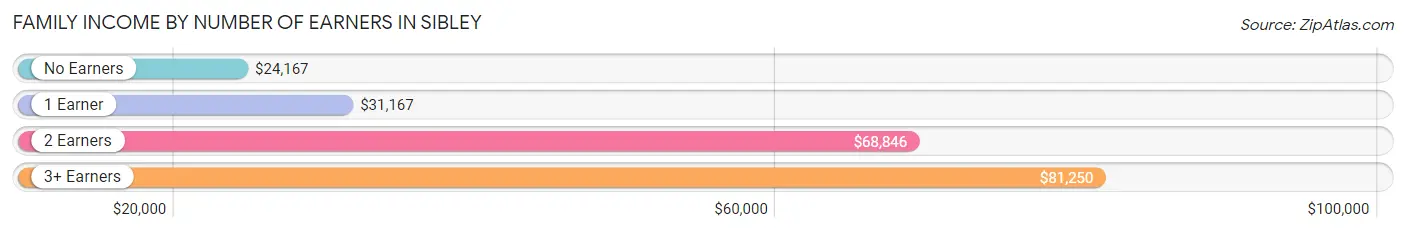
| Number of Earners | # Families | Median Income |
| No Earners | 66 (20.6%) | $24,167 |
| 1 Earner | 102 (31.8%) | $31,167 |
| 2 Earners | 134 (41.7%) | $68,846 |
| 3+ Earners | 19 (5.9%) | $81,250 |
| Total | 321 (100.0%) | $45,938 |
Household Income in Sibley
Household Income Brackets in Sibley
With 116 households falling in the category, the $15,000 to $24,999 income range is the most frequent in Sibley, accounting for 22.9% of all households.
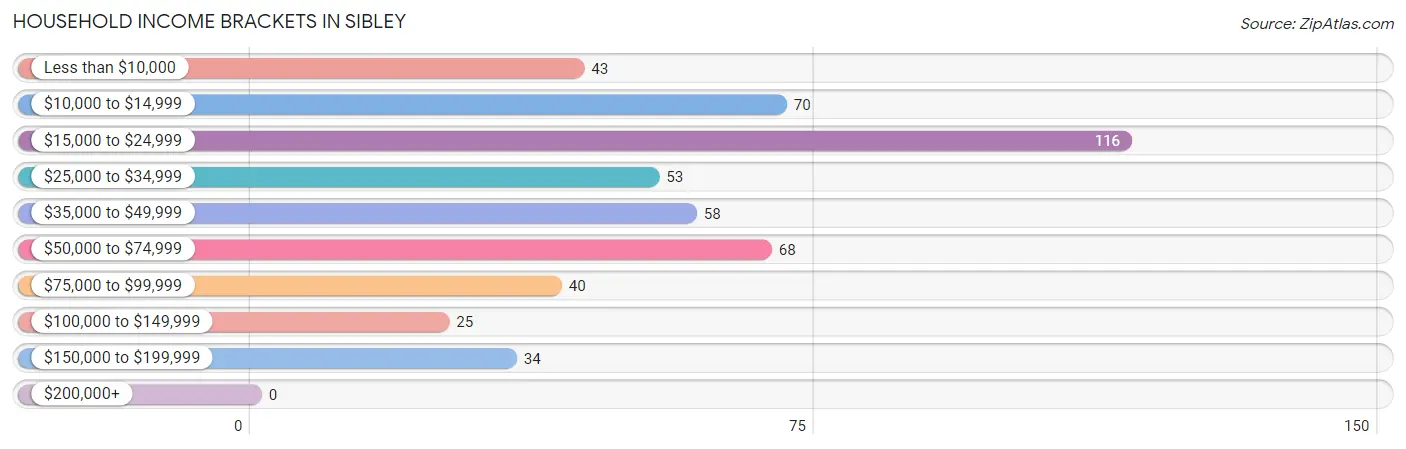
| Income Bracket | # Households | % Households |
| Less than $10,000 | 43 | 8.5% |
| $10,000 to $14,999 | 70 | 13.8% |
| $15,000 to $24,999 | 116 | 22.9% |
| $25,000 to $34,999 | 53 | 10.5% |
| $35,000 to $49,999 | 58 | 11.4% |
| $50,000 to $74,999 | 68 | 13.4% |
| $75,000 to $99,999 | 40 | 7.9% |
| $100,000 to $149,999 | 25 | 4.9% |
| $150,000 to $199,999 | 34 | 6.7% |
| $200,000+ | 0 | 0.0% |
Household Income by Householder Age in Sibley
The median household income in Sibley is $31,359, with the highest median household income of $41,339 found in the 45 to 64 years age bracket for the primary householder. A total of 248 households (48.9%) fall into this category. Meanwhile, the 15 to 24 years age bracket for the primary householder has the lowest median household income of $0, with 11 households (2.2%) in this group.
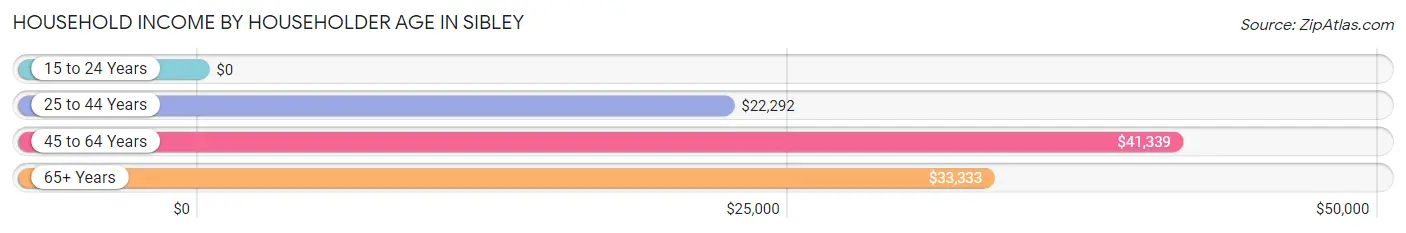
| Income Bracket | # Households | Median Income |
| 15 to 24 Years | 11 (2.2%) | $0 |
| 25 to 44 Years | 108 (21.3%) | $22,292 |
| 45 to 64 Years | 248 (48.9%) | $41,339 |
| 65+ Years | 140 (27.6%) | $33,333 |
| Total | 507 (100.0%) | $31,359 |
Poverty in Sibley
Income Below Poverty by Sex and Age in Sibley
With 21.1% poverty level for males and 31.6% for females among the residents of Sibley, 6 to 11 year old males and 12 to 14 year old females are the most vulnerable to poverty, with 25 males (73.5%) and 6 females (100.0%) in their respective age groups living below the poverty level.
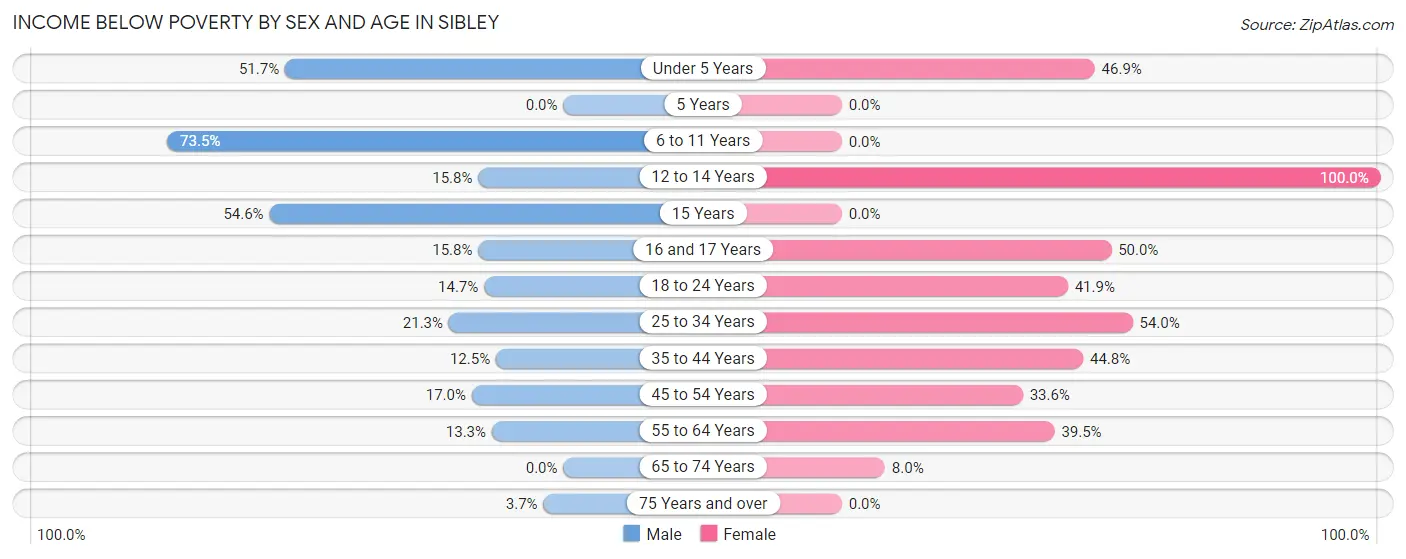
| Age Bracket | Male | Female |
| Under 5 Years | 31 (51.7%) | 23 (46.9%) |
| 5 Years | 0 (0.0%) | 0 (0.0%) |
| 6 to 11 Years | 25 (73.5%) | 0 (0.0%) |
| 12 to 14 Years | 3 (15.8%) | 6 (100.0%) |
| 15 Years | 12 (54.5%) | 0 (0.0%) |
| 16 and 17 Years | 12 (15.8%) | 7 (50.0%) |
| 18 to 24 Years | 5 (14.7%) | 26 (41.9%) |
| 25 to 34 Years | 17 (21.2%) | 34 (54.0%) |
| 35 to 44 Years | 3 (12.5%) | 30 (44.8%) |
| 45 to 54 Years | 17 (17.0%) | 46 (33.6%) |
| 55 to 64 Years | 13 (13.3%) | 30 (39.5%) |
| 65 to 74 Years | 0 (0.0%) | 6 (8.0%) |
| 75 Years and over | 2 (3.7%) | 0 (0.0%) |
| Total | 140 (21.1%) | 208 (31.6%) |
Income Above Poverty by Sex and Age in Sibley
According to the poverty statistics in Sibley, males aged 5 years and females aged 6 to 11 years are the age groups that are most secure financially, with 100.0% of males and 100.0% of females in these age groups living above the poverty line.
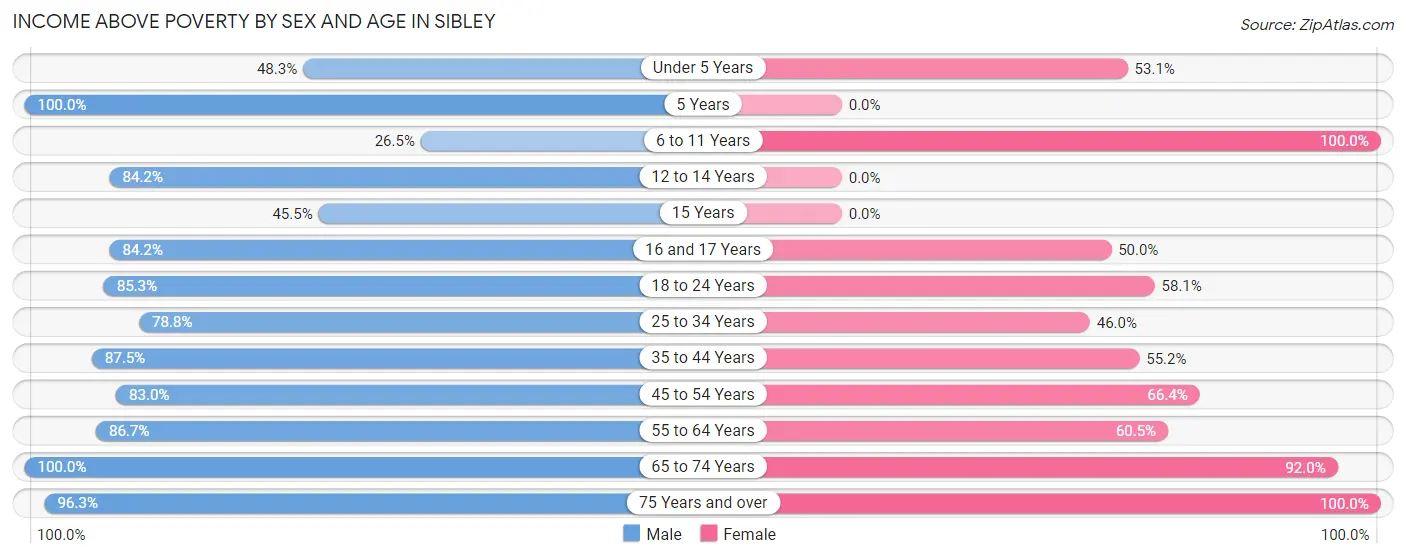
| Age Bracket | Male | Female |
| Under 5 Years | 29 (48.3%) | 26 (53.1%) |
| 5 Years | 23 (100.0%) | 0 (0.0%) |
| 6 to 11 Years | 9 (26.5%) | 68 (100.0%) |
| 12 to 14 Years | 16 (84.2%) | 0 (0.0%) |
| 15 Years | 10 (45.5%) | 0 (0.0%) |
| 16 and 17 Years | 64 (84.2%) | 7 (50.0%) |
| 18 to 24 Years | 29 (85.3%) | 36 (58.1%) |
| 25 to 34 Years | 63 (78.7%) | 29 (46.0%) |
| 35 to 44 Years | 21 (87.5%) | 37 (55.2%) |
| 45 to 54 Years | 83 (83.0%) | 91 (66.4%) |
| 55 to 64 Years | 85 (86.7%) | 46 (60.5%) |
| 65 to 74 Years | 38 (100.0%) | 69 (92.0%) |
| 75 Years and over | 52 (96.3%) | 42 (100.0%) |
| Total | 522 (78.8%) | 451 (68.4%) |
Income Below Poverty Among Married-Couple Families in Sibley
The poverty statistics for married-couple families in Sibley show that 3.4% or 6 of the total 177 families live below the poverty line. Families with 1 or 2 children have the highest poverty rate of 7.9%, comprising of 3 families. On the other hand, families with 3 or 4 children have the lowest poverty rate of 0.0%, which includes 0 families.
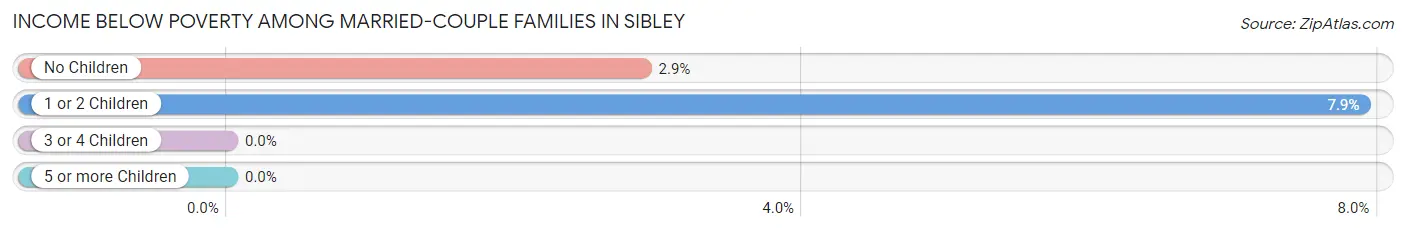
| Children | Above Poverty | Below Poverty |
| No Children | 101 (97.1%) | 3 (2.9%) |
| 1 or 2 Children | 35 (92.1%) | 3 (7.9%) |
| 3 or 4 Children | 35 (100.0%) | 0 (0.0%) |
| 5 or more Children | 0 (0.0%) | 0 (0.0%) |
| Total | 171 (96.6%) | 6 (3.4%) |
Income Below Poverty Among Single-Parent Households in Sibley
According to the poverty data in Sibley, 10.4% or 5 single-father households and 53.1% or 51 single-mother households are living below the poverty line. Among single-father households, those with 1 or 2 children have the highest poverty rate, with 3 households (16.7%) experiencing poverty. Likewise, among single-mother households, those with 3 or 4 children have the highest poverty rate, with 16 households (100.0%) falling below the poverty line.
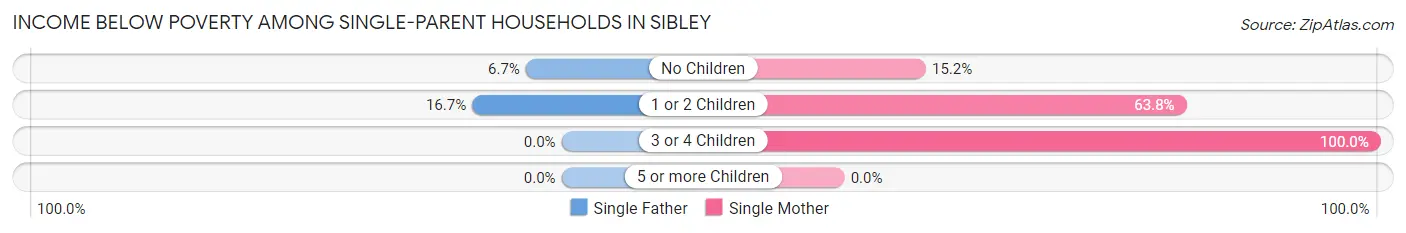
| Children | Single Father | Single Mother |
| No Children | 2 (6.7%) | 5 (15.1%) |
| 1 or 2 Children | 3 (16.7%) | 30 (63.8%) |
| 3 or 4 Children | 0 (0.0%) | 16 (100.0%) |
| 5 or more Children | 0 (0.0%) | 0 (0.0%) |
| Total | 5 (10.4%) | 51 (53.1%) |
Income Below Poverty Among Married-Couple vs Single-Parent Households in Sibley
The poverty data for Sibley shows that 6 of the married-couple family households (3.4%) and 56 of the single-parent households (38.9%) are living below the poverty level. Within the married-couple family households, those with 1 or 2 children have the highest poverty rate, with 3 households (7.9%) falling below the poverty line. Among the single-parent households, those with 3 or 4 children have the highest poverty rate, with 16 household (100.0%) living below poverty.
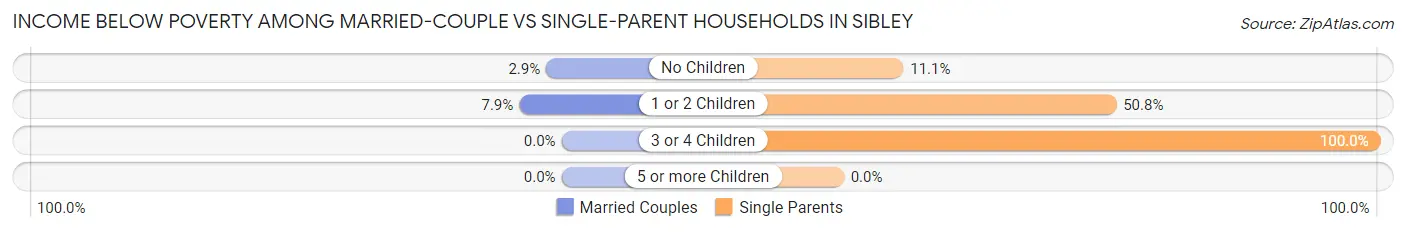
| Children | Married-Couple Families | Single-Parent Households |
| No Children | 3 (2.9%) | 7 (11.1%) |
| 1 or 2 Children | 3 (7.9%) | 33 (50.8%) |
| 3 or 4 Children | 0 (0.0%) | 16 (100.0%) |
| 5 or more Children | 0 (0.0%) | 0 (0.0%) |
| Total | 6 (3.4%) | 56 (38.9%) |
Race in Sibley
The most populous races in Sibley are White / Caucasian (780 | 59.0%), Black / African American (474 | 35.8%), and Hispanic or Latino (57 | 4.3%).
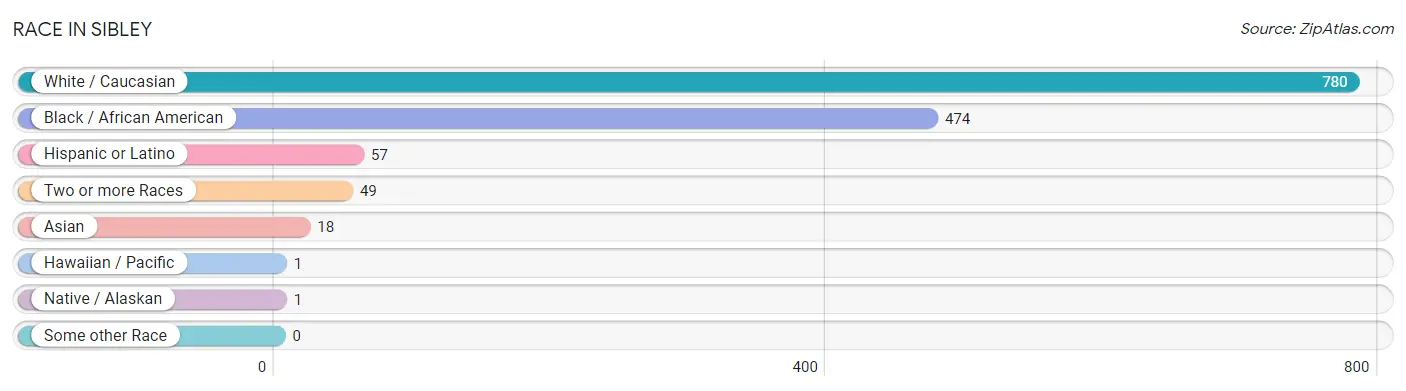
| Race | # Population | % Population |
| Asian | 18 | 1.4% |
| Black / African American | 474 | 35.8% |
| Hawaiian / Pacific | 1 | 0.1% |
| Hispanic or Latino | 57 | 4.3% |
| Native / Alaskan | 1 | 0.1% |
| White / Caucasian | 780 | 59.0% |
| Two or more Races | 49 | 3.7% |
| Some other Race | 0 | 0.0% |
| Total | 1,323 | 100.0% |
Ancestry in Sibley
The most populous ancestries reported in Sibley are American (592 | 44.8%), English (105 | 7.9%), Irish (51 | 3.8%), Mexican (50 | 3.8%), and Korean (47 | 3.5%), together accounting for 63.9% of all Sibley residents.
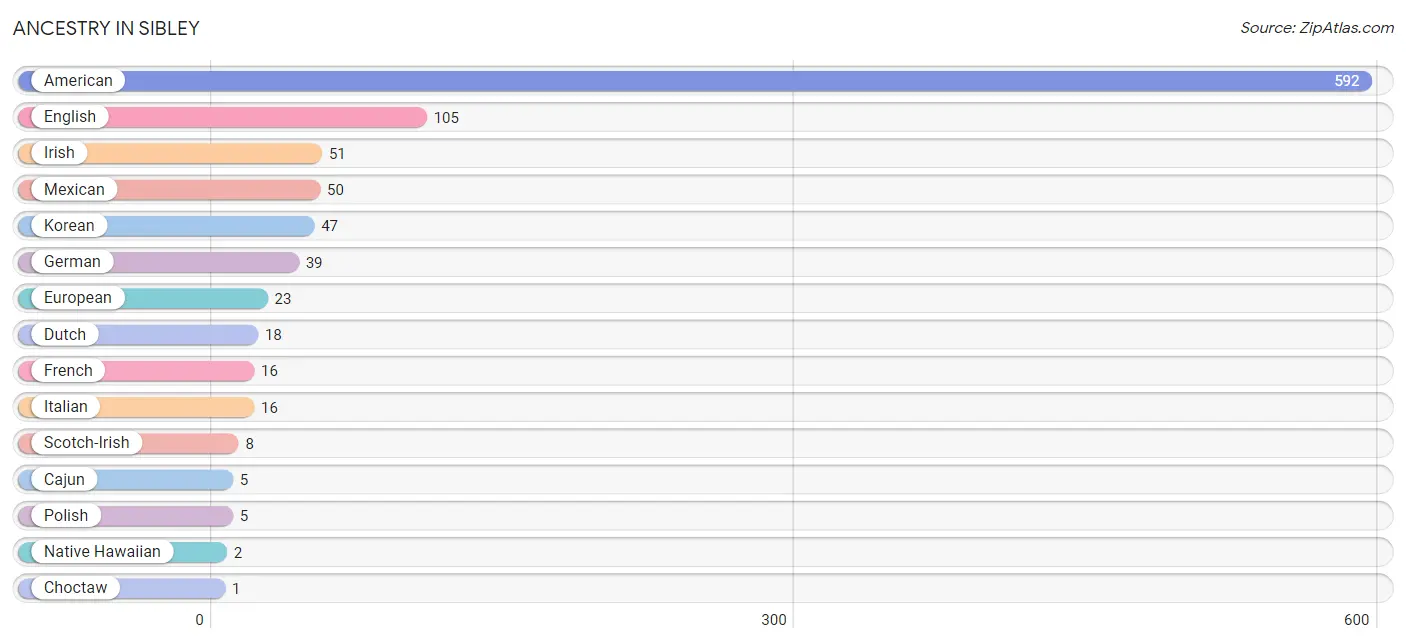
| Ancestry | # Population | % Population |
| American | 592 | 44.8% |
| Cajun | 5 | 0.4% |
| Choctaw | 1 | 0.1% |
| Dutch | 18 | 1.4% |
| English | 105 | 7.9% |
| European | 23 | 1.7% |
| French | 16 | 1.2% |
| German | 39 | 2.9% |
| Irish | 51 | 3.8% |
| Italian | 16 | 1.2% |
| Korean | 47 | 3.5% |
| Mexican | 50 | 3.8% |
| Native Hawaiian | 2 | 0.2% |
| Polish | 5 | 0.4% |
| Scotch-Irish | 8 | 0.6% | View All 15 Rows |
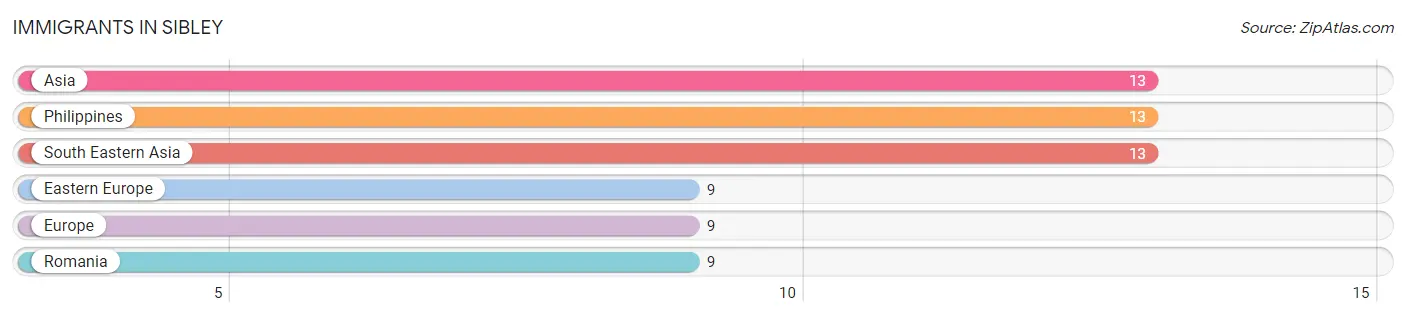
Immigrants in Sibley
The most numerous immigrant groups reported in Sibley came from Asia (13 | 1.0%), Philippines (13 | 1.0%), South Eastern Asia (13 | 1.0%), Eastern Europe (9 | 0.7%), and Europe (9 | 0.7%), together accounting for 4.3% of all Sibley residents.
| Immigration Origin | # Population | % Population |
| Asia | 13 | 1.0% |
| Eastern Europe | 9 | 0.7% |
| Europe | 9 | 0.7% |
| Philippines | 13 | 1.0% |
| Romania | 9 | 0.7% |
| South Eastern Asia | 13 | 1.0% | View All 6 Rows |
Sex and Age in Sibley
Sex and Age in Sibley
The most populous age groups in Sibley are 15 to 19 Years (108 | 16.3%) for men and 45 to 49 Years (77 | 11.7%) for women.
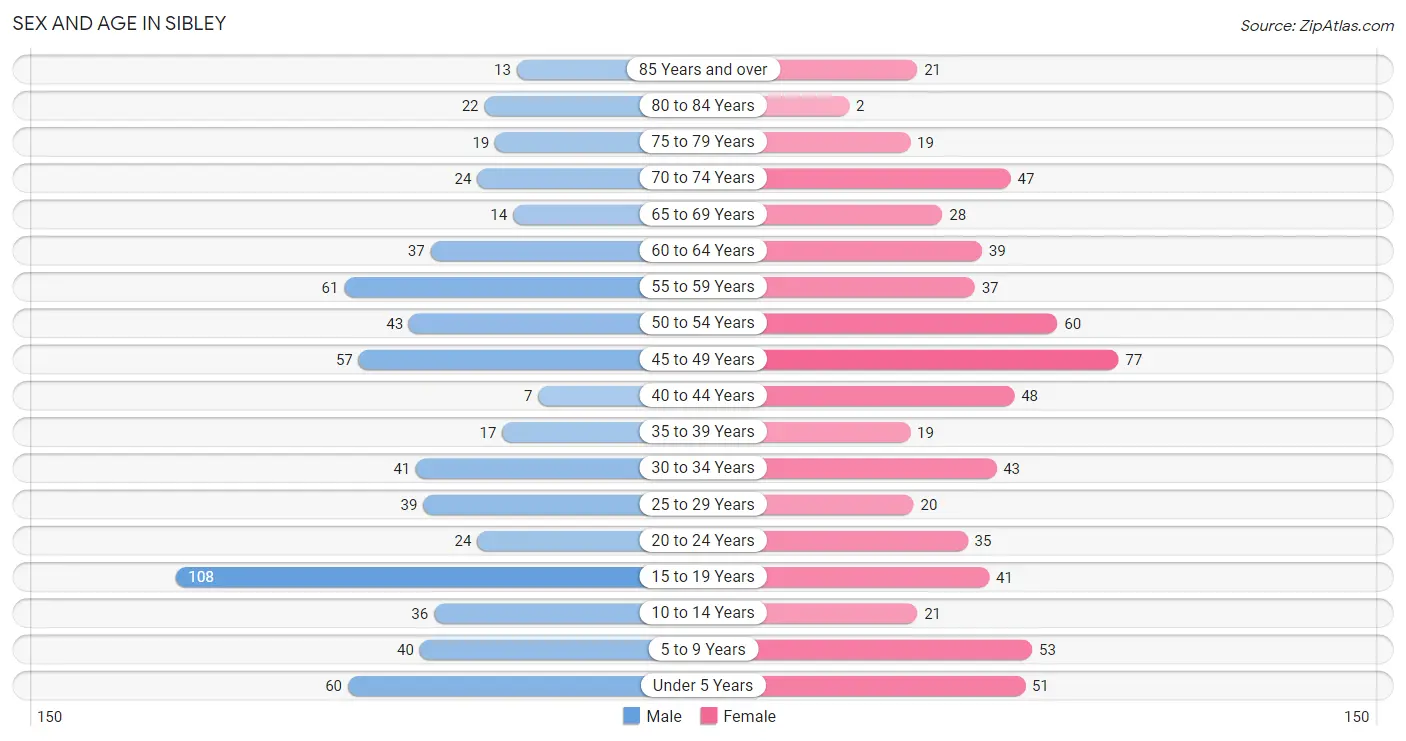
| Age Bracket | Male | Female |
| Under 5 Years | 60 (9.1%) | 51 (7.7%) |
| 5 to 9 Years | 40 (6.0%) | 53 (8.0%) |
| 10 to 14 Years | 36 (5.4%) | 21 (3.2%) |
| 15 to 19 Years | 108 (16.3%) | 41 (6.2%) |
| 20 to 24 Years | 24 (3.6%) | 35 (5.3%) |
| 25 to 29 Years | 39 (5.9%) | 20 (3.0%) |
| 30 to 34 Years | 41 (6.2%) | 43 (6.5%) |
| 35 to 39 Years | 17 (2.6%) | 19 (2.9%) |
| 40 to 44 Years | 7 (1.1%) | 48 (7.3%) |
| 45 to 49 Years | 57 (8.6%) | 77 (11.7%) |
| 50 to 54 Years | 43 (6.5%) | 60 (9.1%) |
| 55 to 59 Years | 61 (9.2%) | 37 (5.6%) |
| 60 to 64 Years | 37 (5.6%) | 39 (5.9%) |
| 65 to 69 Years | 14 (2.1%) | 28 (4.2%) |
| 70 to 74 Years | 24 (3.6%) | 47 (7.1%) |
| 75 to 79 Years | 19 (2.9%) | 19 (2.9%) |
| 80 to 84 Years | 22 (3.3%) | 2 (0.3%) |
| 85 Years and over | 13 (2.0%) | 21 (3.2%) |
| Total | 662 (100.0%) | 661 (100.0%) |
Families and Households in Sibley
Median Family Size in Sibley
The median family size in Sibley is 3.38 persons per family, with single female/mother families (96 | 29.9%) accounting for the largest median family size of 3.6 persons per family. On the other hand, single male/father families (48 | 14.9%) represent the smallest median family size with 3.19 persons per family.
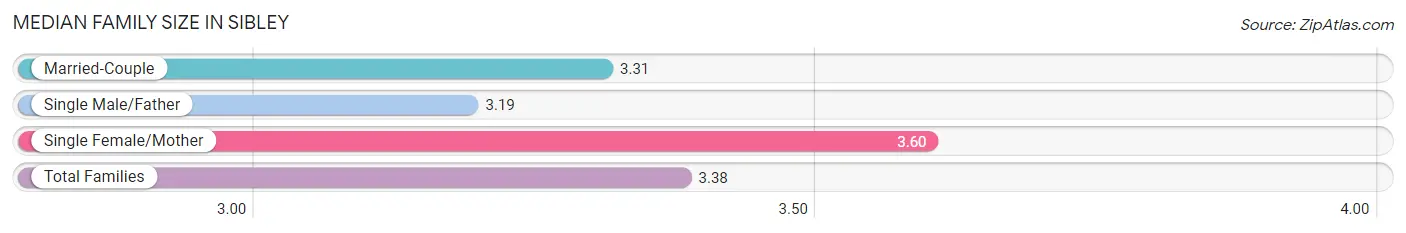
| Family Type | # Families | Family Size |
| Married-Couple | 177 (55.1%) | 3.31 |
| Single Male/Father | 48 (14.9%) | 3.19 |
| Single Female/Mother | 96 (29.9%) | 3.60 |
| Total Families | 321 (100.0%) | 3.38 |
Median Household Size in Sibley
The median household size in Sibley is 2.61 persons per household, with single female/mother households (96 | 18.9%) accounting for the largest median household size of 3.95 persons per household. non-family households (186 | 36.7%) represent the smallest median household size with 1.10 persons per household.
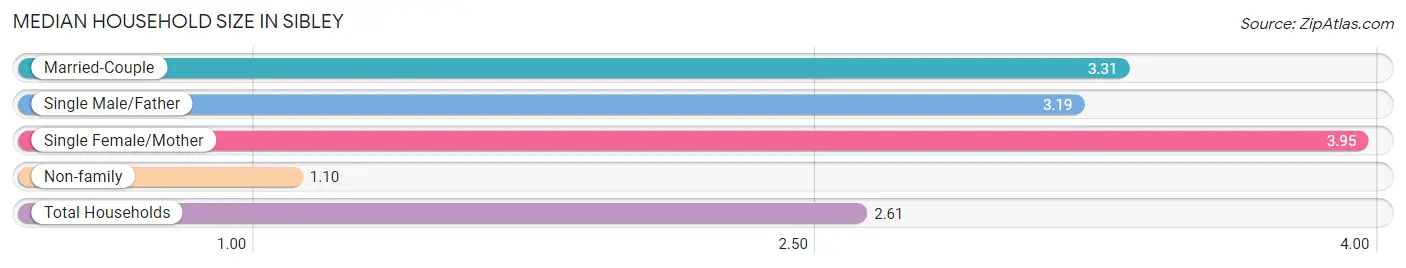
| Household Type | # Households | Household Size |
| Married-Couple | 177 (34.9%) | 3.31 |
| Single Male/Father | 48 (9.5%) | 3.19 |
| Single Female/Mother | 96 (18.9%) | 3.95 |
| Non-family | 186 (36.7%) | 1.10 |
| Total Households | 507 (100.0%) | 2.61 |
Household Size by Marriage Status in Sibley
Out of a total of 507 households in Sibley, 321 (63.3%) are family households, while 186 (36.7%) are nonfamily households. The most numerous type of family households are 3-person households, comprising 109, and the most common type of nonfamily households are 1-person households, comprising 163.
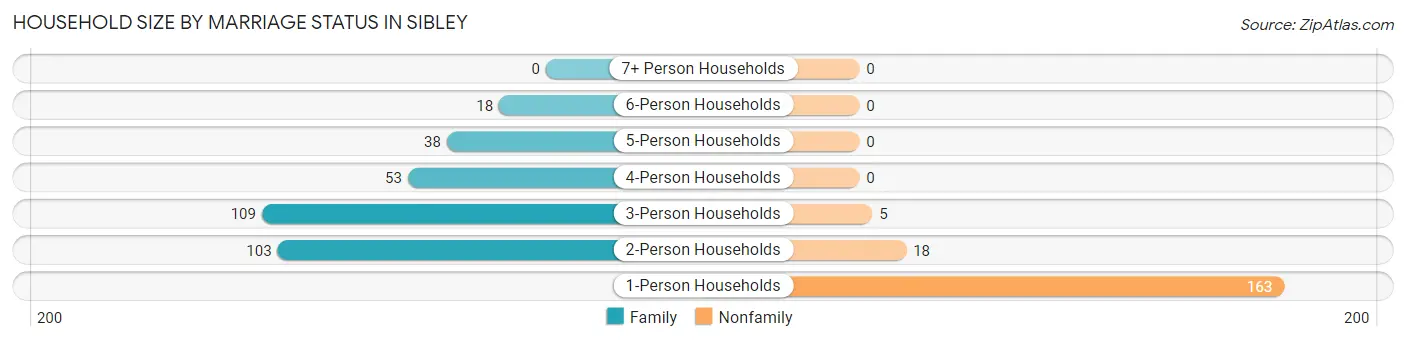
| Household Size | Family Households | Nonfamily Households |
| 1-Person Households | - | 163 (32.2%) |
| 2-Person Households | 103 (20.3%) | 18 (3.5%) |
| 3-Person Households | 109 (21.5%) | 5 (1.0%) |
| 4-Person Households | 53 (10.4%) | 0 (0.0%) |
| 5-Person Households | 38 (7.5%) | 0 (0.0%) |
| 6-Person Households | 18 (3.5%) | 0 (0.0%) |
| 7+ Person Households | 0 (0.0%) | 0 (0.0%) |
| Total | 321 (63.3%) | 186 (36.7%) |
Female Fertility in Sibley
Fertility by Age in Sibley
Average fertility rate in Sibley is 127.0 births per 1,000 women. Women in the age bracket of 20 to 34 years have the highest fertility rate with 204.0 births per 1,000 women. Women in the age bracket of 20 to 34 years acount for 52.6% of all women with births.
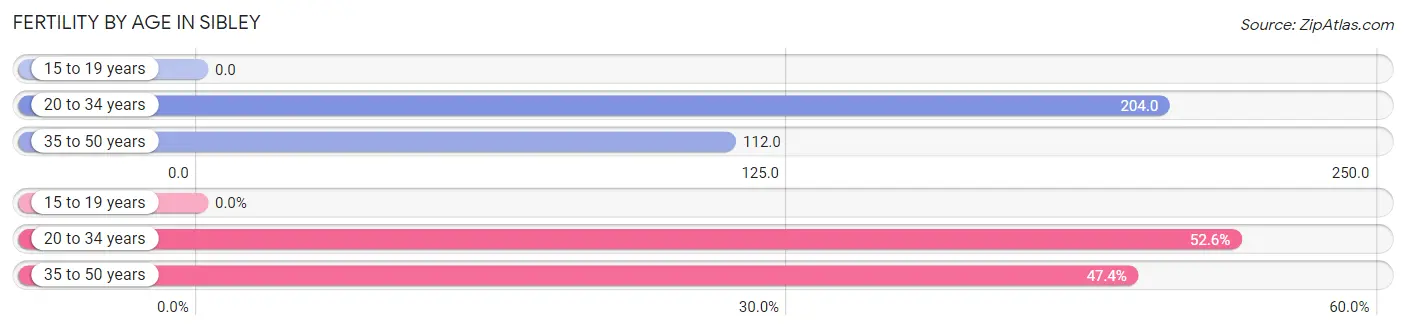
| Age Bracket | Women with Births | Births / 1,000 Women |
| 15 to 19 years | 0 (0.0%) | 0.0 |
| 20 to 34 years | 20 (52.6%) | 204.0 |
| 35 to 50 years | 18 (47.4%) | 112.0 |
| Total | 38 (100.0%) | 127.0 |
Fertility by Age by Marriage Status in Sibley
47.4% of women with births (38) in Sibley are married. The highest percentage of unmarried women with births falls into 20 to 34 years age bracket with 100.0% of them unmarried at the time of birth, while the lowest percentage of unmarried women with births belong to 35 to 50 years age bracket with 0.0% of them unmarried.
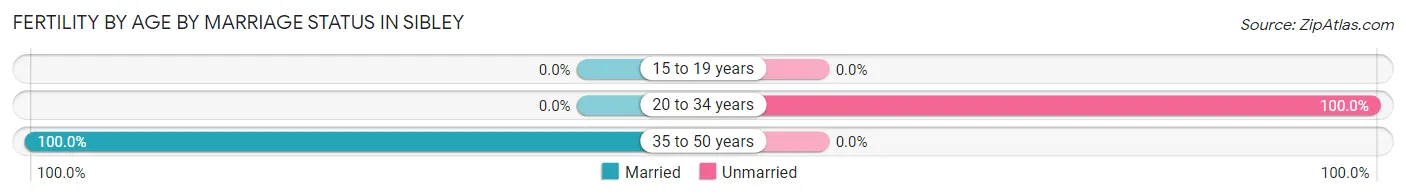
| Age Bracket | Married | Unmarried |
| 15 to 19 years | 0 (0.0%) | 0 (0.0%) |
| 20 to 34 years | 0 (0.0%) | 20 (100.0%) |
| 35 to 50 years | 18 (100.0%) | 0 (0.0%) |
| Total | 18 (47.4%) | 20 (52.6%) |
Fertility by Education in Sibley
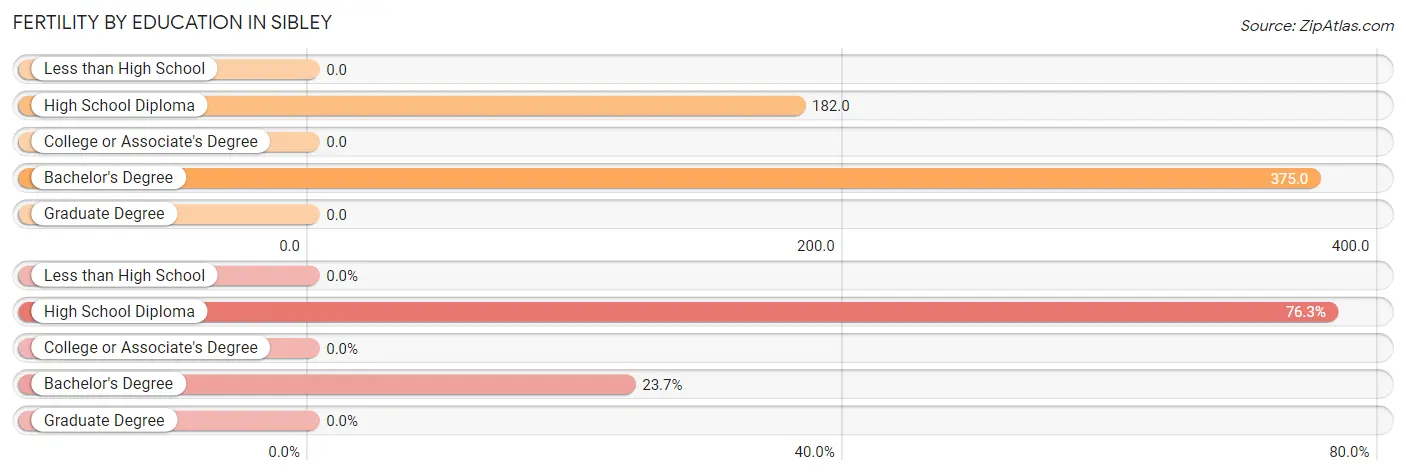
| Educational Attainment | Women with Births | Births / 1,000 Women |
| Less than High School | 0 (0.0%) | 0.0 |
| High School Diploma | 29 (76.3%) | 182.0 |
| College or Associate's Degree | 0 (0.0%) | 0.0 |
| Bachelor's Degree | 9 (23.7%) | 375.0 |
| Graduate Degree | 0 (0.0%) | 0.0 |
| Total | 38 (100.0%) | 127.0 |
Fertility by Education by Marriage Status in Sibley
52.6% of women with births in Sibley are unmarried. Women with the educational attainment of bachelor's degree are most likely to be married with 100.0% of them married at childbirth, while women with the educational attainment of high school diploma are least likely to be married with 69.0% of them unmarried at childbirth.
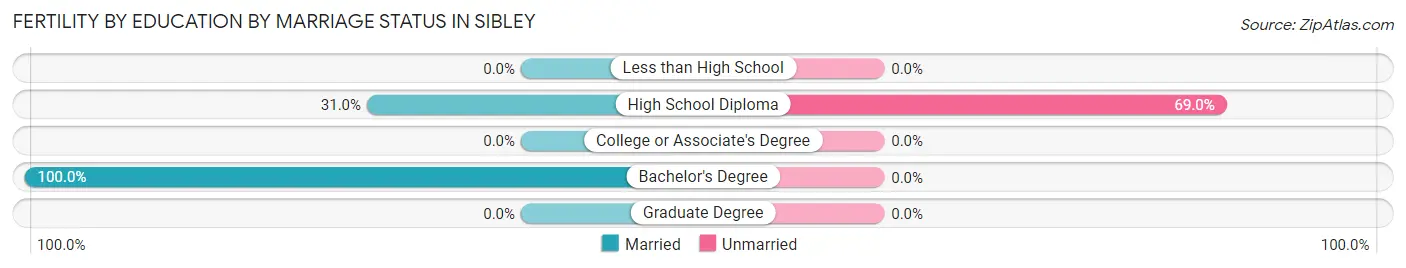
| Educational Attainment | Married | Unmarried |
| Less than High School | 0 (0.0%) | 0 (0.0%) |
| High School Diploma | 9 (31.0%) | 20 (69.0%) |
| College or Associate's Degree | 0 (0.0%) | 0 (0.0%) |
| Bachelor's Degree | 9 (100.0%) | 0 (0.0%) |
| Graduate Degree | 0 (0.0%) | 0 (0.0%) |
| Total | 18 (47.4%) | 20 (52.6%) |
Employment Characteristics in Sibley
Employment by Class of Employer in Sibley
Among the 491 employed individuals in Sibley, private company employees (377 | 76.8%), local government employees (29 | 5.9%), and not-for-profit organizations (28 | 5.7%) make up the most common classes of employment.
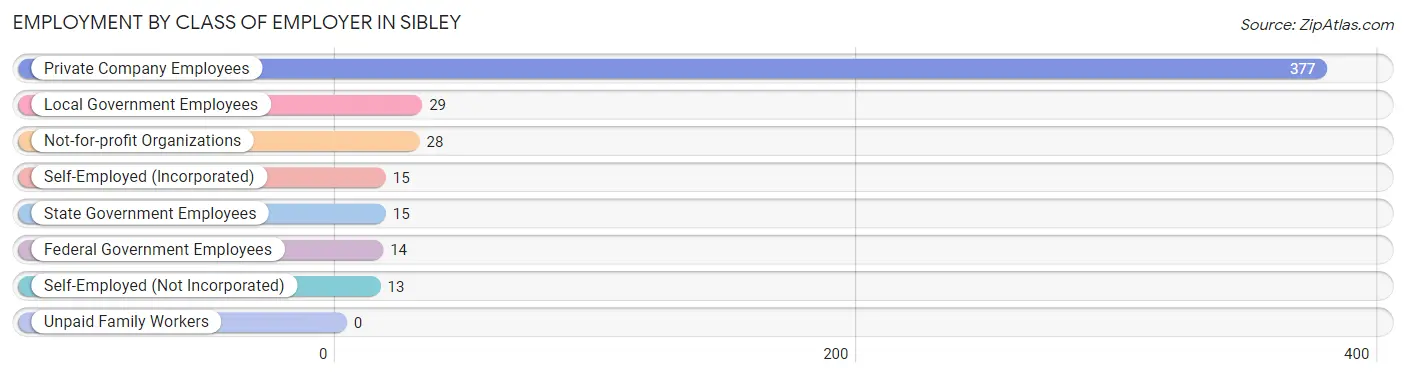
| Employer Class | # Employees | % Employees |
| Private Company Employees | 377 | 76.8% |
| Self-Employed (Incorporated) | 15 | 3.0% |
| Self-Employed (Not Incorporated) | 13 | 2.6% |
| Not-for-profit Organizations | 28 | 5.7% |
| Local Government Employees | 29 | 5.9% |
| State Government Employees | 15 | 3.0% |
| Federal Government Employees | 14 | 2.9% |
| Unpaid Family Workers | 0 | 0.0% |
| Total | 491 | 100.0% |
Employment Status by Age in Sibley
According to the labor force statistics for Sibley, out of the total population over 16 years of age (1,040), 49.1% or 511 individuals are in the labor force, with 2.4% or 12 of them unemployed. The age group with the highest labor force participation rate is 35 to 44 years, with 82.4% or 75 individuals in the labor force. Within the labor force, the 20 to 24 years age range has the highest percentage of unemployed individuals, with 13.9% or 5 of them being unemployed.
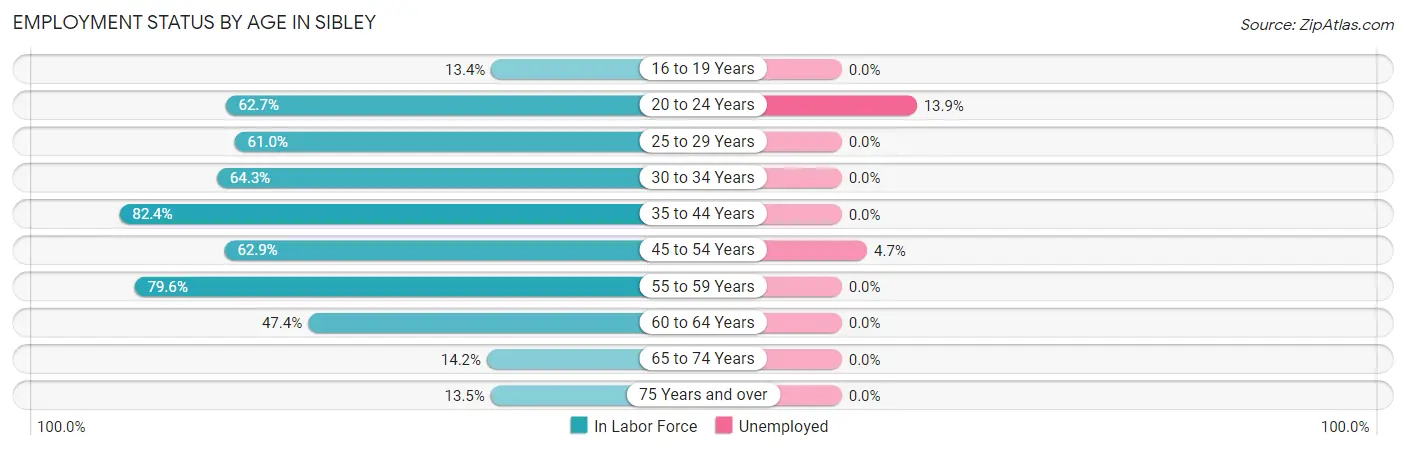
| Age Bracket | In Labor Force | Unemployed |
| 16 to 19 Years | 17 (13.4%) | 0 (0.0%) |
| 20 to 24 Years | 37 (62.7%) | 5 (13.9%) |
| 25 to 29 Years | 36 (61.0%) | 0 (0.0%) |
| 30 to 34 Years | 54 (64.3%) | 0 (0.0%) |
| 35 to 44 Years | 75 (82.4%) | 0 (0.0%) |
| 45 to 54 Years | 149 (62.9%) | 7 (4.7%) |
| 55 to 59 Years | 78 (79.6%) | 0 (0.0%) |
| 60 to 64 Years | 36 (47.4%) | 0 (0.0%) |
| 65 to 74 Years | 16 (14.2%) | 0 (0.0%) |
| 75 Years and over | 13 (13.5%) | 0 (0.0%) |
| Total | 511 (49.1%) | 12 (2.4%) |
Employment Status by Educational Attainment in Sibley
According to labor force statistics for Sibley, 66.4% of individuals (428) out of the total population between 25 and 64 years of age (645) are in the labor force, with 1.7% or 7 of them being unemployed. The group with the highest labor force participation rate are those with the educational attainment of bachelor's degree or higher, with 83.3% or 35 individuals in the labor force. Within the labor force, individuals with less than high school education have the highest percentage of unemployment, with 7.1% or 4 of them being unemployed.
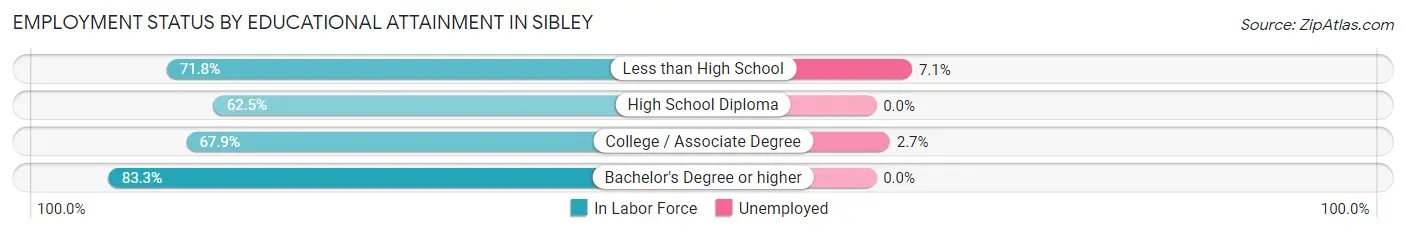
| Educational Attainment | In Labor Force | Unemployed |
| Less than High School | 56 (71.8%) | 6 (7.1%) |
| High School Diploma | 225 (62.5%) | 0 (0.0%) |
| College / Associate Degree | 112 (67.9%) | 4 (2.7%) |
| Bachelor's Degree or higher | 35 (83.3%) | 0 (0.0%) |
| Total | 428 (66.4%) | 11 (1.7%) |
Employment Occupations by Sex in Sibley
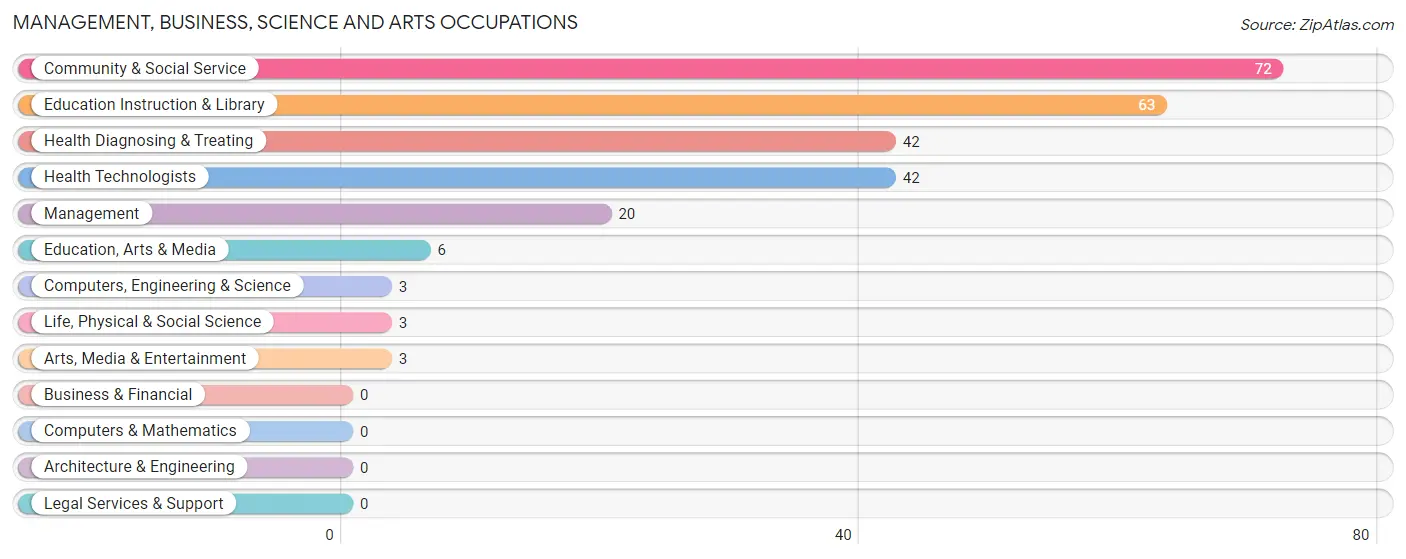
Management, Business, Science and Arts Occupations
The most common Management, Business, Science and Arts occupations in Sibley are Community & Social Service (72 | 14.6%), Education Instruction & Library (63 | 12.8%), Health Diagnosing & Treating (42 | 8.5%), Health Technologists (42 | 8.5%), and Management (20 | 4.1%).
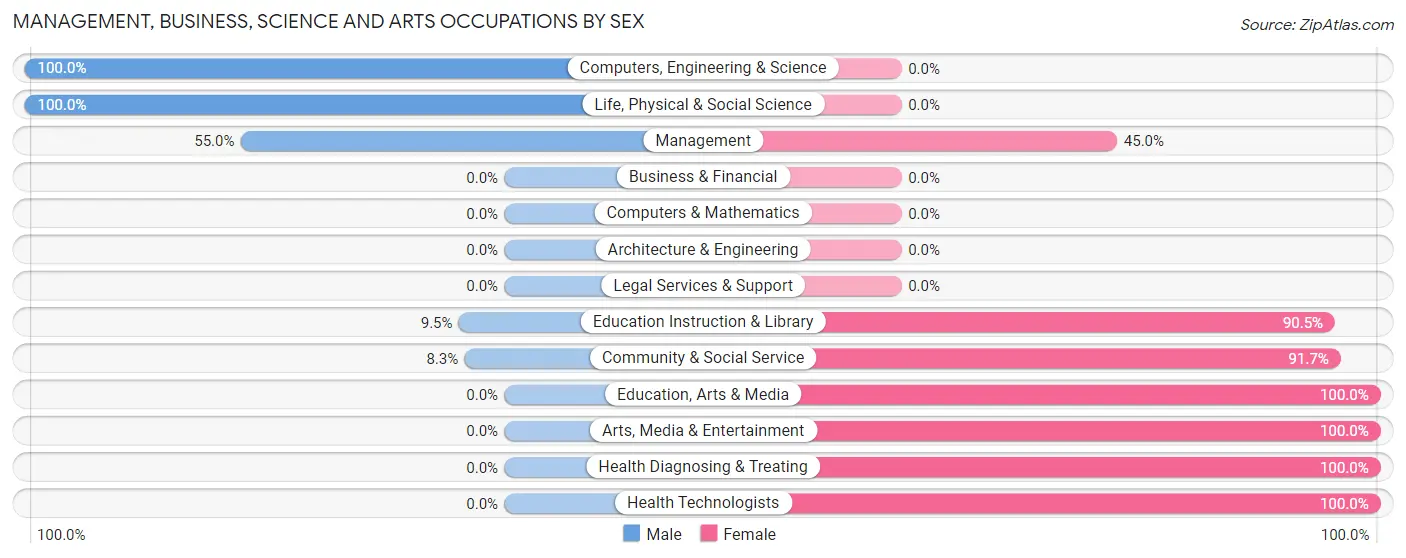
Management, Business, Science and Arts Occupations by Sex
Within the Management, Business, Science and Arts occupations in Sibley, the most male-oriented occupations are Computers, Engineering & Science (100.0%), Life, Physical & Social Science (100.0%), and Management (55.0%), while the most female-oriented occupations are Education, Arts & Media (100.0%), Arts, Media & Entertainment (100.0%), and Health Diagnosing & Treating (100.0%).
| Occupation | Male | Female |
| Management | 11 (55.0%) | 9 (45.0%) |
| Business & Financial | 0 (0.0%) | 0 (0.0%) |
| Computers, Engineering & Science | 3 (100.0%) | 0 (0.0%) |
| Computers & Mathematics | 0 (0.0%) | 0 (0.0%) |
| Architecture & Engineering | 0 (0.0%) | 0 (0.0%) |
| Life, Physical & Social Science | 3 (100.0%) | 0 (0.0%) |
| Community & Social Service | 6 (8.3%) | 66 (91.7%) |
| Education, Arts & Media | 0 (0.0%) | 6 (100.0%) |
| Legal Services & Support | 0 (0.0%) | 0 (0.0%) |
| Education Instruction & Library | 6 (9.5%) | 57 (90.5%) |
| Arts, Media & Entertainment | 0 (0.0%) | 3 (100.0%) |
| Health Diagnosing & Treating | 0 (0.0%) | 42 (100.0%) |
| Health Technologists | 0 (0.0%) | 42 (100.0%) |
| Total (Category) | 20 (14.6%) | 117 (85.4%) |
| Total (Overall) | 259 (52.5%) | 234 (47.5%) |
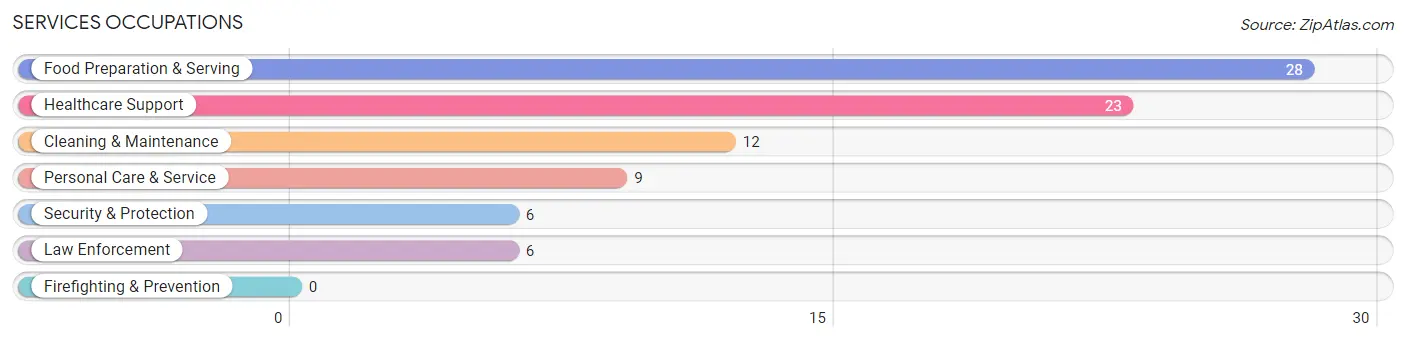
Services Occupations
The most common Services occupations in Sibley are Food Preparation & Serving (28 | 5.7%), Healthcare Support (23 | 4.7%), Cleaning & Maintenance (12 | 2.4%), Personal Care & Service (9 | 1.8%), and Security & Protection (6 | 1.2%).
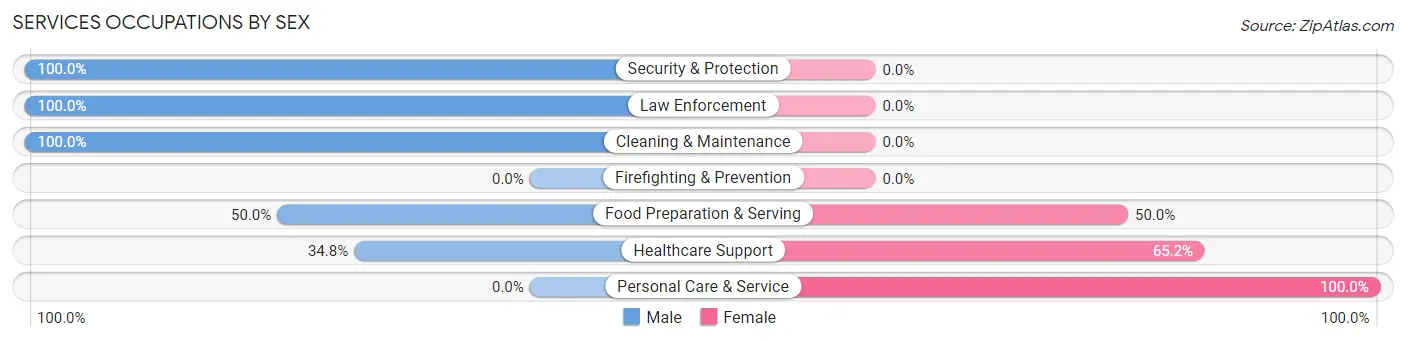
Services Occupations by Sex
Within the Services occupations in Sibley, the most male-oriented occupations are Security & Protection (100.0%), Law Enforcement (100.0%), and Cleaning & Maintenance (100.0%), while the most female-oriented occupations are Personal Care & Service (100.0%), Healthcare Support (65.2%), and Food Preparation & Serving (50.0%).
| Occupation | Male | Female |
| Healthcare Support | 8 (34.8%) | 15 (65.2%) |
| Security & Protection | 6 (100.0%) | 0 (0.0%) |
| Firefighting & Prevention | 0 (0.0%) | 0 (0.0%) |
| Law Enforcement | 6 (100.0%) | 0 (0.0%) |
| Food Preparation & Serving | 14 (50.0%) | 14 (50.0%) |
| Cleaning & Maintenance | 12 (100.0%) | 0 (0.0%) |
| Personal Care & Service | 0 (0.0%) | 9 (100.0%) |
| Total (Category) | 40 (51.3%) | 38 (48.7%) |
| Total (Overall) | 259 (52.5%) | 234 (47.5%) |
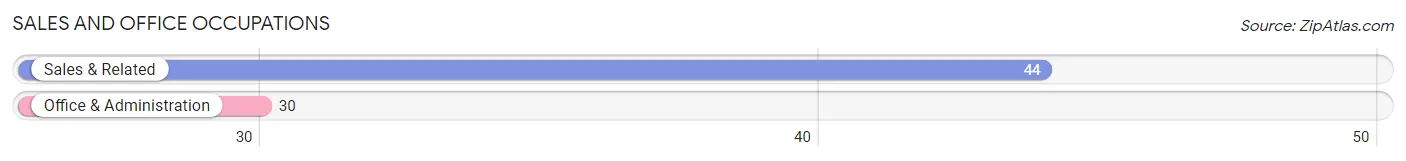
Sales and Office Occupations
The most common Sales and Office occupations in Sibley are Sales & Related (44 | 8.9%), and Office & Administration (30 | 6.1%).
Sales and Office Occupations by Sex
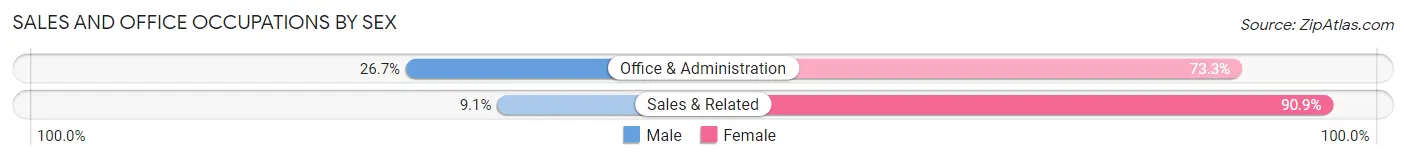
| Occupation | Male | Female |
| Sales & Related | 4 (9.1%) | 40 (90.9%) |
| Office & Administration | 8 (26.7%) | 22 (73.3%) |
| Total (Category) | 12 (16.2%) | 62 (83.8%) |
| Total (Overall) | 259 (52.5%) | 234 (47.5%) |
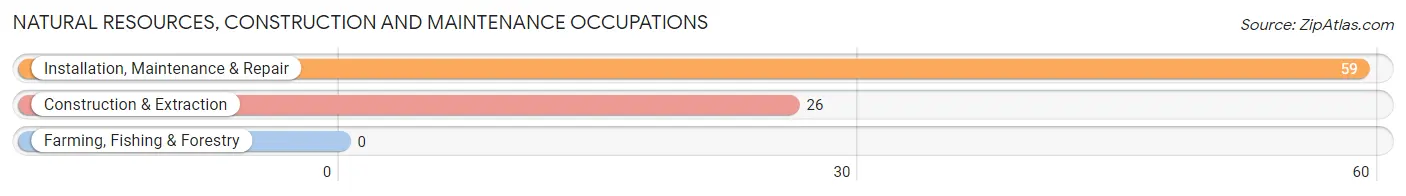
Natural Resources, Construction and Maintenance Occupations
The most common Natural Resources, Construction and Maintenance occupations in Sibley are Installation, Maintenance & Repair (59 | 12.0%), and Construction & Extraction (26 | 5.3%).
Natural Resources, Construction and Maintenance Occupations by Sex
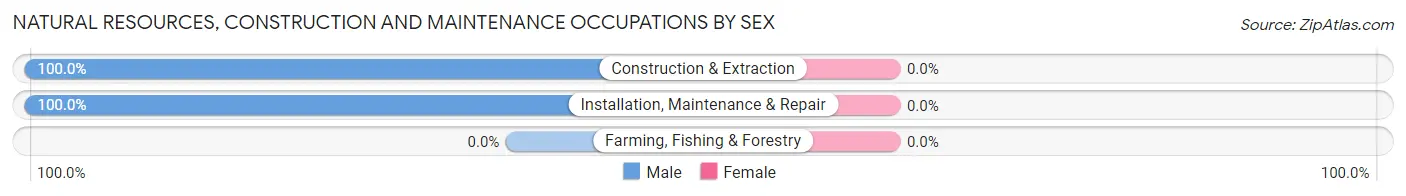
| Occupation | Male | Female |
| Farming, Fishing & Forestry | 0 (0.0%) | 0 (0.0%) |
| Construction & Extraction | 26 (100.0%) | 0 (0.0%) |
| Installation, Maintenance & Repair | 59 (100.0%) | 0 (0.0%) |
| Total (Category) | 85 (100.0%) | 0 (0.0%) |
| Total (Overall) | 259 (52.5%) | 234 (47.5%) |
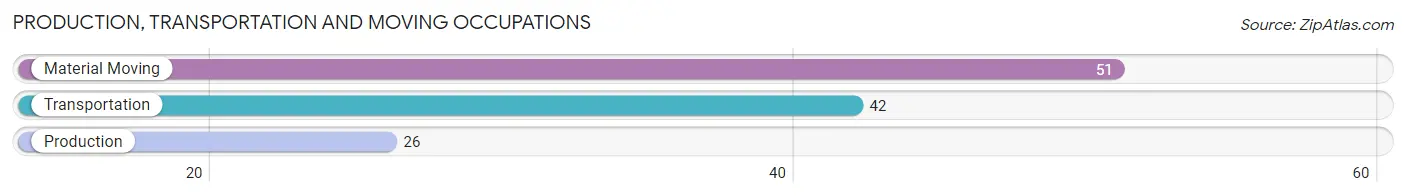
Production, Transportation and Moving Occupations
The most common Production, Transportation and Moving occupations in Sibley are Material Moving (51 | 10.3%), Transportation (42 | 8.5%), and Production (26 | 5.3%).
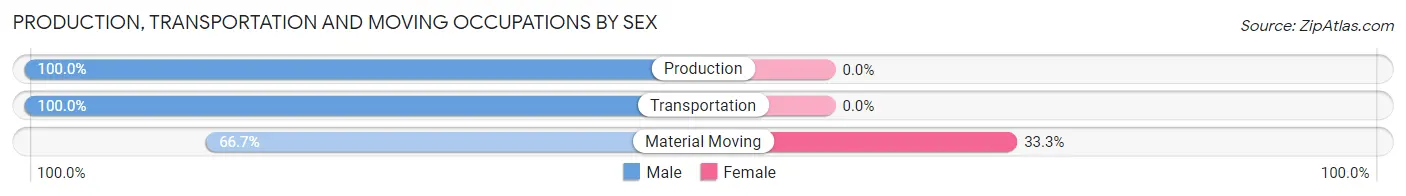
Production, Transportation and Moving Occupations by Sex
| Occupation | Male | Female |
| Production | 26 (100.0%) | 0 (0.0%) |
| Transportation | 42 (100.0%) | 0 (0.0%) |
| Material Moving | 34 (66.7%) | 17 (33.3%) |
| Total (Category) | 102 (85.7%) | 17 (14.3%) |
| Total (Overall) | 259 (52.5%) | 234 (47.5%) |
Employment Industries by Sex in Sibley
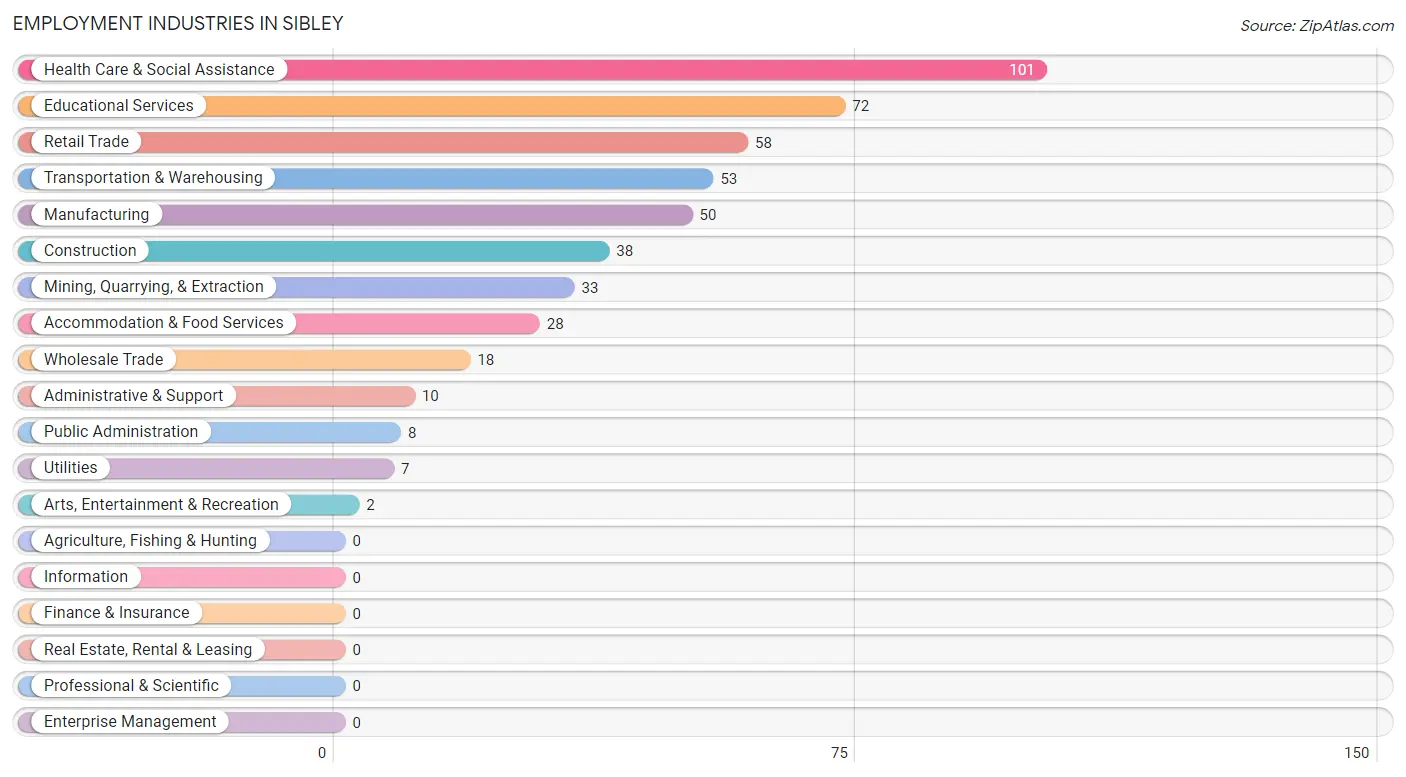
Employment Industries in Sibley
The major employment industries in Sibley include Health Care & Social Assistance (101 | 20.5%), Educational Services (72 | 14.6%), Retail Trade (58 | 11.8%), Transportation & Warehousing (53 | 10.7%), and Manufacturing (50 | 10.1%).
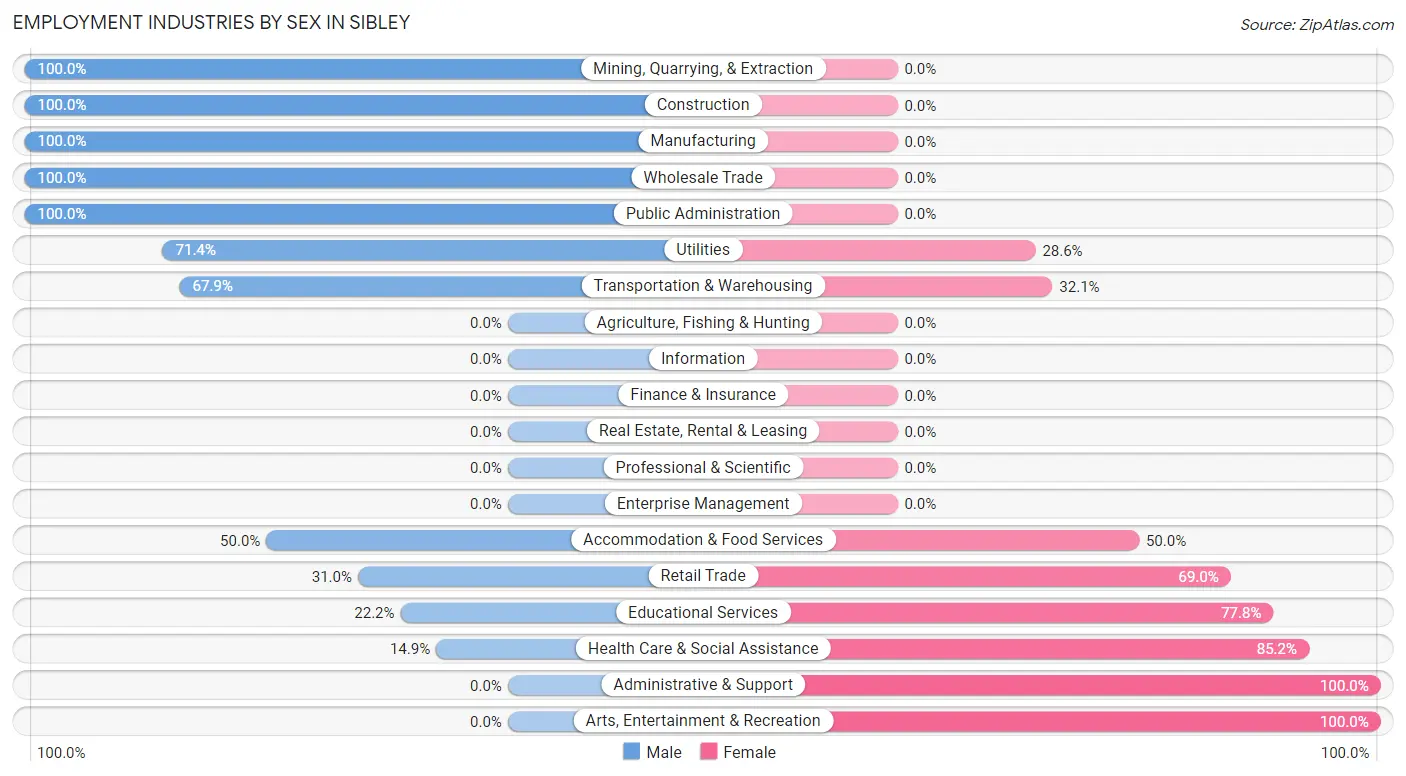
Employment Industries by Sex in Sibley
The Sibley industries that see more men than women are Mining, Quarrying, & Extraction (100.0%), Construction (100.0%), and Manufacturing (100.0%), whereas the industries that tend to have a higher number of women are Administrative & Support (100.0%), Arts, Entertainment & Recreation (100.0%), and Health Care & Social Assistance (85.2%).
| Industry | Male | Female |
| Agriculture, Fishing & Hunting | 0 (0.0%) | 0 (0.0%) |
| Mining, Quarrying, & Extraction | 33 (100.0%) | 0 (0.0%) |
| Construction | 38 (100.0%) | 0 (0.0%) |
| Manufacturing | 50 (100.0%) | 0 (0.0%) |
| Wholesale Trade | 18 (100.0%) | 0 (0.0%) |
| Retail Trade | 18 (31.0%) | 40 (69.0%) |
| Transportation & Warehousing | 36 (67.9%) | 17 (32.1%) |
| Utilities | 5 (71.4%) | 2 (28.6%) |
| Information | 0 (0.0%) | 0 (0.0%) |
| Finance & Insurance | 0 (0.0%) | 0 (0.0%) |
| Real Estate, Rental & Leasing | 0 (0.0%) | 0 (0.0%) |
| Professional & Scientific | 0 (0.0%) | 0 (0.0%) |
| Enterprise Management | 0 (0.0%) | 0 (0.0%) |
| Administrative & Support | 0 (0.0%) | 10 (100.0%) |
| Educational Services | 16 (22.2%) | 56 (77.8%) |
| Health Care & Social Assistance | 15 (14.8%) | 86 (85.2%) |
| Arts, Entertainment & Recreation | 0 (0.0%) | 2 (100.0%) |
| Accommodation & Food Services | 14 (50.0%) | 14 (50.0%) |
| Public Administration | 8 (100.0%) | 0 (0.0%) |
| Total | 259 (52.5%) | 234 (47.5%) |
Education in Sibley
School Enrollment in Sibley
The most common levels of schooling among the 353 students in Sibley are high school (123 | 34.8%), elementary school (87 | 24.6%), and college / undergraduate (45 | 12.8%).
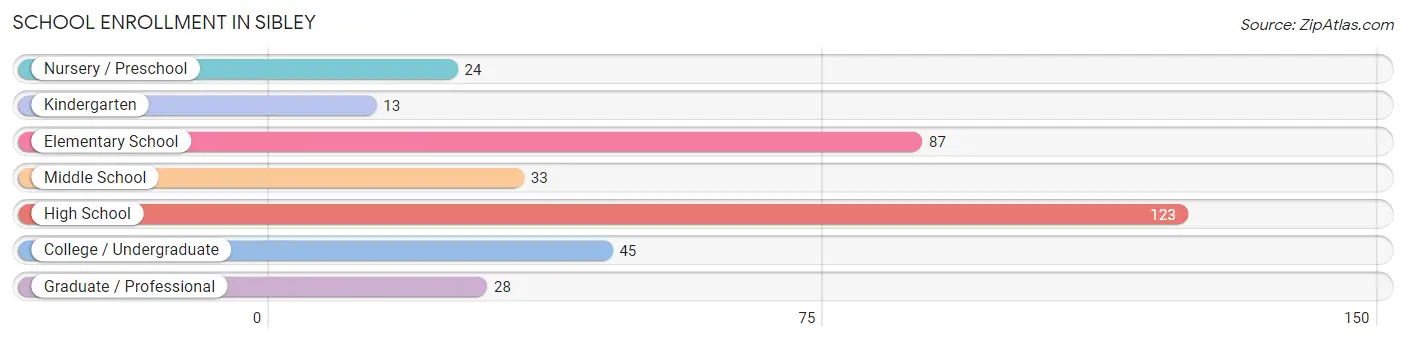
| School Level | # Students | % Students |
| Nursery / Preschool | 24 | 6.8% |
| Kindergarten | 13 | 3.7% |
| Elementary School | 87 | 24.6% |
| Middle School | 33 | 9.3% |
| High School | 123 | 34.8% |
| College / Undergraduate | 45 | 12.8% |
| Graduate / Professional | 28 | 7.9% |
| Total | 353 | 100.0% |
School Enrollment by Age by Funding Source in Sibley
Out of a total of 353 students who are enrolled in schools in Sibley, 49 (13.9%) attend a private institution, while the remaining 304 (86.1%) are enrolled in public schools. The age group of 25 to 34 year olds has the highest likelihood of being enrolled in private schools, with 13 (43.3% in the age bracket) enrolled. Conversely, the age group of 3 to 4 year olds has the lowest likelihood of being enrolled in a private school, with 14 (100.0% in the age bracket) attending a public institution.
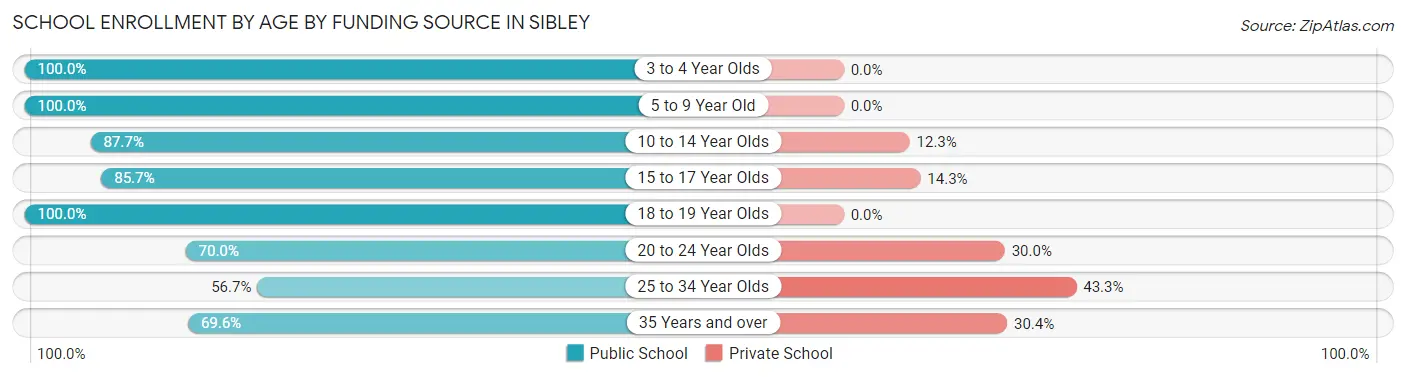
| Age Bracket | Public School | Private School |
| 3 to 4 Year Olds | 14 (100.0%) | 0 (0.0%) |
| 5 to 9 Year Old | 93 (100.0%) | 0 (0.0%) |
| 10 to 14 Year Olds | 50 (87.7%) | 7 (12.3%) |
| 15 to 17 Year Olds | 96 (85.7%) | 16 (14.3%) |
| 18 to 19 Year Olds | 4 (100.0%) | 0 (0.0%) |
| 20 to 24 Year Olds | 14 (70.0%) | 6 (30.0%) |
| 25 to 34 Year Olds | 17 (56.7%) | 13 (43.3%) |
| 35 Years and over | 16 (69.6%) | 7 (30.4%) |
| Total | 304 (86.1%) | 49 (13.9%) |
Educational Attainment by Field of Study in Sibley
Education (19 | 29.7%), arts & humanities (19 | 29.7%), business (7 | 10.9%), liberal arts & history (6 | 9.4%), and science & technology (5 | 7.8%) are the most common fields of study among 64 individuals in Sibley who have obtained a bachelor's degree or higher.
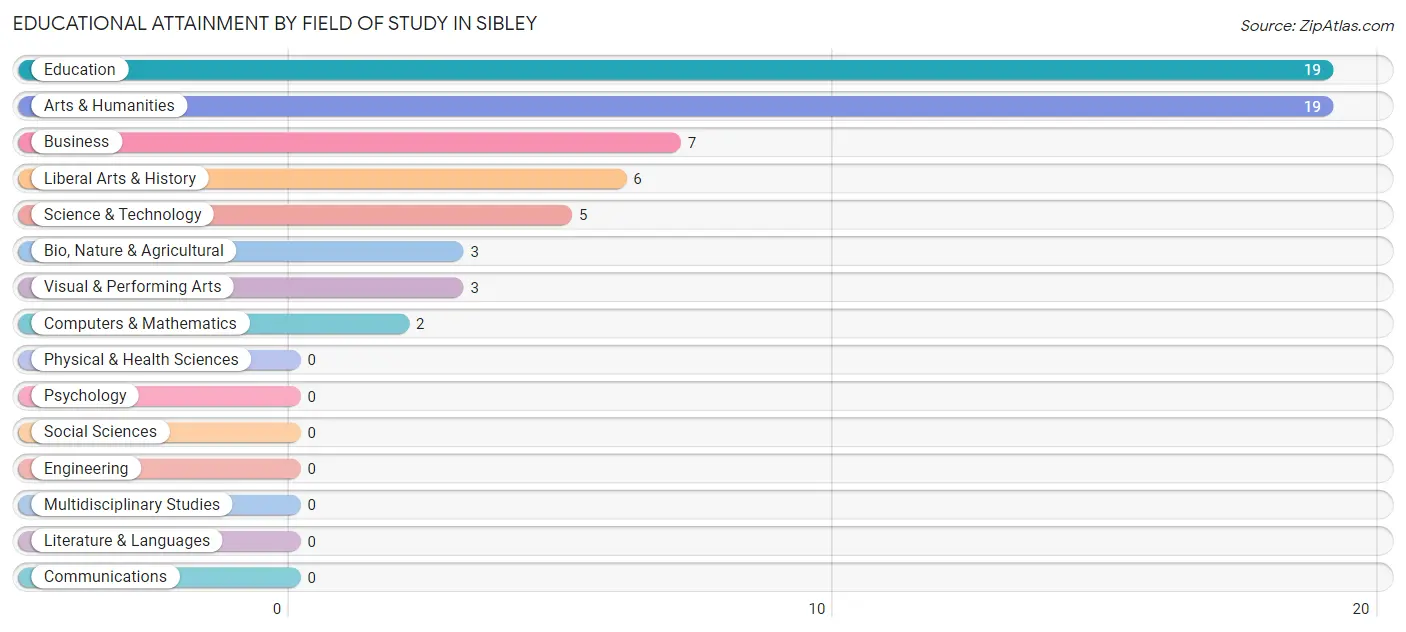
| Field of Study | # Graduates | % Graduates |
| Computers & Mathematics | 2 | 3.1% |
| Bio, Nature & Agricultural | 3 | 4.7% |
| Physical & Health Sciences | 0 | 0.0% |
| Psychology | 0 | 0.0% |
| Social Sciences | 0 | 0.0% |
| Engineering | 0 | 0.0% |
| Multidisciplinary Studies | 0 | 0.0% |
| Science & Technology | 5 | 7.8% |
| Business | 7 | 10.9% |
| Education | 19 | 29.7% |
| Literature & Languages | 0 | 0.0% |
| Liberal Arts & History | 6 | 9.4% |
| Visual & Performing Arts | 3 | 4.7% |
| Communications | 0 | 0.0% |
| Arts & Humanities | 19 | 29.7% |
| Total | 64 | 100.0% |
Transportation & Commute in Sibley
Vehicle Availability by Sex in Sibley
The most prevalent vehicle ownership categories in Sibley are males with 3 vehicles (91, accounting for 34.7%) and females with 3 vehicles (77, making up 39.7%).
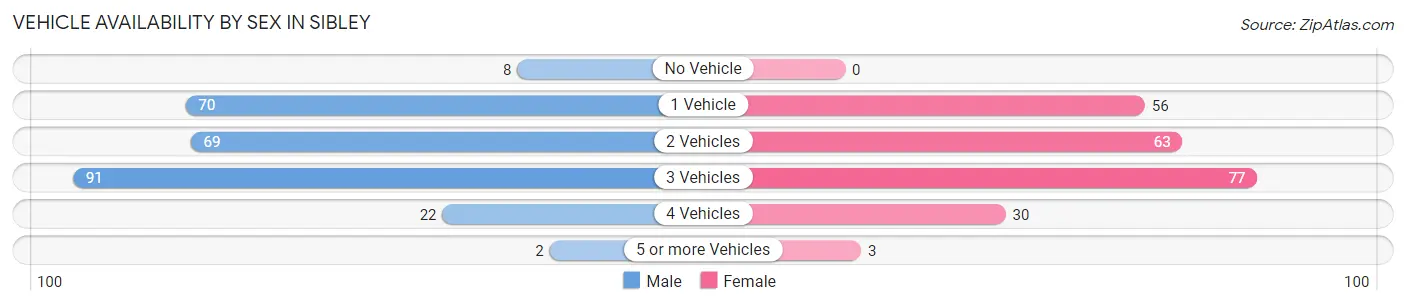
| Vehicles Available | Male | Female |
| No Vehicle | 8 (3.0%) | 0 (0.0%) |
| 1 Vehicle | 70 (26.7%) | 56 (24.4%) |
| 2 Vehicles | 69 (26.3%) | 63 (27.5%) |
| 3 Vehicles | 91 (34.7%) | 77 (33.6%) |
| 4 Vehicles | 22 (8.4%) | 30 (13.1%) |
| 5 or more Vehicles | 2 (0.8%) | 3 (1.3%) |
| Total | 262 (100.0%) | 229 (100.0%) |
Commute Time in Sibley
The most frequently occuring commute durations in Sibley are 15 to 19 minutes (118 commuters, 24.3%), 20 to 24 minutes (75 commuters, 15.5%), and 45 to 59 minutes (58 commuters, 12.0%).
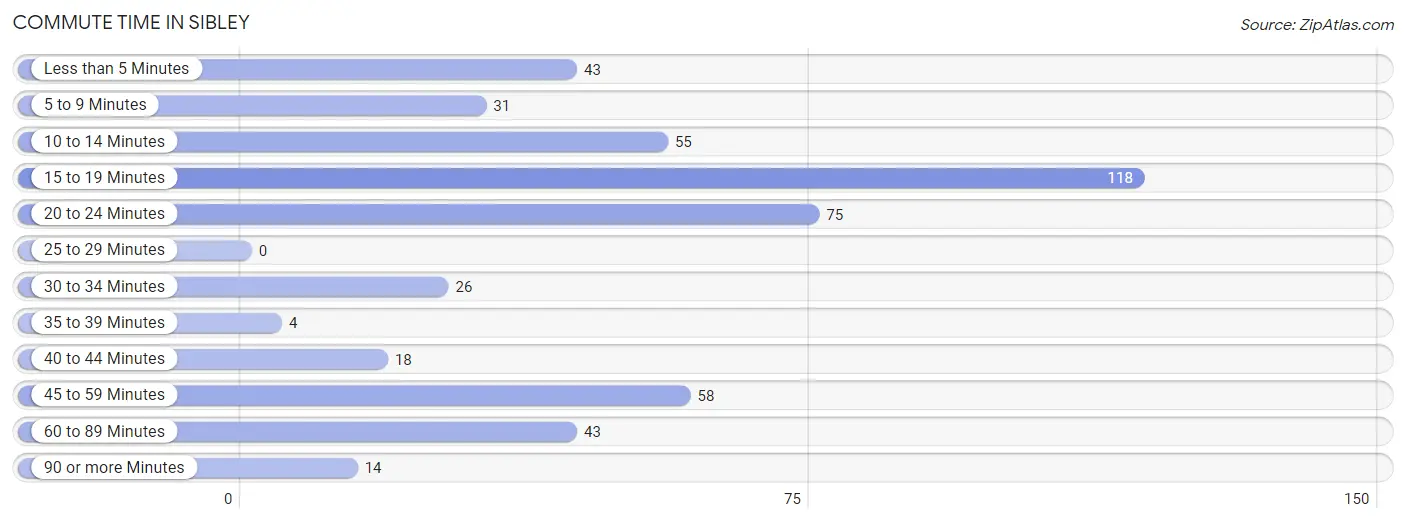
| Commute Time | # Commuters | % Commuters |
| Less than 5 Minutes | 43 | 8.9% |
| 5 to 9 Minutes | 31 | 6.4% |
| 10 to 14 Minutes | 55 | 11.3% |
| 15 to 19 Minutes | 118 | 24.3% |
| 20 to 24 Minutes | 75 | 15.5% |
| 25 to 29 Minutes | 0 | 0.0% |
| 30 to 34 Minutes | 26 | 5.4% |
| 35 to 39 Minutes | 4 | 0.8% |
| 40 to 44 Minutes | 18 | 3.7% |
| 45 to 59 Minutes | 58 | 12.0% |
| 60 to 89 Minutes | 43 | 8.9% |
| 90 or more Minutes | 14 | 2.9% |
Commute Time by Sex in Sibley
The most common commute times in Sibley are 20 to 24 minutes (46 commuters, 18.0%) for males and 15 to 19 minutes (99 commuters, 43.2%) for females.
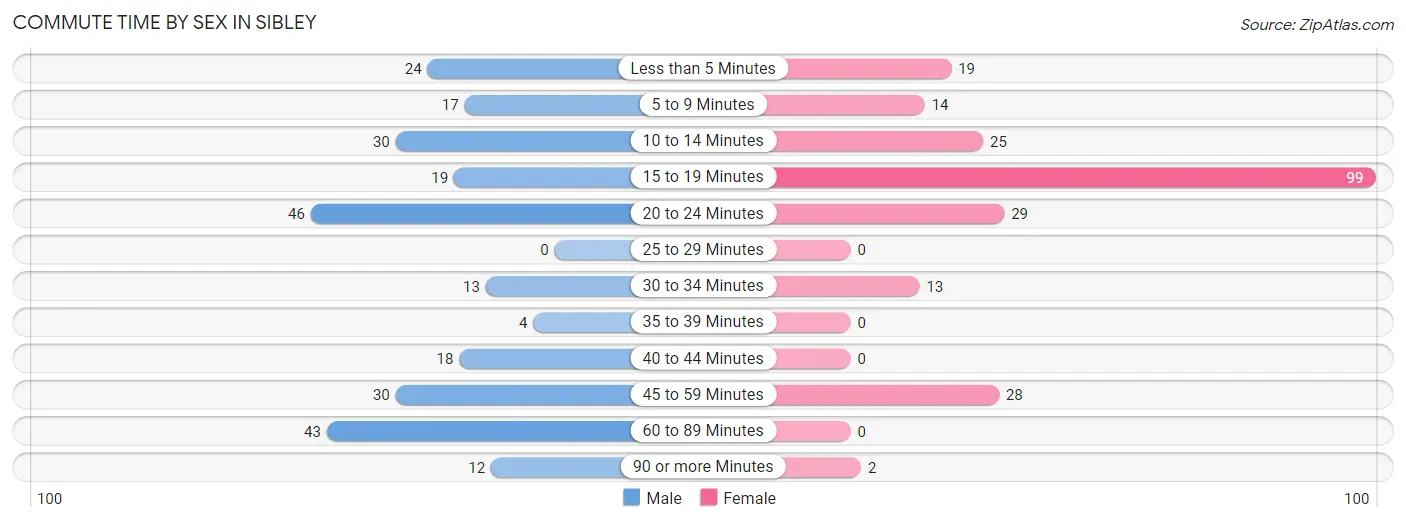
| Commute Time | Male | Female |
| Less than 5 Minutes | 24 (9.4%) | 19 (8.3%) |
| 5 to 9 Minutes | 17 (6.6%) | 14 (6.1%) |
| 10 to 14 Minutes | 30 (11.7%) | 25 (10.9%) |
| 15 to 19 Minutes | 19 (7.4%) | 99 (43.2%) |
| 20 to 24 Minutes | 46 (18.0%) | 29 (12.7%) |
| 25 to 29 Minutes | 0 (0.0%) | 0 (0.0%) |
| 30 to 34 Minutes | 13 (5.1%) | 13 (5.7%) |
| 35 to 39 Minutes | 4 (1.6%) | 0 (0.0%) |
| 40 to 44 Minutes | 18 (7.0%) | 0 (0.0%) |
| 45 to 59 Minutes | 30 (11.7%) | 28 (12.2%) |
| 60 to 89 Minutes | 43 (16.8%) | 0 (0.0%) |
| 90 or more Minutes | 12 (4.7%) | 2 (0.9%) |
Time of Departure to Work by Sex in Sibley
The most frequent times of departure to work in Sibley are 7:00 AM to 7:29 AM (41, 16.0%) for males and 7:00 AM to 7:29 AM (59, 25.8%) for females.
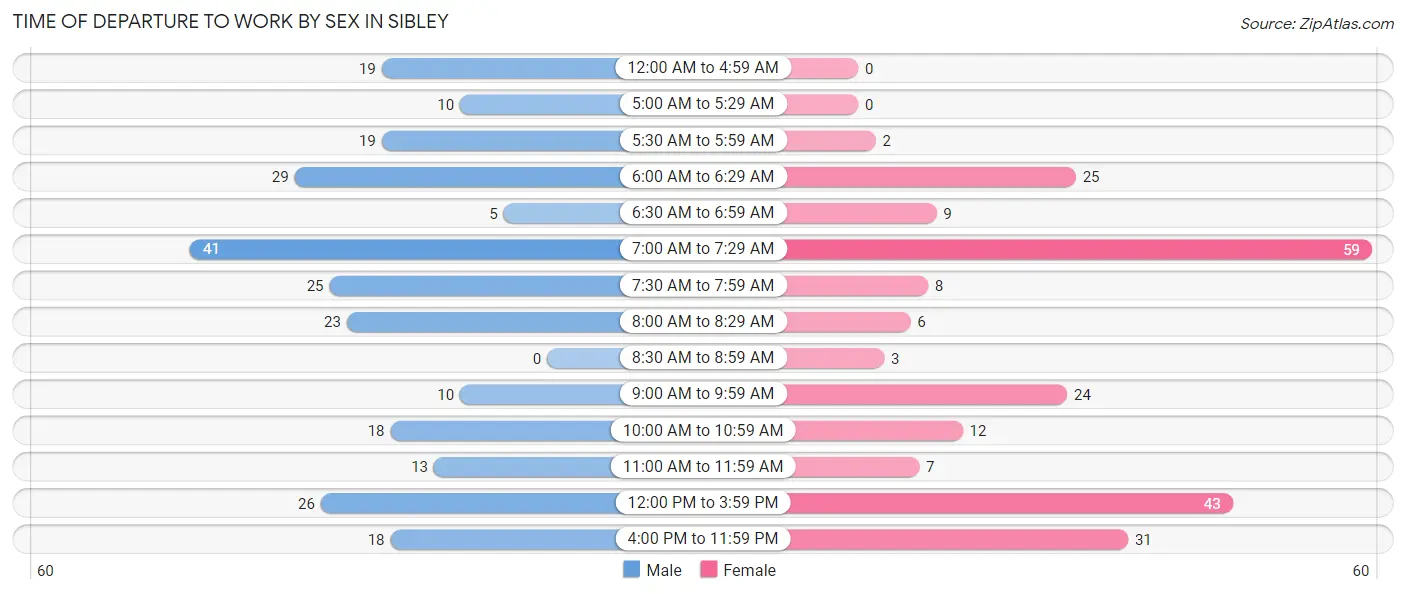
| Time of Departure | Male | Female |
| 12:00 AM to 4:59 AM | 19 (7.4%) | 0 (0.0%) |
| 5:00 AM to 5:29 AM | 10 (3.9%) | 0 (0.0%) |
| 5:30 AM to 5:59 AM | 19 (7.4%) | 2 (0.9%) |
| 6:00 AM to 6:29 AM | 29 (11.3%) | 25 (10.9%) |
| 6:30 AM to 6:59 AM | 5 (1.9%) | 9 (3.9%) |
| 7:00 AM to 7:29 AM | 41 (16.0%) | 59 (25.8%) |
| 7:30 AM to 7:59 AM | 25 (9.8%) | 8 (3.5%) |
| 8:00 AM to 8:29 AM | 23 (9.0%) | 6 (2.6%) |
| 8:30 AM to 8:59 AM | 0 (0.0%) | 3 (1.3%) |
| 9:00 AM to 9:59 AM | 10 (3.9%) | 24 (10.5%) |
| 10:00 AM to 10:59 AM | 18 (7.0%) | 12 (5.2%) |
| 11:00 AM to 11:59 AM | 13 (5.1%) | 7 (3.1%) |
| 12:00 PM to 3:59 PM | 26 (10.2%) | 43 (18.8%) |
| 4:00 PM to 11:59 PM | 18 (7.0%) | 31 (13.5%) |
| Total | 256 (100.0%) | 229 (100.0%) |
Housing Occupancy in Sibley
Occupancy by Ownership in Sibley
Of the total 507 dwellings in Sibley, owner-occupied units account for 327 (64.5%), while renter-occupied units make up 180 (35.5%).
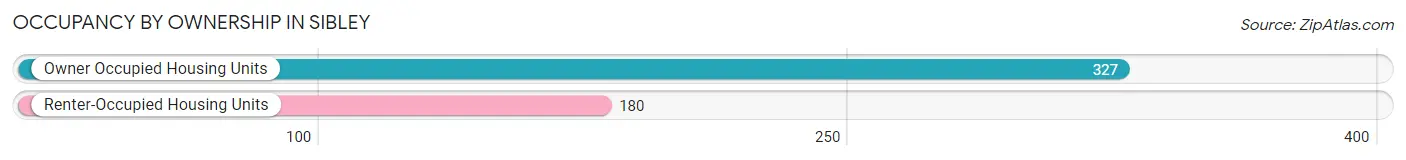
| Occupancy | # Housing Units | % Housing Units |
| Owner Occupied Housing Units | 327 | 64.5% |
| Renter-Occupied Housing Units | 180 | 35.5% |
| Total Occupied Housing Units | 507 | 100.0% |
Occupancy by Household Size in Sibley
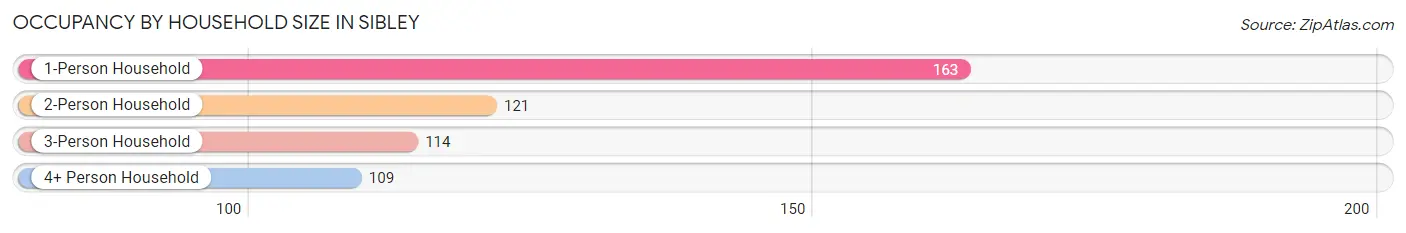
| Household Size | # Housing Units | % Housing Units |
| 1-Person Household | 163 | 32.2% |
| 2-Person Household | 121 | 23.9% |
| 3-Person Household | 114 | 22.5% |
| 4+ Person Household | 109 | 21.5% |
| Total Housing Units | 507 | 100.0% |
Occupancy by Ownership by Household Size in Sibley
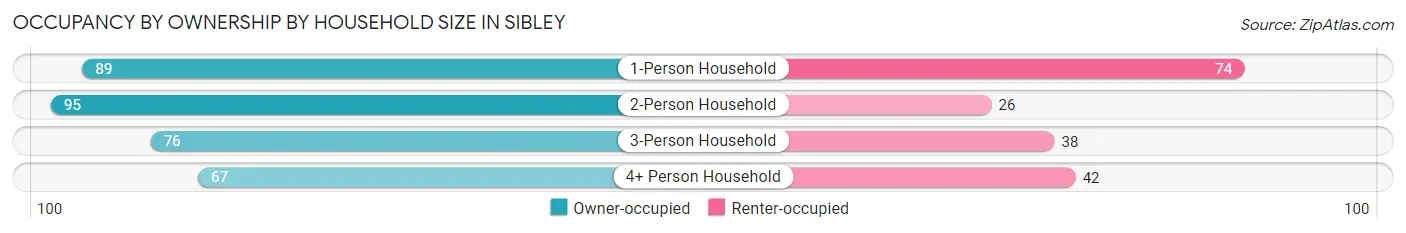
| Household Size | Owner-occupied | Renter-occupied |
| 1-Person Household | 89 (54.6%) | 74 (45.4%) |
| 2-Person Household | 95 (78.5%) | 26 (21.5%) |
| 3-Person Household | 76 (66.7%) | 38 (33.3%) |
| 4+ Person Household | 67 (61.5%) | 42 (38.5%) |
| Total Housing Units | 327 (64.5%) | 180 (35.5%) |
Occupancy by Educational Attainment in Sibley
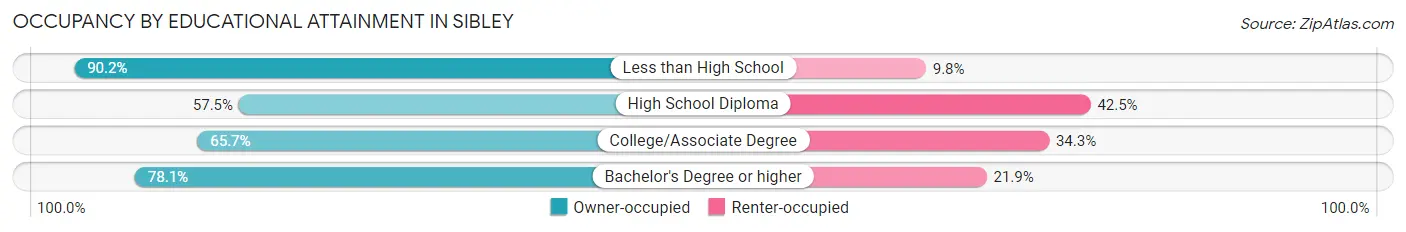
| Household Size | Owner-occupied | Renter-occupied |
| Less than High School | 55 (90.2%) | 6 (9.8%) |
| High School Diploma | 176 (57.5%) | 130 (42.5%) |
| College/Associate Degree | 71 (65.7%) | 37 (34.3%) |
| Bachelor's Degree or higher | 25 (78.1%) | 7 (21.9%) |
Occupancy by Age of Householder in Sibley
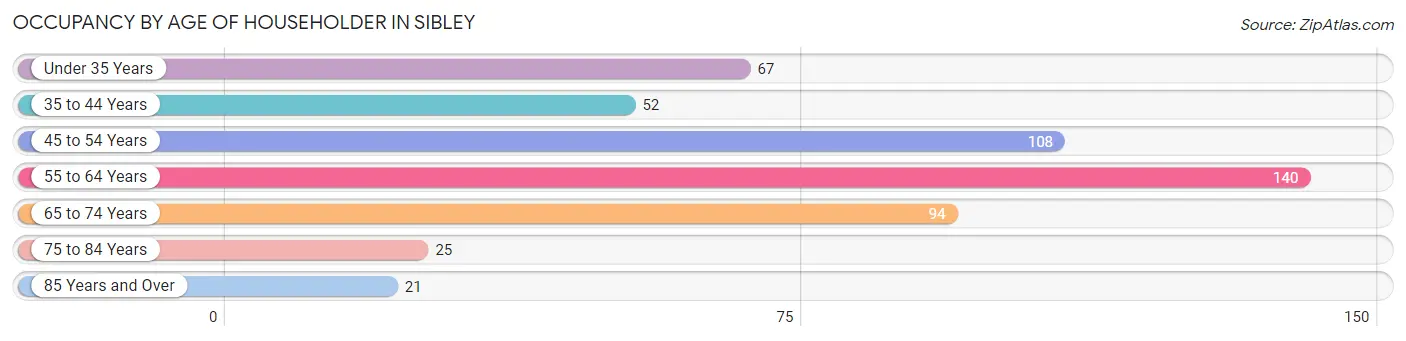
| Age Bracket | # Households | % Households |
| Under 35 Years | 67 | 13.2% |
| 35 to 44 Years | 52 | 10.3% |
| 45 to 54 Years | 108 | 21.3% |
| 55 to 64 Years | 140 | 27.6% |
| 65 to 74 Years | 94 | 18.5% |
| 75 to 84 Years | 25 | 4.9% |
| 85 Years and Over | 21 | 4.1% |
| Total | 507 | 100.0% |
Housing Finances in Sibley
Median Income by Occupancy in Sibley
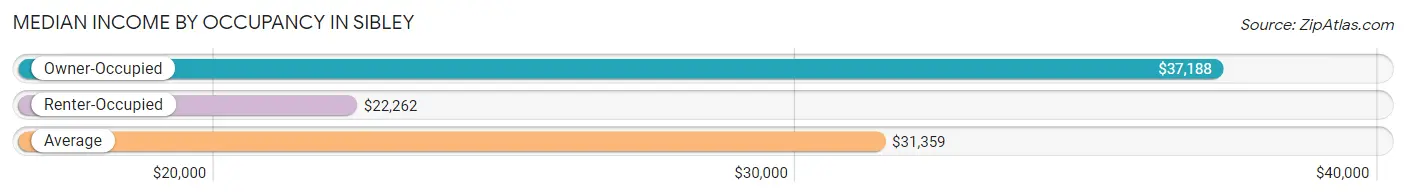
| Occupancy Type | # Households | Median Income |
| Owner-Occupied | 327 (64.5%) | $37,188 |
| Renter-Occupied | 180 (35.5%) | $22,262 |
| Average | 507 (100.0%) | $31,359 |
Occupancy by Householder Income Bracket in Sibley
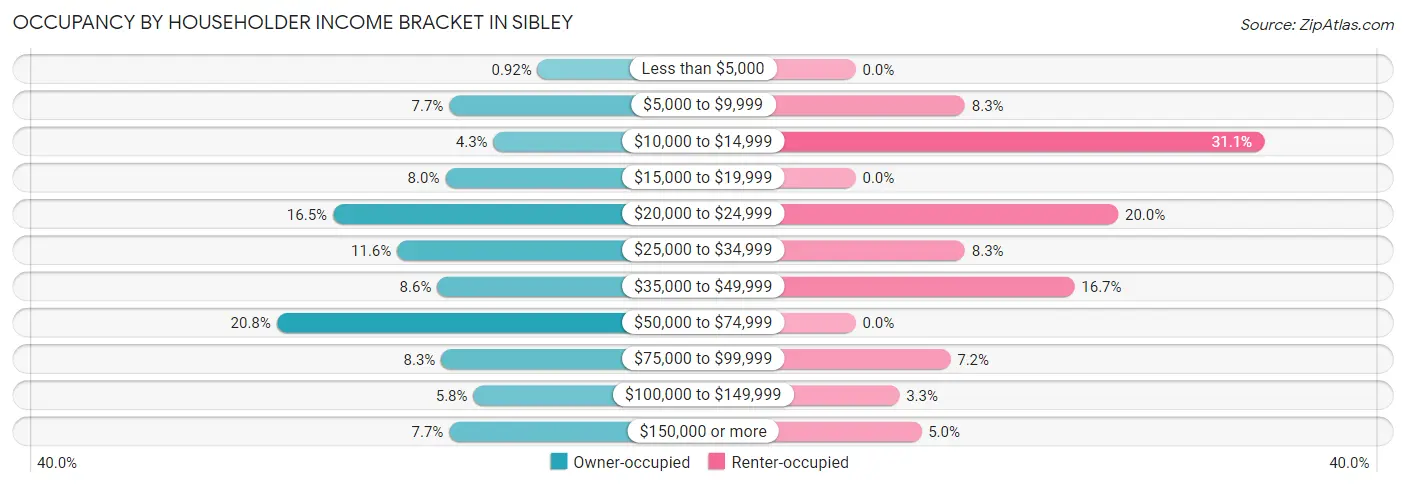
| Income Bracket | Owner-occupied | Renter-occupied |
| Less than $5,000 | 3 (0.9%) | 0 (0.0%) |
| $5,000 to $9,999 | 25 (7.6%) | 15 (8.3%) |
| $10,000 to $14,999 | 14 (4.3%) | 56 (31.1%) |
| $15,000 to $19,999 | 26 (8.0%) | 0 (0.0%) |
| $20,000 to $24,999 | 54 (16.5%) | 36 (20.0%) |
| $25,000 to $34,999 | 38 (11.6%) | 15 (8.3%) |
| $35,000 to $49,999 | 28 (8.6%) | 30 (16.7%) |
| $50,000 to $74,999 | 68 (20.8%) | 0 (0.0%) |
| $75,000 to $99,999 | 27 (8.3%) | 13 (7.2%) |
| $100,000 to $149,999 | 19 (5.8%) | 6 (3.3%) |
| $150,000 or more | 25 (7.6%) | 9 (5.0%) |
| Total | 327 (100.0%) | 180 (100.0%) |
Monthly Housing Cost Tiers in Sibley
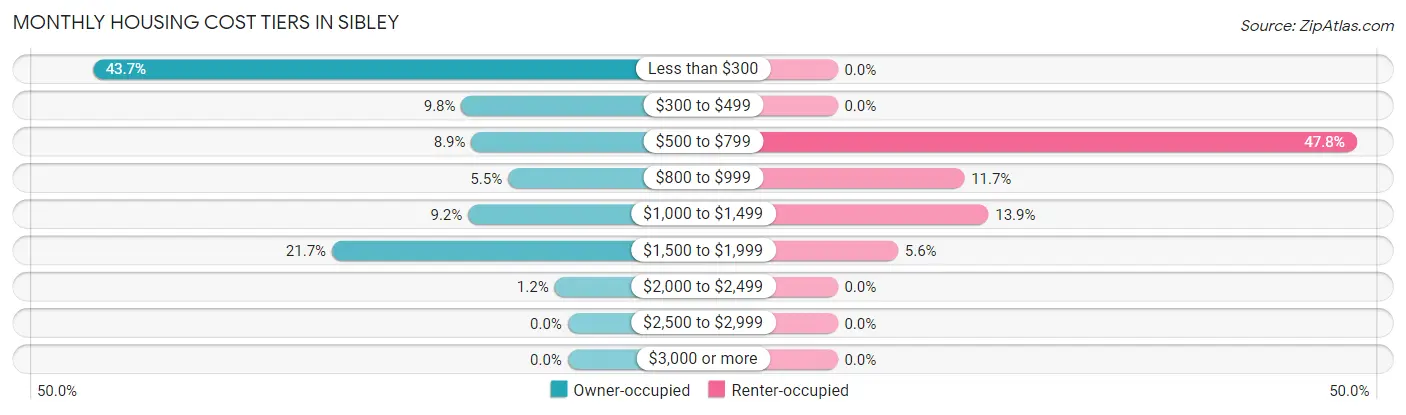
| Monthly Cost | Owner-occupied | Renter-occupied |
| Less than $300 | 143 (43.7%) | 0 (0.0%) |
| $300 to $499 | 32 (9.8%) | 0 (0.0%) |
| $500 to $799 | 29 (8.9%) | 86 (47.8%) |
| $800 to $999 | 18 (5.5%) | 21 (11.7%) |
| $1,000 to $1,499 | 30 (9.2%) | 25 (13.9%) |
| $1,500 to $1,999 | 71 (21.7%) | 10 (5.6%) |
| $2,000 to $2,499 | 4 (1.2%) | 0 (0.0%) |
| $2,500 to $2,999 | 0 (0.0%) | 0 (0.0%) |
| $3,000 or more | 0 (0.0%) | 0 (0.0%) |
| Total | 327 (100.0%) | 180 (100.0%) |
Physical Housing Characteristics in Sibley
Housing Structures in Sibley
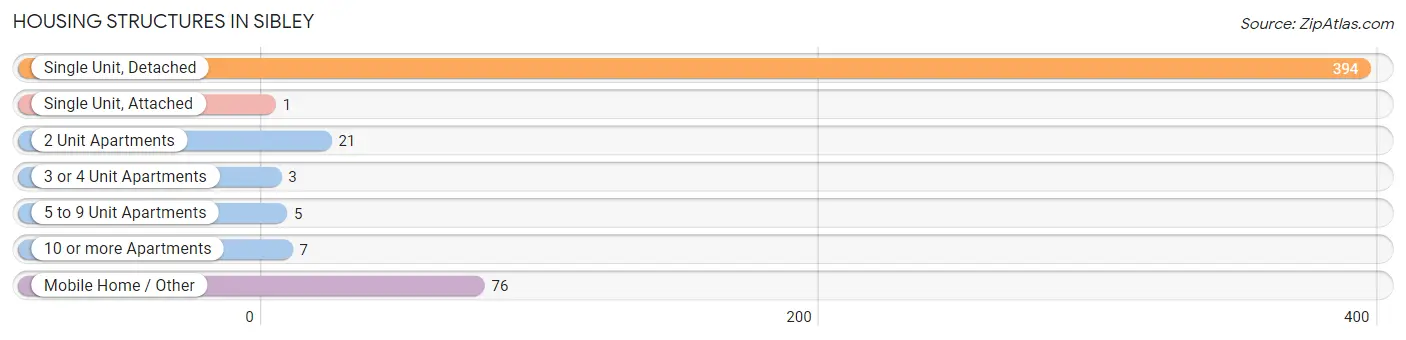
| Structure Type | # Housing Units | % Housing Units |
| Single Unit, Detached | 394 | 77.7% |
| Single Unit, Attached | 1 | 0.2% |
| 2 Unit Apartments | 21 | 4.1% |
| 3 or 4 Unit Apartments | 3 | 0.6% |
| 5 to 9 Unit Apartments | 5 | 1.0% |
| 10 or more Apartments | 7 | 1.4% |
| Mobile Home / Other | 76 | 15.0% |
| Total | 507 | 100.0% |
Housing Structures by Occupancy in Sibley
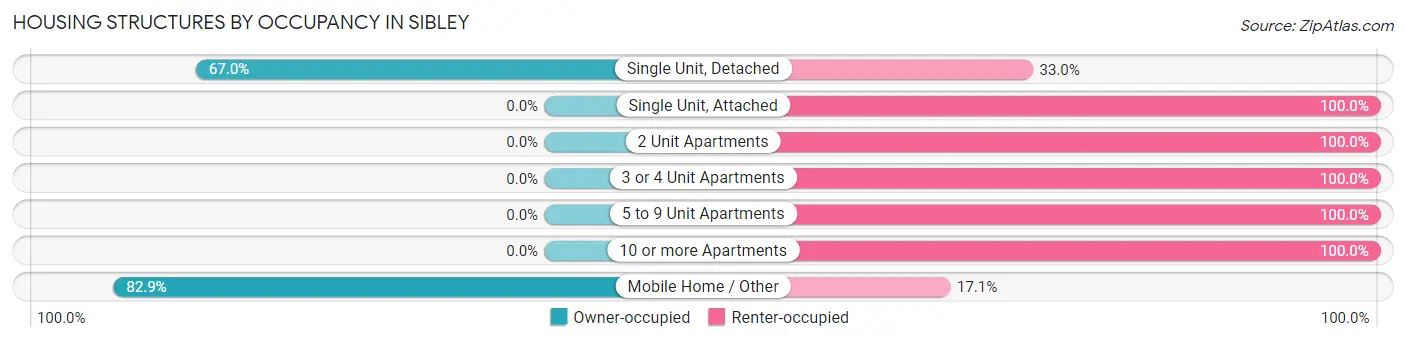
| Structure Type | Owner-occupied | Renter-occupied |
| Single Unit, Detached | 264 (67.0%) | 130 (33.0%) |
| Single Unit, Attached | 0 (0.0%) | 1 (100.0%) |
| 2 Unit Apartments | 0 (0.0%) | 21 (100.0%) |
| 3 or 4 Unit Apartments | 0 (0.0%) | 3 (100.0%) |
| 5 to 9 Unit Apartments | 0 (0.0%) | 5 (100.0%) |
| 10 or more Apartments | 0 (0.0%) | 7 (100.0%) |
| Mobile Home / Other | 63 (82.9%) | 13 (17.1%) |
| Total | 327 (64.5%) | 180 (35.5%) |
Housing Structures by Number of Rooms in Sibley
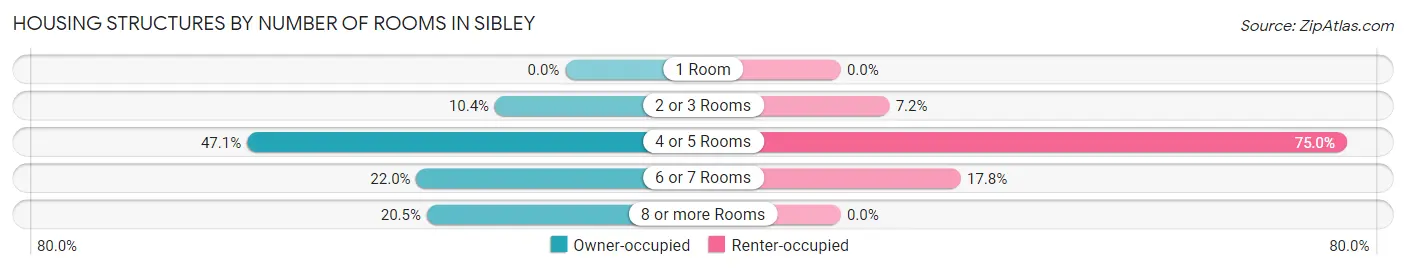
| Number of Rooms | Owner-occupied | Renter-occupied |
| 1 Room | 0 (0.0%) | 0 (0.0%) |
| 2 or 3 Rooms | 34 (10.4%) | 13 (7.2%) |
| 4 or 5 Rooms | 154 (47.1%) | 135 (75.0%) |
| 6 or 7 Rooms | 72 (22.0%) | 32 (17.8%) |
| 8 or more Rooms | 67 (20.5%) | 0 (0.0%) |
| Total | 327 (100.0%) | 180 (100.0%) |
Housing Structure by Heating Type in Sibley
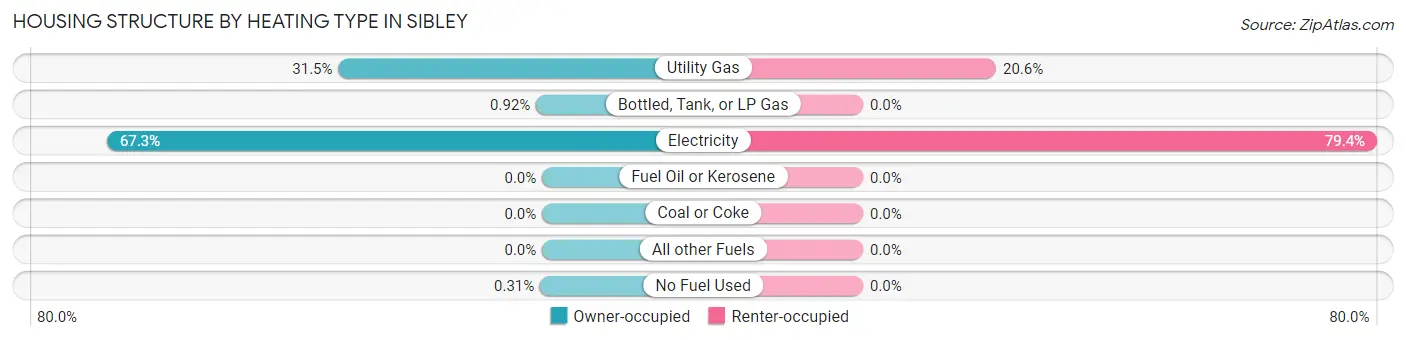
| Heating Type | Owner-occupied | Renter-occupied |
| Utility Gas | 103 (31.5%) | 37 (20.6%) |
| Bottled, Tank, or LP Gas | 3 (0.9%) | 0 (0.0%) |
| Electricity | 220 (67.3%) | 143 (79.4%) |
| Fuel Oil or Kerosene | 0 (0.0%) | 0 (0.0%) |
| Coal or Coke | 0 (0.0%) | 0 (0.0%) |
| All other Fuels | 0 (0.0%) | 0 (0.0%) |
| No Fuel Used | 1 (0.3%) | 0 (0.0%) |
| Total | 327 (100.0%) | 180 (100.0%) |
Household Vehicle Usage in Sibley
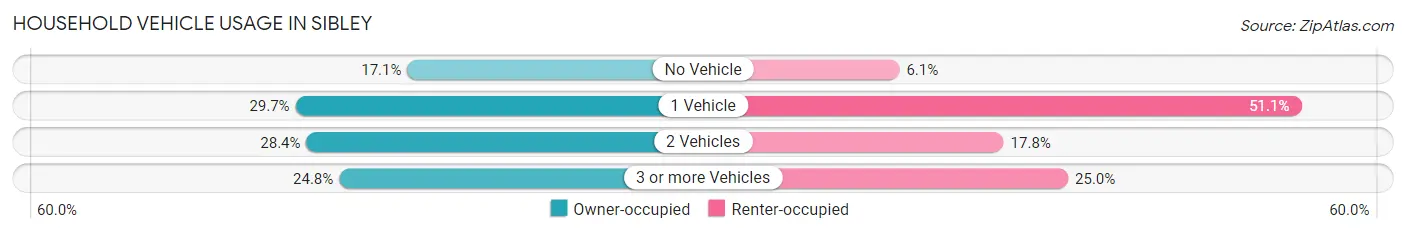
| Vehicles per Household | Owner-occupied | Renter-occupied |
| No Vehicle | 56 (17.1%) | 11 (6.1%) |
| 1 Vehicle | 97 (29.7%) | 92 (51.1%) |
| 2 Vehicles | 93 (28.4%) | 32 (17.8%) |
| 3 or more Vehicles | 81 (24.8%) | 45 (25.0%) |
| Total | 327 (100.0%) | 180 (100.0%) |
Real Estate & Mortgages in Sibley
Real Estate and Mortgage Overview in Sibley
| Characteristic | Without Mortgage | With Mortgage |
| Housing Units | 179 | 148 |
| Median Property Value | - | - |
| Median Household Income | $23,050 | $25 |
| Monthly Housing Costs | $216 | $0 |
| Real Estate Taxes | $199 | $36 |
Property Value by Mortgage Status in Sibley
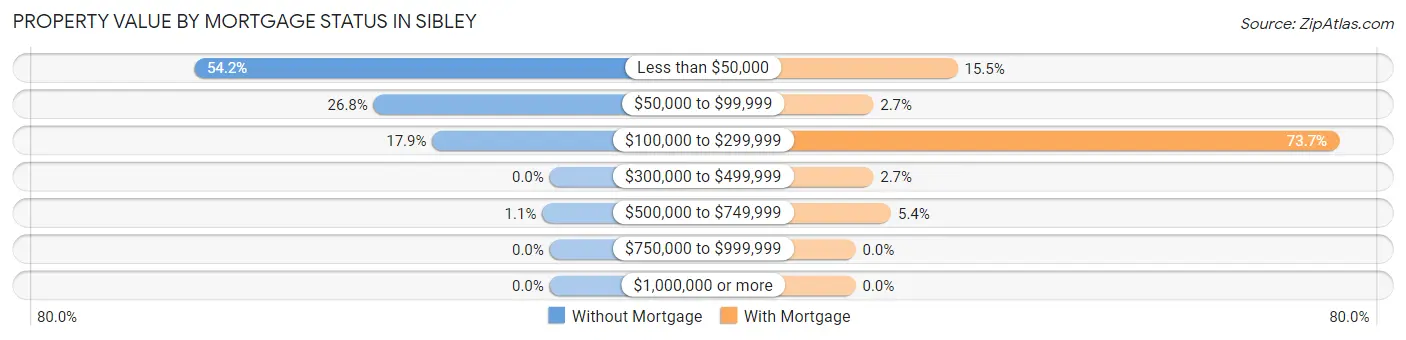
| Property Value | Without Mortgage | With Mortgage |
| Less than $50,000 | 97 (54.2%) | 23 (15.5%) |
| $50,000 to $99,999 | 48 (26.8%) | 4 (2.7%) |
| $100,000 to $299,999 | 32 (17.9%) | 109 (73.7%) |
| $300,000 to $499,999 | 0 (0.0%) | 4 (2.7%) |
| $500,000 to $749,999 | 2 (1.1%) | 8 (5.4%) |
| $750,000 to $999,999 | 0 (0.0%) | 0 (0.0%) |
| $1,000,000 or more | 0 (0.0%) | 0 (0.0%) |
| Total | 179 (100.0%) | 148 (100.0%) |
Household Income by Mortgage Status in Sibley
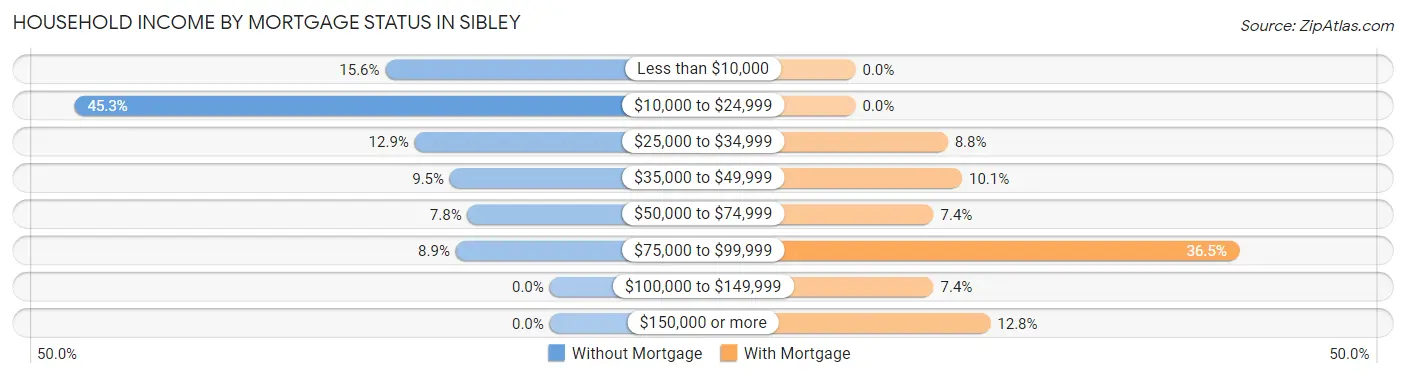
| Household Income | Without Mortgage | With Mortgage |
| Less than $10,000 | 28 (15.6%) | 0 (0.0%) |
| $10,000 to $24,999 | 81 (45.3%) | 0 (0.0%) |
| $25,000 to $34,999 | 23 (12.9%) | 13 (8.8%) |
| $35,000 to $49,999 | 17 (9.5%) | 15 (10.1%) |
| $50,000 to $74,999 | 14 (7.8%) | 11 (7.4%) |
| $75,000 to $99,999 | 16 (8.9%) | 54 (36.5%) |
| $100,000 to $149,999 | 0 (0.0%) | 11 (7.4%) |
| $150,000 or more | 0 (0.0%) | 19 (12.8%) |
| Total | 179 (100.0%) | 148 (100.0%) |
Property Value to Household Income Ratio in Sibley
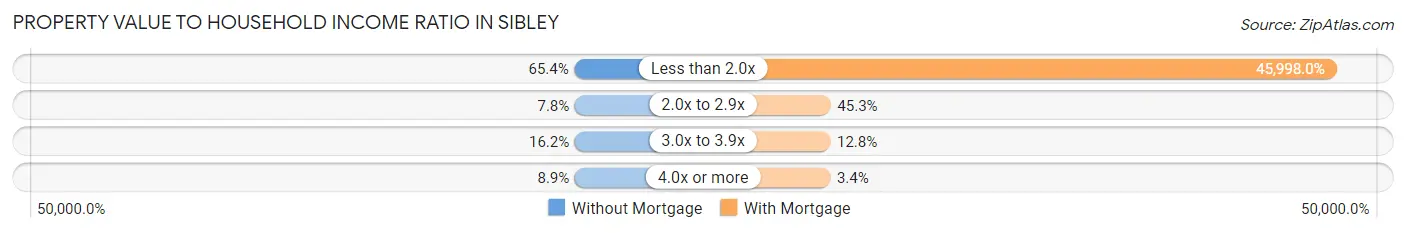
| Value-to-Income Ratio | Without Mortgage | With Mortgage |
| Less than 2.0x | 117 (65.4%) | 68,077 (45,998.0%) |
| 2.0x to 2.9x | 14 (7.8%) | 67 (45.3%) |
| 3.0x to 3.9x | 29 (16.2%) | 19 (12.8%) |
| 4.0x or more | 16 (8.9%) | 5 (3.4%) |
| Total | 179 (100.0%) | 148 (100.0%) |
Real Estate Taxes by Mortgage Status in Sibley
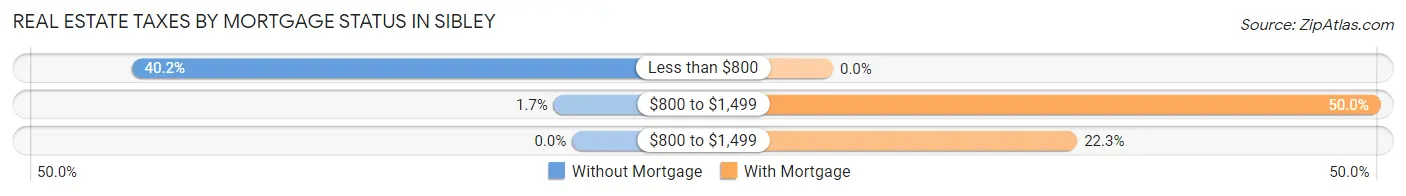
| Property Taxes | Without Mortgage | With Mortgage |
| Less than $800 | 72 (40.2%) | 0 (0.0%) |
| $800 to $1,499 | 3 (1.7%) | 74 (50.0%) |
| $800 to $1,499 | 0 (0.0%) | 33 (22.3%) |
| Total | 179 (100.0%) | 148 (100.0%) |
Health & Disability in Sibley
Health Insurance Coverage by Age in Sibley
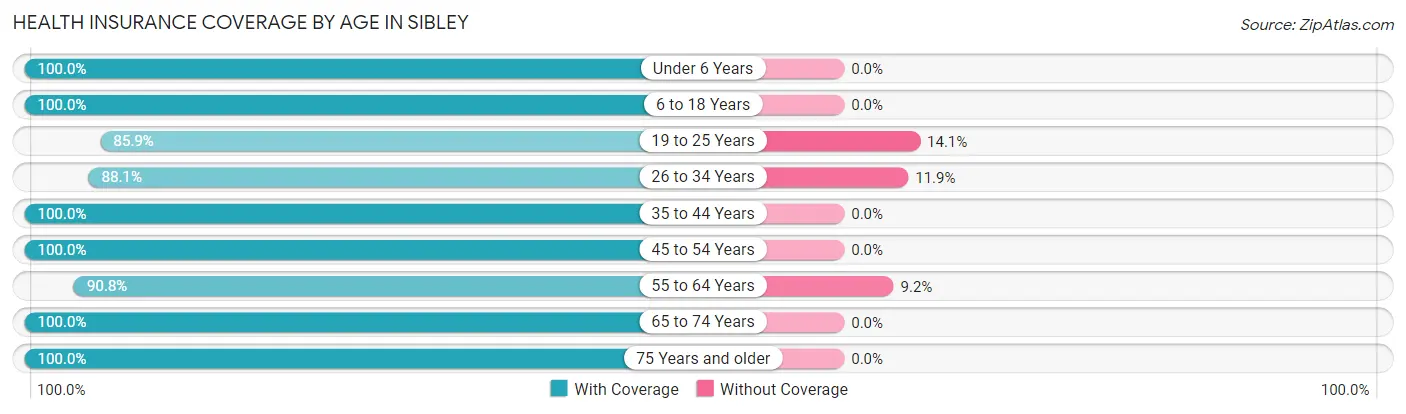
| Age Bracket | With Coverage | Without Coverage |
| Under 6 Years | 134 (100.0%) | 0 (0.0%) |
| 6 to 18 Years | 239 (100.0%) | 0 (0.0%) |
| 19 to 25 Years | 85 (85.9%) | 14 (14.1%) |
| 26 to 34 Years | 118 (88.1%) | 16 (11.9%) |
| 35 to 44 Years | 91 (100.0%) | 0 (0.0%) |
| 45 to 54 Years | 237 (100.0%) | 0 (0.0%) |
| 55 to 64 Years | 158 (90.8%) | 16 (9.2%) |
| 65 to 74 Years | 113 (100.0%) | 0 (0.0%) |
| 75 Years and older | 96 (100.0%) | 0 (0.0%) |
| Total | 1,271 (96.5%) | 46 (3.5%) |
Health Insurance Coverage by Citizenship Status in Sibley
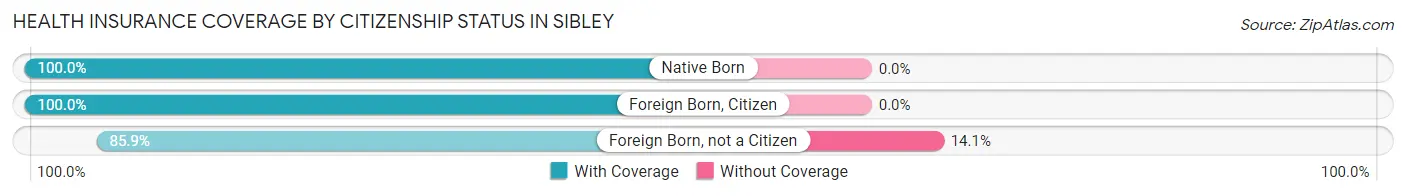
| Citizenship Status | With Coverage | Without Coverage |
| Native Born | 134 (100.0%) | 0 (0.0%) |
| Foreign Born, Citizen | 239 (100.0%) | 0 (0.0%) |
| Foreign Born, not a Citizen | 85 (85.9%) | 14 (14.1%) |
Health Insurance Coverage by Household Income in Sibley
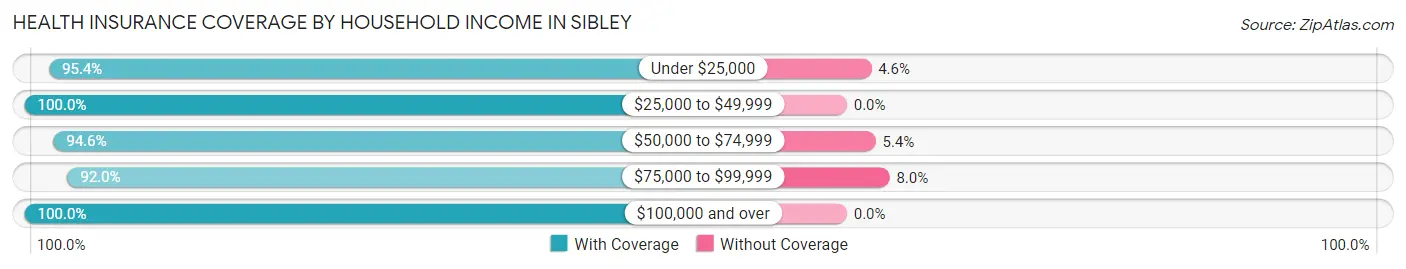
| Household Income | With Coverage | Without Coverage |
| Under $25,000 | 439 (95.4%) | 21 (4.6%) |
| $25,000 to $49,999 | 255 (100.0%) | 0 (0.0%) |
| $50,000 to $74,999 | 228 (94.6%) | 13 (5.4%) |
| $75,000 to $99,999 | 138 (92.0%) | 12 (8.0%) |
| $100,000 and over | 211 (100.0%) | 0 (0.0%) |
Public vs Private Health Insurance Coverage by Age in Sibley
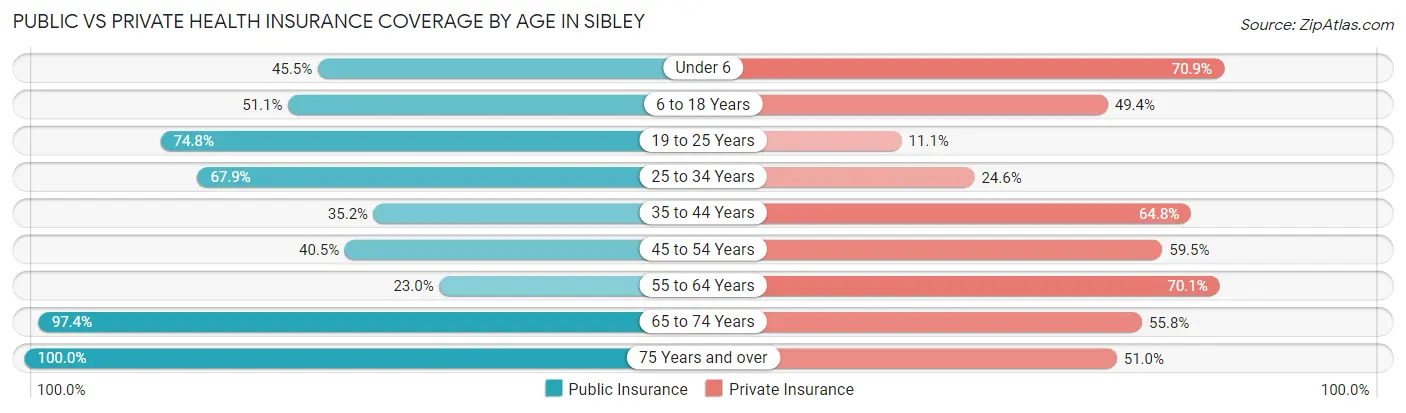
| Age Bracket | Public Insurance | Private Insurance |
| Under 6 | 61 (45.5%) | 95 (70.9%) |
| 6 to 18 Years | 122 (51.0%) | 118 (49.4%) |
| 19 to 25 Years | 74 (74.8%) | 11 (11.1%) |
| 25 to 34 Years | 91 (67.9%) | 33 (24.6%) |
| 35 to 44 Years | 32 (35.2%) | 59 (64.8%) |
| 45 to 54 Years | 96 (40.5%) | 141 (59.5%) |
| 55 to 64 Years | 40 (23.0%) | 122 (70.1%) |
| 65 to 74 Years | 110 (97.4%) | 63 (55.7%) |
| 75 Years and over | 96 (100.0%) | 49 (51.0%) |
| Total | 722 (54.8%) | 691 (52.5%) |
Disability Status by Sex by Age in Sibley
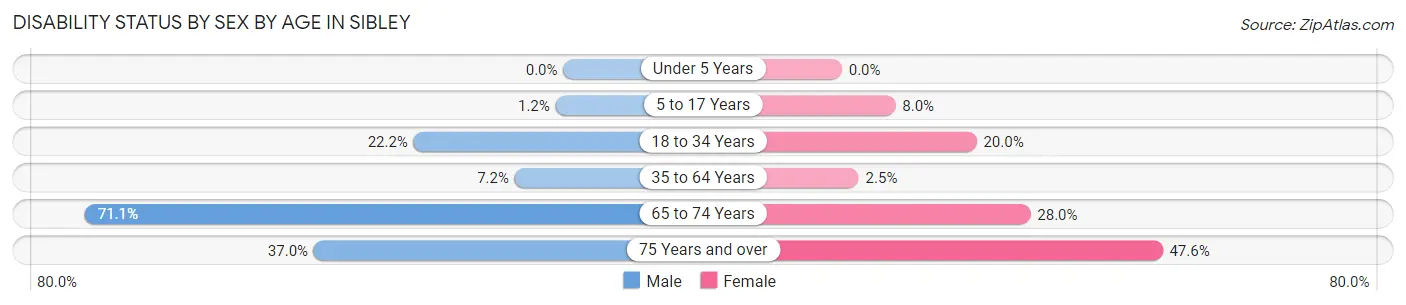
| Age Bracket | Male | Female |
| Under 5 Years | 0 (0.0%) | 0 (0.0%) |
| 5 to 17 Years | 2 (1.1%) | 7 (8.0%) |
| 18 to 34 Years | 24 (22.2%) | 25 (20.0%) |
| 35 to 64 Years | 16 (7.2%) | 7 (2.5%) |
| 65 to 74 Years | 27 (71.1%) | 21 (28.0%) |
| 75 Years and over | 20 (37.0%) | 20 (47.6%) |
Disability Class by Sex by Age in Sibley
Disability Class: Hearing Difficulty
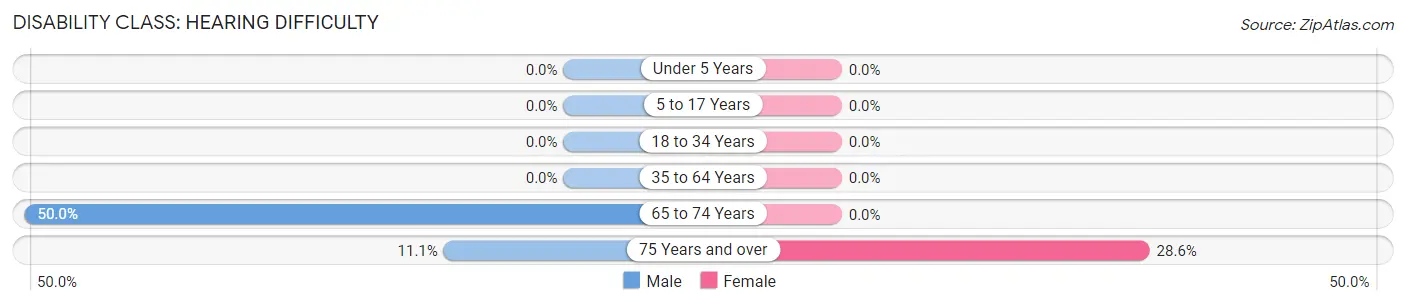
| Age Bracket | Male | Female |
| Under 5 Years | 0 (0.0%) | 0 (0.0%) |
| 5 to 17 Years | 0 (0.0%) | 0 (0.0%) |
| 18 to 34 Years | 0 (0.0%) | 0 (0.0%) |
| 35 to 64 Years | 0 (0.0%) | 0 (0.0%) |
| 65 to 74 Years | 19 (50.0%) | 0 (0.0%) |
| 75 Years and over | 6 (11.1%) | 12 (28.6%) |
Disability Class: Vision Difficulty
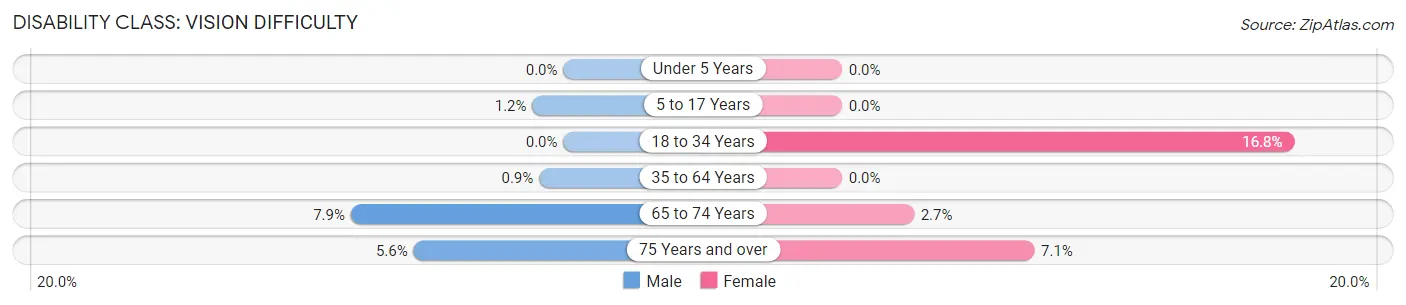
| Age Bracket | Male | Female |
| Under 5 Years | 0 (0.0%) | 0 (0.0%) |
| 5 to 17 Years | 2 (1.1%) | 0 (0.0%) |
| 18 to 34 Years | 0 (0.0%) | 21 (16.8%) |
| 35 to 64 Years | 2 (0.9%) | 0 (0.0%) |
| 65 to 74 Years | 3 (7.9%) | 2 (2.7%) |
| 75 Years and over | 3 (5.6%) | 3 (7.1%) |
Disability Class: Cognitive Difficulty
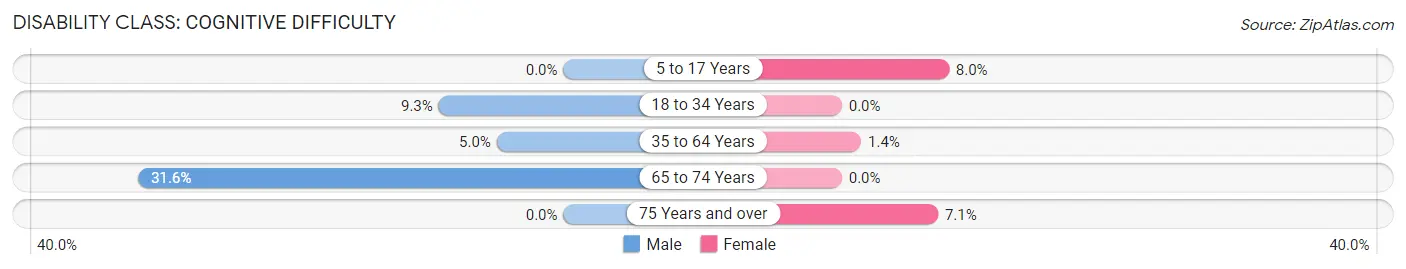
| Age Bracket | Male | Female |
| 5 to 17 Years | 0 (0.0%) | 7 (8.0%) |
| 18 to 34 Years | 10 (9.3%) | 0 (0.0%) |
| 35 to 64 Years | 11 (5.0%) | 4 (1.4%) |
| 65 to 74 Years | 12 (31.6%) | 0 (0.0%) |
| 75 Years and over | 0 (0.0%) | 3 (7.1%) |
Disability Class: Ambulatory Difficulty
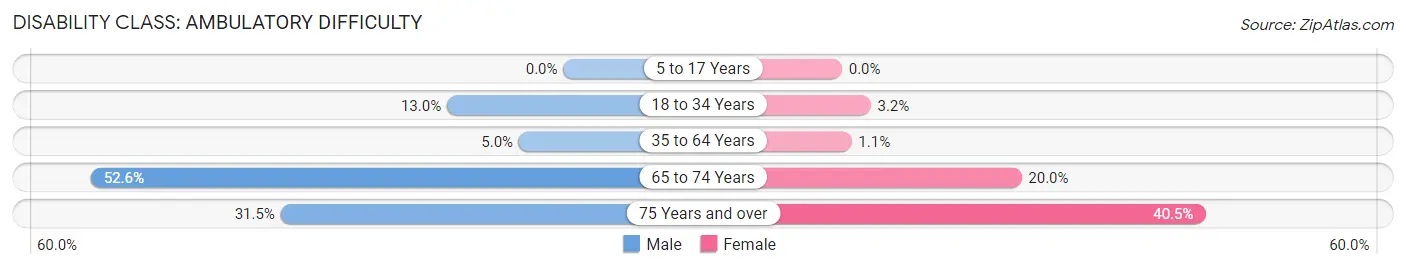
| Age Bracket | Male | Female |
| 5 to 17 Years | 0 (0.0%) | 0 (0.0%) |
| 18 to 34 Years | 14 (13.0%) | 4 (3.2%) |
| 35 to 64 Years | 11 (5.0%) | 3 (1.1%) |
| 65 to 74 Years | 20 (52.6%) | 15 (20.0%) |
| 75 Years and over | 17 (31.5%) | 17 (40.5%) |
Disability Class: Self-Care Difficulty
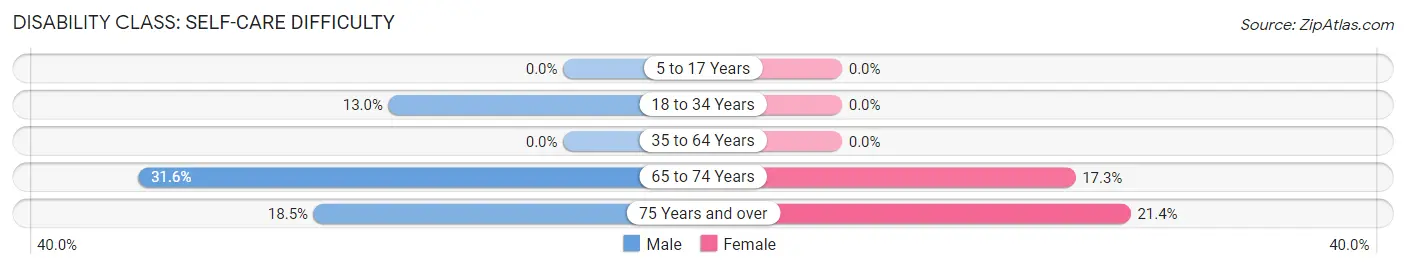
| Age Bracket | Male | Female |
| 5 to 17 Years | 0 (0.0%) | 0 (0.0%) |
| 18 to 34 Years | 14 (13.0%) | 0 (0.0%) |
| 35 to 64 Years | 0 (0.0%) | 0 (0.0%) |
| 65 to 74 Years | 12 (31.6%) | 13 (17.3%) |
| 75 Years and over | 10 (18.5%) | 9 (21.4%) |
Technology Access in Sibley
Computing Device Access in Sibley
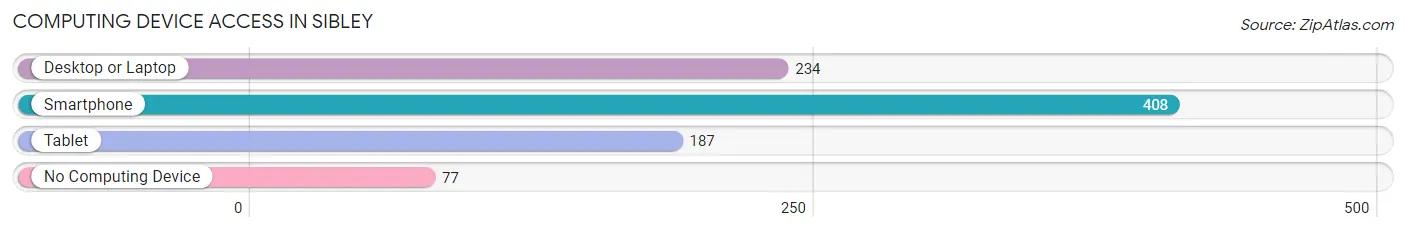
| Device Type | # Households | % Households |
| Desktop or Laptop | 234 | 46.2% |
| Smartphone | 408 | 80.5% |
| Tablet | 187 | 36.9% |
| No Computing Device | 77 | 15.2% |
| Total | 507 | 100.0% |
Internet Access in Sibley
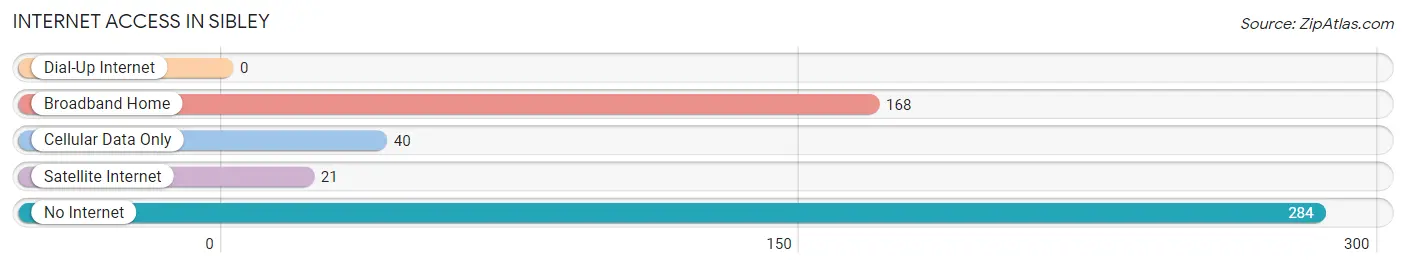
| Internet Type | # Households | % Households |
| Dial-Up Internet | 0 | 0.0% |
| Broadband Home | 168 | 33.1% |
| Cellular Data Only | 40 | 7.9% |
| Satellite Internet | 21 | 4.1% |
| No Internet | 284 | 56.0% |
| Total | 507 | 100.0% |
Sibley Summary
Sibley is a small town located in the state of Louisiana, in the United States. It is situated in the northwest corner of the state, in the parish of Jackson. The town has a population of approximately 1,000 people, and is part of the larger Jackson Parish.
History
Sibley was founded in 1845 by a group of settlers from the nearby town of Jonesboro. The town was named after the Sibley family, who were among the first settlers. The town was originally a farming community, and the main crops grown were cotton and corn. The town was also home to a number of small businesses, including a general store, a blacksmith shop, and a sawmill.
In the late 19th century, the town began to grow and develop. The railroad arrived in 1887, and the town was incorporated in 1888. The railroad brought new opportunities to the town, and it soon became a center for commerce and industry. The town was home to several factories, including a cotton mill, a lumber mill, and a brick factory.
Geography
Sibley is located in the northwest corner of Louisiana, in the parish of Jackson. The town is situated on the banks of the Ouachita River, and is surrounded by rolling hills and forests. The town is located about 30 miles from the state capital of Baton Rouge.
The climate in Sibley is humid subtropical, with hot summers and mild winters. The average annual temperature is around 70 degrees Fahrenheit, and the average annual precipitation is around 50 inches.
Economy
The economy of Sibley is largely based on agriculture and manufacturing. The town is home to several farms, which produce cotton, corn, soybeans, and other crops. The town is also home to several factories, which produce a variety of products, including furniture, clothing, and paper products.
The town is also home to several small businesses, including restaurants, shops, and service providers. The town is also home to a number of tourist attractions, including a historic district, a museum, and a golf course.
Demographics
As of the 2010 census, the population of Sibley was 1,000 people. The racial makeup of the town was 95.2% White, 2.2% African American, 0.7% Native American, 0.3% Asian, and 1.6% from other races. The median household income was $31,250, and the median family income was $37,500.
The town is home to a number of churches, including Baptist, Methodist, and Catholic. The town is also home to a number of schools, including a public elementary school, a middle school, and a high school.
Conclusion
Sibley is a small town located in the northwest corner of Louisiana. The town has a population of approximately 1,000 people, and is part of the larger Jackson Parish. The town was founded in 1845, and has a long history of agriculture and manufacturing. The town is home to several farms, factories, and small businesses, and is also home to a number of tourist attractions. The town has a diverse population, with a median household income of $31,250. The town is home to a number of churches and schools, and is a great place to live and work.
Common Questions
What is Per Capita Income in Sibley?
Per Capita income in Sibley is $18,741.
What is the Median Family Income in Sibley?
Median Family Income in Sibley is $45,938.
What is the Median Household income in Sibley?
Median Household Income in Sibley is $31,359.
What is Income or Wage Gap in Sibley?
Income or Wage Gap in Sibley is 36.6%.
Women in Sibley earn 63.4 cents for every dollar earned by a man.
What is Inequality or Gini Index in Sibley?
Inequality or Gini Index in Sibley is 0.47.
What is the Total Population of Sibley?
Total Population of Sibley is 1,323.
What is the Total Male Population of Sibley?
Total Male Population of Sibley is 662.
What is the Total Female Population of Sibley?
Total Female Population of Sibley is 661.
What is the Ratio of Males per 100 Females in Sibley?
There are 100.15 Males per 100 Females in Sibley.
What is the Ratio of Females per 100 Males in Sibley?
There are 99.85 Females per 100 Males in Sibley.
What is the Median Population Age in Sibley?
Median Population Age in Sibley is 41.1 Years.
What is the Average Family Size in Sibley
Average Family Size in Sibley is 3.4 People.
What is the Average Household Size in Sibley
Average Household Size in Sibley is 2.6 People.
How Large is the Labor Force in Sibley?
There are 511 People in the Labor Forcein in Sibley.
What is the Percentage of People in the Labor Force in Sibley?
49.1% of People are in the Labor Force in Sibley.
What is the Unemployment Rate in Sibley?
Unemployment Rate in Sibley is 2.4%.