Woodmere, LA Map & Demographics
Woodmere Map
Woodmere Overview
$36,758
PER CAPITA INCOME
$72,472
AVG FAMILY INCOME
$70,087
AVG HOUSEHOLD INCOME
8.0%
WAGE / INCOME GAP [ % ]
92.0¢/ $1
WAGE / INCOME GAP [ $ ]
0.50
INEQUALITY / GINI INDEX
11,661
TOTAL POPULATION
5,990
MALE POPULATION
5,671
FEMALE POPULATION
105.63
MALES / 100 FEMALES
94.67
FEMALES / 100 MALES
36.8
MEDIAN AGE
3.4
AVG FAMILY SIZE
3.0
AVG HOUSEHOLD SIZE
5,429
LABOR FORCE [ PEOPLE ]
60.2%
PERCENT IN LABOR FORCE
9.2%
UNEMPLOYMENT RATE
Income in Woodmere
Income Overview in Woodmere
Per Capita Income in Woodmere is $36,758, while median incomes of families and households are $72,472 and $70,087 respectively.
| Characteristic | Number | Measure |
| Per Capita Income | 11,661 | $36,758 |
| Median Family Income | 3,045 | $72,472 |
| Mean Family Income | 3,045 | $109,797 |
| Median Household Income | 3,926 | $70,087 |
| Mean Household Income | 3,926 | $98,632 |
| Income Deficit | 3,045 | $0 |
| Wage / Income Gap (%) | 11,661 | 7.99% |
| Wage / Income Gap ($) | 11,661 | 92.01¢ per $1 |
| Gini / Inequality Index | 11,661 | 0.50 |
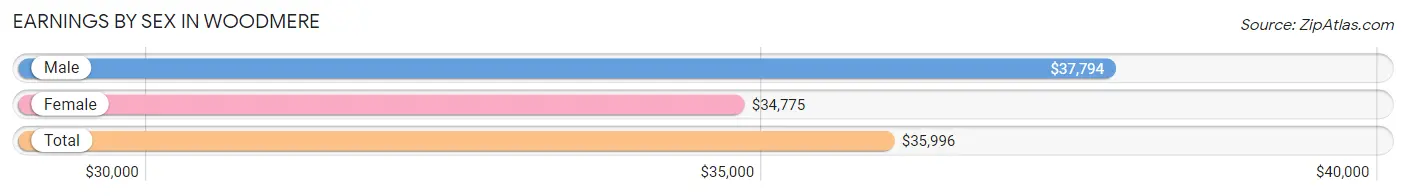
Earnings by Sex in Woodmere
Average Earnings in Woodmere are $35,996, $37,794 for men and $34,775 for women, a difference of 8.0%.
| Sex | Number | Average Earnings |
| Male | 2,834 (50.8%) | $37,794 |
| Female | 2,749 (49.2%) | $34,775 |
| Total | 5,583 (100.0%) | $35,996 |
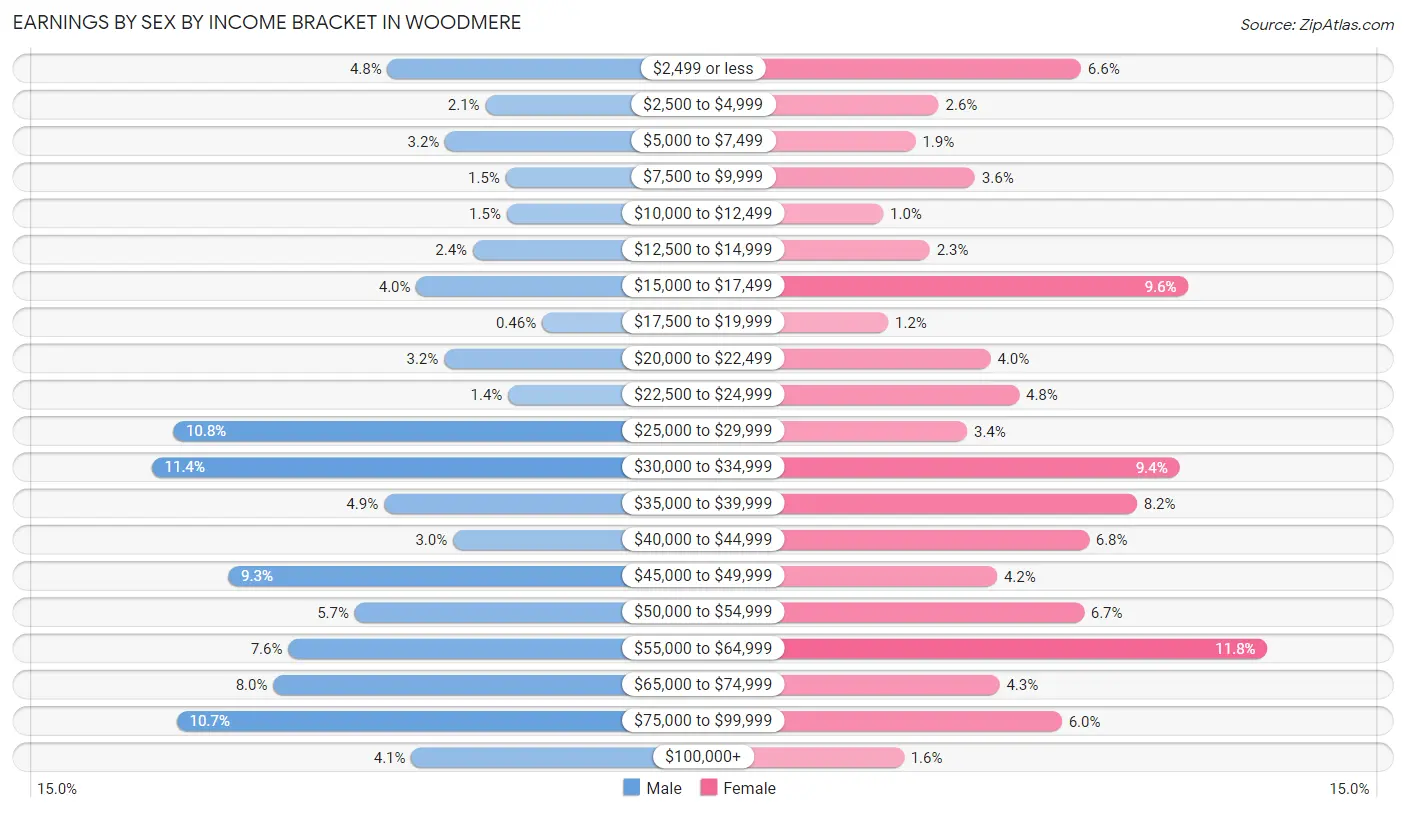
Earnings by Sex by Income Bracket in Woodmere
The most common earnings brackets in Woodmere are $30,000 to $34,999 for men (324 | 11.4%) and $55,000 to $64,999 for women (325 | 11.8%).
| Income | Male | Female |
| $2,499 or less | 136 (4.8%) | 181 (6.6%) |
| $2,500 to $4,999 | 58 (2.1%) | 71 (2.6%) |
| $5,000 to $7,499 | 90 (3.2%) | 53 (1.9%) |
| $7,500 to $9,999 | 42 (1.5%) | 99 (3.6%) |
| $10,000 to $12,499 | 41 (1.5%) | 28 (1.0%) |
| $12,500 to $14,999 | 68 (2.4%) | 64 (2.3%) |
| $15,000 to $17,499 | 113 (4.0%) | 264 (9.6%) |
| $17,500 to $19,999 | 13 (0.5%) | 32 (1.2%) |
| $20,000 to $22,499 | 91 (3.2%) | 111 (4.0%) |
| $22,500 to $24,999 | 40 (1.4%) | 133 (4.8%) |
| $25,000 to $29,999 | 307 (10.8%) | 93 (3.4%) |
| $30,000 to $34,999 | 324 (11.4%) | 257 (9.3%) |
| $35,000 to $39,999 | 139 (4.9%) | 224 (8.2%) |
| $40,000 to $44,999 | 84 (3.0%) | 187 (6.8%) |
| $45,000 to $49,999 | 263 (9.3%) | 116 (4.2%) |
| $50,000 to $54,999 | 162 (5.7%) | 183 (6.7%) |
| $55,000 to $64,999 | 215 (7.6%) | 325 (11.8%) |
| $65,000 to $74,999 | 227 (8.0%) | 118 (4.3%) |
| $75,000 to $99,999 | 304 (10.7%) | 166 (6.0%) |
| $100,000+ | 117 (4.1%) | 44 (1.6%) |
| Total | 2,834 (100.0%) | 2,749 (100.0%) |
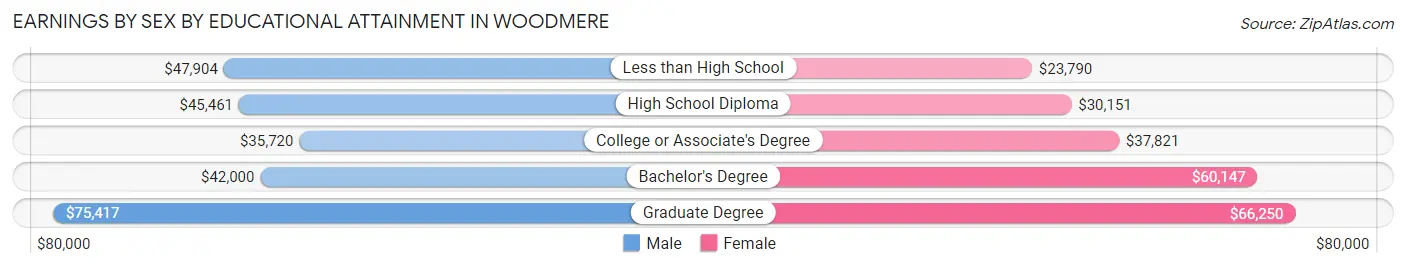
Earnings by Sex by Educational Attainment in Woodmere
Average earnings in Woodmere are $45,787 for men and $36,786 for women, a difference of 19.7%. Men with an educational attainment of graduate degree enjoy the highest average annual earnings of $75,417, while those with college or associate's degree education earn the least with $35,720. Women with an educational attainment of graduate degree earn the most with the average annual earnings of $66,250, while those with less than high school education have the smallest earnings of $23,790.
| Educational Attainment | Male Income | Female Income |
| Less than High School | $47,904 | $23,790 |
| High School Diploma | $45,461 | $30,151 |
| College or Associate's Degree | $35,720 | $37,821 |
| Bachelor's Degree | $42,000 | $60,147 |
| Graduate Degree | $75,417 | $66,250 |
| Total | $45,787 | $36,786 |
Family Income in Woodmere
Family Income Brackets in Woodmere
According to the Woodmere family income data, there are 901 families falling into the $50,000 to $74,999 income range, which is the most common income bracket and makes up 29.6% of all families. Conversely, the less than $10,000 income bracket is the least frequent group with only 73 families (2.4%) belonging to this category.
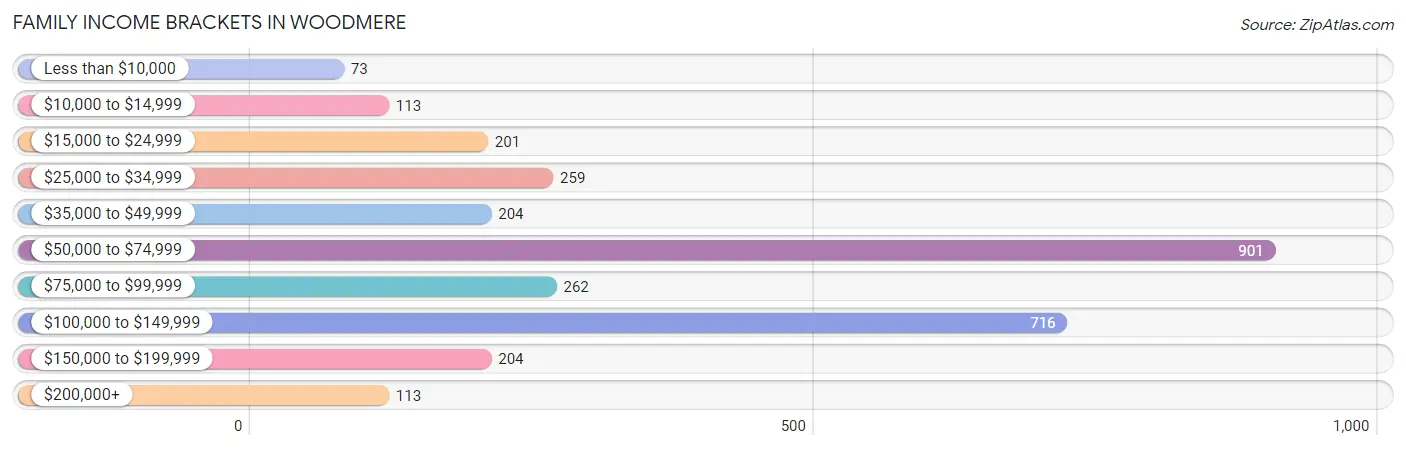
| Income Bracket | # Families | % Families |
| Less than $10,000 | 73 | 2.4% |
| $10,000 to $14,999 | 113 | 3.7% |
| $15,000 to $24,999 | 201 | 6.6% |
| $25,000 to $34,999 | 259 | 8.5% |
| $35,000 to $49,999 | 204 | 6.7% |
| $50,000 to $74,999 | 901 | 29.6% |
| $75,000 to $99,999 | 262 | 8.6% |
| $100,000 to $149,999 | 716 | 23.5% |
| $150,000 to $199,999 | 204 | 6.7% |
| $200,000+ | 113 | 3.7% |
Family Income by Famaliy Size in Woodmere
5-person families (165 | 5.4%) account for the highest median family income in Woodmere with $121,938 per family, while 2-person families (1,383 | 45.4%) have the highest median income of $34,639 per family member.
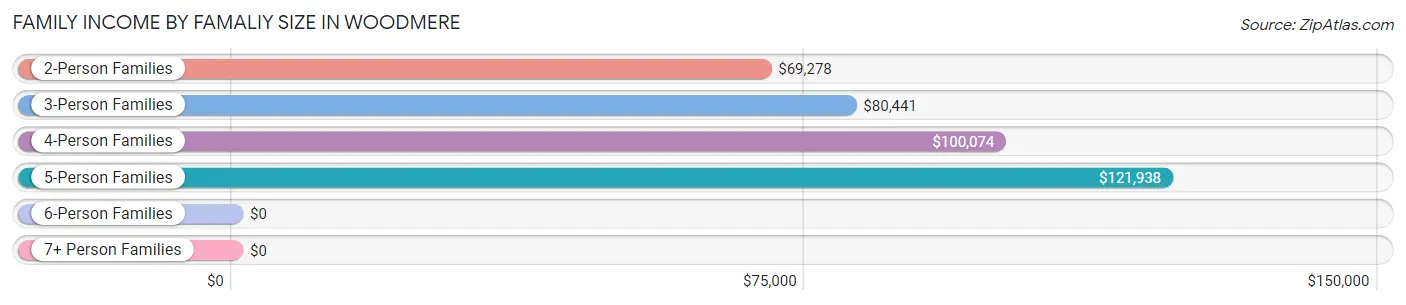
| Income Bracket | # Families | Median Income |
| 2-Person Families | 1,383 (45.4%) | $69,278 |
| 3-Person Families | 584 (19.2%) | $80,441 |
| 4-Person Families | 729 (23.9%) | $100,074 |
| 5-Person Families | 165 (5.4%) | $121,938 |
| 6-Person Families | 144 (4.7%) | $0 |
| 7+ Person Families | 40 (1.3%) | $0 |
| Total | 3,045 (100.0%) | $72,472 |
Family Income by Number of Earners in Woodmere
The median family income in Woodmere is $72,472, with families comprising 3+ earners (371) having the highest median family income of $125,099, while families with 1 earner (1,311) have the lowest median family income of $52,948, accounting for 12.2% and 43.0% of families, respectively.
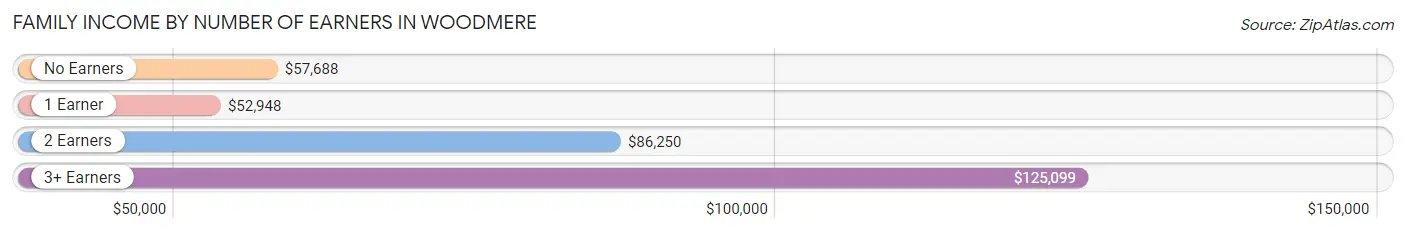
| Number of Earners | # Families | Median Income |
| No Earners | 449 (14.7%) | $57,688 |
| 1 Earner | 1,311 (43.0%) | $52,948 |
| 2 Earners | 914 (30.0%) | $86,250 |
| 3+ Earners | 371 (12.2%) | $125,099 |
| Total | 3,045 (100.0%) | $72,472 |
Household Income in Woodmere
Household Income Brackets in Woodmere
With 1,248 households falling in the category, the $50,000 to $74,999 income range is the most frequent in Woodmere, accounting for 31.8% of all households. In contrast, only 122 households (3.1%) fall into the $200,000+ income bracket, making it the least populous group.
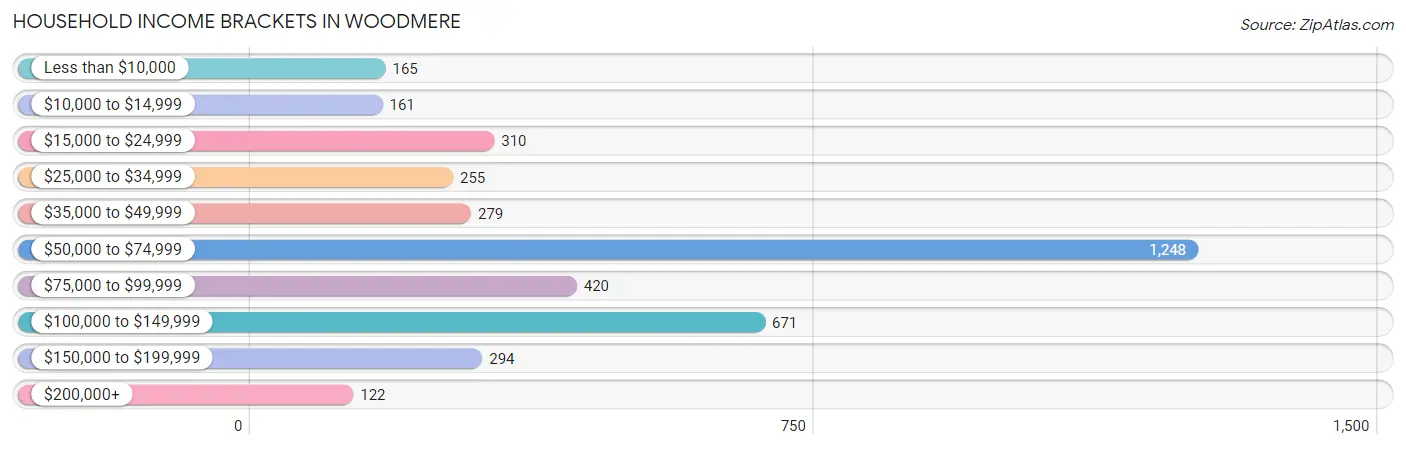
| Income Bracket | # Households | % Households |
| Less than $10,000 | 165 | 4.2% |
| $10,000 to $14,999 | 161 | 4.1% |
| $15,000 to $24,999 | 310 | 7.9% |
| $25,000 to $34,999 | 255 | 6.5% |
| $35,000 to $49,999 | 279 | 7.1% |
| $50,000 to $74,999 | 1,248 | 31.8% |
| $75,000 to $99,999 | 420 | 10.7% |
| $100,000 to $149,999 | 671 | 17.1% |
| $150,000 to $199,999 | 294 | 7.5% |
| $200,000+ | 122 | 3.1% |
Household Income by Householder Age in Woodmere
The median household income in Woodmere is $70,087, with the highest median household income of $73,015 found in the 65+ years age bracket for the primary householder. A total of 1,107 households (28.2%) fall into this category.
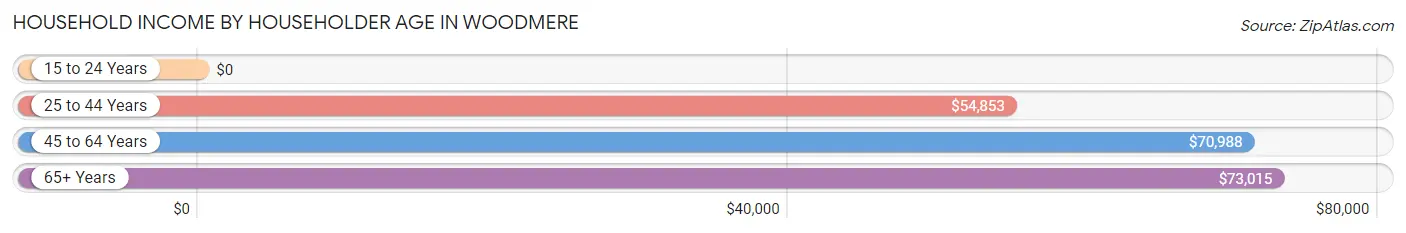
| Income Bracket | # Households | Median Income |
| 15 to 24 Years | 0 (0.0%) | $0 |
| 25 to 44 Years | 1,044 (26.6%) | $54,853 |
| 45 to 64 Years | 1,775 (45.2%) | $70,988 |
| 65+ Years | 1,107 (28.2%) | $73,015 |
| Total | 3,926 (100.0%) | $70,087 |
Poverty in Woodmere
Income Below Poverty by Sex and Age in Woodmere
With 11.6% poverty level for males and 15.9% for females among the residents of Woodmere, 6 to 11 year old males and 5 year old females are the most vulnerable to poverty, with 296 males (62.3%) and 23 females (100.0%) in their respective age groups living below the poverty level.
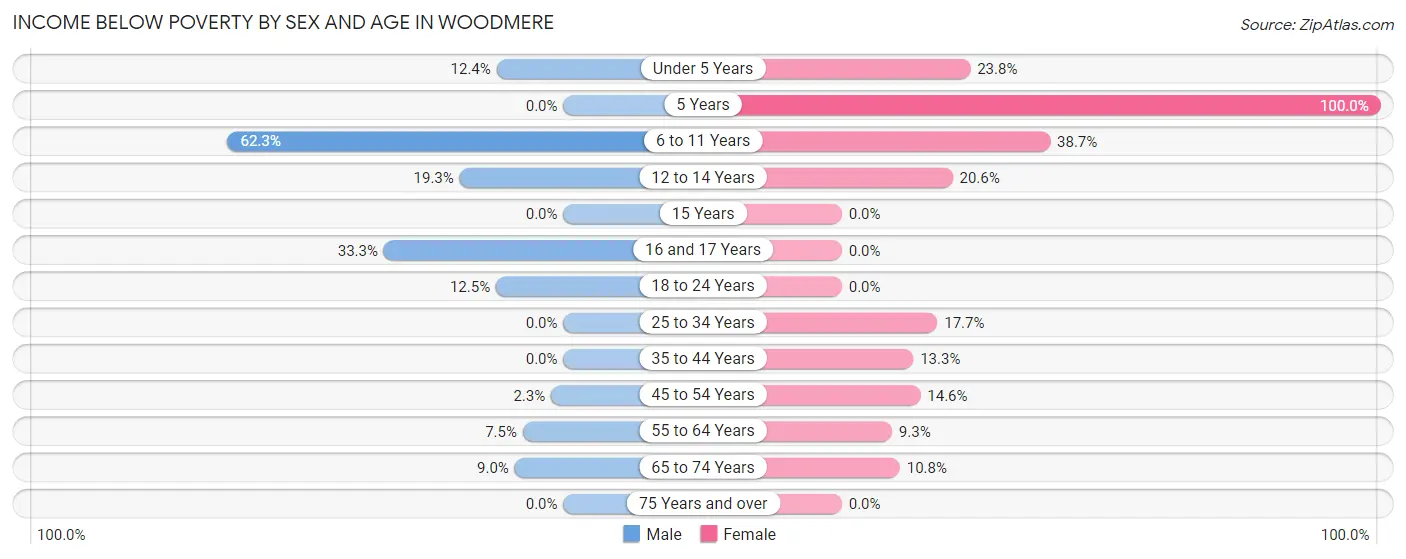
| Age Bracket | Male | Female |
| Under 5 Years | 55 (12.4%) | 82 (23.8%) |
| 5 Years | 0 (0.0%) | 23 (100.0%) |
| 6 to 11 Years | 296 (62.3%) | 198 (38.7%) |
| 12 to 14 Years | 73 (19.3%) | 45 (20.5%) |
| 15 Years | 0 (0.0%) | 0 (0.0%) |
| 16 and 17 Years | 48 (33.3%) | 0 (0.0%) |
| 18 to 24 Years | 82 (12.5%) | 0 (0.0%) |
| 25 to 34 Years | 0 (0.0%) | 205 (17.7%) |
| 35 to 44 Years | 0 (0.0%) | 100 (13.3%) |
| 45 to 54 Years | 14 (2.3%) | 107 (14.6%) |
| 55 to 64 Years | 56 (7.5%) | 69 (9.3%) |
| 65 to 74 Years | 71 (9.0%) | 70 (10.8%) |
| 75 Years and over | 0 (0.0%) | 0 (0.0%) |
| Total | 695 (11.6%) | 899 (15.9%) |
Income Above Poverty by Sex and Age in Woodmere
According to the poverty statistics in Woodmere, males aged 5 years and females aged 15 years are the age groups that are most secure financially, with 100.0% of males and 100.0% of females in these age groups living above the poverty line.
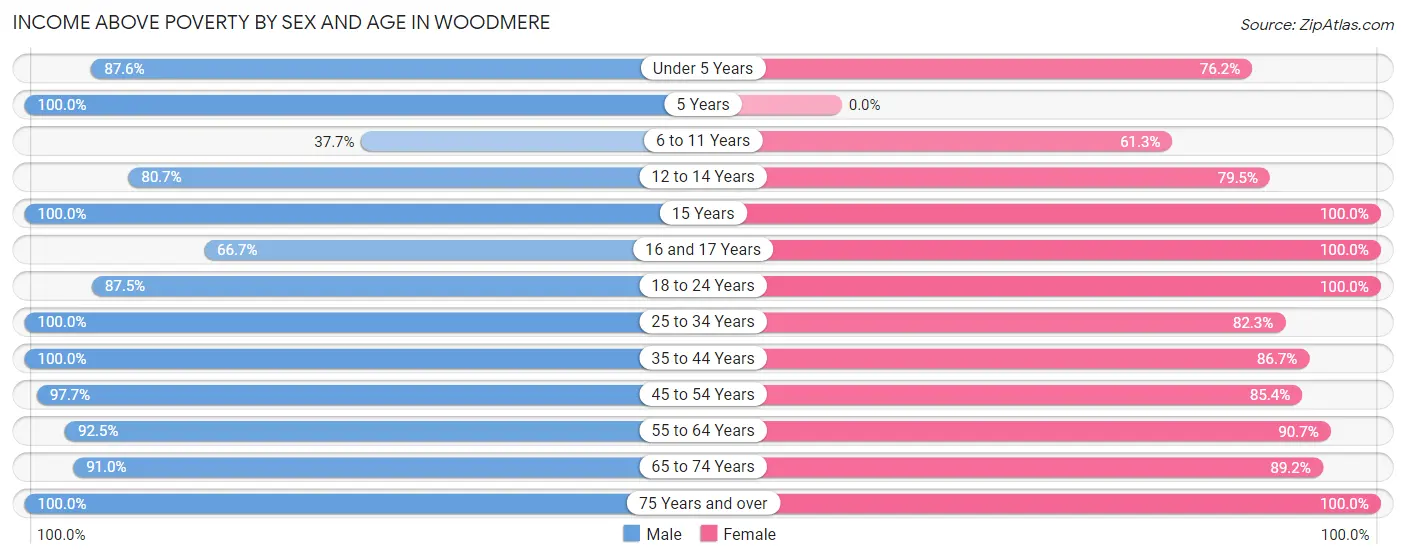
| Age Bracket | Male | Female |
| Under 5 Years | 389 (87.6%) | 262 (76.2%) |
| 5 Years | 127 (100.0%) | 0 (0.0%) |
| 6 to 11 Years | 179 (37.7%) | 314 (61.3%) |
| 12 to 14 Years | 306 (80.7%) | 174 (79.4%) |
| 15 Years | 55 (100.0%) | 64 (100.0%) |
| 16 and 17 Years | 96 (66.7%) | 71 (100.0%) |
| 18 to 24 Years | 574 (87.5%) | 240 (100.0%) |
| 25 to 34 Years | 606 (100.0%) | 951 (82.3%) |
| 35 to 44 Years | 763 (100.0%) | 654 (86.7%) |
| 45 to 54 Years | 601 (97.7%) | 627 (85.4%) |
| 55 to 64 Years | 689 (92.5%) | 673 (90.7%) |
| 65 to 74 Years | 715 (91.0%) | 580 (89.2%) |
| 75 Years and over | 195 (100.0%) | 162 (100.0%) |
| Total | 5,295 (88.4%) | 4,772 (84.2%) |
Income Below Poverty Among Married-Couple Families in Woodmere
The poverty statistics for married-couple families in Woodmere show that 0.6% or 9 of the total 1,464 families live below the poverty line. Families with no children have the highest poverty rate of 0.9%, comprising of 9 families. On the other hand, families with 1 or 2 children have the lowest poverty rate of 0.0%, which includes 0 families.
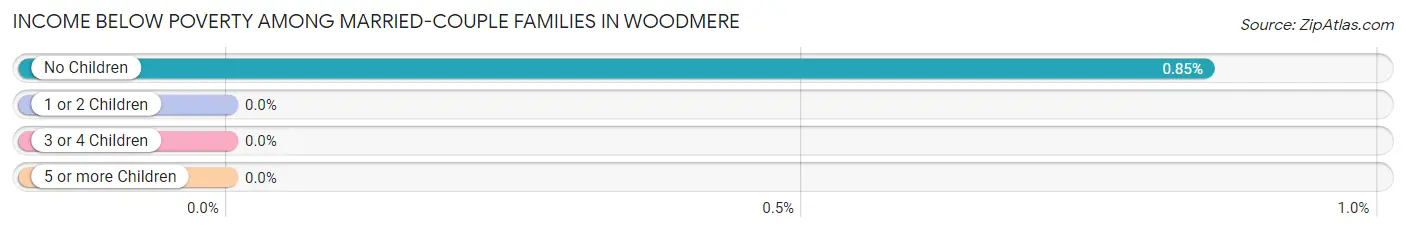
| Children | Above Poverty | Below Poverty |
| No Children | 1,052 (99.2%) | 9 (0.9%) |
| 1 or 2 Children | 379 (100.0%) | 0 (0.0%) |
| 3 or 4 Children | 24 (100.0%) | 0 (0.0%) |
| 5 or more Children | 0 (0.0%) | 0 (0.0%) |
| Total | 1,455 (99.4%) | 9 (0.6%) |
Income Below Poverty Among Single-Parent Households in Woodmere
According to the poverty data in Woodmere, 9.2% or 53 single-father households and 29.3% or 295 single-mother households are living below the poverty line. Among single-father households, those with no children have the highest poverty rate, with 33 households (11.5%) experiencing poverty. Likewise, among single-mother households, those with 5 or more children have the highest poverty rate, with 59 households (76.6%) falling below the poverty line.
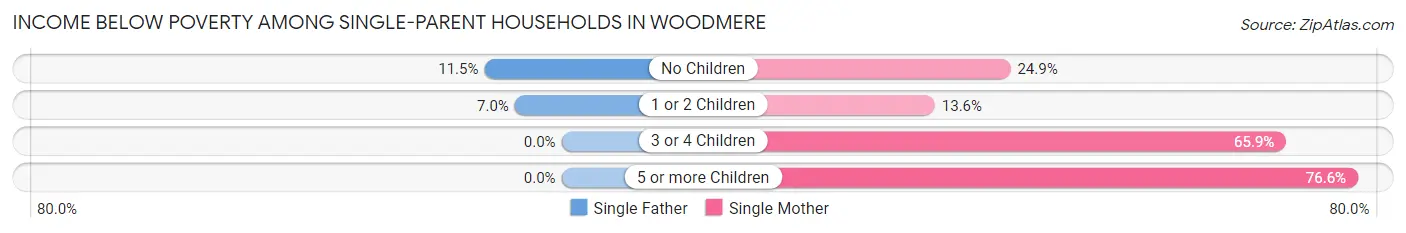
| Children | Single Father | Single Mother |
| No Children | 33 (11.5%) | 86 (24.9%) |
| 1 or 2 Children | 20 (7.0%) | 61 (13.6%) |
| 3 or 4 Children | 0 (0.0%) | 89 (65.9%) |
| 5 or more Children | 0 (0.0%) | 59 (76.6%) |
| Total | 53 (9.2%) | 295 (29.3%) |
Income Below Poverty Among Married-Couple vs Single-Parent Households in Woodmere
The poverty data for Woodmere shows that 9 of the married-couple family households (0.6%) and 348 of the single-parent households (22.0%) are living below the poverty level. Within the married-couple family households, those with no children have the highest poverty rate, with 9 households (0.9%) falling below the poverty line. Among the single-parent households, those with 5 or more children have the highest poverty rate, with 59 household (76.6%) living below poverty.
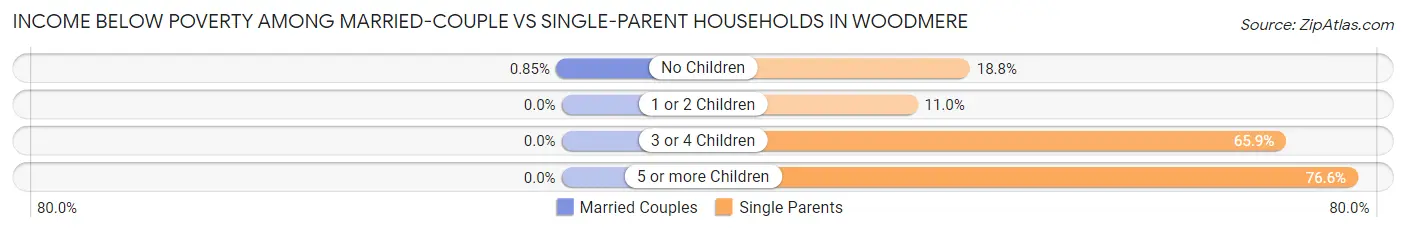
| Children | Married-Couple Families | Single-Parent Households |
| No Children | 9 (0.9%) | 119 (18.8%) |
| 1 or 2 Children | 0 (0.0%) | 81 (11.0%) |
| 3 or 4 Children | 0 (0.0%) | 89 (65.9%) |
| 5 or more Children | 0 (0.0%) | 59 (76.6%) |
| Total | 9 (0.6%) | 348 (22.0%) |
Race in Woodmere
The most populous races in Woodmere are Black / African American (9,463 | 81.1%), White / Caucasian (1,028 | 8.8%), and Some other Race (586 | 5.0%).
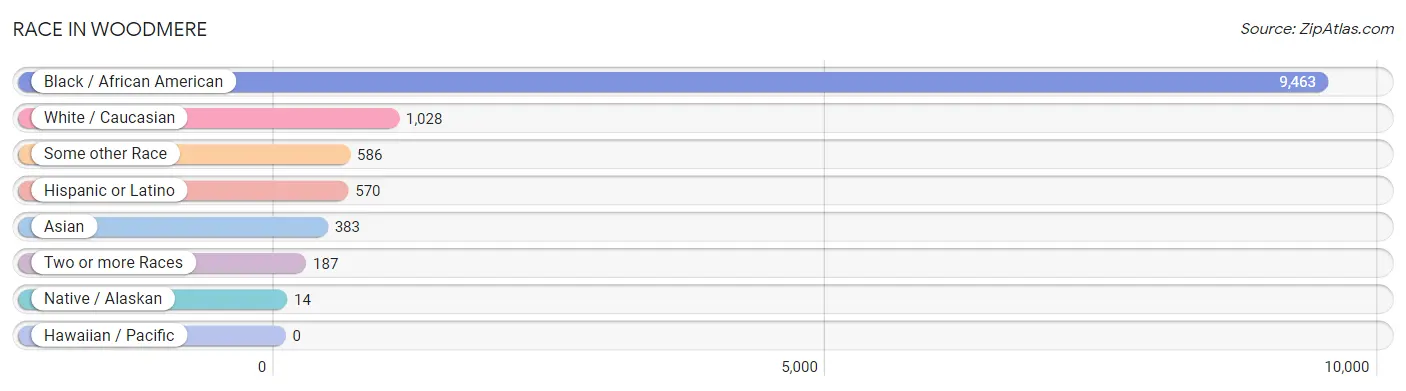
| Race | # Population | % Population |
| Asian | 383 | 3.3% |
| Black / African American | 9,463 | 81.1% |
| Hawaiian / Pacific | 0 | 0.0% |
| Hispanic or Latino | 570 | 4.9% |
| Native / Alaskan | 14 | 0.1% |
| White / Caucasian | 1,028 | 8.8% |
| Two or more Races | 187 | 1.6% |
| Some other Race | 586 | 5.0% |
| Total | 11,661 | 100.0% |
Ancestry in Woodmere
The most populous ancestries reported in Woodmere are African (489 | 4.2%), Subsaharan African (489 | 4.2%), French (365 | 3.1%), Central American (339 | 2.9%), and Honduran (262 | 2.2%), together accounting for 16.7% of all Woodmere residents.
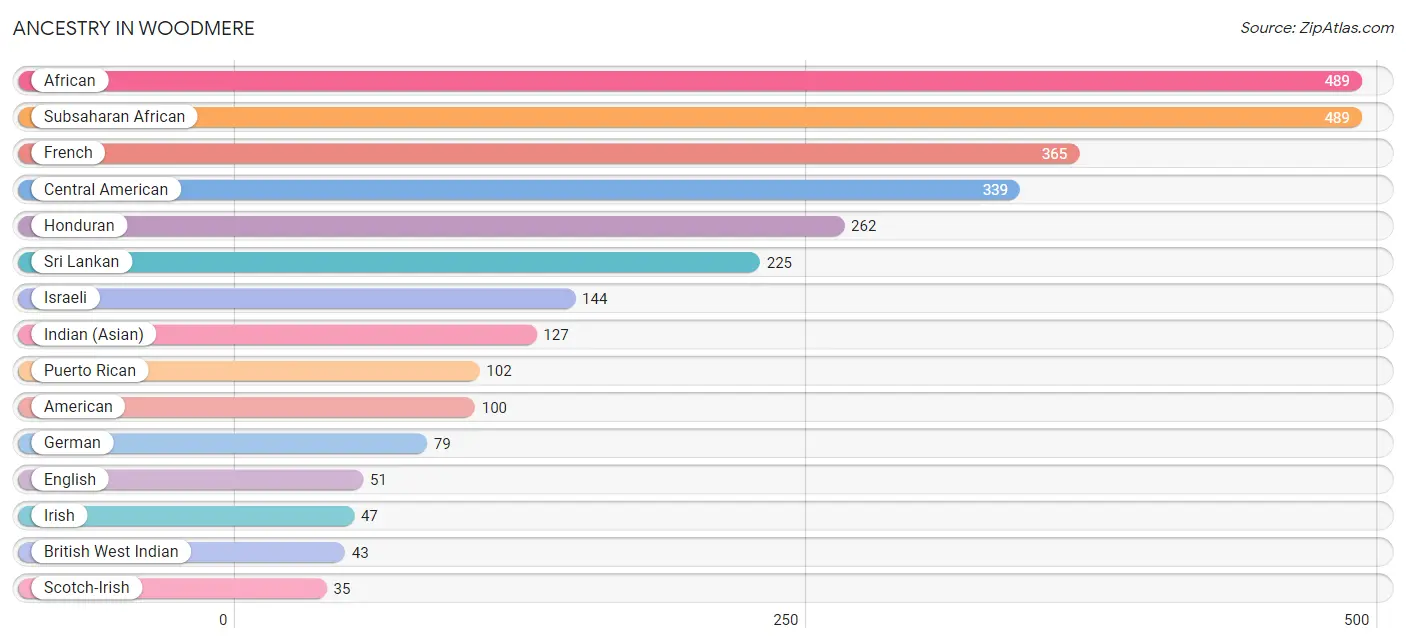
| Ancestry | # Population | % Population |
| African | 489 | 4.2% |
| American | 100 | 0.9% |
| British West Indian | 43 | 0.4% |
| Burmese | 33 | 0.3% |
| Central American | 339 | 2.9% |
| Comanche | 3 | 0.0% |
| Cuban | 11 | 0.1% |
| Dominican | 21 | 0.2% |
| English | 51 | 0.4% |
| European | 17 | 0.2% |
| French | 365 | 3.1% |
| French Canadian | 34 | 0.3% |
| German | 79 | 0.7% |
| Guatemalan | 33 | 0.3% |
| Haitian | 30 | 0.3% |
| Honduran | 262 | 2.2% |
| Houma | 14 | 0.1% |
| Indian (Asian) | 127 | 1.1% |
| Irish | 47 | 0.4% |
| Israeli | 144 | 1.2% |
| Italian | 29 | 0.3% |
| Jamaican | 17 | 0.2% |
| Korean | 33 | 0.3% |
| Nicaraguan | 31 | 0.3% |
| Puerto Rican | 102 | 0.9% |
| Salvadoran | 13 | 0.1% |
| Scandinavian | 7 | 0.1% |
| Scotch-Irish | 35 | 0.3% |
| Spanish | 17 | 0.2% |
| Sri Lankan | 225 | 1.9% |
| Subsaharan African | 489 | 4.2% | View All 31 Rows |
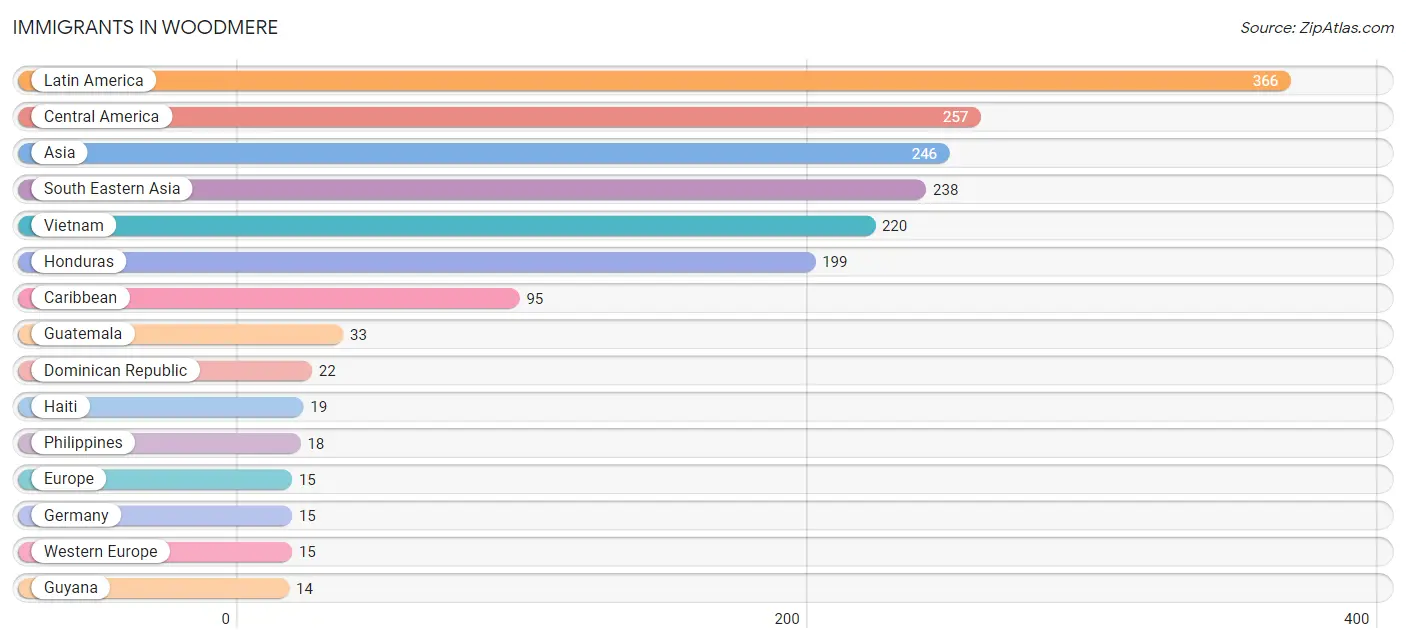
Immigrants in Woodmere
The most numerous immigrant groups reported in Woodmere came from Latin America (366 | 3.1%), Central America (257 | 2.2%), Asia (246 | 2.1%), South Eastern Asia (238 | 2.0%), and Vietnam (220 | 1.9%), together accounting for 11.4% of all Woodmere residents.
| Immigration Origin | # Population | % Population |
| Asia | 246 | 2.1% |
| Caribbean | 95 | 0.8% |
| Central America | 257 | 2.2% |
| Cuba | 11 | 0.1% |
| Dominican Republic | 22 | 0.2% |
| Eastern Asia | 8 | 0.1% |
| El Salvador | 13 | 0.1% |
| Europe | 15 | 0.1% |
| Germany | 15 | 0.1% |
| Guatemala | 33 | 0.3% |
| Guyana | 14 | 0.1% |
| Haiti | 19 | 0.2% |
| Honduras | 199 | 1.7% |
| Korea | 8 | 0.1% |
| Latin America | 366 | 3.1% |
| Nicaragua | 12 | 0.1% |
| Philippines | 18 | 0.2% |
| South America | 14 | 0.1% |
| South Eastern Asia | 238 | 2.0% |
| Vietnam | 220 | 1.9% |
| Western Europe | 15 | 0.1% | View All 21 Rows |
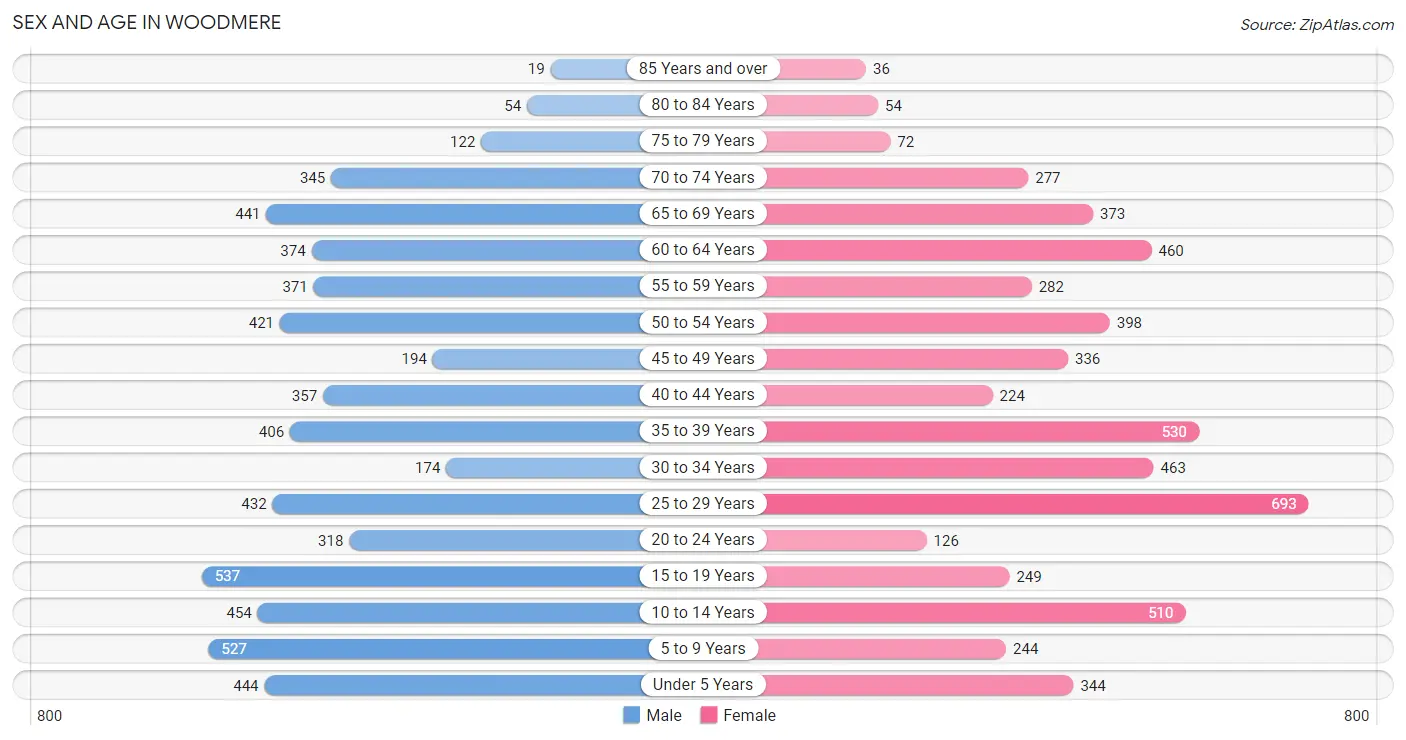
Sex and Age in Woodmere
Sex and Age in Woodmere
The most populous age groups in Woodmere are 15 to 19 Years (537 | 9.0%) for men and 25 to 29 Years (693 | 12.2%) for women.
| Age Bracket | Male | Female |
| Under 5 Years | 444 (7.4%) | 344 (6.1%) |
| 5 to 9 Years | 527 (8.8%) | 244 (4.3%) |
| 10 to 14 Years | 454 (7.6%) | 510 (9.0%) |
| 15 to 19 Years | 537 (9.0%) | 249 (4.4%) |
| 20 to 24 Years | 318 (5.3%) | 126 (2.2%) |
| 25 to 29 Years | 432 (7.2%) | 693 (12.2%) |
| 30 to 34 Years | 174 (2.9%) | 463 (8.2%) |
| 35 to 39 Years | 406 (6.8%) | 530 (9.3%) |
| 40 to 44 Years | 357 (6.0%) | 224 (4.0%) |
| 45 to 49 Years | 194 (3.2%) | 336 (5.9%) |
| 50 to 54 Years | 421 (7.0%) | 398 (7.0%) |
| 55 to 59 Years | 371 (6.2%) | 282 (5.0%) |
| 60 to 64 Years | 374 (6.2%) | 460 (8.1%) |
| 65 to 69 Years | 441 (7.4%) | 373 (6.6%) |
| 70 to 74 Years | 345 (5.8%) | 277 (4.9%) |
| 75 to 79 Years | 122 (2.0%) | 72 (1.3%) |
| 80 to 84 Years | 54 (0.9%) | 54 (0.9%) |
| 85 Years and over | 19 (0.3%) | 36 (0.6%) |
| Total | 5,990 (100.0%) | 5,671 (100.0%) |
Families and Households in Woodmere
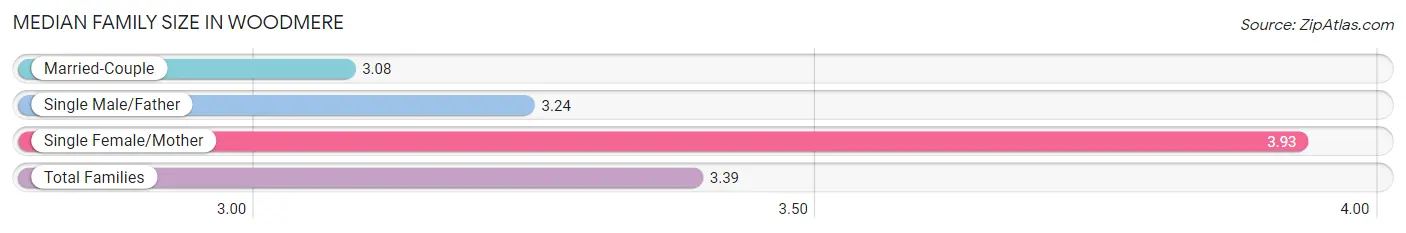
Median Family Size in Woodmere
The median family size in Woodmere is 3.39 persons per family, with single female/mother families (1,007 | 33.1%) accounting for the largest median family size of 3.93 persons per family. On the other hand, married-couple families (1,464 | 48.1%) represent the smallest median family size with 3.08 persons per family.
| Family Type | # Families | Family Size |
| Married-Couple | 1,464 (48.1%) | 3.08 |
| Single Male/Father | 574 (18.9%) | 3.24 |
| Single Female/Mother | 1,007 (33.1%) | 3.93 |
| Total Families | 3,045 (100.0%) | 3.39 |
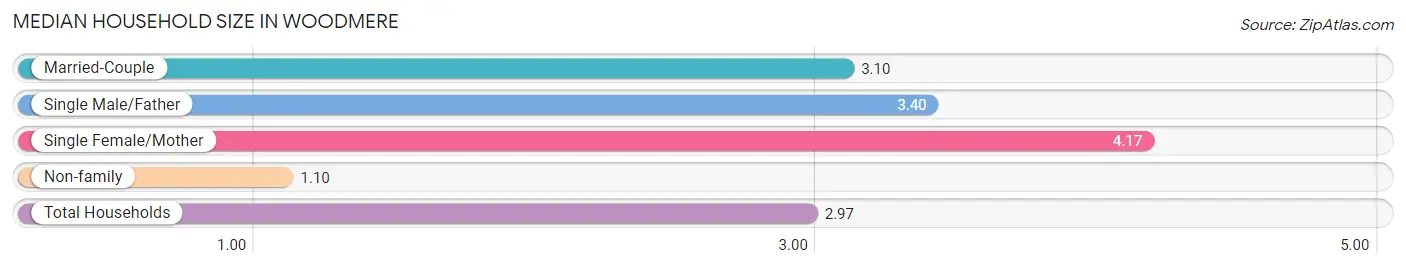
Median Household Size in Woodmere
The median household size in Woodmere is 2.97 persons per household, with single female/mother households (1,007 | 25.7%) accounting for the largest median household size of 4.17 persons per household. non-family households (881 | 22.4%) represent the smallest median household size with 1.10 persons per household.
| Household Type | # Households | Household Size |
| Married-Couple | 1,464 (37.3%) | 3.10 |
| Single Male/Father | 574 (14.6%) | 3.40 |
| Single Female/Mother | 1,007 (25.7%) | 4.17 |
| Non-family | 881 (22.4%) | 1.10 |
| Total Households | 3,926 (100.0%) | 2.97 |
Household Size by Marriage Status in Woodmere
Out of a total of 3,926 households in Woodmere, 3,045 (77.6%) are family households, while 881 (22.4%) are nonfamily households. The most numerous type of family households are 2-person households, comprising 1,265, and the most common type of nonfamily households are 1-person households, comprising 812.
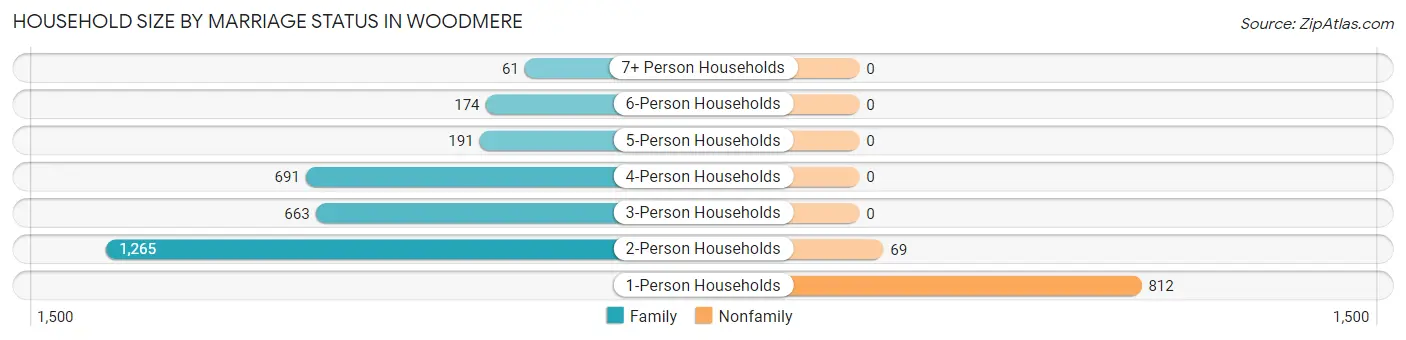
| Household Size | Family Households | Nonfamily Households |
| 1-Person Households | - | 812 (20.7%) |
| 2-Person Households | 1,265 (32.2%) | 69 (1.8%) |
| 3-Person Households | 663 (16.9%) | 0 (0.0%) |
| 4-Person Households | 691 (17.6%) | 0 (0.0%) |
| 5-Person Households | 191 (4.9%) | 0 (0.0%) |
| 6-Person Households | 174 (4.4%) | 0 (0.0%) |
| 7+ Person Households | 61 (1.5%) | 0 (0.0%) |
| Total | 3,045 (77.6%) | 881 (22.4%) |
Female Fertility in Woodmere
Fertility by Age in Woodmere
Average fertility rate in Woodmere is 93.0 births per 1,000 women. Women in the age bracket of 20 to 34 years have the highest fertility rate with 137.0 births per 1,000 women. Women in the age bracket of 20 to 34 years acount for 70.3% of all women with births.
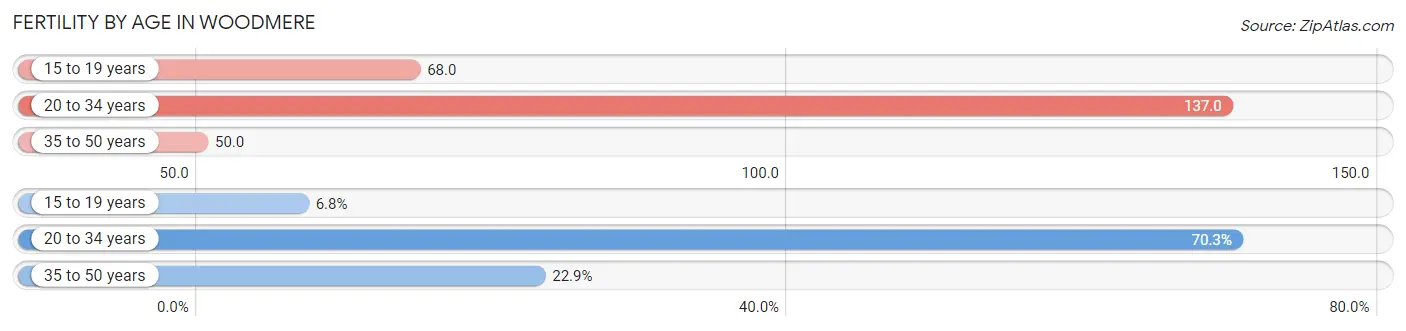
| Age Bracket | Women with Births | Births / 1,000 Women |
| 15 to 19 years | 17 (6.8%) | 68.0 |
| 20 to 34 years | 175 (70.3%) | 137.0 |
| 35 to 50 years | 57 (22.9%) | 50.0 |
| Total | 249 (100.0%) | 93.0 |
Fertility by Age by Marriage Status in Woodmere
72.3% of women with births (249) in Woodmere are married. The highest percentage of unmarried women with births falls into 15 to 19 years age bracket with 100.0% of them unmarried at the time of birth, while the lowest percentage of unmarried women with births belong to 35 to 50 years age bracket with 0.0% of them unmarried.
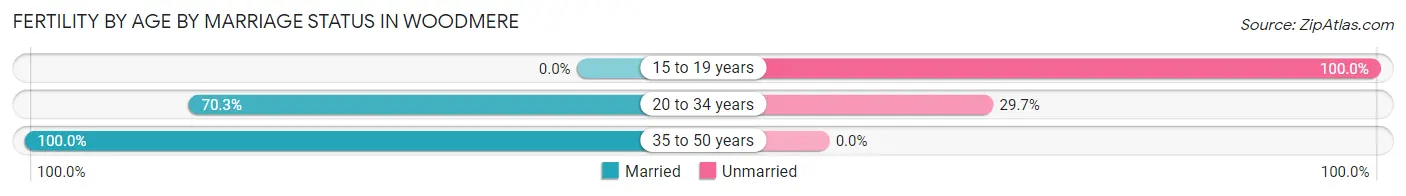
| Age Bracket | Married | Unmarried |
| 15 to 19 years | 0 (0.0%) | 17 (100.0%) |
| 20 to 34 years | 123 (70.3%) | 52 (29.7%) |
| 35 to 50 years | 57 (100.0%) | 0 (0.0%) |
| Total | 180 (72.3%) | 69 (27.7%) |
Fertility by Education in Woodmere
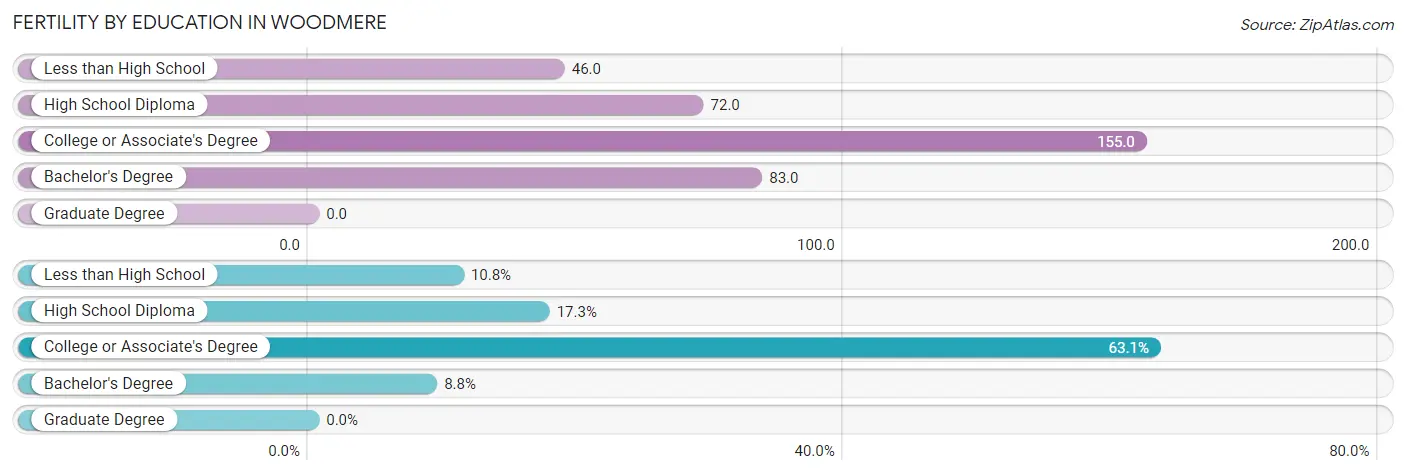
| Educational Attainment | Women with Births | Births / 1,000 Women |
| Less than High School | 27 (10.8%) | 46.0 |
| High School Diploma | 43 (17.3%) | 72.0 |
| College or Associate's Degree | 157 (63.0%) | 155.0 |
| Bachelor's Degree | 22 (8.8%) | 83.0 |
| Graduate Degree | 0 (0.0%) | 0.0 |
| Total | 249 (100.0%) | 93.0 |
Fertility by Education by Marriage Status in Woodmere
27.7% of women with births in Woodmere are unmarried. Women with the educational attainment of less than high school are most likely to be married with 100.0% of them married at childbirth, while women with the educational attainment of college or associate's degree are least likely to be married with 44.0% of them unmarried at childbirth.
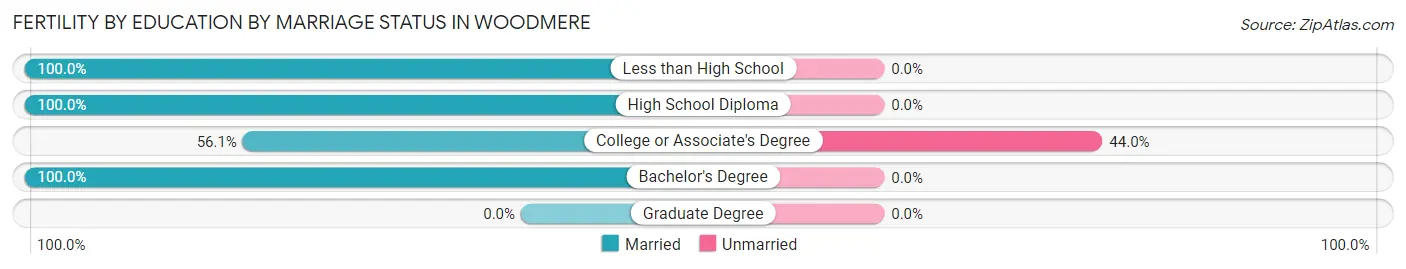
| Educational Attainment | Married | Unmarried |
| Less than High School | 27 (100.0%) | 0 (0.0%) |
| High School Diploma | 43 (100.0%) | 0 (0.0%) |
| College or Associate's Degree | 88 (56.0%) | 69 (44.0%) |
| Bachelor's Degree | 22 (100.0%) | 0 (0.0%) |
| Graduate Degree | 0 (0.0%) | 0 (0.0%) |
| Total | 180 (72.3%) | 69 (27.7%) |
Employment Characteristics in Woodmere
Employment by Class of Employer in Woodmere
Among the 4,787 employed individuals in Woodmere, private company employees (3,257 | 68.0%), local government employees (380 | 7.9%), and federal government employees (374 | 7.8%) make up the most common classes of employment.
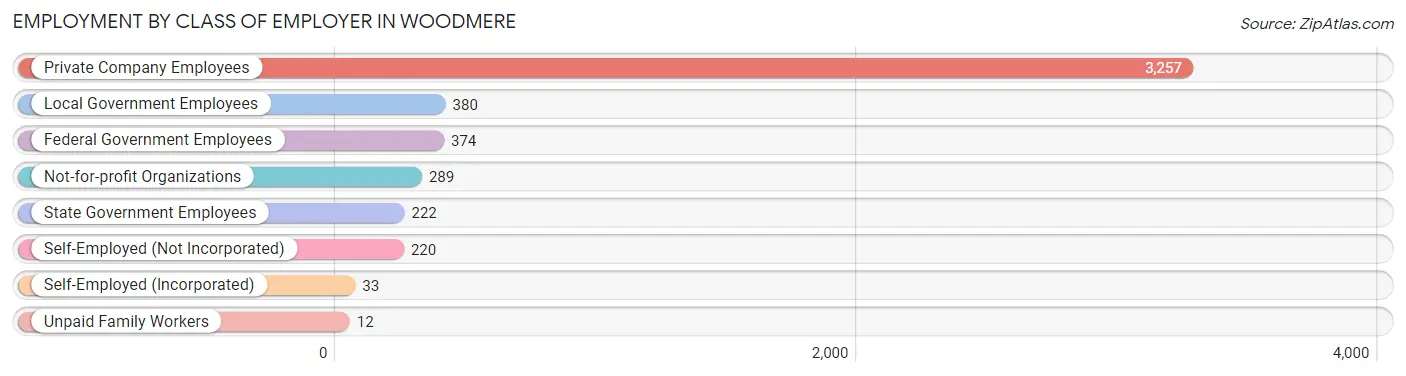
| Employer Class | # Employees | % Employees |
| Private Company Employees | 3,257 | 68.0% |
| Self-Employed (Incorporated) | 33 | 0.7% |
| Self-Employed (Not Incorporated) | 220 | 4.6% |
| Not-for-profit Organizations | 289 | 6.0% |
| Local Government Employees | 380 | 7.9% |
| State Government Employees | 222 | 4.6% |
| Federal Government Employees | 374 | 7.8% |
| Unpaid Family Workers | 12 | 0.3% |
| Total | 4,787 | 100.0% |
Employment Status by Age in Woodmere
According to the labor force statistics for Woodmere, out of the total population over 16 years of age (9,019), 60.2% or 5,429 individuals are in the labor force, with 9.2% or 499 of them unemployed. The age group with the highest labor force participation rate is 20 to 24 years, with 90.1% or 400 individuals in the labor force. Within the labor force, the 65 to 74 years age range has the highest percentage of unemployed individuals, with 28.4% or 91 of them being unemployed.
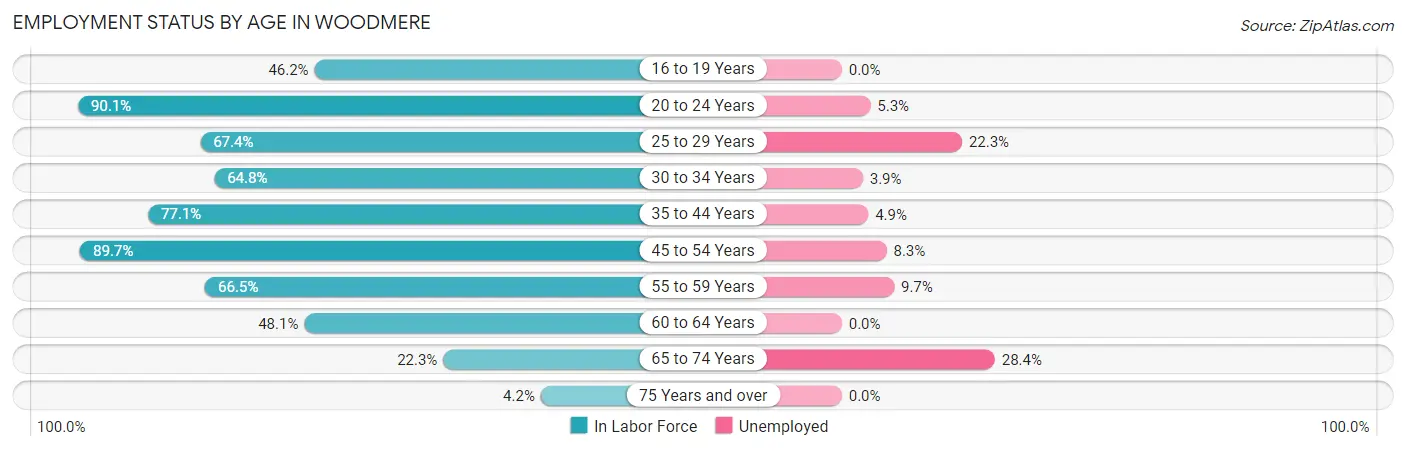
| Age Bracket | In Labor Force | Unemployed |
| 16 to 19 Years | 308 (46.2%) | 0 (0.0%) |
| 20 to 24 Years | 400 (90.1%) | 21 (5.3%) |
| 25 to 29 Years | 758 (67.4%) | 169 (22.3%) |
| 30 to 34 Years | 413 (64.8%) | 16 (3.9%) |
| 35 to 44 Years | 1,170 (77.1%) | 57 (4.9%) |
| 45 to 54 Years | 1,210 (89.7%) | 100 (8.3%) |
| 55 to 59 Years | 434 (66.5%) | 42 (9.7%) |
| 60 to 64 Years | 401 (48.1%) | 0 (0.0%) |
| 65 to 74 Years | 320 (22.3%) | 91 (28.4%) |
| 75 Years and over | 15 (4.2%) | 0 (0.0%) |
| Total | 5,429 (60.2%) | 499 (9.2%) |
Employment Status by Educational Attainment in Woodmere
According to labor force statistics for Woodmere, 71.7% of individuals (4,384) out of the total population between 25 and 64 years of age (6,115) are in the labor force, with 8.8% or 386 of them being unemployed. The group with the highest labor force participation rate are those with the educational attainment of bachelor's degree or higher, with 82.7% or 810 individuals in the labor force. Within the labor force, individuals with bachelor's degree or higher education have the highest percentage of unemployment, with 11.7% or 95 of them being unemployed.
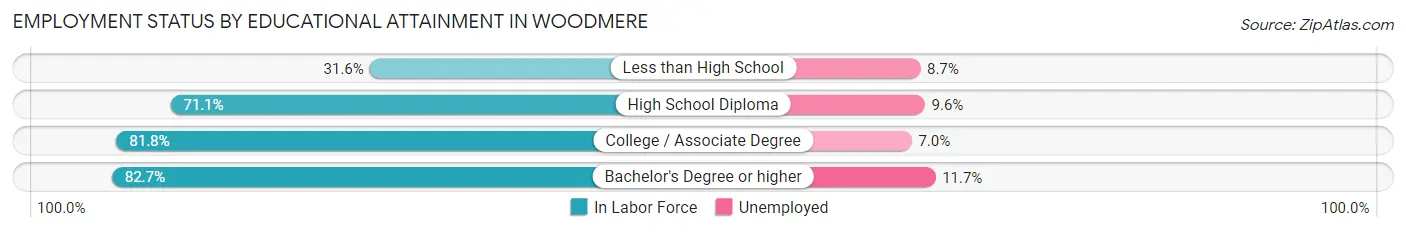
| Educational Attainment | In Labor Force | Unemployed |
| Less than High School | 264 (31.6%) | 73 (8.7%) |
| High School Diploma | 1,367 (71.1%) | 185 (9.6%) |
| College / Associate Degree | 1,945 (81.8%) | 166 (7.0%) |
| Bachelor's Degree or higher | 810 (82.7%) | 115 (11.7%) |
| Total | 4,384 (71.7%) | 538 (8.8%) |
Employment Occupations by Sex in Woodmere
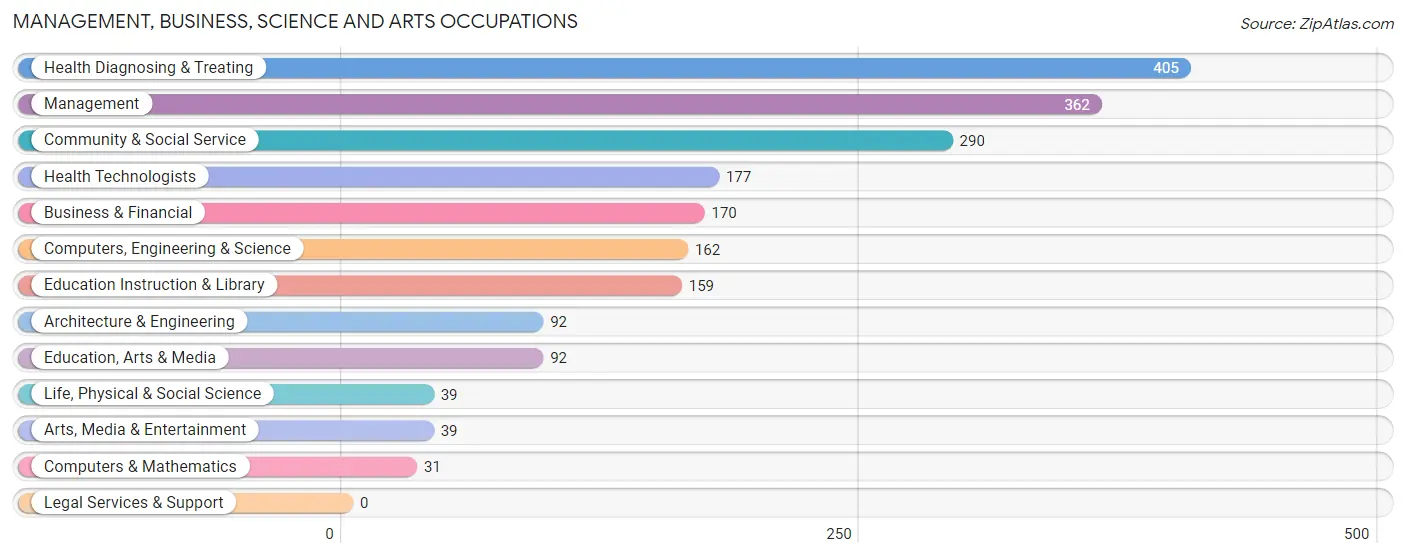
Management, Business, Science and Arts Occupations
The most common Management, Business, Science and Arts occupations in Woodmere are Health Diagnosing & Treating (405 | 8.2%), Management (362 | 7.3%), Community & Social Service (290 | 5.9%), Health Technologists (177 | 3.6%), and Business & Financial (170 | 3.5%).
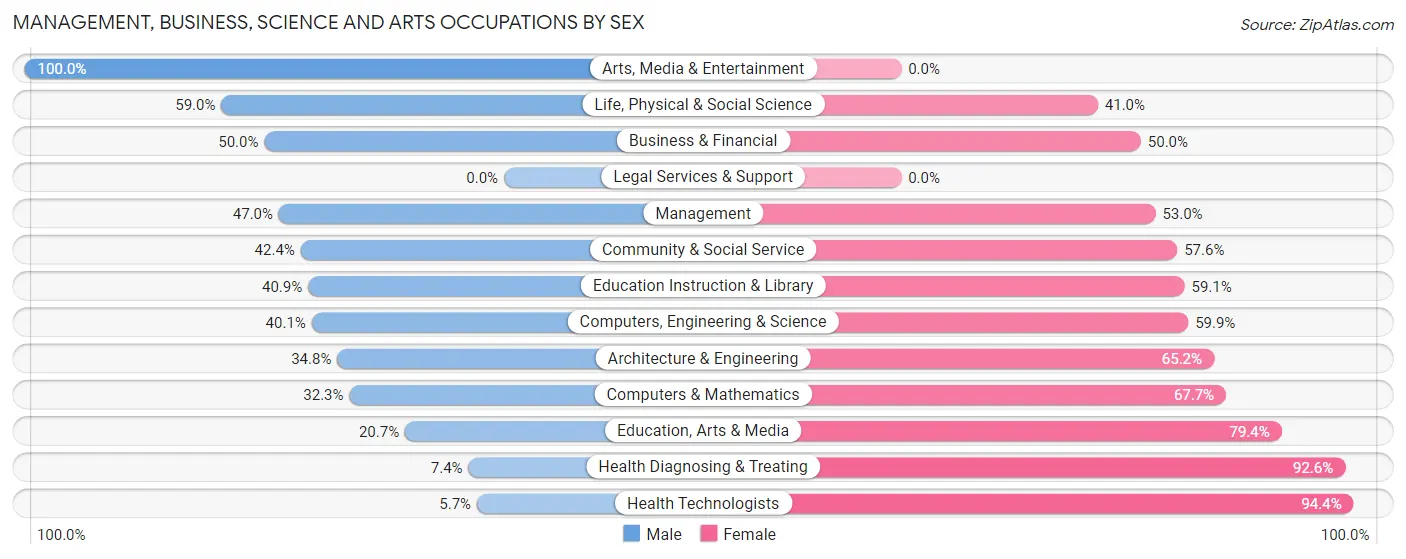
Management, Business, Science and Arts Occupations by Sex
Within the Management, Business, Science and Arts occupations in Woodmere, the most male-oriented occupations are Arts, Media & Entertainment (100.0%), Life, Physical & Social Science (59.0%), and Business & Financial (50.0%), while the most female-oriented occupations are Health Technologists (94.4%), Health Diagnosing & Treating (92.6%), and Education, Arts & Media (79.3%).
| Occupation | Male | Female |
| Management | 170 (47.0%) | 192 (53.0%) |
| Business & Financial | 85 (50.0%) | 85 (50.0%) |
| Computers, Engineering & Science | 65 (40.1%) | 97 (59.9%) |
| Computers & Mathematics | 10 (32.3%) | 21 (67.7%) |
| Architecture & Engineering | 32 (34.8%) | 60 (65.2%) |
| Life, Physical & Social Science | 23 (59.0%) | 16 (41.0%) |
| Community & Social Service | 123 (42.4%) | 167 (57.6%) |
| Education, Arts & Media | 19 (20.6%) | 73 (79.3%) |
| Legal Services & Support | 0 (0.0%) | 0 (0.0%) |
| Education Instruction & Library | 65 (40.9%) | 94 (59.1%) |
| Arts, Media & Entertainment | 39 (100.0%) | 0 (0.0%) |
| Health Diagnosing & Treating | 30 (7.4%) | 375 (92.6%) |
| Health Technologists | 10 (5.7%) | 167 (94.4%) |
| Total (Category) | 473 (34.1%) | 916 (65.9%) |
| Total (Overall) | 2,520 (51.1%) | 2,412 (48.9%) |
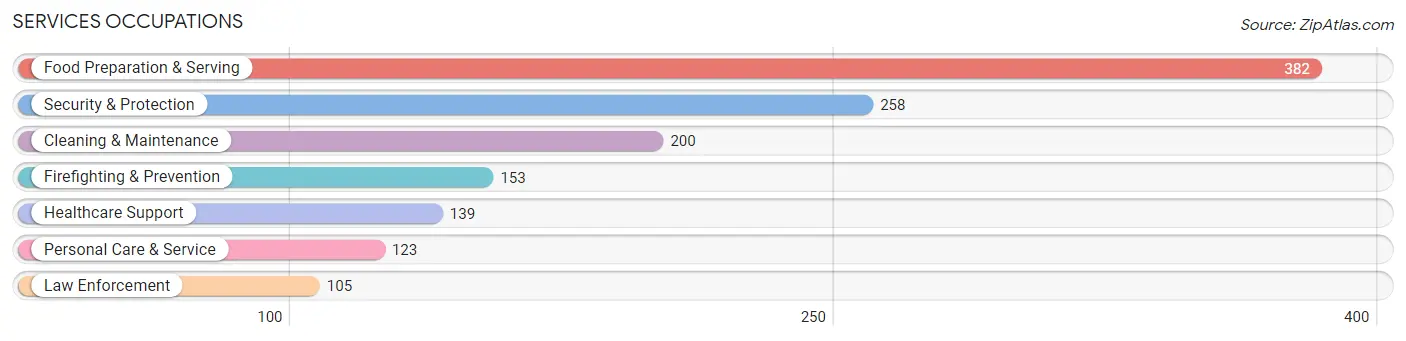
Services Occupations
The most common Services occupations in Woodmere are Food Preparation & Serving (382 | 7.7%), Security & Protection (258 | 5.2%), Cleaning & Maintenance (200 | 4.1%), Firefighting & Prevention (153 | 3.1%), and Healthcare Support (139 | 2.8%).
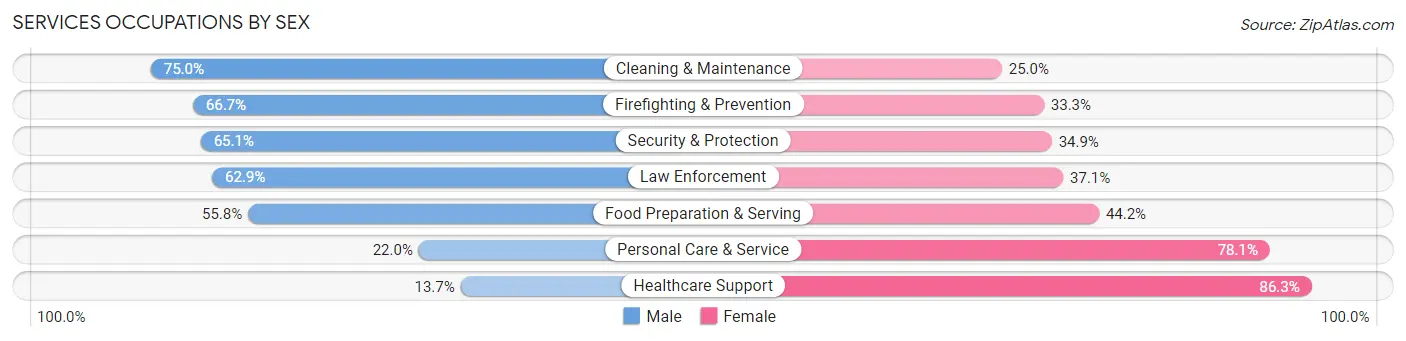
Services Occupations by Sex
Within the Services occupations in Woodmere, the most male-oriented occupations are Cleaning & Maintenance (75.0%), Firefighting & Prevention (66.7%), and Security & Protection (65.1%), while the most female-oriented occupations are Healthcare Support (86.3%), Personal Care & Service (78.0%), and Food Preparation & Serving (44.2%).
| Occupation | Male | Female |
| Healthcare Support | 19 (13.7%) | 120 (86.3%) |
| Security & Protection | 168 (65.1%) | 90 (34.9%) |
| Firefighting & Prevention | 102 (66.7%) | 51 (33.3%) |
| Law Enforcement | 66 (62.9%) | 39 (37.1%) |
| Food Preparation & Serving | 213 (55.8%) | 169 (44.2%) |
| Cleaning & Maintenance | 150 (75.0%) | 50 (25.0%) |
| Personal Care & Service | 27 (22.0%) | 96 (78.0%) |
| Total (Category) | 577 (52.4%) | 525 (47.6%) |
| Total (Overall) | 2,520 (51.1%) | 2,412 (48.9%) |
Sales and Office Occupations
The most common Sales and Office occupations in Woodmere are Sales & Related (685 | 13.9%), and Office & Administration (538 | 10.9%).
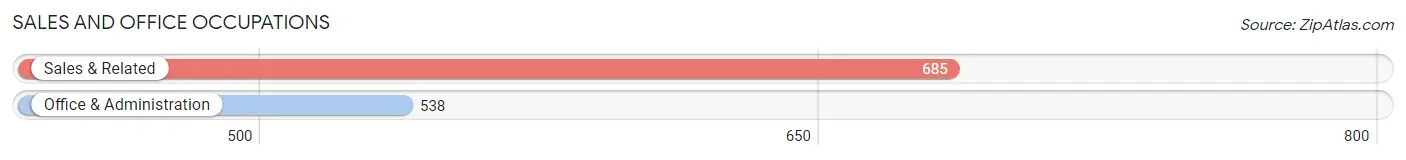
Sales and Office Occupations by Sex
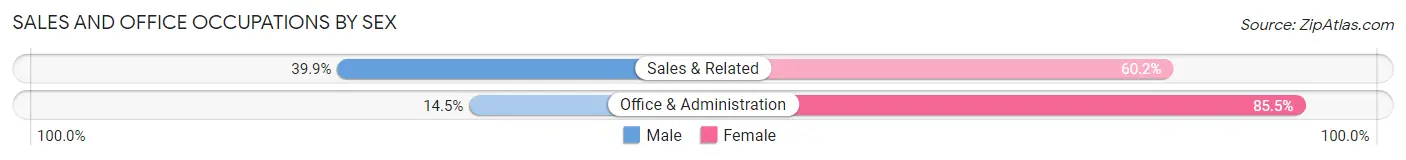
| Occupation | Male | Female |
| Sales & Related | 273 (39.9%) | 412 (60.2%) |
| Office & Administration | 78 (14.5%) | 460 (85.5%) |
| Total (Category) | 351 (28.7%) | 872 (71.3%) |
| Total (Overall) | 2,520 (51.1%) | 2,412 (48.9%) |
Natural Resources, Construction and Maintenance Occupations
The most common Natural Resources, Construction and Maintenance occupations in Woodmere are Construction & Extraction (309 | 6.3%), and Installation, Maintenance & Repair (141 | 2.9%).
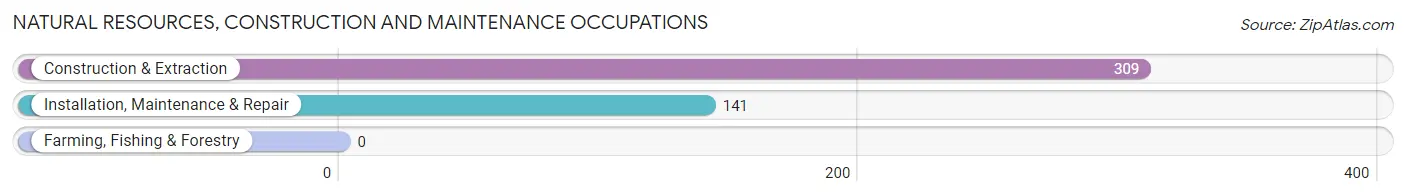
Natural Resources, Construction and Maintenance Occupations by Sex
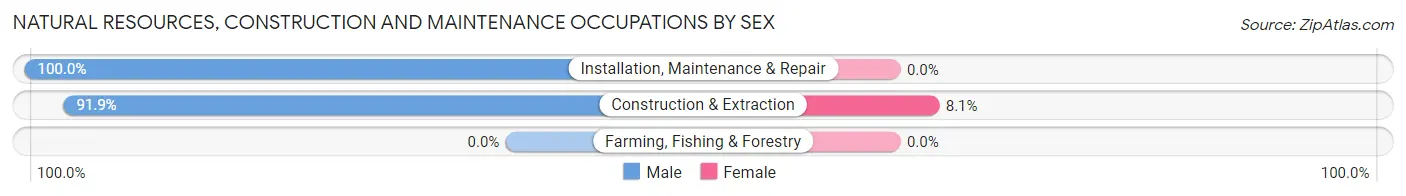
| Occupation | Male | Female |
| Farming, Fishing & Forestry | 0 (0.0%) | 0 (0.0%) |
| Construction & Extraction | 284 (91.9%) | 25 (8.1%) |
| Installation, Maintenance & Repair | 141 (100.0%) | 0 (0.0%) |
| Total (Category) | 425 (94.4%) | 25 (5.6%) |
| Total (Overall) | 2,520 (51.1%) | 2,412 (48.9%) |
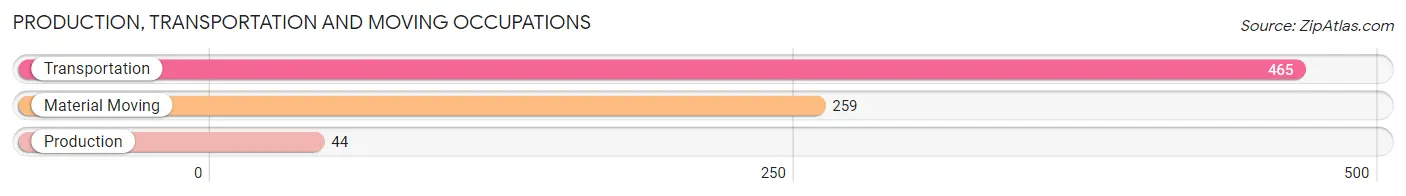
Production, Transportation and Moving Occupations
The most common Production, Transportation and Moving occupations in Woodmere are Transportation (465 | 9.4%), Material Moving (259 | 5.2%), and Production (44 | 0.9%).
Production, Transportation and Moving Occupations by Sex
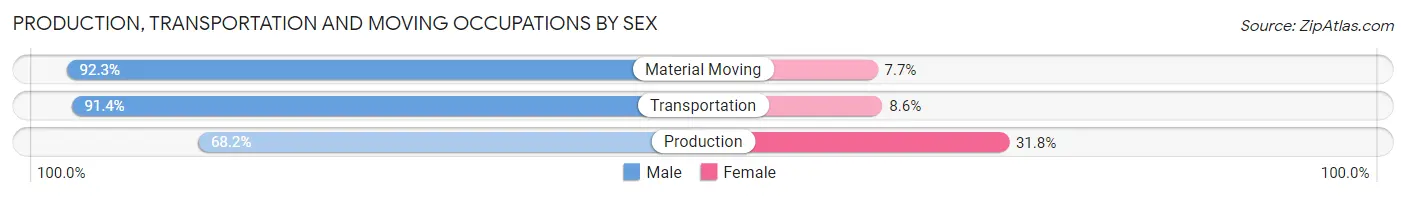
| Occupation | Male | Female |
| Production | 30 (68.2%) | 14 (31.8%) |
| Transportation | 425 (91.4%) | 40 (8.6%) |
| Material Moving | 239 (92.3%) | 20 (7.7%) |
| Total (Category) | 694 (90.4%) | 74 (9.6%) |
| Total (Overall) | 2,520 (51.1%) | 2,412 (48.9%) |
Employment Industries by Sex in Woodmere
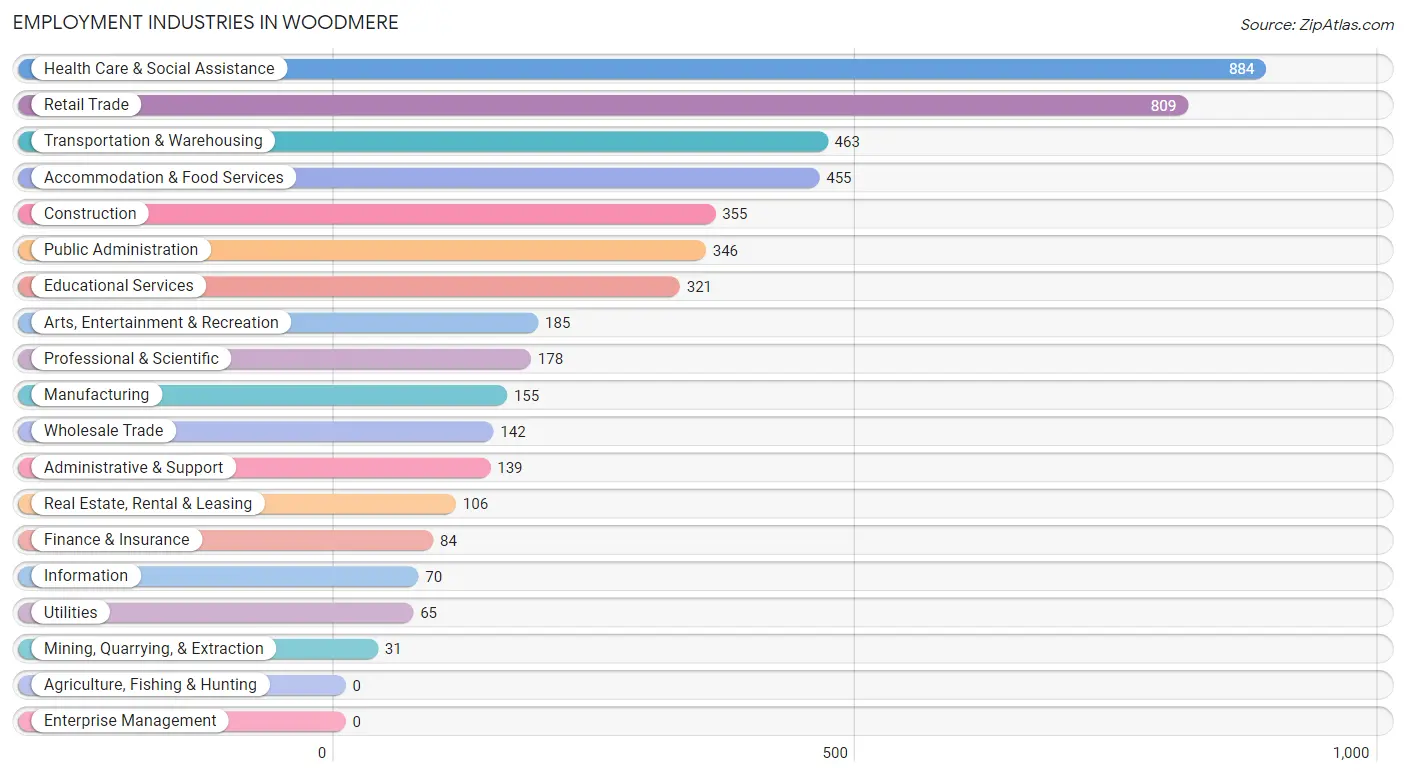
Employment Industries in Woodmere
The major employment industries in Woodmere include Health Care & Social Assistance (884 | 17.9%), Retail Trade (809 | 16.4%), Transportation & Warehousing (463 | 9.4%), Accommodation & Food Services (455 | 9.2%), and Construction (355 | 7.2%).
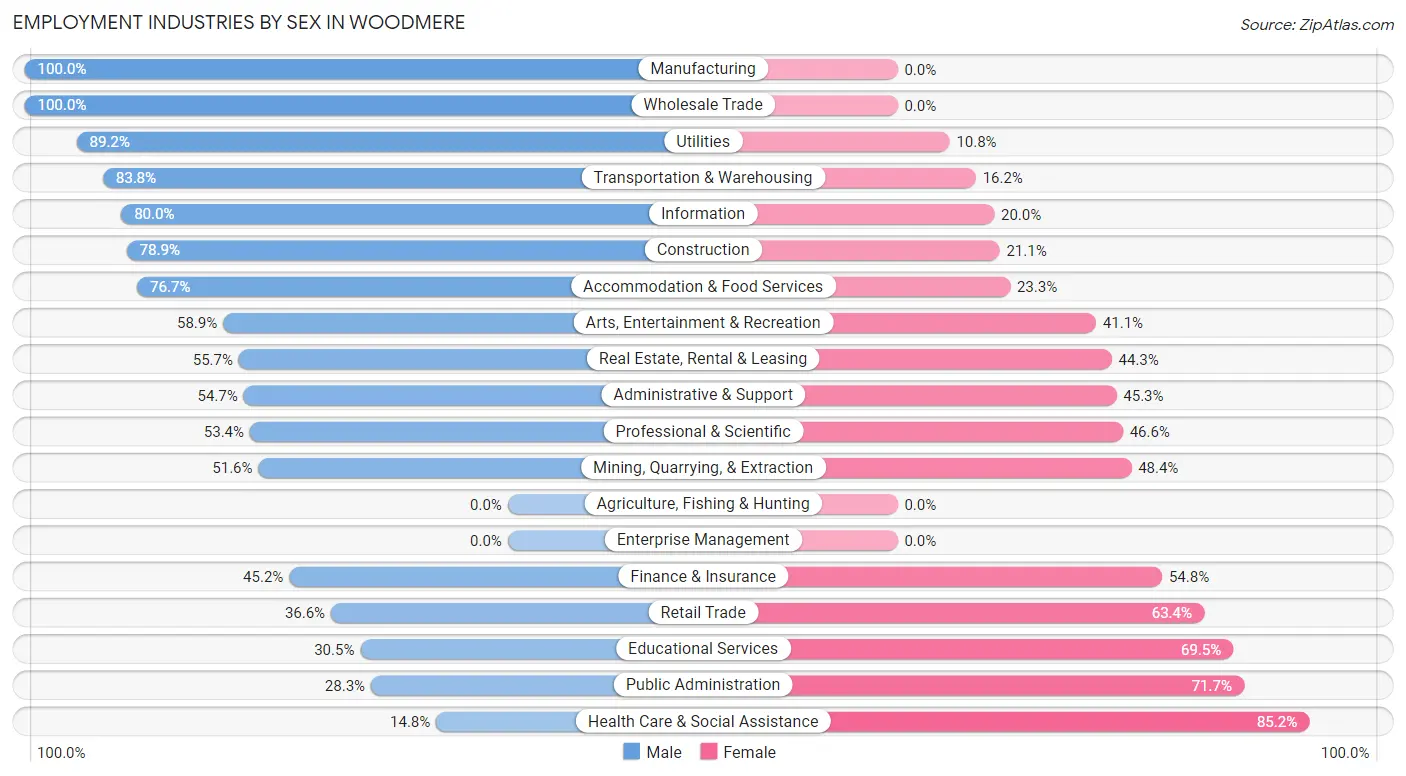
Employment Industries by Sex in Woodmere
The Woodmere industries that see more men than women are Manufacturing (100.0%), Wholesale Trade (100.0%), and Utilities (89.2%), whereas the industries that tend to have a higher number of women are Health Care & Social Assistance (85.2%), Public Administration (71.7%), and Educational Services (69.5%).
| Industry | Male | Female |
| Agriculture, Fishing & Hunting | 0 (0.0%) | 0 (0.0%) |
| Mining, Quarrying, & Extraction | 16 (51.6%) | 15 (48.4%) |
| Construction | 280 (78.9%) | 75 (21.1%) |
| Manufacturing | 155 (100.0%) | 0 (0.0%) |
| Wholesale Trade | 142 (100.0%) | 0 (0.0%) |
| Retail Trade | 296 (36.6%) | 513 (63.4%) |
| Transportation & Warehousing | 388 (83.8%) | 75 (16.2%) |
| Utilities | 58 (89.2%) | 7 (10.8%) |
| Information | 56 (80.0%) | 14 (20.0%) |
| Finance & Insurance | 38 (45.2%) | 46 (54.8%) |
| Real Estate, Rental & Leasing | 59 (55.7%) | 47 (44.3%) |
| Professional & Scientific | 95 (53.4%) | 83 (46.6%) |
| Enterprise Management | 0 (0.0%) | 0 (0.0%) |
| Administrative & Support | 76 (54.7%) | 63 (45.3%) |
| Educational Services | 98 (30.5%) | 223 (69.5%) |
| Health Care & Social Assistance | 131 (14.8%) | 753 (85.2%) |
| Arts, Entertainment & Recreation | 109 (58.9%) | 76 (41.1%) |
| Accommodation & Food Services | 349 (76.7%) | 106 (23.3%) |
| Public Administration | 98 (28.3%) | 248 (71.7%) |
| Total | 2,520 (51.1%) | 2,412 (48.9%) |
Education in Woodmere
School Enrollment in Woodmere
The most common levels of schooling among the 2,740 students in Woodmere are middle school (699 | 25.5%), college / undergraduate (688 | 25.1%), and elementary school (645 | 23.5%).
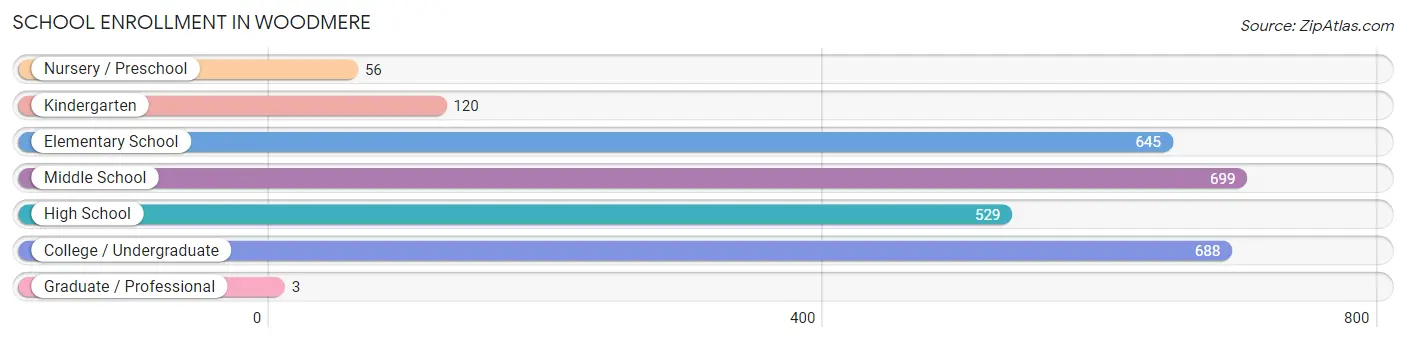
| School Level | # Students | % Students |
| Nursery / Preschool | 56 | 2.0% |
| Kindergarten | 120 | 4.4% |
| Elementary School | 645 | 23.5% |
| Middle School | 699 | 25.5% |
| High School | 529 | 19.3% |
| College / Undergraduate | 688 | 25.1% |
| Graduate / Professional | 3 | 0.1% |
| Total | 2,740 | 100.0% |
School Enrollment by Age by Funding Source in Woodmere
Out of a total of 2,740 students who are enrolled in schools in Woodmere, 367 (13.4%) attend a private institution, while the remaining 2,373 (86.6%) are enrolled in public schools. The age group of 15 to 17 year olds has the highest likelihood of being enrolled in private schools, with 62 (20.1% in the age bracket) enrolled. Conversely, the age group of 3 to 4 year olds has the lowest likelihood of being enrolled in a private school, with 33 (100.0% in the age bracket) attending a public institution.
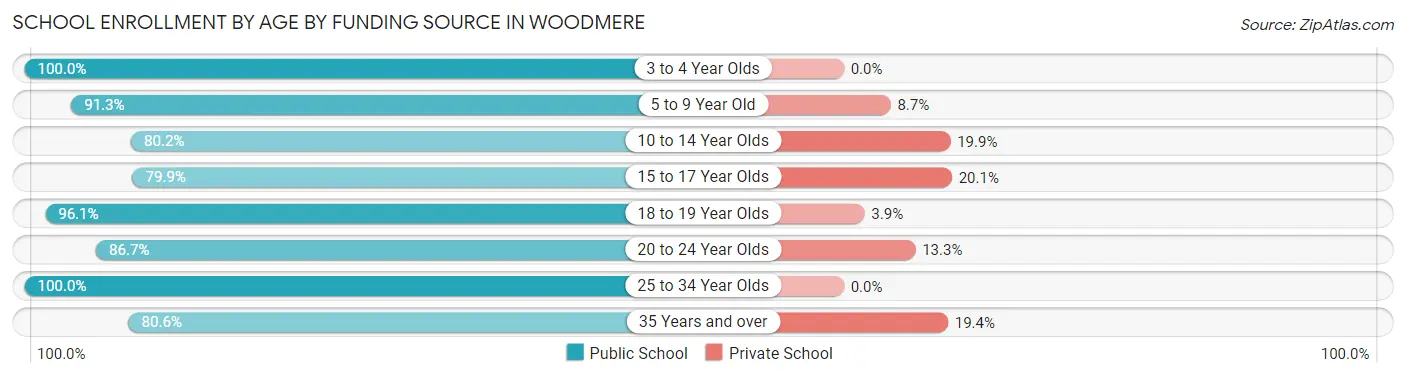
| Age Bracket | Public School | Private School |
| 3 to 4 Year Olds | 33 (100.0%) | 0 (0.0%) |
| 5 to 9 Year Old | 618 (91.3%) | 59 (8.7%) |
| 10 to 14 Year Olds | 727 (80.1%) | 180 (19.9%) |
| 15 to 17 Year Olds | 246 (79.9%) | 62 (20.1%) |
| 18 to 19 Year Olds | 274 (96.1%) | 11 (3.9%) |
| 20 to 24 Year Olds | 104 (86.7%) | 16 (13.3%) |
| 25 to 34 Year Olds | 214 (100.0%) | 0 (0.0%) |
| 35 Years and over | 158 (80.6%) | 38 (19.4%) |
| Total | 2,373 (86.6%) | 367 (13.4%) |
Educational Attainment by Field of Study in Woodmere
Education (213 | 18.4%), business (187 | 16.2%), arts & humanities (185 | 16.0%), science & technology (180 | 15.6%), and bio, nature & agricultural (107 | 9.3%) are the most common fields of study among 1,155 individuals in Woodmere who have obtained a bachelor's degree or higher.
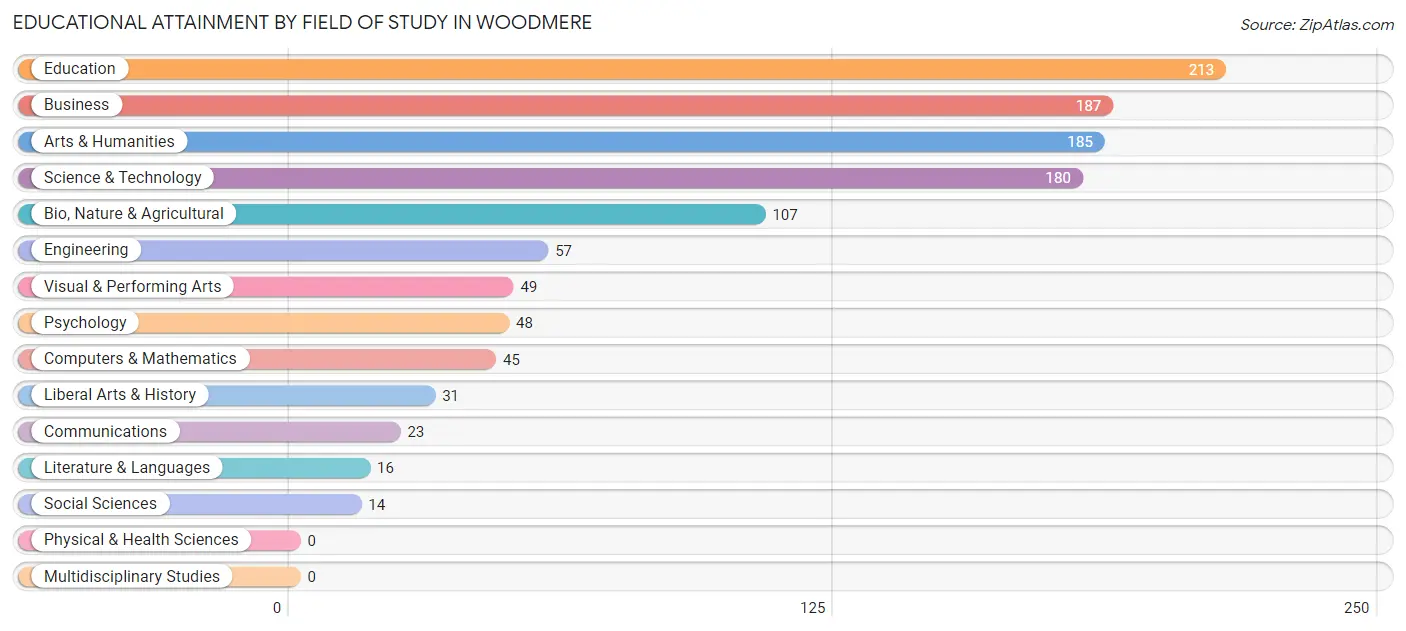
| Field of Study | # Graduates | % Graduates |
| Computers & Mathematics | 45 | 3.9% |
| Bio, Nature & Agricultural | 107 | 9.3% |
| Physical & Health Sciences | 0 | 0.0% |
| Psychology | 48 | 4.2% |
| Social Sciences | 14 | 1.2% |
| Engineering | 57 | 4.9% |
| Multidisciplinary Studies | 0 | 0.0% |
| Science & Technology | 180 | 15.6% |
| Business | 187 | 16.2% |
| Education | 213 | 18.4% |
| Literature & Languages | 16 | 1.4% |
| Liberal Arts & History | 31 | 2.7% |
| Visual & Performing Arts | 49 | 4.2% |
| Communications | 23 | 2.0% |
| Arts & Humanities | 185 | 16.0% |
| Total | 1,155 | 100.0% |
Transportation & Commute in Woodmere
Vehicle Availability by Sex in Woodmere
The most prevalent vehicle ownership categories in Woodmere are males with 2 vehicles (940, accounting for 38.7%) and females with 2 vehicles (774, making up 39.9%).
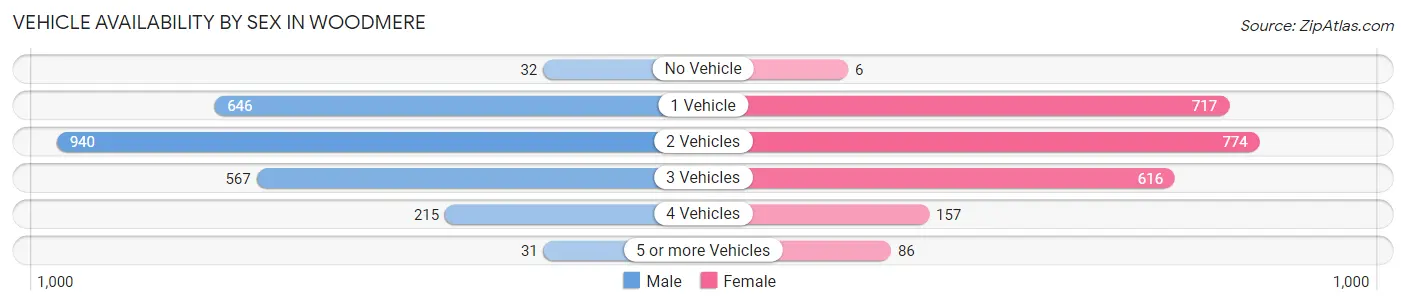
| Vehicles Available | Male | Female |
| No Vehicle | 32 (1.3%) | 6 (0.3%) |
| 1 Vehicle | 646 (26.6%) | 717 (30.4%) |
| 2 Vehicles | 940 (38.7%) | 774 (32.9%) |
| 3 Vehicles | 567 (23.3%) | 616 (26.2%) |
| 4 Vehicles | 215 (8.8%) | 157 (6.7%) |
| 5 or more Vehicles | 31 (1.3%) | 86 (3.6%) |
| Total | 2,431 (100.0%) | 2,356 (100.0%) |
Commute Time in Woodmere
The most frequently occuring commute durations in Woodmere are 30 to 34 minutes (990 commuters, 22.0%), 25 to 29 minutes (598 commuters, 13.3%), and 10 to 14 minutes (567 commuters, 12.6%).
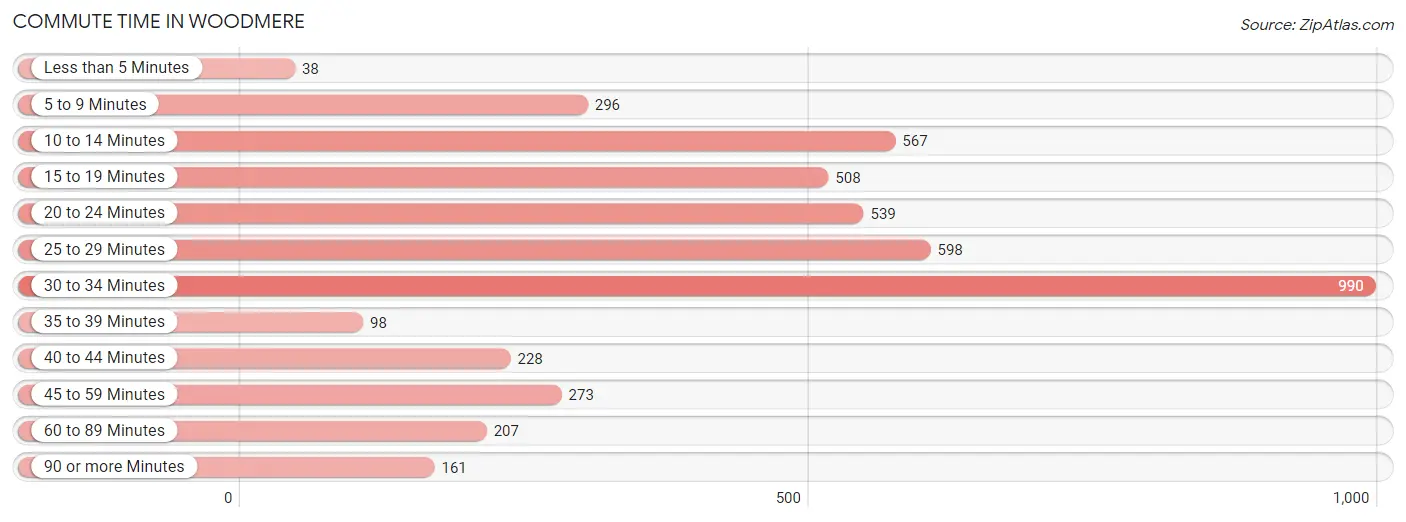
| Commute Time | # Commuters | % Commuters |
| Less than 5 Minutes | 38 | 0.8% |
| 5 to 9 Minutes | 296 | 6.6% |
| 10 to 14 Minutes | 567 | 12.6% |
| 15 to 19 Minutes | 508 | 11.3% |
| 20 to 24 Minutes | 539 | 12.0% |
| 25 to 29 Minutes | 598 | 13.3% |
| 30 to 34 Minutes | 990 | 22.0% |
| 35 to 39 Minutes | 98 | 2.2% |
| 40 to 44 Minutes | 228 | 5.1% |
| 45 to 59 Minutes | 273 | 6.1% |
| 60 to 89 Minutes | 207 | 4.6% |
| 90 or more Minutes | 161 | 3.6% |
Commute Time by Sex in Woodmere
The most common commute times in Woodmere are 30 to 34 minutes (650 commuters, 28.2%) for males and 25 to 29 minutes (356 commuters, 16.2%) for females.
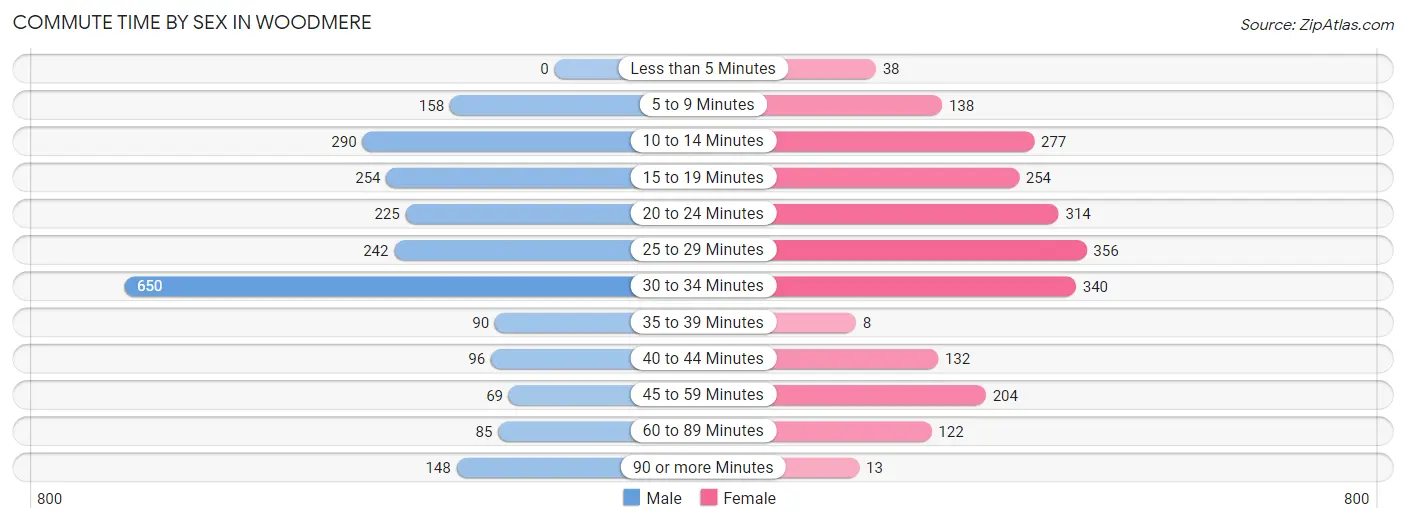
| Commute Time | Male | Female |
| Less than 5 Minutes | 0 (0.0%) | 38 (1.7%) |
| 5 to 9 Minutes | 158 (6.9%) | 138 (6.3%) |
| 10 to 14 Minutes | 290 (12.6%) | 277 (12.6%) |
| 15 to 19 Minutes | 254 (11.0%) | 254 (11.6%) |
| 20 to 24 Minutes | 225 (9.8%) | 314 (14.3%) |
| 25 to 29 Minutes | 242 (10.5%) | 356 (16.2%) |
| 30 to 34 Minutes | 650 (28.2%) | 340 (15.5%) |
| 35 to 39 Minutes | 90 (3.9%) | 8 (0.4%) |
| 40 to 44 Minutes | 96 (4.2%) | 132 (6.0%) |
| 45 to 59 Minutes | 69 (3.0%) | 204 (9.3%) |
| 60 to 89 Minutes | 85 (3.7%) | 122 (5.6%) |
| 90 or more Minutes | 148 (6.4%) | 13 (0.6%) |
Time of Departure to Work by Sex in Woodmere
The most frequent times of departure to work in Woodmere are 12:00 AM to 4:59 AM (344, 14.9%) for males and 6:30 AM to 6:59 AM (351, 16.0%) for females.
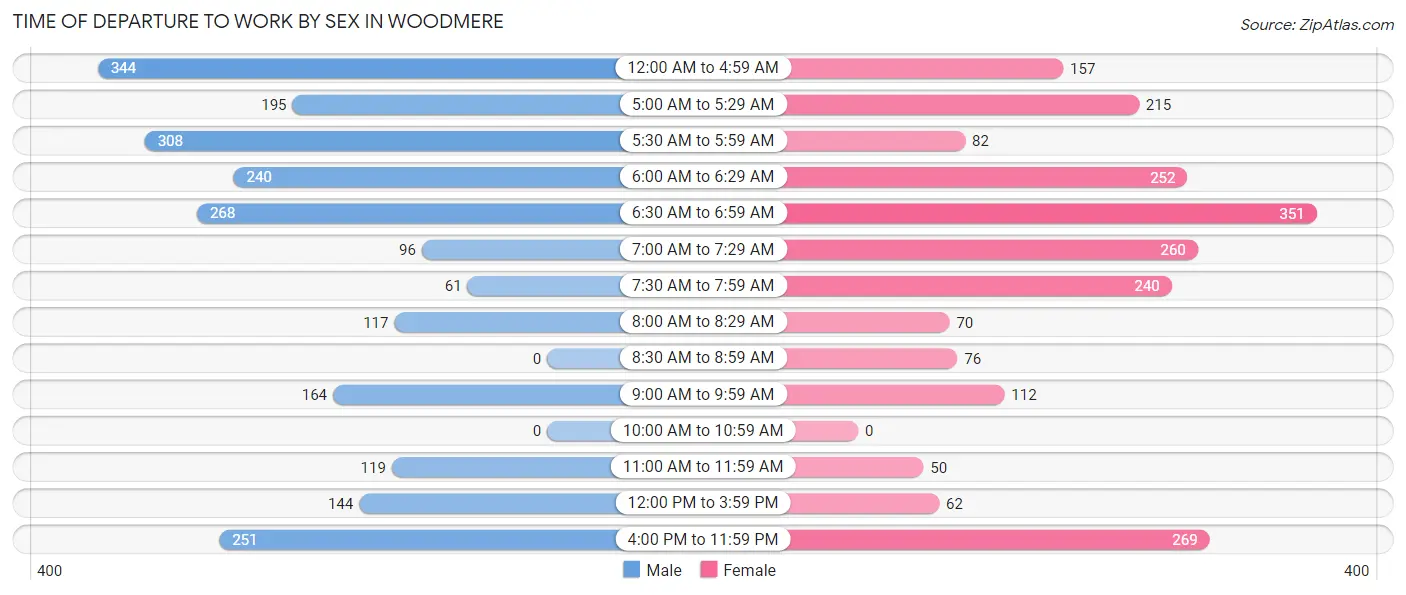
| Time of Departure | Male | Female |
| 12:00 AM to 4:59 AM | 344 (14.9%) | 157 (7.1%) |
| 5:00 AM to 5:29 AM | 195 (8.5%) | 215 (9.8%) |
| 5:30 AM to 5:59 AM | 308 (13.4%) | 82 (3.7%) |
| 6:00 AM to 6:29 AM | 240 (10.4%) | 252 (11.5%) |
| 6:30 AM to 6:59 AM | 268 (11.6%) | 351 (16.0%) |
| 7:00 AM to 7:29 AM | 96 (4.2%) | 260 (11.8%) |
| 7:30 AM to 7:59 AM | 61 (2.6%) | 240 (10.9%) |
| 8:00 AM to 8:29 AM | 117 (5.1%) | 70 (3.2%) |
| 8:30 AM to 8:59 AM | 0 (0.0%) | 76 (3.5%) |
| 9:00 AM to 9:59 AM | 164 (7.1%) | 112 (5.1%) |
| 10:00 AM to 10:59 AM | 0 (0.0%) | 0 (0.0%) |
| 11:00 AM to 11:59 AM | 119 (5.2%) | 50 (2.3%) |
| 12:00 PM to 3:59 PM | 144 (6.2%) | 62 (2.8%) |
| 4:00 PM to 11:59 PM | 251 (10.9%) | 269 (12.2%) |
| Total | 2,307 (100.0%) | 2,196 (100.0%) |
Housing Occupancy in Woodmere
Occupancy by Ownership in Woodmere
Of the total 3,926 dwellings in Woodmere, owner-occupied units account for 3,275 (83.4%), while renter-occupied units make up 651 (16.6%).
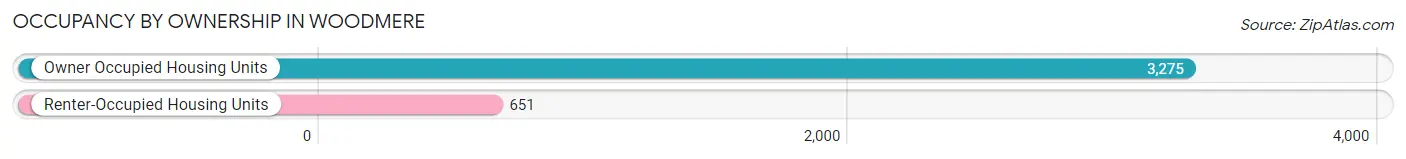
| Occupancy | # Housing Units | % Housing Units |
| Owner Occupied Housing Units | 3,275 | 83.4% |
| Renter-Occupied Housing Units | 651 | 16.6% |
| Total Occupied Housing Units | 3,926 | 100.0% |
Occupancy by Household Size in Woodmere
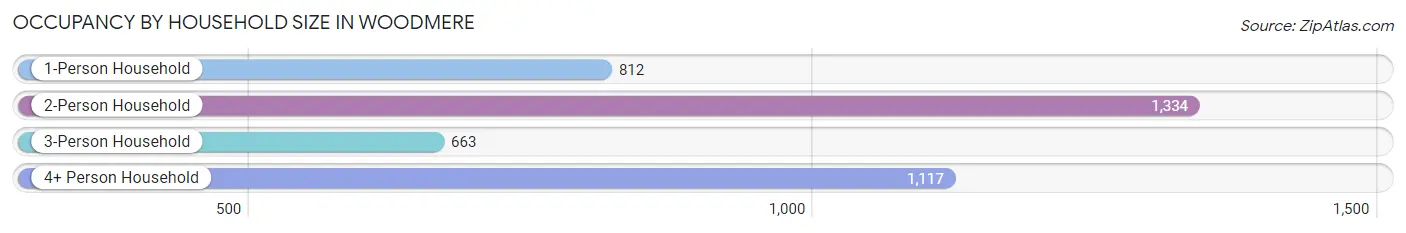
| Household Size | # Housing Units | % Housing Units |
| 1-Person Household | 812 | 20.7% |
| 2-Person Household | 1,334 | 34.0% |
| 3-Person Household | 663 | 16.9% |
| 4+ Person Household | 1,117 | 28.4% |
| Total Housing Units | 3,926 | 100.0% |
Occupancy by Ownership by Household Size in Woodmere
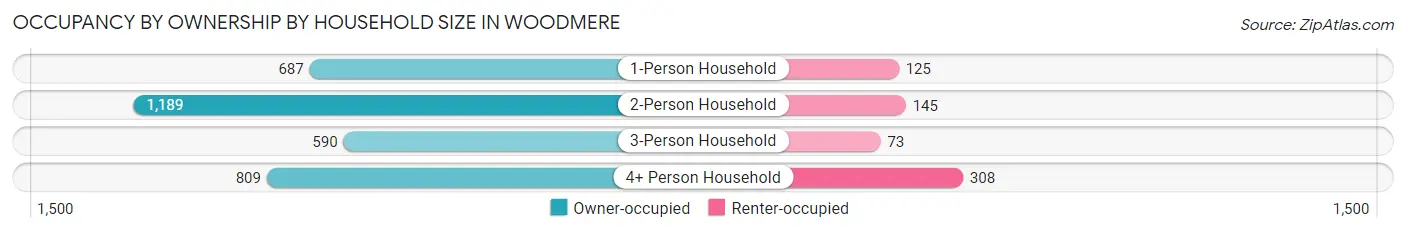
| Household Size | Owner-occupied | Renter-occupied |
| 1-Person Household | 687 (84.6%) | 125 (15.4%) |
| 2-Person Household | 1,189 (89.1%) | 145 (10.9%) |
| 3-Person Household | 590 (89.0%) | 73 (11.0%) |
| 4+ Person Household | 809 (72.4%) | 308 (27.6%) |
| Total Housing Units | 3,275 (83.4%) | 651 (16.6%) |
Occupancy by Educational Attainment in Woodmere
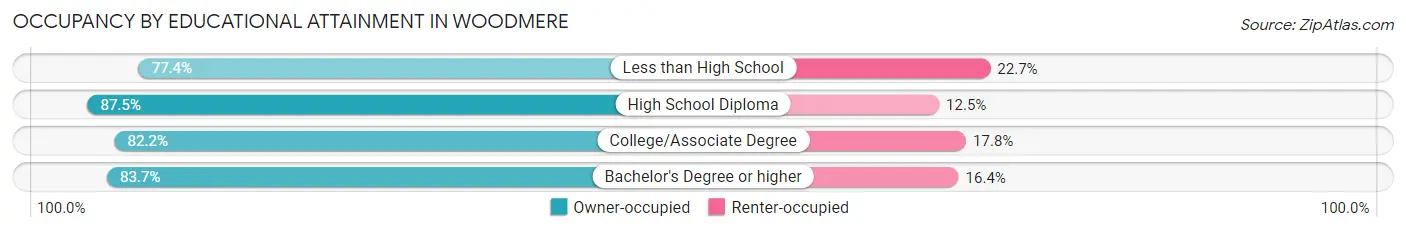
| Household Size | Owner-occupied | Renter-occupied |
| Less than High School | 379 (77.3%) | 111 (22.7%) |
| High School Diploma | 1,051 (87.5%) | 150 (12.5%) |
| College/Associate Degree | 1,354 (82.2%) | 294 (17.8%) |
| Bachelor's Degree or higher | 491 (83.7%) | 96 (16.4%) |
Occupancy by Age of Householder in Woodmere
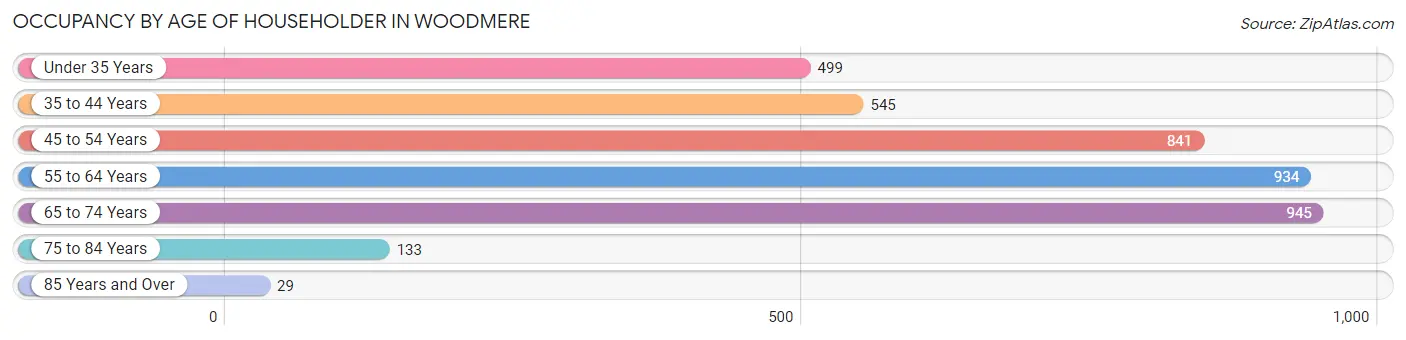
| Age Bracket | # Households | % Households |
| Under 35 Years | 499 | 12.7% |
| 35 to 44 Years | 545 | 13.9% |
| 45 to 54 Years | 841 | 21.4% |
| 55 to 64 Years | 934 | 23.8% |
| 65 to 74 Years | 945 | 24.1% |
| 75 to 84 Years | 133 | 3.4% |
| 85 Years and Over | 29 | 0.7% |
| Total | 3,926 | 100.0% |
Housing Finances in Woodmere
Median Income by Occupancy in Woodmere
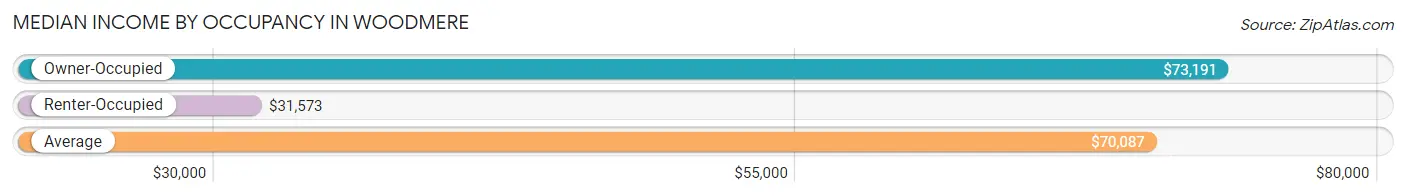
| Occupancy Type | # Households | Median Income |
| Owner-Occupied | 3,275 (83.4%) | $73,191 |
| Renter-Occupied | 651 (16.6%) | $31,573 |
| Average | 3,926 (100.0%) | $70,087 |
Occupancy by Householder Income Bracket in Woodmere
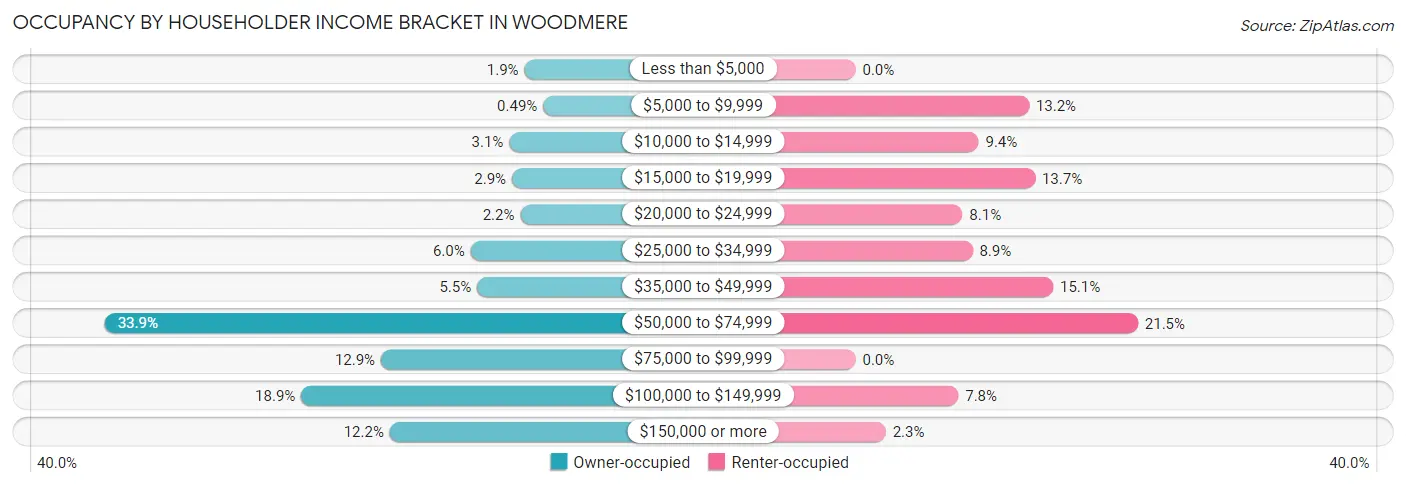
| Income Bracket | Owner-occupied | Renter-occupied |
| Less than $5,000 | 63 (1.9%) | 0 (0.0%) |
| $5,000 to $9,999 | 16 (0.5%) | 86 (13.2%) |
| $10,000 to $14,999 | 101 (3.1%) | 61 (9.4%) |
| $15,000 to $19,999 | 94 (2.9%) | 89 (13.7%) |
| $20,000 to $24,999 | 73 (2.2%) | 53 (8.1%) |
| $25,000 to $34,999 | 197 (6.0%) | 58 (8.9%) |
| $35,000 to $49,999 | 181 (5.5%) | 98 (15.0%) |
| $50,000 to $74,999 | 1,110 (33.9%) | 140 (21.5%) |
| $75,000 to $99,999 | 421 (12.9%) | 0 (0.0%) |
| $100,000 to $149,999 | 620 (18.9%) | 51 (7.8%) |
| $150,000 or more | 399 (12.2%) | 15 (2.3%) |
| Total | 3,275 (100.0%) | 651 (100.0%) |
Monthly Housing Cost Tiers in Woodmere
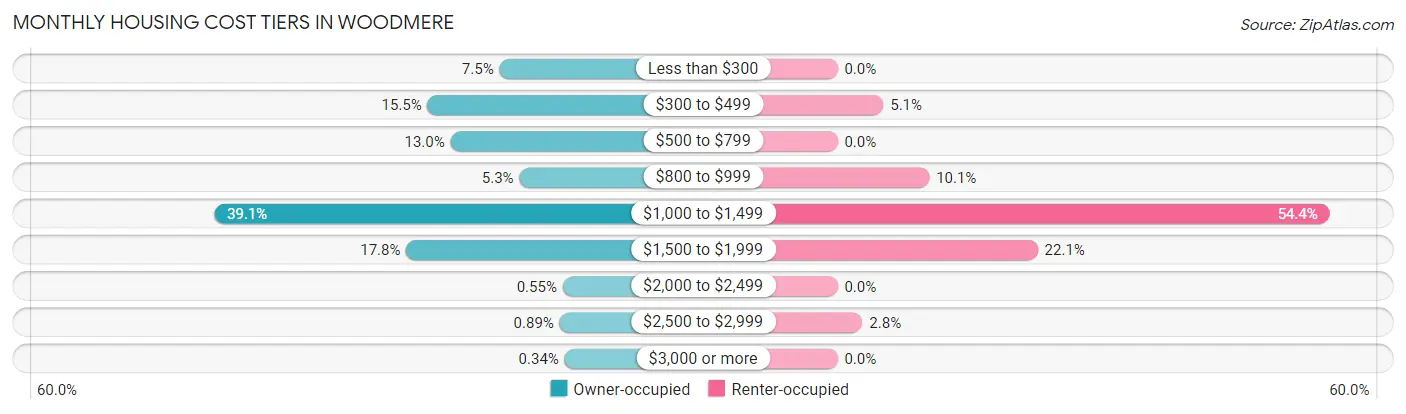
| Monthly Cost | Owner-occupied | Renter-occupied |
| Less than $300 | 247 (7.5%) | 0 (0.0%) |
| $300 to $499 | 507 (15.5%) | 33 (5.1%) |
| $500 to $799 | 424 (13.0%) | 0 (0.0%) |
| $800 to $999 | 175 (5.3%) | 66 (10.1%) |
| $1,000 to $1,499 | 1,280 (39.1%) | 354 (54.4%) |
| $1,500 to $1,999 | 584 (17.8%) | 144 (22.1%) |
| $2,000 to $2,499 | 18 (0.5%) | 0 (0.0%) |
| $2,500 to $2,999 | 29 (0.9%) | 18 (2.8%) |
| $3,000 or more | 11 (0.3%) | 0 (0.0%) |
| Total | 3,275 (100.0%) | 651 (100.0%) |
Physical Housing Characteristics in Woodmere
Housing Structures in Woodmere
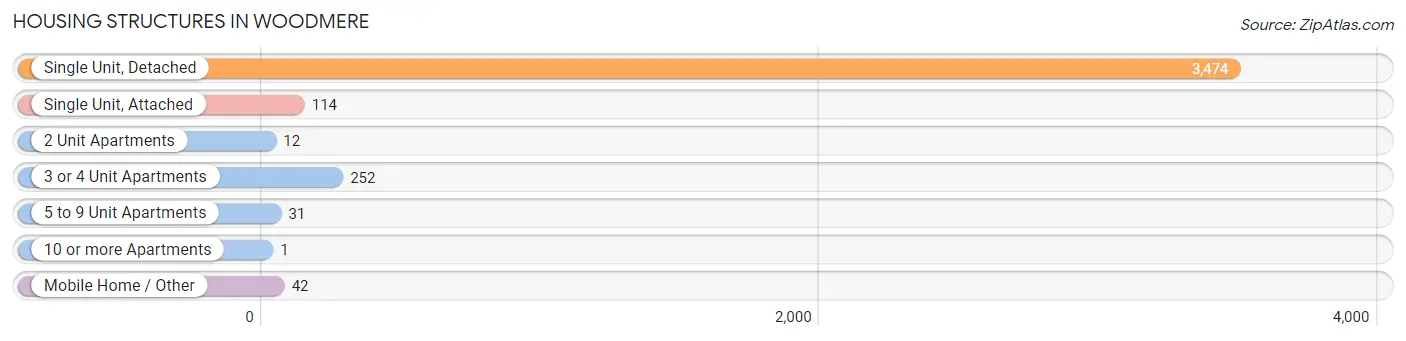
| Structure Type | # Housing Units | % Housing Units |
| Single Unit, Detached | 3,474 | 88.5% |
| Single Unit, Attached | 114 | 2.9% |
| 2 Unit Apartments | 12 | 0.3% |
| 3 or 4 Unit Apartments | 252 | 6.4% |
| 5 to 9 Unit Apartments | 31 | 0.8% |
| 10 or more Apartments | 1 | 0.0% |
| Mobile Home / Other | 42 | 1.1% |
| Total | 3,926 | 100.0% |
Housing Structures by Occupancy in Woodmere
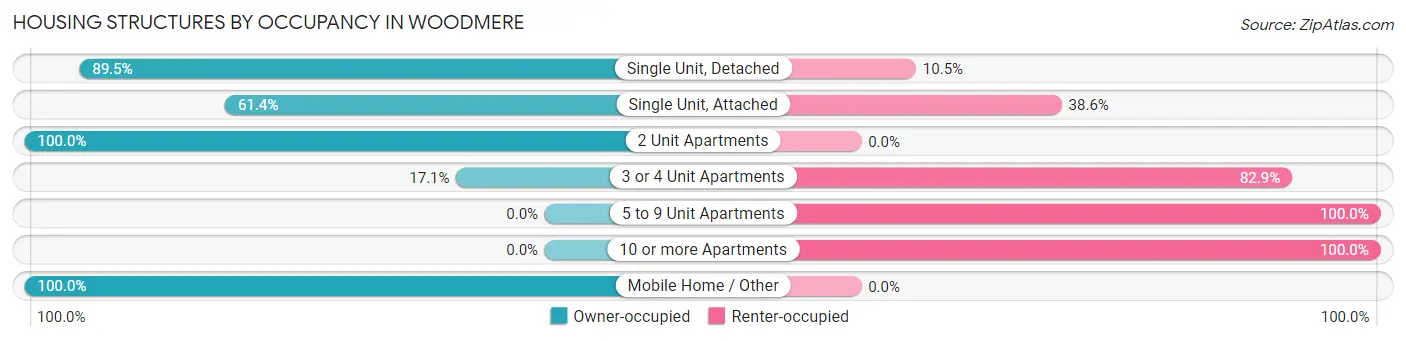
| Structure Type | Owner-occupied | Renter-occupied |
| Single Unit, Detached | 3,108 (89.5%) | 366 (10.5%) |
| Single Unit, Attached | 70 (61.4%) | 44 (38.6%) |
| 2 Unit Apartments | 12 (100.0%) | 0 (0.0%) |
| 3 or 4 Unit Apartments | 43 (17.1%) | 209 (82.9%) |
| 5 to 9 Unit Apartments | 0 (0.0%) | 31 (100.0%) |
| 10 or more Apartments | 0 (0.0%) | 1 (100.0%) |
| Mobile Home / Other | 42 (100.0%) | 0 (0.0%) |
| Total | 3,275 (83.4%) | 651 (16.6%) |
Housing Structures by Number of Rooms in Woodmere
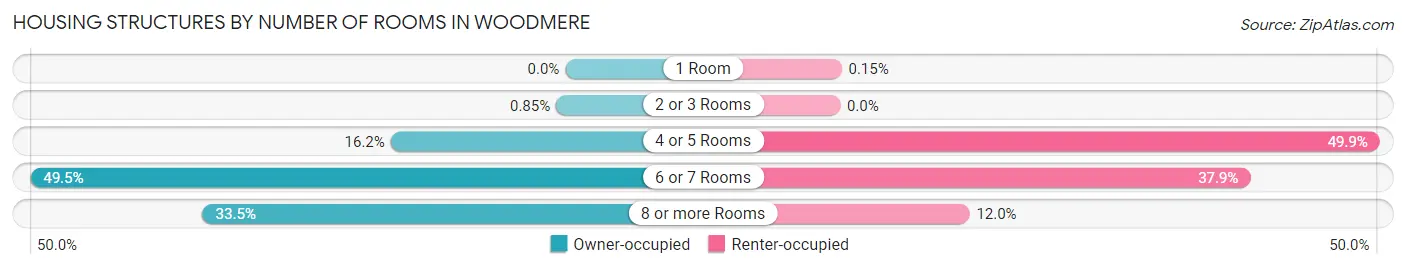
| Number of Rooms | Owner-occupied | Renter-occupied |
| 1 Room | 0 (0.0%) | 1 (0.2%) |
| 2 or 3 Rooms | 28 (0.9%) | 0 (0.0%) |
| 4 or 5 Rooms | 529 (16.2%) | 325 (49.9%) |
| 6 or 7 Rooms | 1,620 (49.5%) | 247 (37.9%) |
| 8 or more Rooms | 1,098 (33.5%) | 78 (12.0%) |
| Total | 3,275 (100.0%) | 651 (100.0%) |
Housing Structure by Heating Type in Woodmere
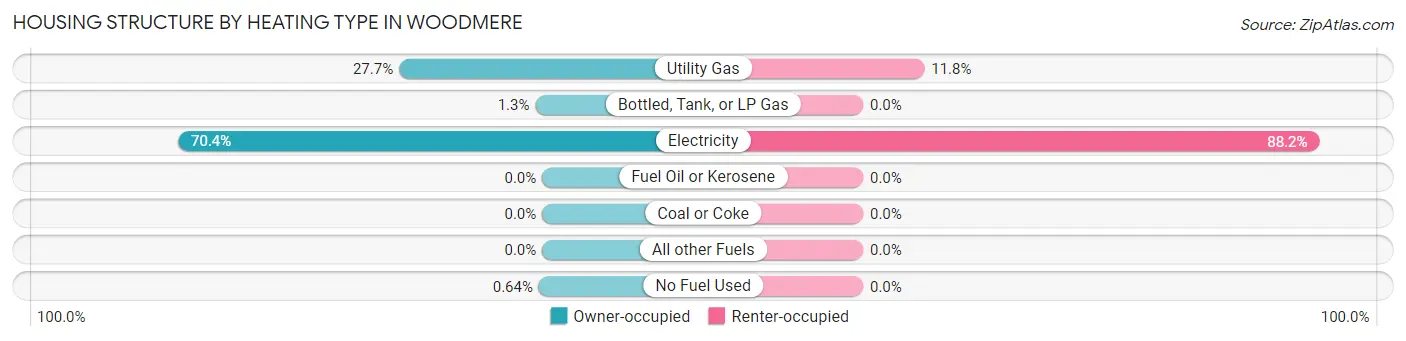
| Heating Type | Owner-occupied | Renter-occupied |
| Utility Gas | 906 (27.7%) | 77 (11.8%) |
| Bottled, Tank, or LP Gas | 43 (1.3%) | 0 (0.0%) |
| Electricity | 2,305 (70.4%) | 574 (88.2%) |
| Fuel Oil or Kerosene | 0 (0.0%) | 0 (0.0%) |
| Coal or Coke | 0 (0.0%) | 0 (0.0%) |
| All other Fuels | 0 (0.0%) | 0 (0.0%) |
| No Fuel Used | 21 (0.6%) | 0 (0.0%) |
| Total | 3,275 (100.0%) | 651 (100.0%) |
Household Vehicle Usage in Woodmere
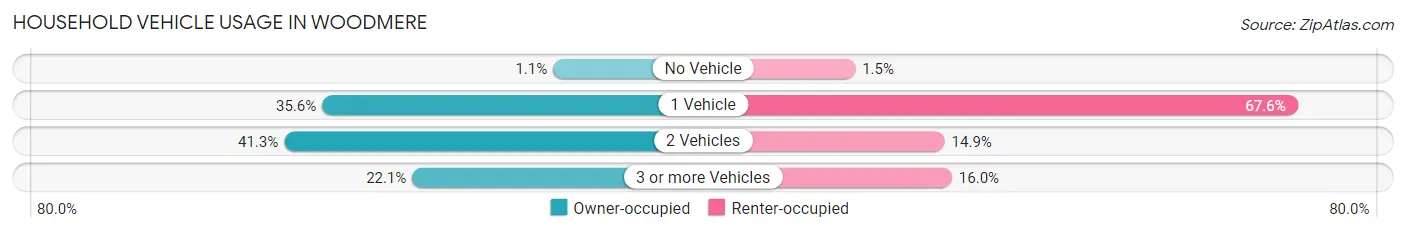
| Vehicles per Household | Owner-occupied | Renter-occupied |
| No Vehicle | 35 (1.1%) | 10 (1.5%) |
| 1 Vehicle | 1,165 (35.6%) | 440 (67.6%) |
| 2 Vehicles | 1,351 (41.2%) | 97 (14.9%) |
| 3 or more Vehicles | 724 (22.1%) | 104 (16.0%) |
| Total | 3,275 (100.0%) | 651 (100.0%) |
Real Estate & Mortgages in Woodmere
Real Estate and Mortgage Overview in Woodmere
| Characteristic | Without Mortgage | With Mortgage |
| Housing Units | 1,047 | 2,228 |
| Median Property Value | $167,500 | $173,600 |
| Median Household Income | $72,701 | $266 |
| Monthly Housing Costs | $442 | $11 |
| Real Estate Taxes | $421 | $286 |
Property Value by Mortgage Status in Woodmere
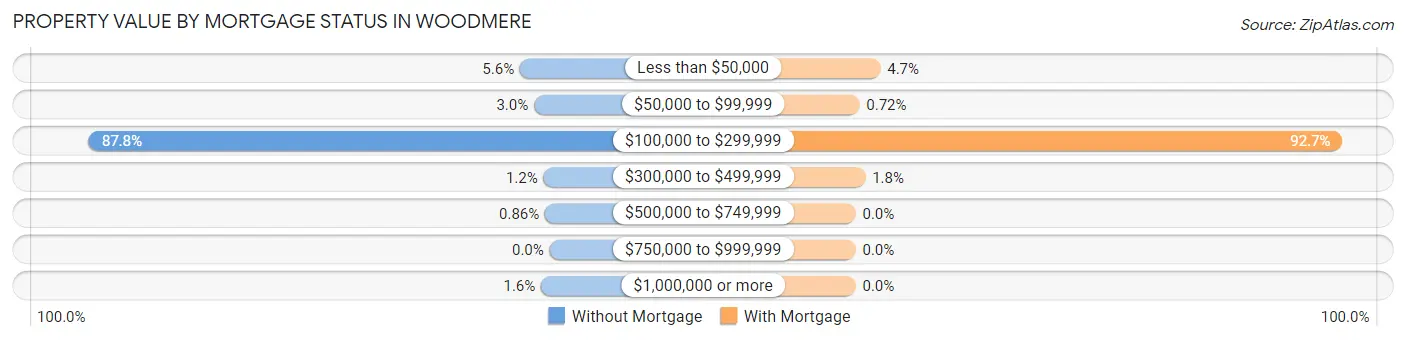
| Property Value | Without Mortgage | With Mortgage |
| Less than $50,000 | 59 (5.6%) | 105 (4.7%) |
| $50,000 to $99,999 | 31 (3.0%) | 16 (0.7%) |
| $100,000 to $299,999 | 919 (87.8%) | 2,066 (92.7%) |
| $300,000 to $499,999 | 12 (1.1%) | 41 (1.8%) |
| $500,000 to $749,999 | 9 (0.9%) | 0 (0.0%) |
| $750,000 to $999,999 | 0 (0.0%) | 0 (0.0%) |
| $1,000,000 or more | 17 (1.6%) | 0 (0.0%) |
| Total | 1,047 (100.0%) | 2,228 (100.0%) |
Household Income by Mortgage Status in Woodmere
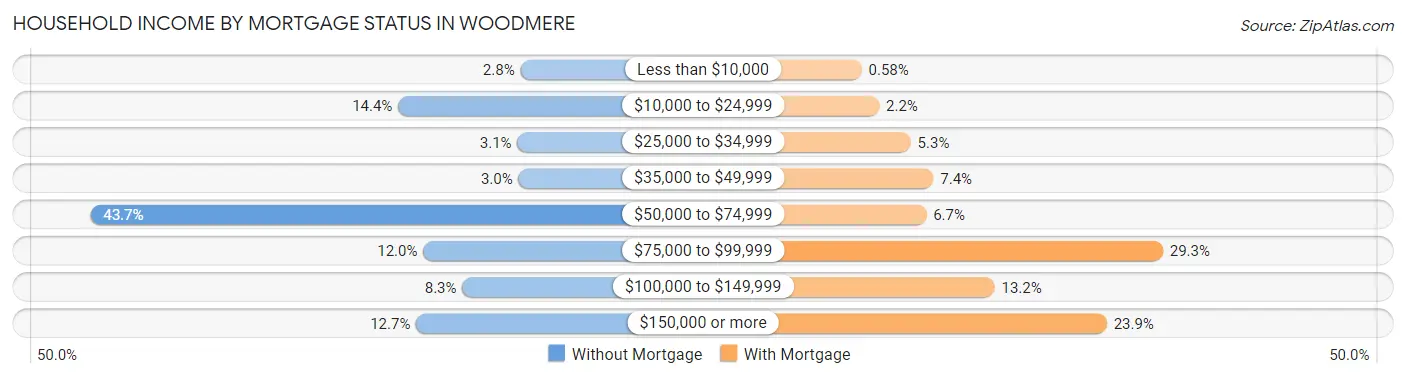
| Household Income | Without Mortgage | With Mortgage |
| Less than $10,000 | 29 (2.8%) | 13 (0.6%) |
| $10,000 to $24,999 | 151 (14.4%) | 50 (2.2%) |
| $25,000 to $34,999 | 32 (3.1%) | 117 (5.2%) |
| $35,000 to $49,999 | 31 (3.0%) | 165 (7.4%) |
| $50,000 to $74,999 | 458 (43.7%) | 150 (6.7%) |
| $75,000 to $99,999 | 126 (12.0%) | 652 (29.3%) |
| $100,000 to $149,999 | 87 (8.3%) | 295 (13.2%) |
| $150,000 or more | 133 (12.7%) | 533 (23.9%) |
| Total | 1,047 (100.0%) | 2,228 (100.0%) |
Property Value to Household Income Ratio in Woodmere
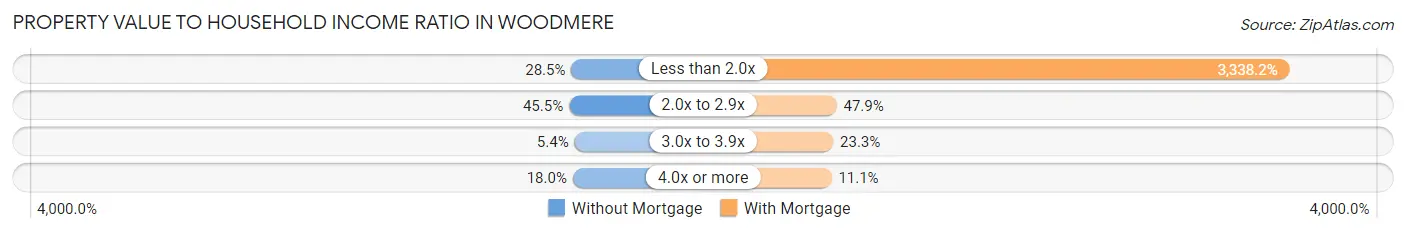
| Value-to-Income Ratio | Without Mortgage | With Mortgage |
| Less than 2.0x | 298 (28.5%) | 74,375 (3,338.2%) |
| 2.0x to 2.9x | 476 (45.5%) | 1,068 (47.9%) |
| 3.0x to 3.9x | 56 (5.3%) | 518 (23.3%) |
| 4.0x or more | 188 (18.0%) | 248 (11.1%) |
| Total | 1,047 (100.0%) | 2,228 (100.0%) |
Real Estate Taxes by Mortgage Status in Woodmere
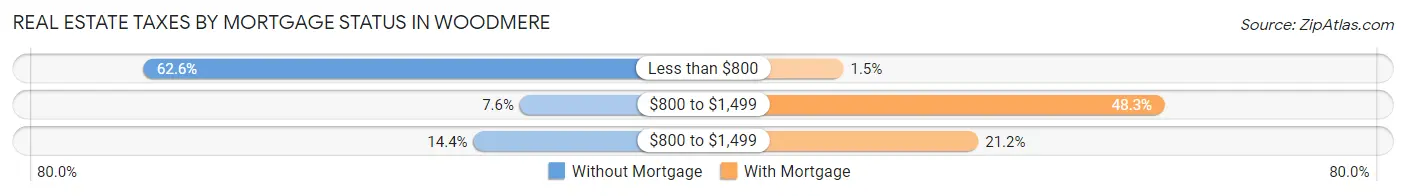
| Property Taxes | Without Mortgage | With Mortgage |
| Less than $800 | 655 (62.6%) | 34 (1.5%) |
| $800 to $1,499 | 80 (7.6%) | 1,077 (48.3%) |
| $800 to $1,499 | 151 (14.4%) | 473 (21.2%) |
| Total | 1,047 (100.0%) | 2,228 (100.0%) |
Health & Disability in Woodmere
Health Insurance Coverage by Age in Woodmere
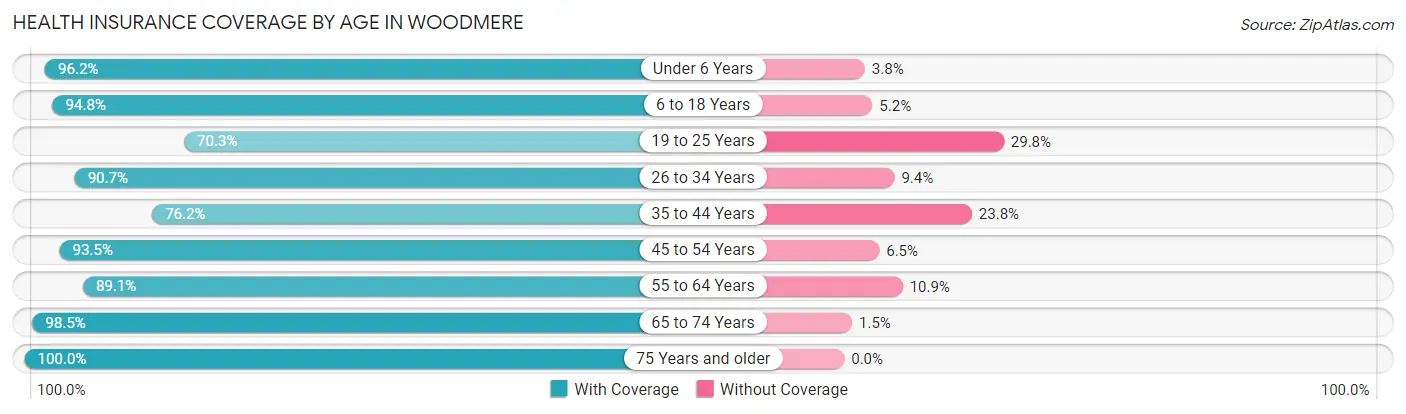
| Age Bracket | With Coverage | Without Coverage |
| Under 6 Years | 902 (96.2%) | 36 (3.8%) |
| 6 to 18 Years | 1,973 (94.8%) | 109 (5.2%) |
| 19 to 25 Years | 543 (70.3%) | 230 (29.7%) |
| 26 to 34 Years | 1,561 (90.6%) | 161 (9.3%) |
| 35 to 44 Years | 1,156 (76.2%) | 361 (23.8%) |
| 45 to 54 Years | 1,261 (93.5%) | 88 (6.5%) |
| 55 to 64 Years | 1,325 (89.1%) | 162 (10.9%) |
| 65 to 74 Years | 1,415 (98.5%) | 21 (1.5%) |
| 75 Years and older | 357 (100.0%) | 0 (0.0%) |
| Total | 10,493 (90.0%) | 1,168 (10.0%) |
Health Insurance Coverage by Citizenship Status in Woodmere
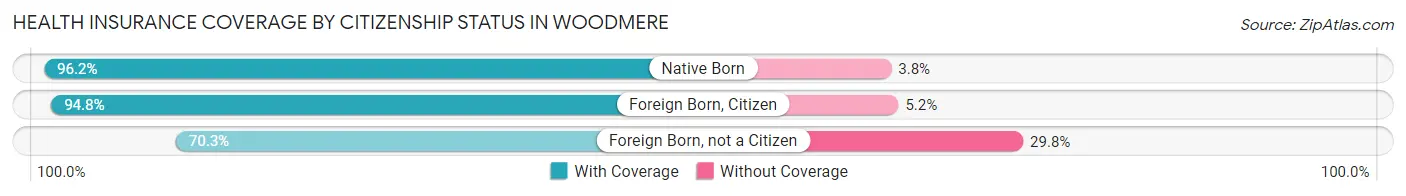
| Citizenship Status | With Coverage | Without Coverage |
| Native Born | 902 (96.2%) | 36 (3.8%) |
| Foreign Born, Citizen | 1,973 (94.8%) | 109 (5.2%) |
| Foreign Born, not a Citizen | 543 (70.3%) | 230 (29.7%) |
Health Insurance Coverage by Household Income in Woodmere
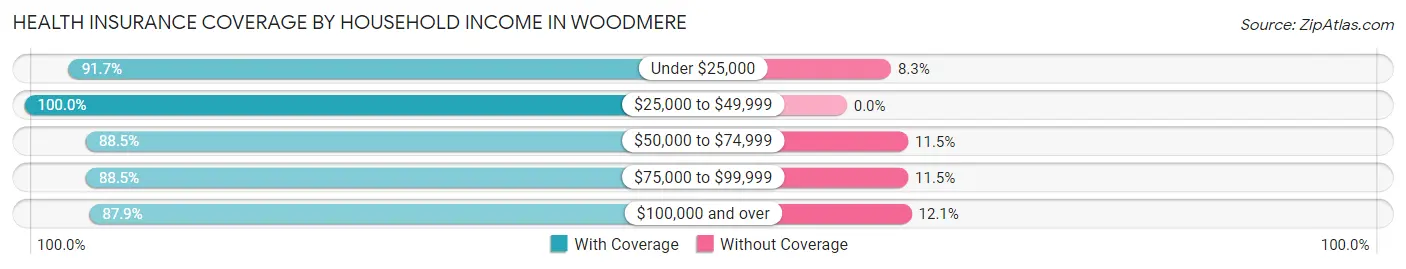
| Household Income | With Coverage | Without Coverage |
| Under $25,000 | 1,330 (91.7%) | 120 (8.3%) |
| $25,000 to $49,999 | 1,346 (100.0%) | 0 (0.0%) |
| $50,000 to $74,999 | 2,773 (88.5%) | 360 (11.5%) |
| $75,000 to $99,999 | 1,078 (88.5%) | 140 (11.5%) |
| $100,000 and over | 3,966 (87.9%) | 548 (12.1%) |
Public vs Private Health Insurance Coverage by Age in Woodmere
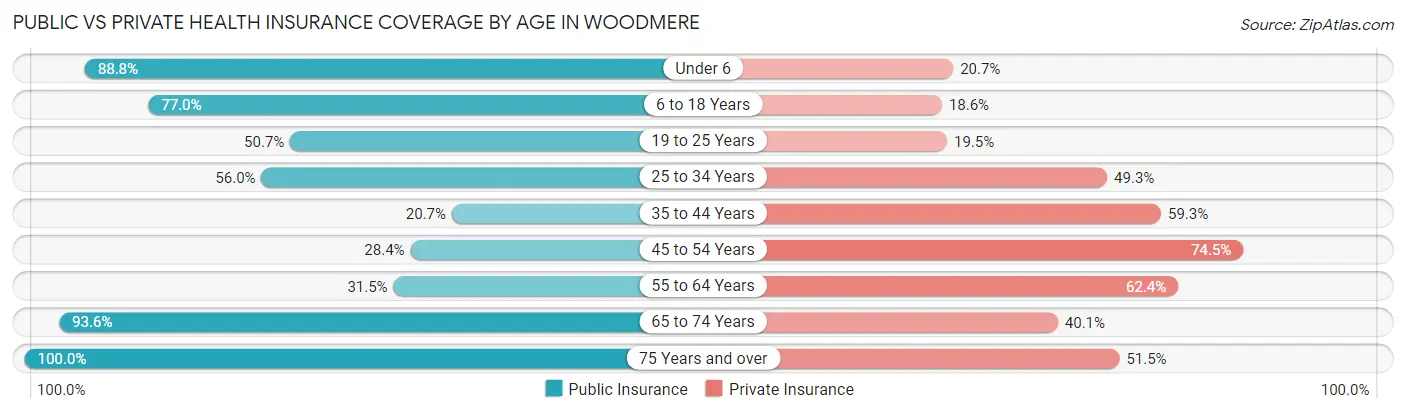
| Age Bracket | Public Insurance | Private Insurance |
| Under 6 | 833 (88.8%) | 194 (20.7%) |
| 6 to 18 Years | 1,604 (77.0%) | 387 (18.6%) |
| 19 to 25 Years | 392 (50.7%) | 151 (19.5%) |
| 25 to 34 Years | 965 (56.0%) | 848 (49.2%) |
| 35 to 44 Years | 314 (20.7%) | 899 (59.3%) |
| 45 to 54 Years | 383 (28.4%) | 1,005 (74.5%) |
| 55 to 64 Years | 469 (31.5%) | 928 (62.4%) |
| 65 to 74 Years | 1,344 (93.6%) | 576 (40.1%) |
| 75 Years and over | 357 (100.0%) | 184 (51.5%) |
| Total | 6,661 (57.1%) | 5,172 (44.4%) |
Disability Status by Sex by Age in Woodmere
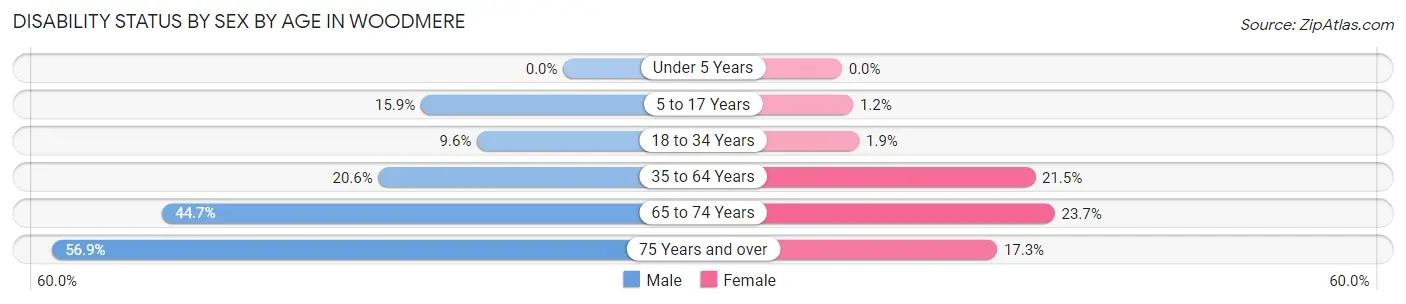
| Age Bracket | Male | Female |
| Under 5 Years | 0 (0.0%) | 0 (0.0%) |
| 5 to 17 Years | 187 (15.9%) | 11 (1.2%) |
| 18 to 34 Years | 121 (9.6%) | 27 (1.9%) |
| 35 to 64 Years | 437 (20.6%) | 480 (21.5%) |
| 65 to 74 Years | 351 (44.7%) | 154 (23.7%) |
| 75 Years and over | 111 (56.9%) | 28 (17.3%) |
Disability Class by Sex by Age in Woodmere
Disability Class: Hearing Difficulty
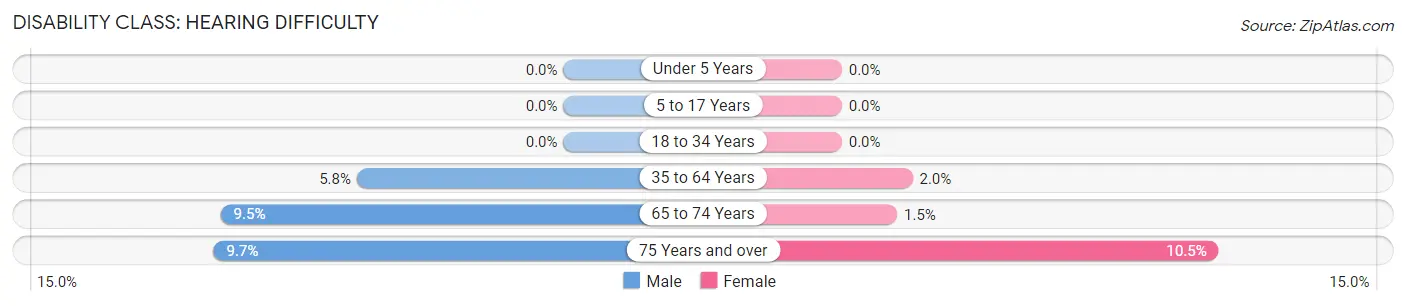
| Age Bracket | Male | Female |
| Under 5 Years | 0 (0.0%) | 0 (0.0%) |
| 5 to 17 Years | 0 (0.0%) | 0 (0.0%) |
| 18 to 34 Years | 0 (0.0%) | 0 (0.0%) |
| 35 to 64 Years | 122 (5.8%) | 44 (2.0%) |
| 65 to 74 Years | 75 (9.5%) | 10 (1.5%) |
| 75 Years and over | 19 (9.7%) | 17 (10.5%) |
Disability Class: Vision Difficulty
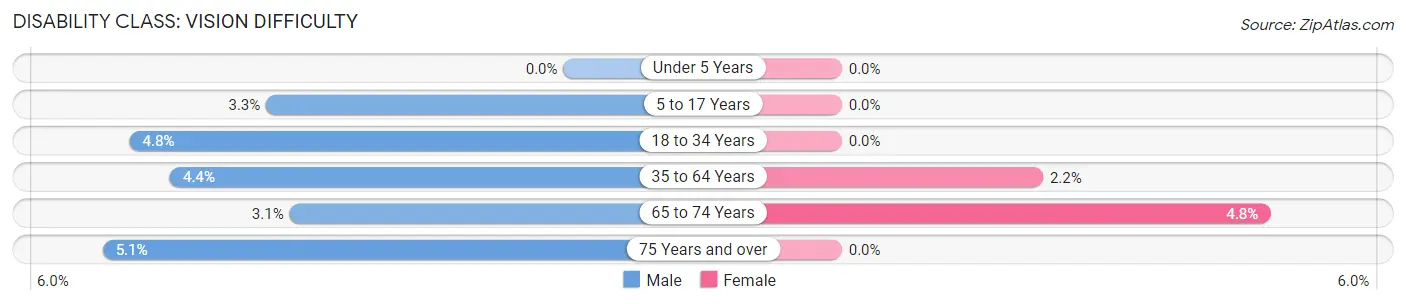
| Age Bracket | Male | Female |
| Under 5 Years | 0 (0.0%) | 0 (0.0%) |
| 5 to 17 Years | 39 (3.3%) | 0 (0.0%) |
| 18 to 34 Years | 61 (4.8%) | 0 (0.0%) |
| 35 to 64 Years | 93 (4.4%) | 50 (2.2%) |
| 65 to 74 Years | 24 (3.0%) | 31 (4.8%) |
| 75 Years and over | 10 (5.1%) | 0 (0.0%) |
Disability Class: Cognitive Difficulty
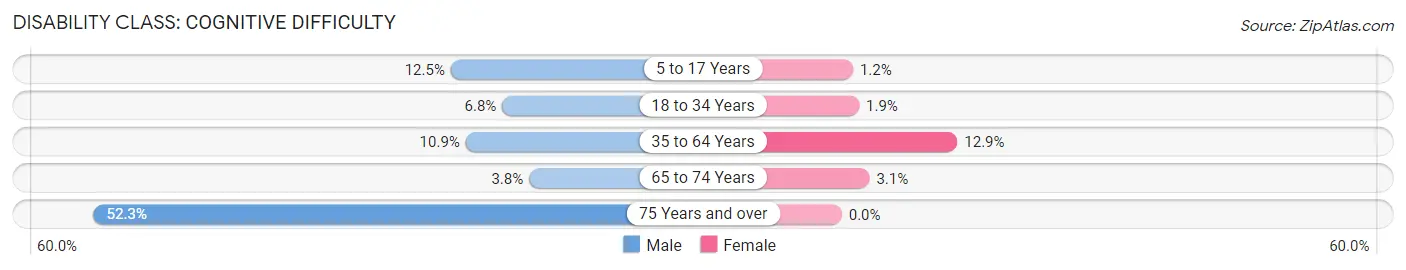
| Age Bracket | Male | Female |
| 5 to 17 Years | 148 (12.5%) | 11 (1.2%) |
| 18 to 34 Years | 86 (6.8%) | 27 (1.9%) |
| 35 to 64 Years | 231 (10.9%) | 287 (12.9%) |
| 65 to 74 Years | 30 (3.8%) | 20 (3.1%) |
| 75 Years and over | 102 (52.3%) | 0 (0.0%) |
Disability Class: Ambulatory Difficulty
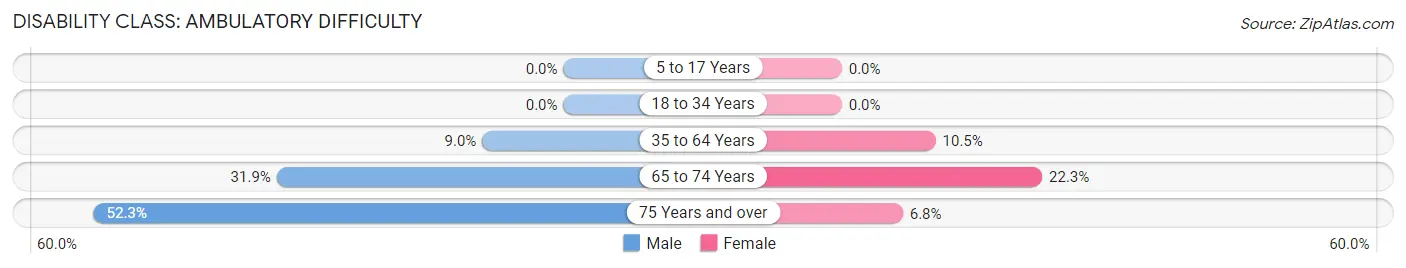
| Age Bracket | Male | Female |
| 5 to 17 Years | 0 (0.0%) | 0 (0.0%) |
| 18 to 34 Years | 0 (0.0%) | 0 (0.0%) |
| 35 to 64 Years | 192 (9.0%) | 233 (10.4%) |
| 65 to 74 Years | 251 (31.9%) | 145 (22.3%) |
| 75 Years and over | 102 (52.3%) | 11 (6.8%) |
Disability Class: Self-Care Difficulty
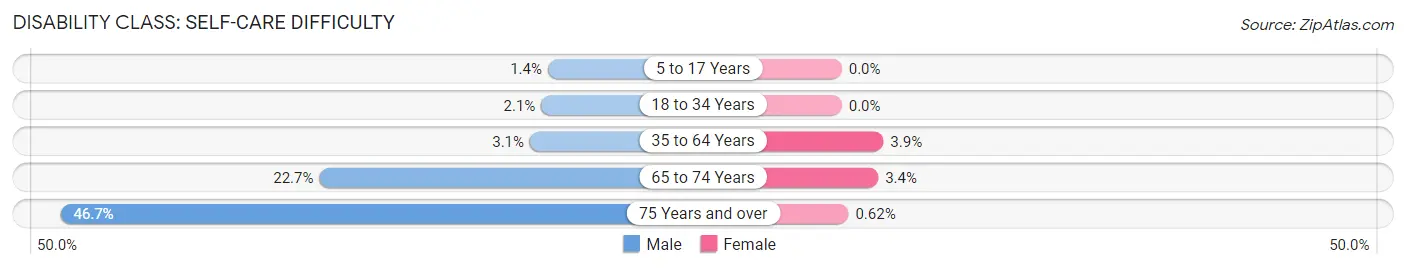
| Age Bracket | Male | Female |
| 5 to 17 Years | 17 (1.4%) | 0 (0.0%) |
| 18 to 34 Years | 26 (2.1%) | 0 (0.0%) |
| 35 to 64 Years | 66 (3.1%) | 86 (3.9%) |
| 65 to 74 Years | 178 (22.7%) | 22 (3.4%) |
| 75 Years and over | 91 (46.7%) | 1 (0.6%) |
Technology Access in Woodmere
Computing Device Access in Woodmere
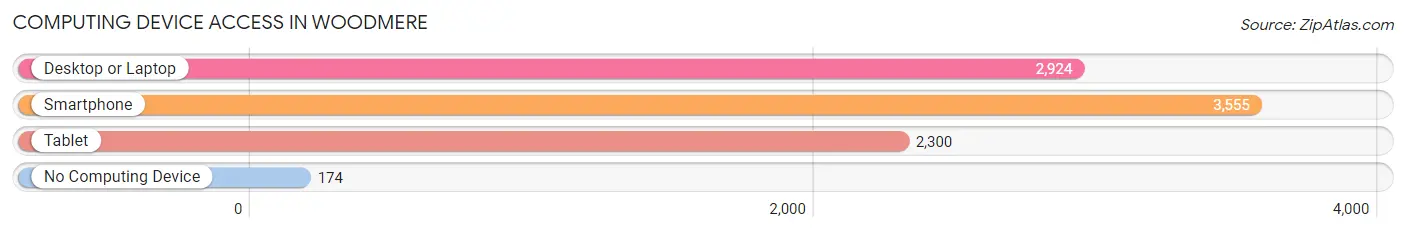
| Device Type | # Households | % Households |
| Desktop or Laptop | 2,924 | 74.5% |
| Smartphone | 3,555 | 90.5% |
| Tablet | 2,300 | 58.6% |
| No Computing Device | 174 | 4.4% |
| Total | 3,926 | 100.0% |
Internet Access in Woodmere
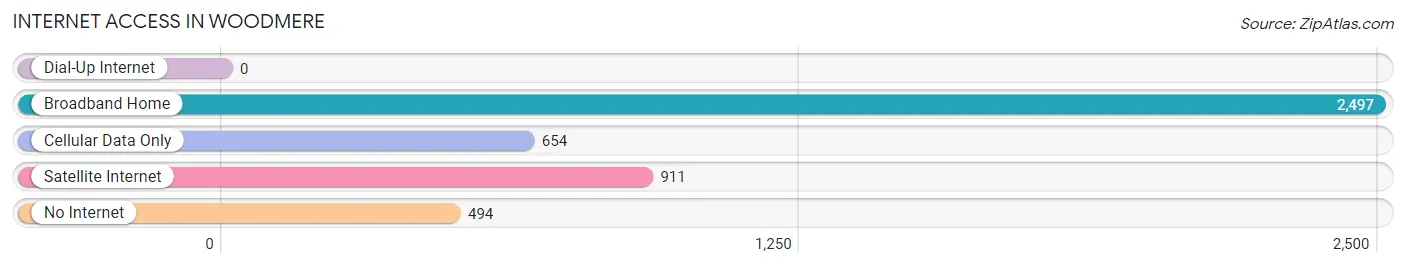
| Internet Type | # Households | % Households |
| Dial-Up Internet | 0 | 0.0% |
| Broadband Home | 2,497 | 63.6% |
| Cellular Data Only | 654 | 16.7% |
| Satellite Internet | 911 | 23.2% |
| No Internet | 494 | 12.6% |
| Total | 3,926 | 100.0% |
Woodmere Summary
Woodmere is a small town located in Jefferson Parish, Louisiana. It is situated on the west bank of the Mississippi River, just south of New Orleans. The town has a population of approximately 4,000 people and is part of the Greater New Orleans metropolitan area.
History
Woodmere was founded in 1845 by a group of German immigrants who had settled in the area. The town was originally called “Deutschesdorf”, which translates to “German Village”. The town was renamed Woodmere in 1876, after the nearby woods.
In the late 19th century, Woodmere was a thriving agricultural community. The town was known for its sugar cane, cotton, and rice production. In the early 20th century, the town began to experience a decline in its agricultural industry. This decline was due to the introduction of new farming techniques and the development of the nearby city of New Orleans.
In the 1950s, Woodmere began to experience a resurgence in its economy. This was due to the development of the nearby oil and gas industry. The town also experienced a population boom during this time, as many people moved to the area to take advantage of the new job opportunities.
Geography
Woodmere is located in Jefferson Parish, Louisiana. It is situated on the west bank of the Mississippi River, just south of New Orleans. The town is bordered by the cities of Gretna, Harvey, and Marrero.
The town has a total area of 2.2 square miles, all of which is land. The town is located at an elevation of 8 feet above sea level.
Economy
Woodmere’s economy is largely based on the oil and gas industry. The town is home to several oil and gas companies, including Chevron, Shell, and ExxonMobil. The town also has a number of small businesses, including restaurants, retail stores, and auto repair shops.
The town is also home to a number of manufacturing companies, including a paper mill and a chemical plant.
Demographics
As of the 2010 census, Woodmere had a population of 4,000 people. The racial makeup of the town was 79.2% White, 15.2% African American, 0.7% Native American, 0.7% Asian, 0.1% Pacific Islander, and 4.1% from other races. Hispanic or Latino of any race were 3.2% of the population.
The median household income in Woodmere was $41,250, and the median family income was $50,000. The per capita income for the town was $20,845. About 11.2% of families and 14.2% of the population were below the poverty line, including 18.2% of those under age 18 and 8.2% of those age 65 or over.
Woodmere is served by the Jefferson Parish Public School System. The town is home to two elementary schools, one middle school, and one high school. The town also has a library and a community center.
Common Questions
What is Per Capita Income in Woodmere?
Per Capita income in Woodmere is $36,758.
What is the Median Family Income in Woodmere?
Median Family Income in Woodmere is $72,472.
What is the Median Household income in Woodmere?
Median Household Income in Woodmere is $70,087.
What is Income or Wage Gap in Woodmere?
Income or Wage Gap in Woodmere is 8.0%.
Women in Woodmere earn 92.0 cents for every dollar earned by a man.
What is Inequality or Gini Index in Woodmere?
Inequality or Gini Index in Woodmere is 0.50.
What is the Total Population of Woodmere?
Total Population of Woodmere is 11,661.
What is the Total Male Population of Woodmere?
Total Male Population of Woodmere is 5,990.
What is the Total Female Population of Woodmere?
Total Female Population of Woodmere is 5,671.
What is the Ratio of Males per 100 Females in Woodmere?
There are 105.63 Males per 100 Females in Woodmere.
What is the Ratio of Females per 100 Males in Woodmere?
There are 94.67 Females per 100 Males in Woodmere.
What is the Median Population Age in Woodmere?
Median Population Age in Woodmere is 36.8 Years.
What is the Average Family Size in Woodmere
Average Family Size in Woodmere is 3.4 People.
What is the Average Household Size in Woodmere
Average Household Size in Woodmere is 3.0 People.
How Large is the Labor Force in Woodmere?
There are 5,429 People in the Labor Forcein in Woodmere.
What is the Percentage of People in the Labor Force in Woodmere?
60.2% of People are in the Labor Force in Woodmere.
What is the Unemployment Rate in Woodmere?
Unemployment Rate in Woodmere is 9.2%.