Zip Codes with the Highest Percentage of Population with a Degree in Computers and Mathematics in Kansas
RELATED REPORTS & OPTIONS
Computers and Mathematics
Kansas
Compare Zip Codes
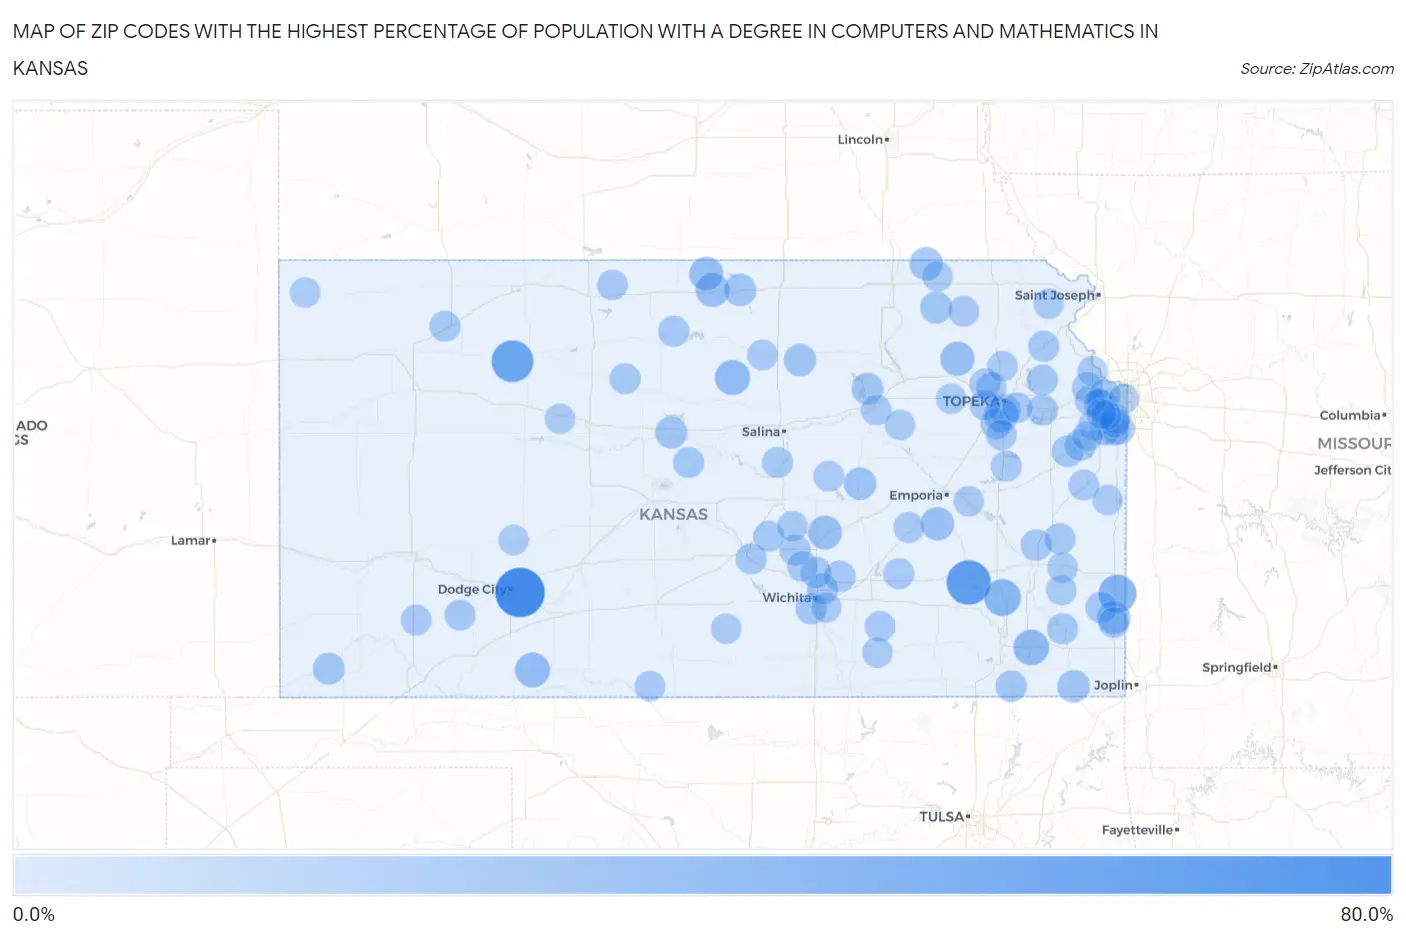
Map of Zip Codes with the Highest Percentage of Population with a Degree in Computers and Mathematics in Kansas
0.0%
80.0%
Zip Codes with the Highest Percentage of Population with a Degree in Computers and Mathematics in Kansas
| Zip Code | % Graduates | vs State | vs National | |
| 1. | 67843 | 70.6% | 4.0%(+66.6)#1 | 4.9%(+65.7)#35 |
| 2. | 66777 | 52.3% | 4.0%(+48.3)#2 | 4.9%(+47.4)#71 |
| 3. | 67659 | 43.8% | 4.0%(+39.8)#3 | 4.9%(+38.9)#114 |
| 4. | 66741 | 30.2% | 4.0%(+26.3)#4 | 4.9%(+25.3)#218 |
| 5. | 66717 | 26.2% | 4.0%(+22.2)#5 | 4.9%(+21.3)#282 |
| 6. | 67341 | 22.6% | 4.0%(+18.6)#6 | 4.9%(+17.7)#375 |
| 7. | 67418 | 21.0% | 4.0%(+17.0)#7 | 4.9%(+16.1)#430 |
| 8. | 67831 | 20.0% | 4.0%(+16.0)#8 | 4.9%(+15.1)#461 |
| 9. | 66619 | 17.4% | 4.0%(+13.4)#9 | 4.9%(+12.5)#595 |
| 10. | 66422 | 17.1% | 4.0%(+13.2)#10 | 4.9%(+12.2)#622 |
| 11. | 66956 | 16.4% | 4.0%(+12.5)#11 | 4.9%(+11.5)#662 |
| 12. | 67151 | 16.3% | 4.0%(+12.3)#12 | 4.9%(+11.4)#677 |
| 13. | 66936 | 16.3% | 4.0%(+12.3)#13 | 4.9%(+11.4)#678 |
| 14. | 66865 | 14.9% | 4.0%(+11.0)#14 | 4.9%(+10.0)#793 |
| 15. | 66541 | 14.3% | 4.0%(+10.3)#15 | 4.9%(+9.39)#878 |
| 16. | 66712 | 14.2% | 4.0%(+10.2)#16 | 4.9%(+9.30)#891 |
| 17. | 66858 | 12.5% | 4.0%(+8.54)#17 | 4.9%(+7.61)#1,136 |
| 18. | 67336 | 11.9% | 4.0%(+7.92)#18 | 4.9%(+6.98)#1,240 |
| 19. | 66942 | 11.8% | 4.0%(+7.80)#19 | 4.9%(+6.87)#1,269 |
| 20. | 67466 | 11.4% | 4.0%(+7.40)#20 | 4.9%(+6.47)#1,358 |
| 21. | 67634 | 10.9% | 4.0%(+6.91)#21 | 4.9%(+5.98)#1,488 |
| 22. | 66544 | 10.3% | 4.0%(+6.38)#22 | 4.9%(+5.45)#1,633 |
| 23. | 66218 | 10.2% | 4.0%(+6.27)#23 | 4.9%(+5.34)#1,679 |
| 24. | 67954 | 10.1% | 4.0%(+6.10)#24 | 4.9%(+5.17)#1,726 |
| 25. | 66514 | 10.0% | 4.0%(+6.04)#25 | 4.9%(+5.11)#1,749 |
| 26. | 66223 | 9.8% | 4.0%(+5.88)#26 | 4.9%(+4.94)#1,815 |
| 27. | 66609 | 9.4% | 4.0%(+5.39)#27 | 4.9%(+4.46)#2,035 |
| 28. | 66092 | 9.0% | 4.0%(+5.01)#28 | 4.9%(+4.07)#2,278 |
| 29. | 67217 | 8.6% | 4.0%(+4.65)#29 | 4.9%(+3.71)#2,469 |
| 30. | 67337 | 8.6% | 4.0%(+4.64)#30 | 4.9%(+3.70)#2,479 |
| 31. | 66111 | 8.5% | 4.0%(+4.59)#31 | 4.9%(+3.65)#2,511 |
| 32. | 66734 | 8.4% | 4.0%(+4.45)#32 | 4.9%(+3.52)#2,590 |
| 33. | 66015 | 8.2% | 4.0%(+4.20)#33 | 4.9%(+3.27)#2,775 |
| 34. | 66021 | 8.1% | 4.0%(+4.16)#34 | 4.9%(+3.23)#2,801 |
| 35. | 67017 | 8.1% | 4.0%(+4.10)#35 | 4.9%(+3.17)#2,850 |
| 36. | 67220 | 8.0% | 4.0%(+4.03)#36 | 4.9%(+3.10)#2,909 |
| 37. | 67147 | 7.9% | 4.0%(+3.96)#37 | 4.9%(+3.03)#2,958 |
| 38. | 66039 | 7.7% | 4.0%(+3.73)#38 | 4.9%(+2.80)#3,160 |
| 39. | 66546 | 7.4% | 4.0%(+3.46)#39 | 4.9%(+2.53)#3,412 |
| 40. | 67437 | 7.4% | 4.0%(+3.42)#40 | 4.9%(+2.48)#3,457 |
| 41. | 66007 | 7.3% | 4.0%(+3.37)#41 | 4.9%(+2.44)#3,487 |
| 42. | 66771 | 7.3% | 4.0%(+3.37)#42 | 4.9%(+2.44)#3,490 |
| 43. | 67501 | 7.2% | 4.0%(+3.29)#43 | 4.9%(+2.35)#3,572 |
| 44. | 66049 | 7.2% | 4.0%(+3.28)#44 | 4.9%(+2.34)#3,583 |
| 45. | 66060 | 7.2% | 4.0%(+3.24)#45 | 4.9%(+2.31)#3,627 |
| 46. | 67867 | 7.2% | 4.0%(+3.23)#46 | 4.9%(+2.30)#3,635 |
| 47. | 66066 | 7.2% | 4.0%(+3.22)#47 | 4.9%(+2.28)#3,654 |
| 48. | 67056 | 7.1% | 4.0%(+3.10)#48 | 4.9%(+2.17)#3,759 |
| 49. | 67456 | 7.0% | 4.0%(+3.02)#49 | 4.9%(+2.09)#3,858 |
| 50. | 67450 | 7.0% | 4.0%(+2.99)#50 | 4.9%(+2.06)#3,891 |
| 51. | 67651 | 6.9% | 4.0%(+2.94)#51 | 4.9%(+2.00)#3,953 |
| 52. | 67757 | 6.9% | 4.0%(+2.94)#52 | 4.9%(+2.00)#3,954 |
| 53. | 67132 | 6.8% | 4.0%(+2.89)#53 | 4.9%(+1.96)#3,990 |
| 54. | 66451 | 6.7% | 4.0%(+2.78)#54 | 4.9%(+1.85)#4,146 |
| 55. | 66012 | 6.7% | 4.0%(+2.77)#55 | 4.9%(+1.83)#4,169 |
| 56. | 67483 | 6.7% | 4.0%(+2.71)#56 | 4.9%(+1.77)#4,246 |
| 57. | 66417 | 6.7% | 4.0%(+2.71)#57 | 4.9%(+1.77)#4,247 |
| 58. | 66862 | 6.7% | 4.0%(+2.71)#58 | 4.9%(+1.77)#4,254 |
| 59. | 66221 | 6.6% | 4.0%(+2.66)#59 | 4.9%(+1.73)#4,306 |
| 60. | 67522 | 6.5% | 4.0%(+2.56)#60 | 4.9%(+1.63)#4,429 |
| 61. | 66064 | 6.4% | 4.0%(+2.42)#61 | 4.9%(+1.48)#4,651 |
| 62. | 66539 | 6.3% | 4.0%(+2.36)#62 | 4.9%(+1.43)#4,728 |
| 63. | 66735 | 6.3% | 4.0%(+2.35)#63 | 4.9%(+1.41)#4,758 |
| 64. | 66061 | 6.3% | 4.0%(+2.32)#64 | 4.9%(+1.39)#4,804 |
| 65. | 66226 | 6.3% | 4.0%(+2.29)#65 | 4.9%(+1.36)#4,837 |
| 66. | 66062 | 6.2% | 4.0%(+2.26)#66 | 4.9%(+1.33)#4,908 |
| 67. | 66414 | 6.1% | 4.0%(+2.14)#67 | 4.9%(+1.20)#5,129 |
| 68. | 67877 | 6.1% | 4.0%(+2.13)#68 | 4.9%(+1.20)#5,137 |
| 69. | 66614 | 6.0% | 4.0%(+2.04)#69 | 4.9%(+1.11)#5,295 |
| 70. | 66441 | 6.0% | 4.0%(+2.03)#70 | 4.9%(+1.09)#5,321 |
| 71. | 67445 | 5.9% | 4.0%(+1.98)#71 | 4.9%(+1.05)#5,395 |
| 72. | 67008 | 5.9% | 4.0%(+1.92)#72 | 4.9%(+0.988)#5,530 |
| 73. | 67107 | 5.9% | 4.0%(+1.91)#73 | 4.9%(+0.980)#5,539 |
| 74. | 67135 | 5.9% | 4.0%(+1.91)#74 | 4.9%(+0.973)#5,555 |
| 75. | 67621 | 5.8% | 4.0%(+1.81)#75 | 4.9%(+0.875)#5,739 |
| 76. | 66755 | 5.7% | 4.0%(+1.71)#76 | 4.9%(+0.780)#5,926 |
| 77. | 66618 | 5.6% | 4.0%(+1.67)#77 | 4.9%(+0.736)#6,014 |
| 78. | 66526 | 5.6% | 4.0%(+1.60)#78 | 4.9%(+0.662)#6,185 |
| 79. | 67057 | 5.6% | 4.0%(+1.60)#79 | 4.9%(+0.662)#6,196 |
| 80. | 67854 | 5.5% | 4.0%(+1.51)#80 | 4.9%(+0.579)#6,362 |
| 81. | 66440 | 5.5% | 4.0%(+1.50)#81 | 4.9%(+0.565)#6,383 |
| 82. | 67019 | 5.4% | 4.0%(+1.42)#82 | 4.9%(+0.491)#6,544 |
| 83. | 66542 | 5.4% | 4.0%(+1.42)#83 | 4.9%(+0.482)#6,560 |
| 84. | 66040 | 5.4% | 4.0%(+1.39)#84 | 4.9%(+0.457)#6,641 |
| 85. | 66103 | 5.3% | 4.0%(+1.37)#85 | 4.9%(+0.434)#6,694 |
| 86. | 66210 | 5.3% | 4.0%(+1.36)#86 | 4.9%(+0.423)#6,722 |
| 87. | 66043 | 5.3% | 4.0%(+1.31)#87 | 4.9%(+0.373)#6,834 |
| 88. | 66772 | 5.3% | 4.0%(+1.30)#88 | 4.9%(+0.369)#6,862 |
| 89. | 67637 | 5.2% | 4.0%(+1.23)#89 | 4.9%(+0.296)#7,010 |
| 90. | 66213 | 5.2% | 4.0%(+1.22)#90 | 4.9%(+0.290)#7,018 |
| 91. | 67142 | 5.2% | 4.0%(+1.21)#91 | 4.9%(+0.278)#7,039 |
| 92. | 66864 | 5.1% | 4.0%(+1.17)#92 | 4.9%(+0.234)#7,148 |
| 93. | 66017 | 5.1% | 4.0%(+1.17)#93 | 4.9%(+0.234)#7,152 |
| 94. | 66849 | 5.1% | 4.0%(+1.12)#94 | 4.9%(+0.191)#7,251 |
| 95. | 66219 | 5.1% | 4.0%(+1.11)#95 | 4.9%(+0.176)#7,278 |
| 96. | 66030 | 5.0% | 4.0%(+1.03)#96 | 4.9%(+0.094)#7,483 |
| 97. | 67210 | 5.0% | 4.0%(+1.02)#97 | 4.9%(+0.091)#7,491 |
| 98. | 66403 | 5.0% | 4.0%(+0.991)#98 | 4.9%(+0.057)#7,564 |
| 99. | 66220 | 4.9% | 4.0%(+0.949)#99 | 4.9%(+0.015)#7,666 |
| 100. | 67756 | 4.9% | 4.0%(+0.935)#100 | 4.9%(+0.001)#7,710 |
Common Questions
What are the Top 10 Zip Codes with the Highest Percentage of Population with a Degree in Computers and Mathematics in Kansas?
Top 10 Zip Codes with the Highest Percentage of Population with a Degree in Computers and Mathematics in Kansas are:
What zip code has the Highest Percentage of Population with a Degree in Computers and Mathematics in Kansas?
67843 has the Highest Percentage of Population with a Degree in Computers and Mathematics in Kansas with 70.6%.
What is the Percentage of Population with a Degree in Computers and Mathematics in the State of Kansas?
Percentage of Population with a Degree in Computers and Mathematics in Kansas is 4.0%.
What is the Percentage of Population with a Degree in Computers and Mathematics in the United States?
Percentage of Population with a Degree in Computers and Mathematics in the United States is 4.9%.