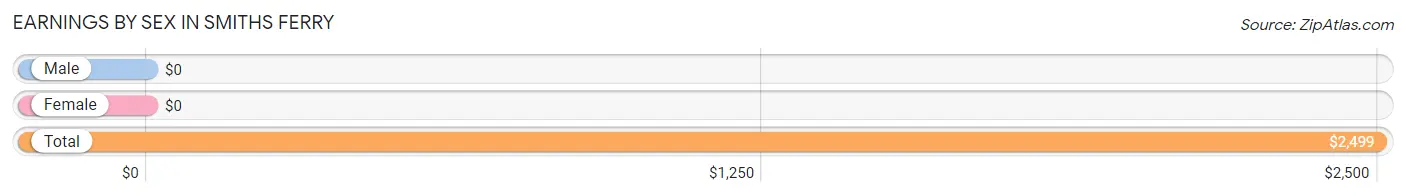
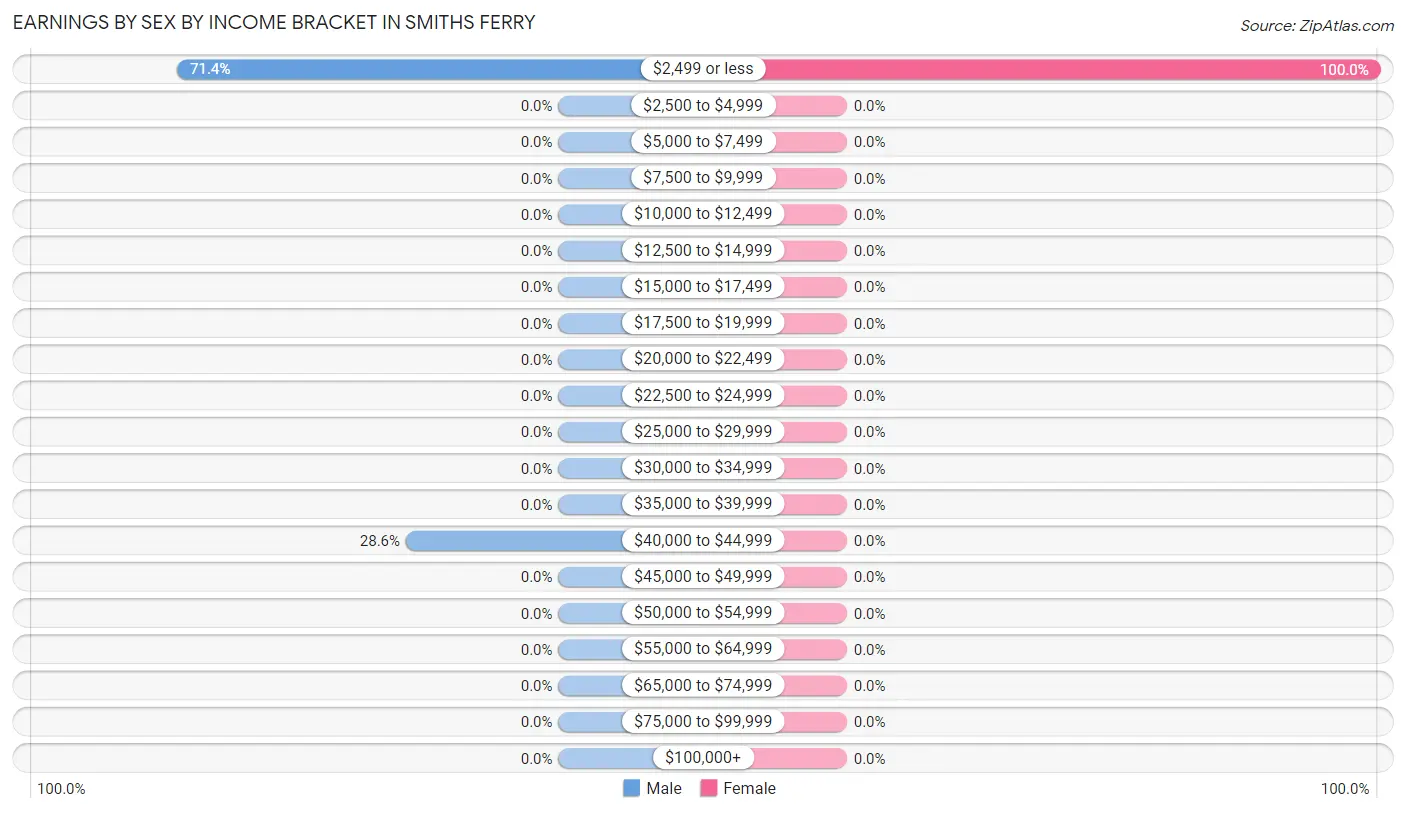
The most common earnings brackets in Smiths Ferry are $2,499 or less for men (5 | 71.4%) and $2,499 or less for women (26 | 100.0%).
Income
Male
Female
$2,499 or less
5 (71.4%)
26 (100.0%)
$2,500 to $4,999
0 (0.0%)
0 (0.0%)
$5,000 to $7,499
0 (0.0%)
0 (0.0%)
$7,500 to $9,999
0 (0.0%)
0 (0.0%)
$10,000 to $12,499
0 (0.0%)
0 (0.0%)
$12,500 to $14,999
0 (0.0%)
0 (0.0%)
$15,000 to $17,499
0 (0.0%)
0 (0.0%)
$17,500 to $19,999
0 (0.0%)
0 (0.0%)
$20,000 to $22,499
0 (0.0%)
0 (0.0%)
$22,500 to $24,999
0 (0.0%)
0 (0.0%)
$25,000 to $29,999
0 (0.0%)
0 (0.0%)
$30,000 to $34,999
0 (0.0%)
0 (0.0%)
$35,000 to $39,999
0 (0.0%)
0 (0.0%)
$40,000 to $44,999
2 (28.6%)
0 (0.0%)
$45,000 to $49,999
0 (0.0%)
0 (0.0%)
$50,000 to $54,999
0 (0.0%)
0 (0.0%)
$55,000 to $64,999
0 (0.0%)
0 (0.0%)
$65,000 to $74,999
0 (0.0%)
0 (0.0%)
$75,000 to $99,999
0 (0.0%)
0 (0.0%)
$100,000+
0 (0.0%)
0 (0.0%)
Total
7 (100.0%)
26 (100.0%)
Earnings by Sex by Educational Attainment in Smiths Ferry
Educational Attainment
Male Income
Female Income
Less than High School
-
-
High School Diploma
-
-
College or Associate's Degree
-
-
Bachelor's Degree
-
-
Graduate Degree
-
-
Total
-
-
Family Income in Smiths Ferry
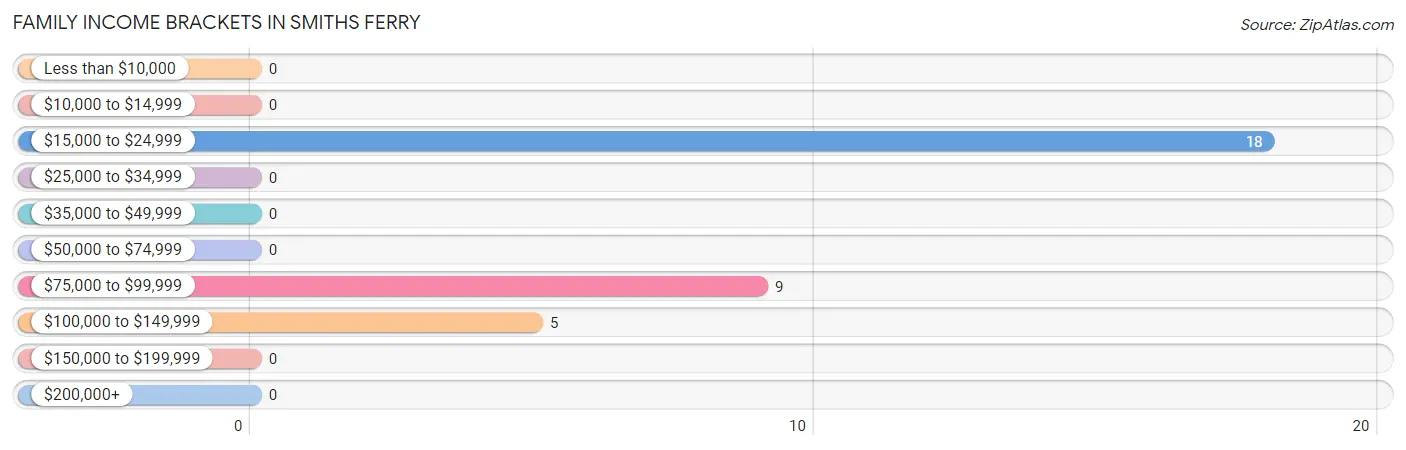
Family Income Brackets in Smiths Ferry
According to the Smiths Ferry family income data, there are 18 families falling into the $15,000 to $24,999 income range, which is the most common income bracket and makes up 56.2% of all families.
Income Bracket
# Families
% Families
Less than $10,000
0
0.0%
$10,000 to $14,999
0
0.0%
$15,000 to $24,999
18
56.3%
$25,000 to $34,999
0
0.0%
$35,000 to $49,999
0
0.0%
$50,000 to $74,999
0
0.0%
$75,000 to $99,999
9
28.1%
$100,000 to $149,999
5
15.6%
$150,000 to $199,999
0
0.0%
$200,000+
0
0.0%
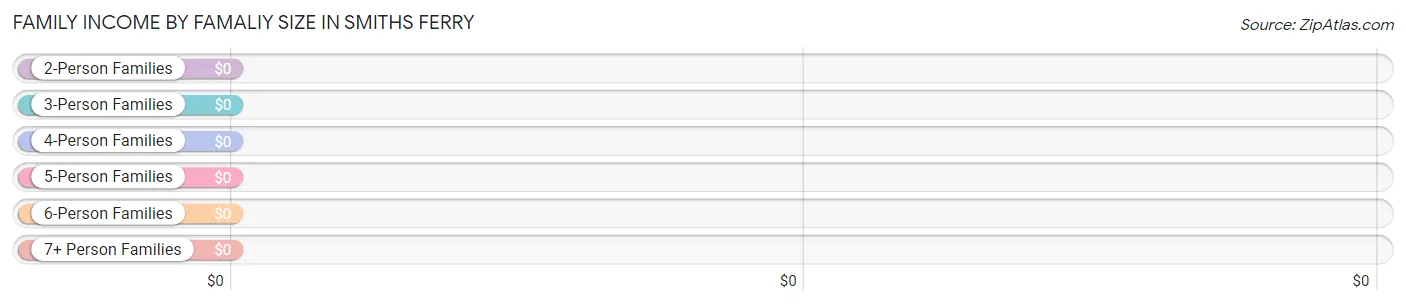
Family Income by Famaliy Size in Smiths Ferry
Income Bracket
# Families
Median Income
2-Person Families
32 (100.0%)
$0
3-Person Families
0 (0.0%)
$0
4-Person Families
0 (0.0%)
$0
5-Person Families
0 (0.0%)
$0
6-Person Families
0 (0.0%)
$0
7+ Person Families
0 (0.0%)
$0
Total
32 (100.0%)
$0
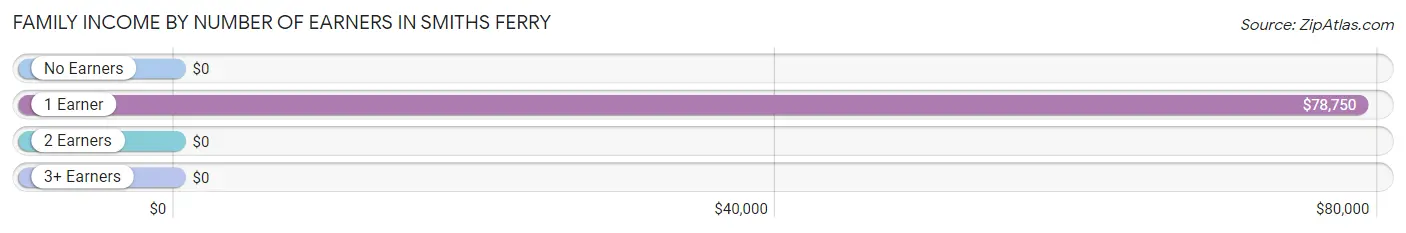
Family Income by Number of Earners in Smiths Ferry
Number of Earners
# Families
Median Income
No Earners
18 (56.2%)
$0
1 Earner
14 (43.8%)
$78,750
2 Earners
0 (0.0%)
$0
3+ Earners
0 (0.0%)
$0
Total
32 (100.0%)
$0
Household Income in Smiths Ferry
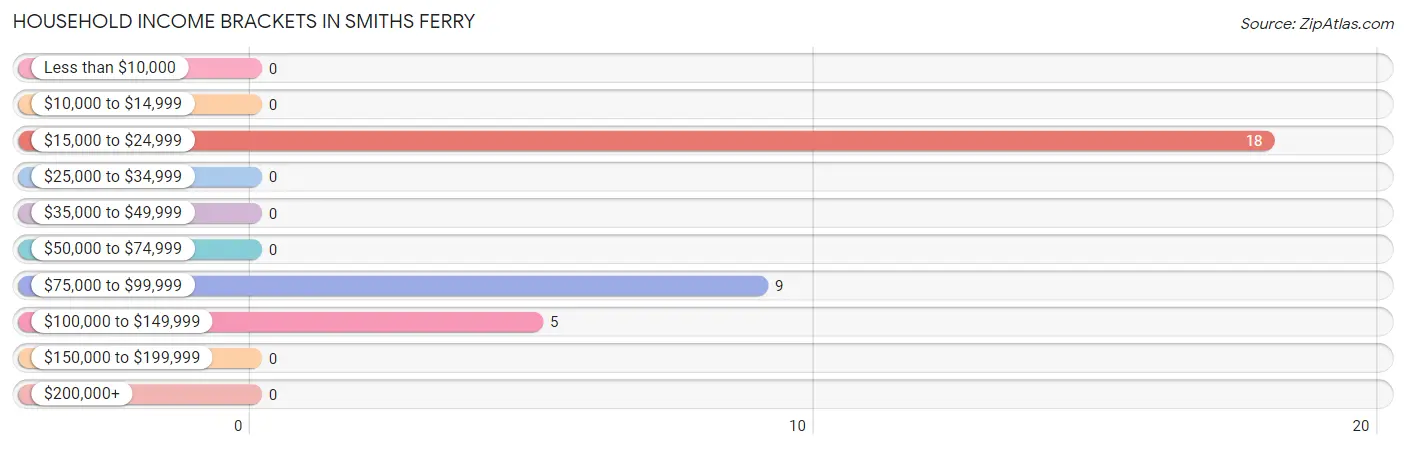
Household Income Brackets in Smiths Ferry
With 18 households falling in the category, the $15,000 to $24,999 income range is the most frequent in Smiths Ferry, accounting for 56.2% of all households.
Income Bracket
# Households
% Households
Less than $10,000
0
0.0%
$10,000 to $14,999
0
0.0%
$15,000 to $24,999
18
56.3%
$25,000 to $34,999
0
0.0%
$35,000 to $49,999
0
0.0%
$50,000 to $74,999
0
0.0%
$75,000 to $99,999
9
28.1%
$100,000 to $149,999
5
15.6%
$150,000 to $199,999
0
0.0%
$200,000+
0
0.0%
Household Income by Householder Age in Smiths Ferry
Income Bracket
# Households
Median Income
15 to 24 Years
0 (0.0%)
$0
25 to 44 Years
0 (0.0%)
$0
45 to 64 Years
2 (6.2%)
$0
65+ Years
30 (93.8%)
$0
Total
32 (100.0%)
$0
Poverty in Smiths Ferry
Income Below Poverty by Sex and Age in Smiths Ferry
Age Bracket
Male
Female
Under 5 Years
0 (0.0%)
0 (0.0%)
5 Years
0 (0.0%)
0 (0.0%)
6 to 11 Years
0 (0.0%)
0 (0.0%)
12 to 14 Years
0 (0.0%)
0 (0.0%)
15 Years
0 (0.0%)
0 (0.0%)
16 and 17 Years
0 (0.0%)
0 (0.0%)
18 to 24 Years
0 (0.0%)
0 (0.0%)
25 to 34 Years
0 (0.0%)
0 (0.0%)
35 to 44 Years
0 (0.0%)
0 (0.0%)
45 to 54 Years
0 (0.0%)
0 (0.0%)
55 to 64 Years
0 (0.0%)
0 (0.0%)
65 to 74 Years
0 (0.0%)
0 (0.0%)
75 Years and over
0 (0.0%)
0 (0.0%)
Total
0 (0.0%)
0 (0.0%)
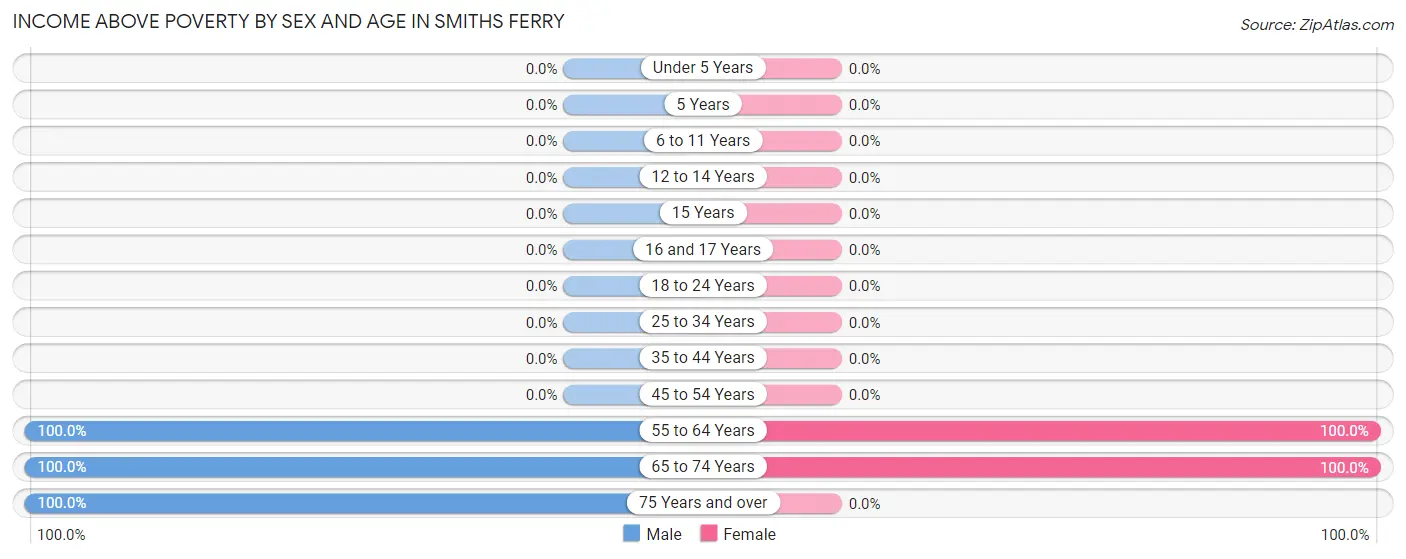
Income Above Poverty by Sex and Age in Smiths Ferry
According to the poverty statistics in Smiths Ferry, males aged 55 to 64 years and females aged 55 to 64 years are the age groups that are most secure financially, with 100.0% of males and 100.0% of females in these age groups living above the poverty line.
Age Bracket
Male
Female
Under 5 Years
0 (0.0%)
0 (0.0%)
5 Years
0 (0.0%)
0 (0.0%)
6 to 11 Years
0 (0.0%)
0 (0.0%)
12 to 14 Years
0 (0.0%)
0 (0.0%)
15 Years
0 (0.0%)
0 (0.0%)
16 and 17 Years
0 (0.0%)
0 (0.0%)
18 to 24 Years
0 (0.0%)
0 (0.0%)
25 to 34 Years
0 (0.0%)
0 (0.0%)
35 to 44 Years
0 (0.0%)
0 (0.0%)
45 to 54 Years
0 (0.0%)
0 (0.0%)
55 to 64 Years
2 (100.0%)
3 (100.0%)
65 to 74 Years
23 (100.0%)
47 (100.0%)
75 Years and over
7 (100.0%)
0 (0.0%)
Total
32 (100.0%)
50 (100.0%)
Income Below Poverty Among Married-Couple Families in Smiths Ferry
Children
Above Poverty
Below Poverty
No Children
25 (100.0%)
0 (0.0%)
1 or 2 Children
0 (0.0%)
0 (0.0%)
3 or 4 Children
0 (0.0%)
0 (0.0%)
5 or more Children
0 (0.0%)
0 (0.0%)
Total
25 (100.0%)
0 (0.0%)
Income Below Poverty Among Single-Parent Households in Smiths Ferry
Children
Single Father
Single Mother
No Children
0 (0.0%)
0 (0.0%)
1 or 2 Children
0 (0.0%)
0 (0.0%)
3 or 4 Children
0 (0.0%)
0 (0.0%)
5 or more Children
0 (0.0%)
0 (0.0%)
Total
0 (0.0%)
0 (0.0%)
Income Below Poverty Among Married-Couple vs Single-Parent Households in Smiths Ferry
Children
Married-Couple Families
Single-Parent Households
No Children
0 (0.0%)
0 (0.0%)
1 or 2 Children
0 (0.0%)
0 (0.0%)
3 or 4 Children
0 (0.0%)
0 (0.0%)
5 or more Children
0 (0.0%)
0 (0.0%)
Total
0 (0.0%)
0 (0.0%)
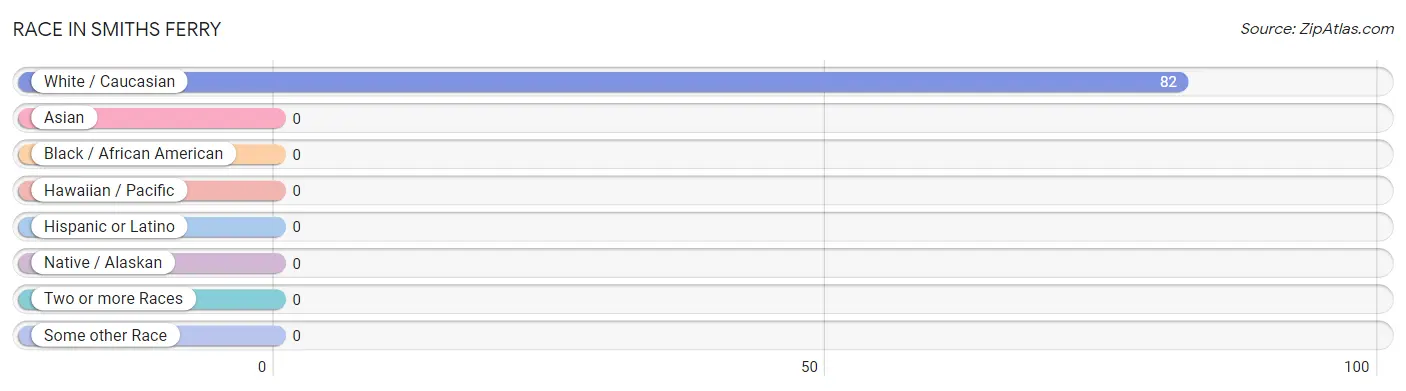
Race in Smiths Ferry
The most populous races in Smiths Ferry are , and White / Caucasian (82 | 100.0%).
Race
# Population
% Population
Asian
0
0.0%
Black / African American
0
0.0%
Hawaiian / Pacific
0
0.0%
Hispanic or Latino
0
0.0%
Native / Alaskan
0
0.0%
White / Caucasian
82
100.0%
Two or more Races
0
0.0%
Some other Race
0
0.0%
Total
82
100.0%
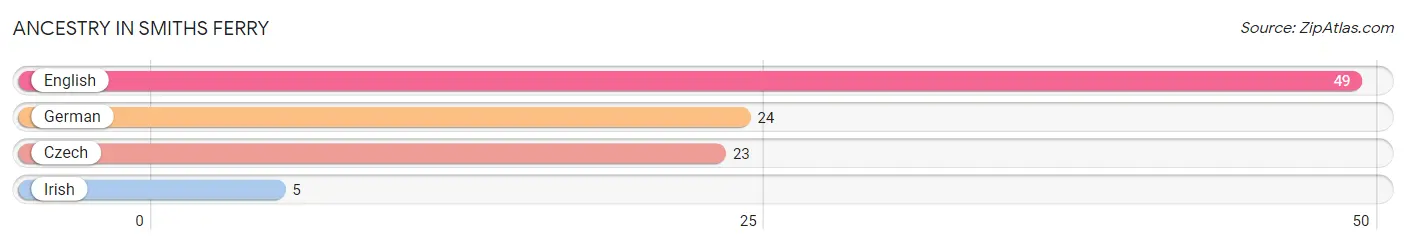
Ancestry in Smiths Ferry
The most populous ancestries reported in Smiths Ferry are English (49 | 59.8%), German (24 | 29.3%), Czech (23 | 28.1%), and Irish (5 | 6.1%), together accounting for 123.2% of all Smiths Ferry residents.
Ancestry
# Population
% Population
Czech
23
28.1%
English
49
59.8%
German
24
29.3%
Irish
5
6.1%
View All 4 Rows
Immigrants in Smiths Ferry
Immigration Origin
# Population
% Population
View All 0 Rows
Sex and Age in Smiths Ferry
Sex and Age in Smiths Ferry
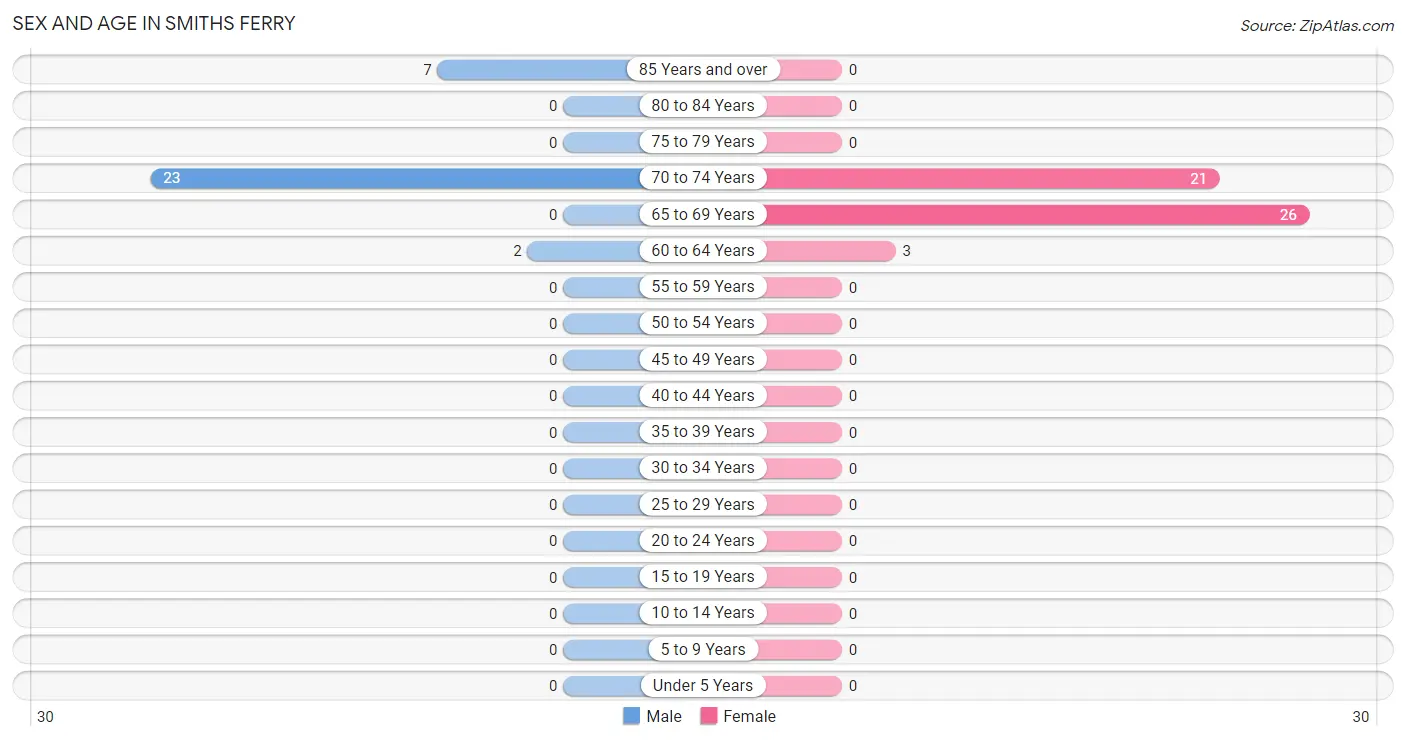
The most populous age groups in Smiths Ferry are 70 to 74 Years (23 | 71.9%) for men and 65 to 69 Years (26 | 52.0%) for women.
Age Bracket
Male
Female
Under 5 Years
0 (0.0%)
0 (0.0%)
5 to 9 Years
0 (0.0%)
0 (0.0%)
10 to 14 Years
0 (0.0%)
0 (0.0%)
15 to 19 Years
0 (0.0%)
0 (0.0%)
20 to 24 Years
0 (0.0%)
0 (0.0%)
25 to 29 Years
0 (0.0%)
0 (0.0%)
30 to 34 Years
0 (0.0%)
0 (0.0%)
35 to 39 Years
0 (0.0%)
0 (0.0%)
40 to 44 Years
0 (0.0%)
0 (0.0%)
45 to 49 Years
0 (0.0%)
0 (0.0%)
50 to 54 Years
0 (0.0%)
0 (0.0%)
55 to 59 Years
0 (0.0%)
0 (0.0%)
60 to 64 Years
2 (6.2%)
3 (6.0%)
65 to 69 Years
0 (0.0%)
26 (52.0%)
70 to 74 Years
23 (71.9%)
21 (42.0%)
75 to 79 Years
0 (0.0%)
0 (0.0%)
80 to 84 Years
0 (0.0%)
0 (0.0%)
85 Years and over
7 (21.9%)
0 (0.0%)
Total
32 (100.0%)
50 (100.0%)
Families and Households in Smiths Ferry
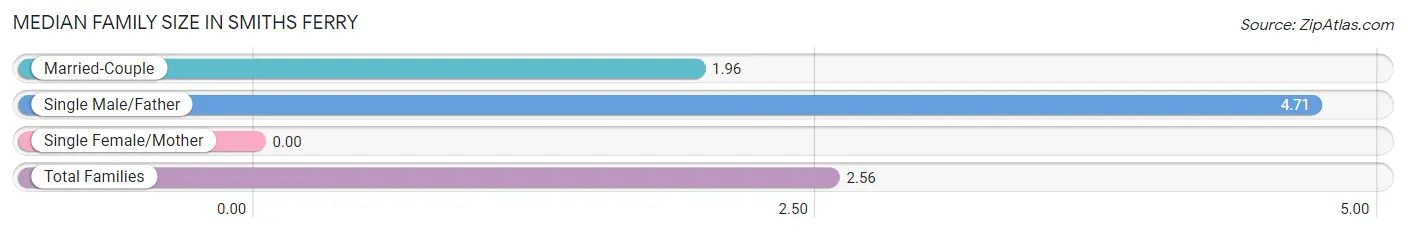
Median Family Size in Smiths Ferry
Family Type
# Families
Family Size
Married-Couple
25 (78.1%)
1.96
Single Male/Father
7 (21.9%)
4.71
Single Female/Mother
0 (0.0%)
-
Total Families
32 (100.0%)
2.56
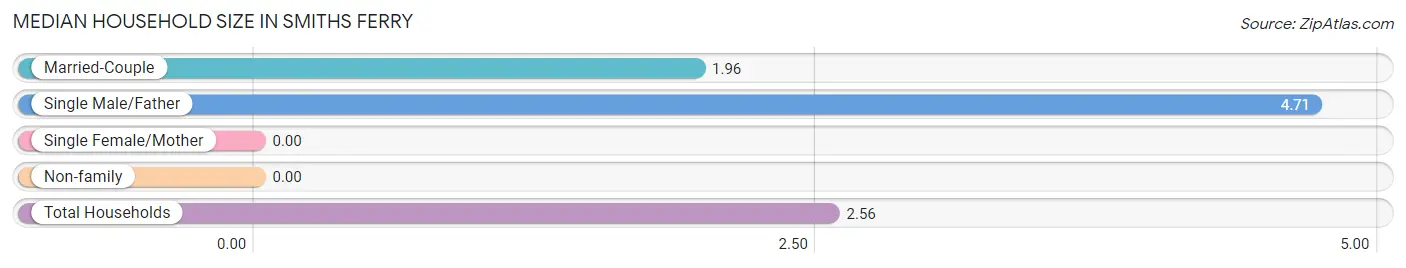
Median Household Size in Smiths Ferry
Household Type
# Households
Household Size
Married-Couple
25 (78.1%)
1.96
Single Male/Father
7 (21.9%)
4.71
Single Female/Mother
0 (0.0%)
-
Non-family
0 (0.0%)
-
Total Households
32 (100.0%)
2.56
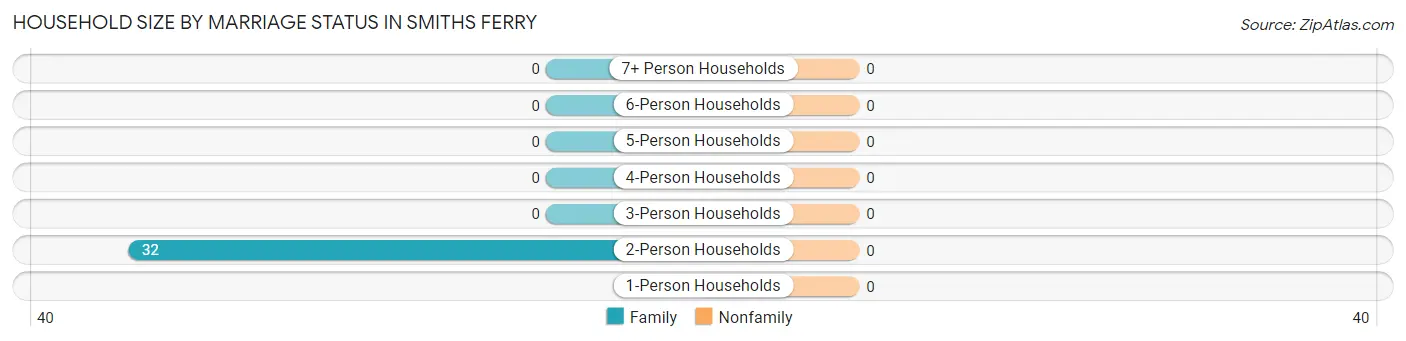
Household Size by Marriage Status in Smiths Ferry
Household Size
Family Households
Nonfamily Households
1-Person Households
-
0 (0.0%)
2-Person Households
32 (100.0%)
0 (0.0%)
3-Person Households
0 (0.0%)
0 (0.0%)
4-Person Households
0 (0.0%)
0 (0.0%)
5-Person Households
0 (0.0%)
0 (0.0%)
6-Person Households
0 (0.0%)
0 (0.0%)
7+ Person Households
0 (0.0%)
0 (0.0%)
Total
32 (100.0%)
0 (0.0%)
Female Fertility in Smiths Ferry
Fertility by Age in Smiths Ferry
Age Bracket
Women with Births
Births / 1,000 Women
15 to 19 years
0 (0.0%)
0.0
20 to 34 years
0 (0.0%)
0.0
35 to 50 years
0 (0.0%)
0.0
Total
0 (0.0%)
0.0
Fertility by Age by Marriage Status in Smiths Ferry
Age Bracket
Married
Unmarried
15 to 19 years
0 (0.0%)
0 (0.0%)
20 to 34 years
0 (0.0%)
0 (0.0%)
35 to 50 years
0 (0.0%)
0 (0.0%)
Total
0 (0.0%)
0 (0.0%)
Fertility by Education in Smiths Ferry
Educational Attainment
Women with Births
Births / 1,000 Women
Less than High School
0 (0.0%)
0.0
High School Diploma
0 (0.0%)
0.0
College or Associate's Degree
0 (0.0%)
0.0
Bachelor's Degree
0 (0.0%)
0.0
Graduate Degree
0 (0.0%)
0.0
Total
0 (0.0%)
0.0
Fertility by Education by Marriage Status in Smiths Ferry
Educational Attainment
Married
Unmarried
Less than High School
0 (0.0%)
0 (0.0%)
High School Diploma
0 (0.0%)
0 (0.0%)
College or Associate's Degree
0 (0.0%)
0 (0.0%)
Bachelor's Degree
0 (0.0%)
0 (0.0%)
Graduate Degree
0 (0.0%)
0 (0.0%)
Total
0 (0.0%)
0 (0.0%)
Employment Characteristics in Smiths Ferry
Employment by Class of Employer in Smiths Ferry
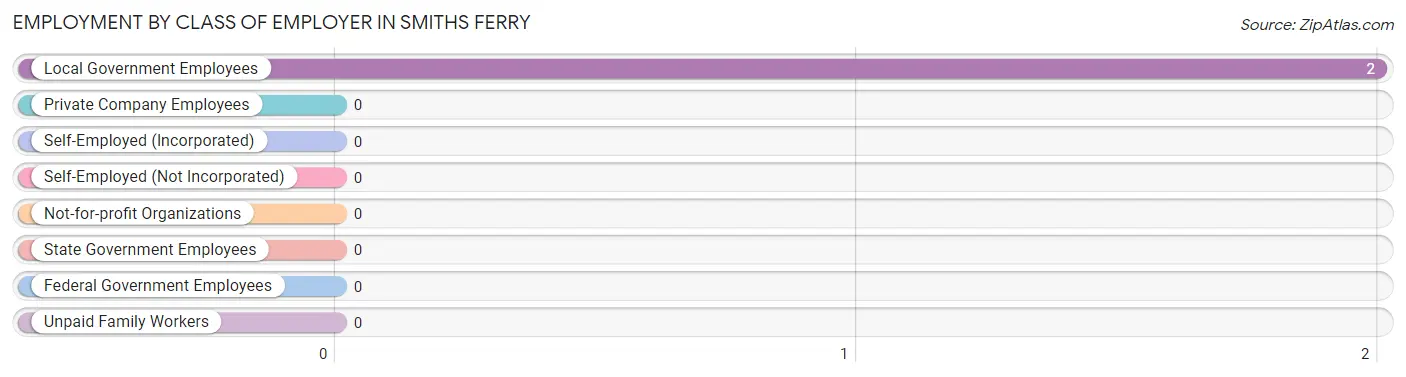
Among the 2 employed individuals in Smiths Ferry, , and local government employees (2 | 100.0%) make up the most common classes of employment.
Employer Class
# Employees
% Employees
Private Company Employees
0
0.0%
Self-Employed (Incorporated)
0
0.0%
Self-Employed (Not Incorporated)
0
0.0%
Not-for-profit Organizations
0
0.0%
Local Government Employees
2
100.0%
State Government Employees
0
0.0%
Federal Government Employees
0
0.0%
Unpaid Family Workers
0
0.0%
Total
2
100.0%
Employment Status by Age in Smiths Ferry
Age Bracket
In Labor Force
Unemployed
16 to 19 Years
0 (0.0%)
0 (0.0%)
20 to 24 Years
0 (0.0%)
0 (0.0%)
25 to 29 Years
0 (0.0%)
0 (0.0%)
30 to 34 Years
0 (0.0%)
0 (0.0%)
35 to 44 Years
0 (0.0%)
0 (0.0%)
45 to 54 Years
0 (0.0%)
0 (0.0%)
55 to 59 Years
0 (0.0%)
0 (0.0%)
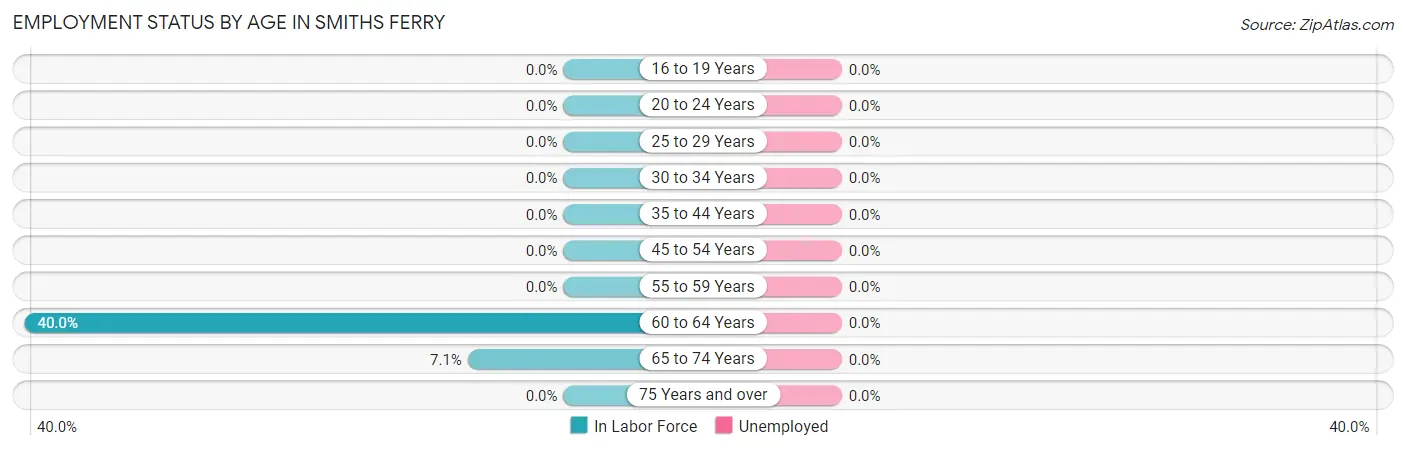
60 to 64 Years
2 (40.0%)
0 (0.0%)
65 to 74 Years
5 (7.1%)
0 (0.0%)
75 Years and over
0 (0.0%)
0 (0.0%)
Total
7 (8.5%)
0 (0.0%)
Employment Status by Educational Attainment in Smiths Ferry
Educational Attainment
In Labor Force
Unemployed
Less than High School
0 (0.0%)
0 (0.0%)
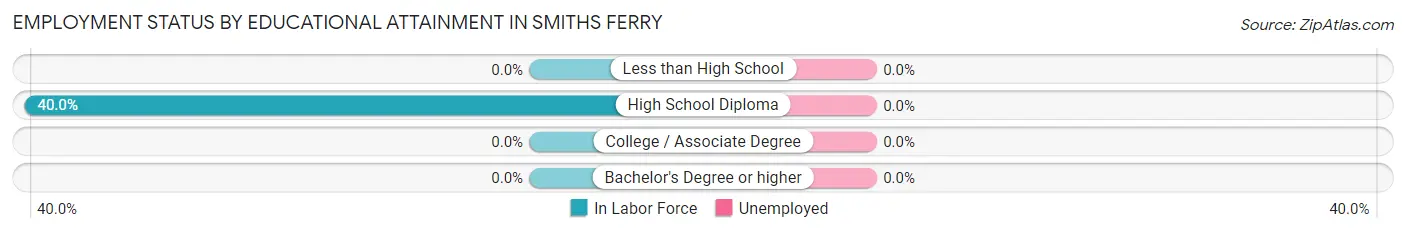
High School Diploma
2 (40.0%)
0 (0.0%)
College / Associate Degree
0 (0.0%)
0 (0.0%)
Bachelor's Degree or higher
0 (0.0%)
0 (0.0%)
Total
2 (40.0%)
0 (0.0%)
Employment Occupations by Sex in Smiths Ferry
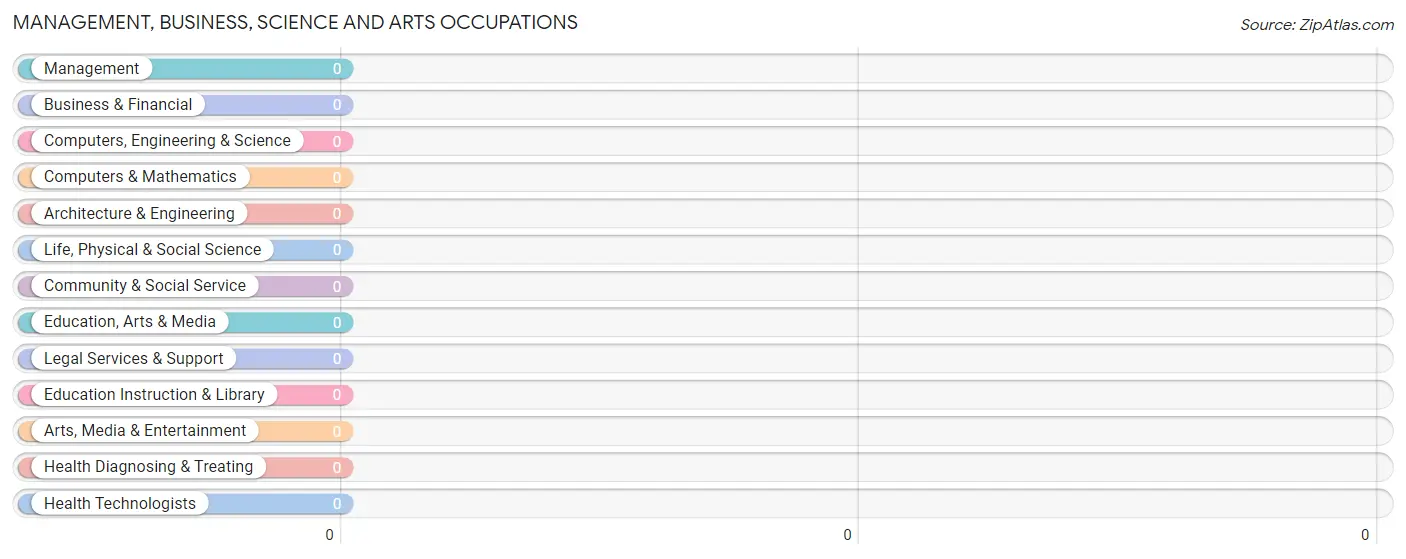
Management, Business, Science and Arts Occupations
Management, Business, Science and Arts Occupations by Sex
Occupation
Male
Female
Management
0 (0.0%)
0 (0.0%)
Business & Financial
0 (0.0%)
0 (0.0%)
Computers, Engineering & Science
0 (0.0%)
0 (0.0%)
Computers & Mathematics
0 (0.0%)
0 (0.0%)
Architecture & Engineering
0 (0.0%)
0 (0.0%)
Life, Physical & Social Science
0 (0.0%)
0 (0.0%)
Community & Social Service
0 (0.0%)
0 (0.0%)
Education, Arts & Media
0 (0.0%)
0 (0.0%)
Legal Services & Support
0 (0.0%)
0 (0.0%)
Education Instruction & Library
0 (0.0%)
0 (0.0%)
Arts, Media & Entertainment
0 (0.0%)
0 (0.0%)
Health Diagnosing & Treating
0 (0.0%)
0 (0.0%)
Health Technologists
0 (0.0%)
0 (0.0%)
Total (Category)
0 (0.0%)
0 (0.0%)
Total (Overall)
7 (100.0%)
0 (0.0%)
Services Occupations
Services Occupations by Sex
Occupation
Male
Female
Healthcare Support
0 (0.0%)
0 (0.0%)
Security & Protection
0 (0.0%)
0 (0.0%)
Firefighting & Prevention
0 (0.0%)
0 (0.0%)
Law Enforcement
0 (0.0%)
0 (0.0%)
Food Preparation & Serving
0 (0.0%)
0 (0.0%)
Cleaning & Maintenance
0 (0.0%)
0 (0.0%)
Personal Care & Service
0 (0.0%)
0 (0.0%)
Total (Category)
0 (0.0%)
0 (0.0%)
Total (Overall)
7 (100.0%)
0 (0.0%)
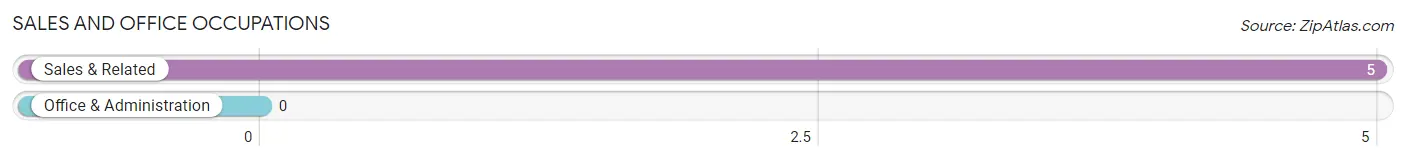
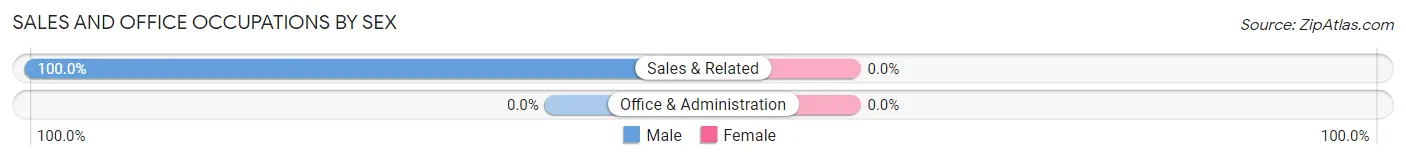
Sales and Office Occupations
The most common Sales and Office occupations in Smiths Ferry are , and Sales & Related (5 | 71.4%).
Sales and Office Occupations by Sex
Occupation
Male
Female
Sales & Related
5 (100.0%)
0 (0.0%)
Office & Administration
0 (0.0%)
0 (0.0%)
Total (Category)
5 (100.0%)
0 (0.0%)
Total (Overall)
7 (100.0%)
0 (0.0%)
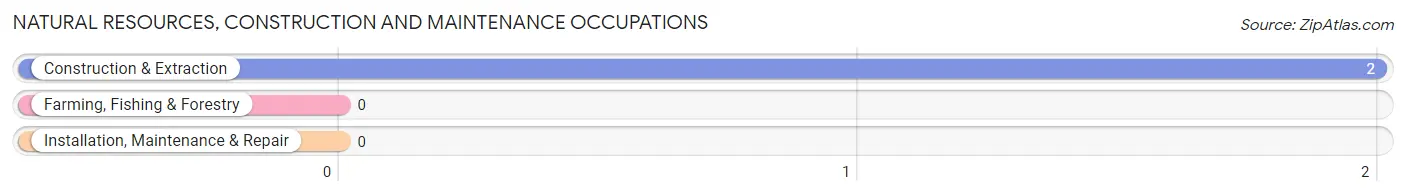
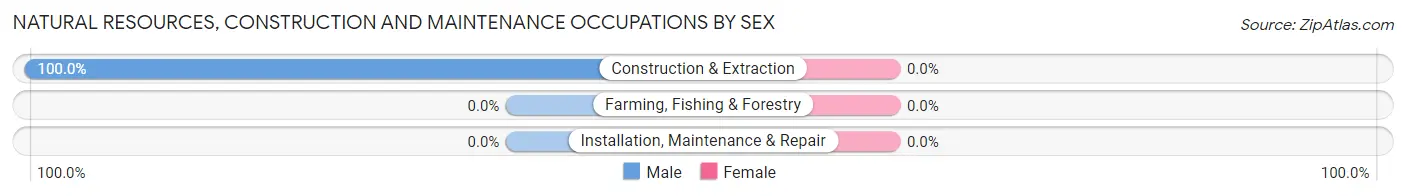
Natural Resources, Construction and Maintenance Occupations
The most common Natural Resources, Construction and Maintenance occupations in Smiths Ferry are , and Construction & Extraction (2 | 28.6%).
Natural Resources, Construction and Maintenance Occupations by Sex
Occupation
Male
Female
Farming, Fishing & Forestry
0 (0.0%)
0 (0.0%)
Construction & Extraction
2 (100.0%)
0 (0.0%)
Installation, Maintenance & Repair
0 (0.0%)
0 (0.0%)
Total (Category)
2 (100.0%)
0 (0.0%)
Total (Overall)
7 (100.0%)
0 (0.0%)
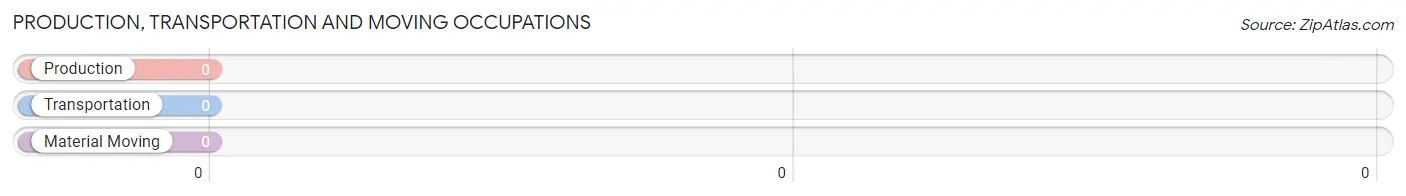
Production, Transportation and Moving Occupations
Production, Transportation and Moving Occupations by Sex
Occupation
Male
Female
Production
0 (0.0%)
0 (0.0%)
Transportation
0 (0.0%)
0 (0.0%)
Material Moving
0 (0.0%)
0 (0.0%)
Total (Category)
0 (0.0%)
0 (0.0%)
Total (Overall)
7 (100.0%)
0 (0.0%)
Employment Industries by Sex in Smiths Ferry
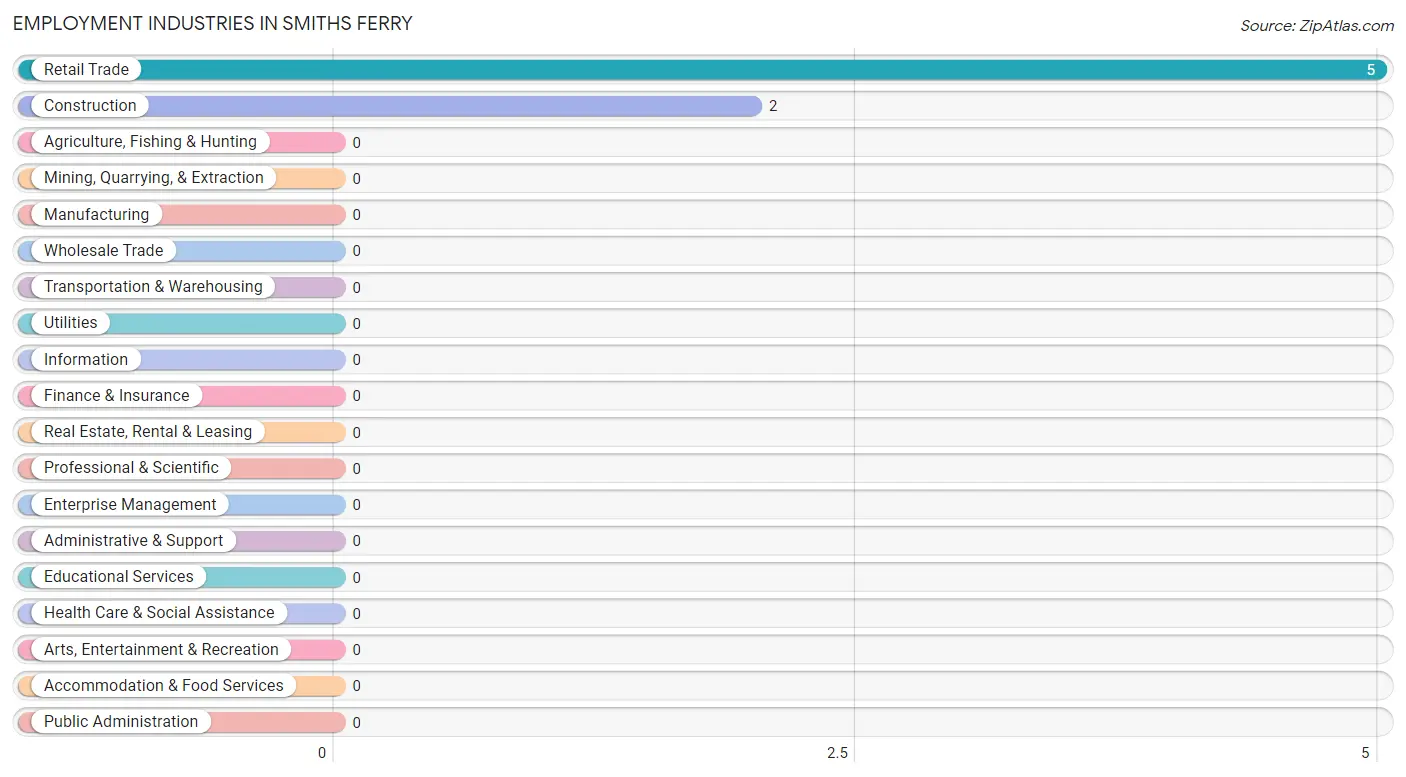
Employment Industries in Smiths Ferry
The major employment industries in Smiths Ferry include Retail Trade (5 | 71.4%), and Construction (2 | 28.6%).
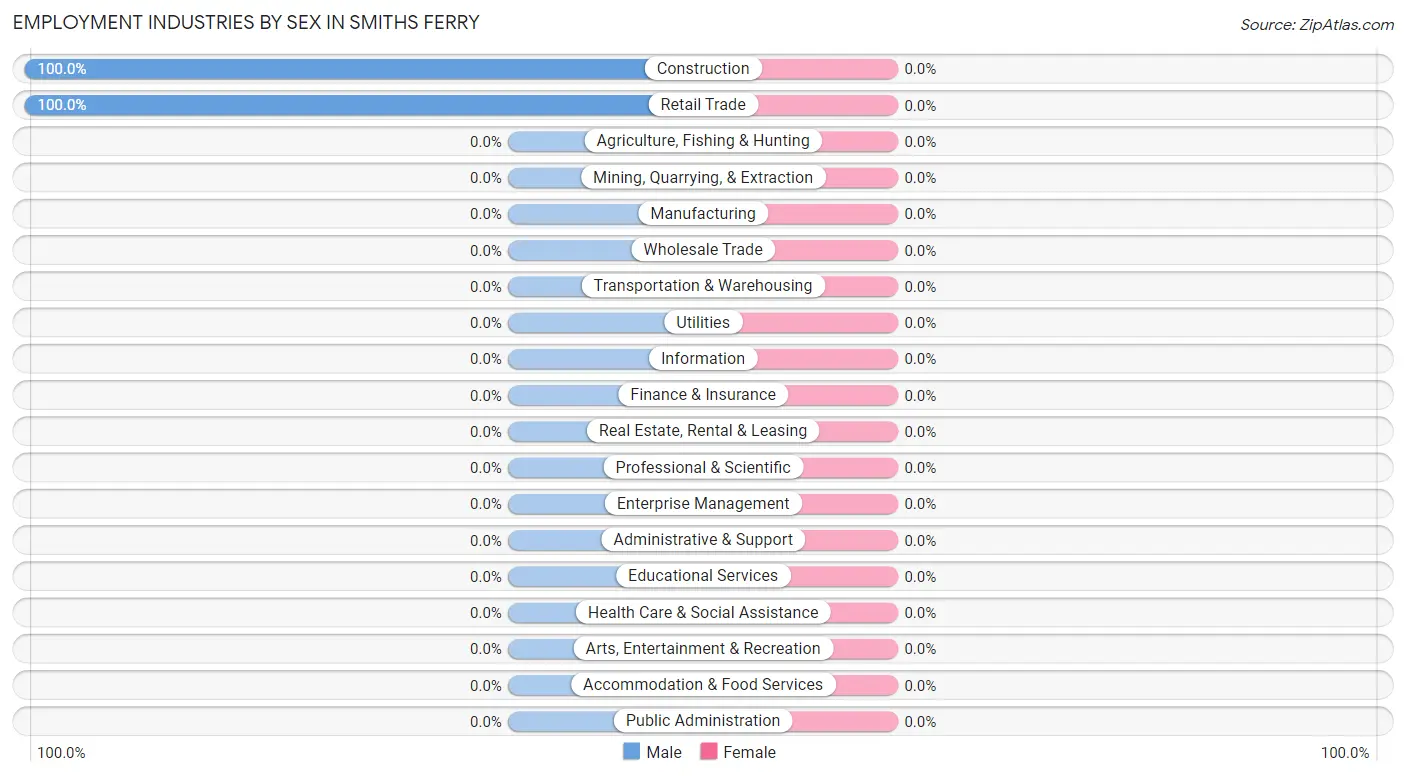
Employment Industries by Sex in Smiths Ferry
Industry
Male
Female
Agriculture, Fishing & Hunting
0 (0.0%)
0 (0.0%)
Mining, Quarrying, & Extraction
0 (0.0%)
0 (0.0%)
Construction
2 (100.0%)
0 (0.0%)
Manufacturing
0 (0.0%)
0 (0.0%)
Wholesale Trade
0 (0.0%)
0 (0.0%)
Retail Trade
5 (100.0%)
0 (0.0%)
Transportation & Warehousing
0 (0.0%)
0 (0.0%)
Utilities
0 (0.0%)
0 (0.0%)
Information
0 (0.0%)
0 (0.0%)
Finance & Insurance
0 (0.0%)
0 (0.0%)
Real Estate, Rental & Leasing
0 (0.0%)
0 (0.0%)
Professional & Scientific
0 (0.0%)
0 (0.0%)
Enterprise Management
0 (0.0%)
0 (0.0%)
Administrative & Support
0 (0.0%)
0 (0.0%)
Educational Services
0 (0.0%)
0 (0.0%)
Health Care & Social Assistance
0 (0.0%)
0 (0.0%)
Arts, Entertainment & Recreation
0 (0.0%)
0 (0.0%)
Accommodation & Food Services
0 (0.0%)
0 (0.0%)
Public Administration
0 (0.0%)
0 (0.0%)
Total
7 (100.0%)
0 (0.0%)
Education in Smiths Ferry
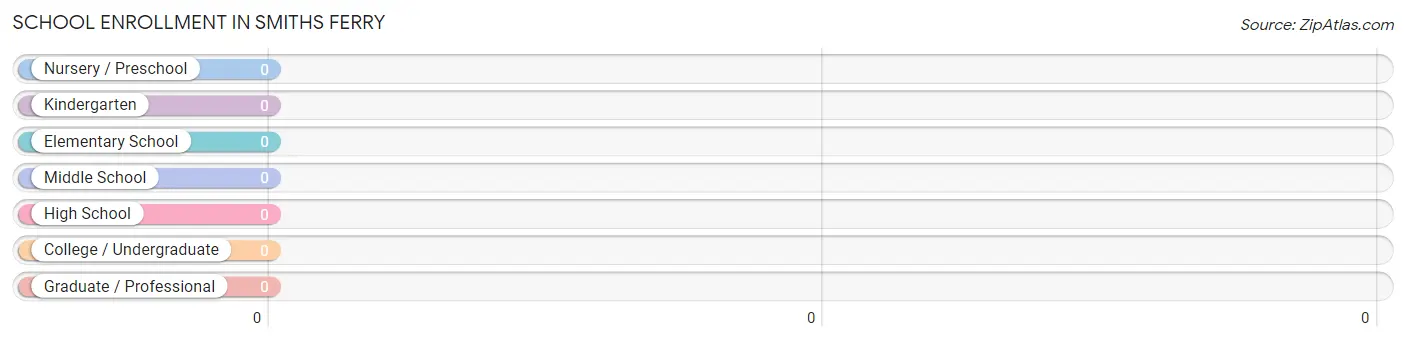
School Enrollment in Smiths Ferry
School Level
# Students
% Students
Nursery / Preschool
0
0.0%
Kindergarten
0
0.0%
Elementary School
0
0.0%
Middle School
0
0.0%
High School
0
0.0%
College / Undergraduate
0
0.0%
Graduate / Professional
0
0.0%
Total
0
0.0%
School Enrollment by Age by Funding Source in Smiths Ferry
Age Bracket
Public School
Private School
3 to 4 Year Olds
0 (0.0%)
0 (0.0%)
5 to 9 Year Old
0 (0.0%)
0 (0.0%)
10 to 14 Year Olds
0 (0.0%)
0 (0.0%)
15 to 17 Year Olds
0 (0.0%)
0 (0.0%)
18 to 19 Year Olds
0 (0.0%)
0 (0.0%)
20 to 24 Year Olds
0 (0.0%)
0 (0.0%)
25 to 34 Year Olds
0 (0.0%)
0 (0.0%)
35 Years and over
0 (0.0%)
0 (0.0%)
Total
0 (0.0%)
0 (0.0%)
Educational Attainment by Field of Study in Smiths Ferry
Field of Study
# Graduates
% Graduates
Computers & Mathematics
0
0.0%
Bio, Nature & Agricultural
0
0.0%
Physical & Health Sciences
0
0.0%
Psychology
0
0.0%
Social Sciences
0
0.0%
Engineering
0
0.0%
Multidisciplinary Studies
0
0.0%
Science & Technology
0
0.0%
Business
0
0.0%
Education
0
0.0%
Literature & Languages
0
0.0%
Liberal Arts & History
0
0.0%
Visual & Performing Arts
0
0.0%
Communications
0
0.0%
Arts & Humanities
0
0.0%
Total
0
0.0%
Transportation & Commute in Smiths Ferry
Vehicle Availability by Sex in Smiths Ferry
Vehicles Available
Male
Female
No Vehicle
0 (0.0%)
0 (0.0%)
1 Vehicle
0 (0.0%)
0 (0.0%)
2 Vehicles
0 (0.0%)
0 (0.0%)
3 Vehicles
2 (100.0%)
0 (0.0%)
4 Vehicles
0 (0.0%)
0 (0.0%)
5 or more Vehicles
0 (0.0%)
0 (0.0%)
Total
2 (100.0%)
0 (0.0%)
Commute Time in Smiths Ferry
The most frequently occuring commute durations in Smiths Ferry are 45 to 59 minutes (2 commuters, 100.0%), less than 5 minutes (0 commuters, 0.0%), and 5 to 9 minutes (0 commuters, 0.0%).
Commute Time
# Commuters
% Commuters
Less than 5 Minutes
0
0.0%
5 to 9 Minutes
0
0.0%
10 to 14 Minutes
0
0.0%
15 to 19 Minutes
0
0.0%
20 to 24 Minutes
0
0.0%
25 to 29 Minutes
0
0.0%
30 to 34 Minutes
0
0.0%
35 to 39 Minutes
0
0.0%
40 to 44 Minutes
0
0.0%
45 to 59 Minutes
2
100.0%
60 to 89 Minutes
0
0.0%
90 or more Minutes
0
0.0%
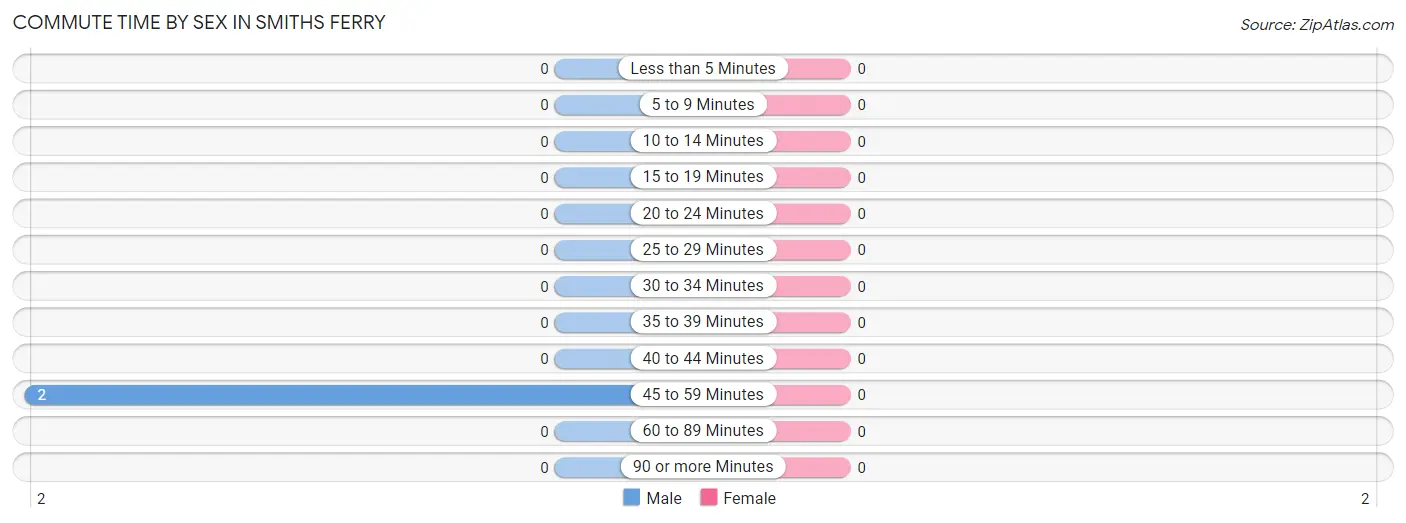
Commute Time by Sex in Smiths Ferry
Commute Time
Male
Female
Less than 5 Minutes
0 (0.0%)
0 (0.0%)
5 to 9 Minutes
0 (0.0%)
0 (0.0%)
10 to 14 Minutes
0 (0.0%)
0 (0.0%)
15 to 19 Minutes
0 (0.0%)
0 (0.0%)
20 to 24 Minutes
0 (0.0%)
0 (0.0%)
25 to 29 Minutes
0 (0.0%)
0 (0.0%)
30 to 34 Minutes
0 (0.0%)
0 (0.0%)
35 to 39 Minutes
0 (0.0%)
0 (0.0%)
40 to 44 Minutes
0 (0.0%)
0 (0.0%)
45 to 59 Minutes
2 (100.0%)
0 (0.0%)
60 to 89 Minutes
0 (0.0%)
0 (0.0%)
90 or more Minutes
0 (0.0%)
0 (0.0%)
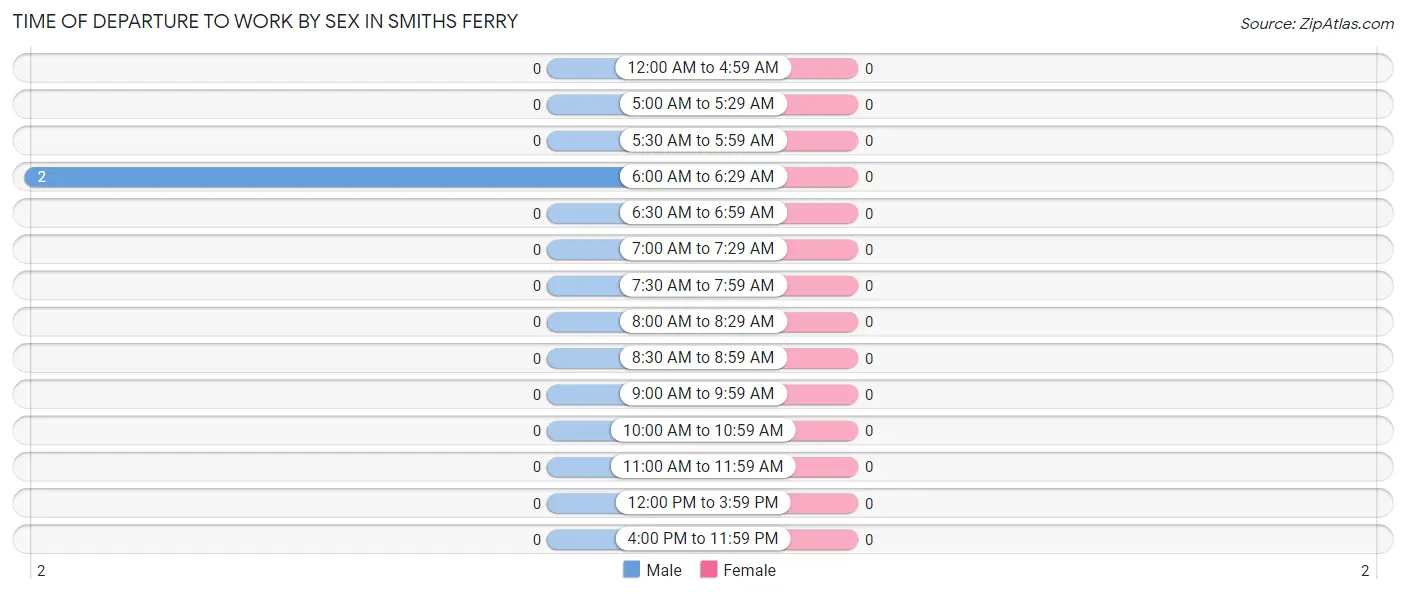
Time of Departure to Work by Sex in Smiths Ferry
Time of Departure
Male
Female
12:00 AM to 4:59 AM
0 (0.0%)
0 (0.0%)
5:00 AM to 5:29 AM
0 (0.0%)
0 (0.0%)
5:30 AM to 5:59 AM
0 (0.0%)
0 (0.0%)
6:00 AM to 6:29 AM
2 (100.0%)
0 (0.0%)
6:30 AM to 6:59 AM
0 (0.0%)
0 (0.0%)
7:00 AM to 7:29 AM
0 (0.0%)
0 (0.0%)
7:30 AM to 7:59 AM
0 (0.0%)
0 (0.0%)
8:00 AM to 8:29 AM
0 (0.0%)
0 (0.0%)
8:30 AM to 8:59 AM
0 (0.0%)
0 (0.0%)
9:00 AM to 9:59 AM
0 (0.0%)
0 (0.0%)
10:00 AM to 10:59 AM
0 (0.0%)
0 (0.0%)
11:00 AM to 11:59 AM
0 (0.0%)
0 (0.0%)
12:00 PM to 3:59 PM
0 (0.0%)
0 (0.0%)
4:00 PM to 11:59 PM
0 (0.0%)
0 (0.0%)
Total
2 (100.0%)
0 (0.0%)
Housing Occupancy in Smiths Ferry
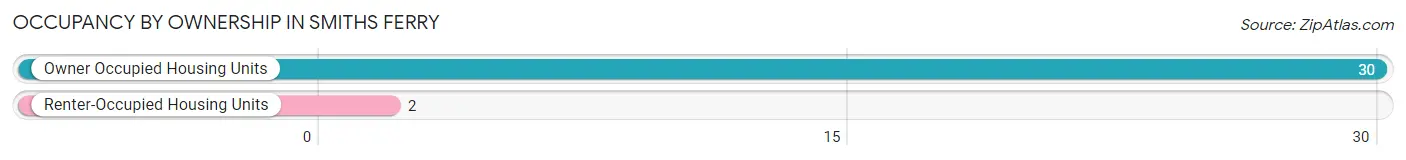
Occupancy by Ownership in Smiths Ferry
Of the total 32 dwellings in Smiths Ferry, owner-occupied units account for 30 (93.8%), while renter-occupied units make up 2 (6.2%).
Occupancy
# Housing Units
% Housing Units
Owner Occupied Housing Units
30
93.8%
Renter-Occupied Housing Units
2
6.2%
Total Occupied Housing Units
32
100.0%
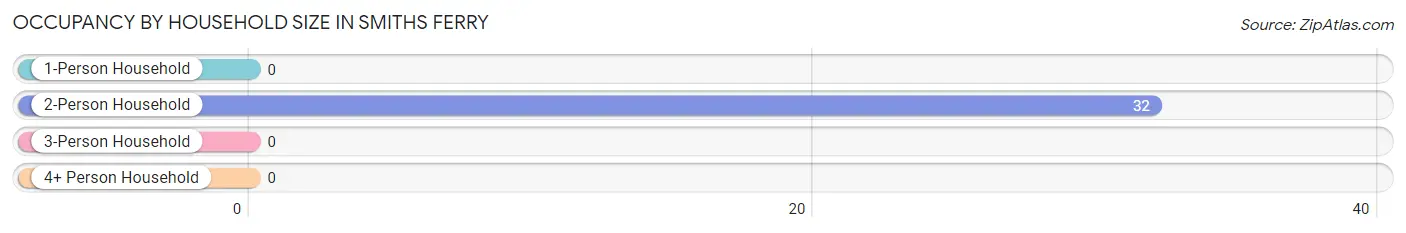
Occupancy by Household Size in Smiths Ferry
Household Size
# Housing Units
% Housing Units
1-Person Household
0
0.0%
2-Person Household
32
100.0%
3-Person Household
0
0.0%
4+ Person Household
0
0.0%
Total Housing Units
32
100.0%
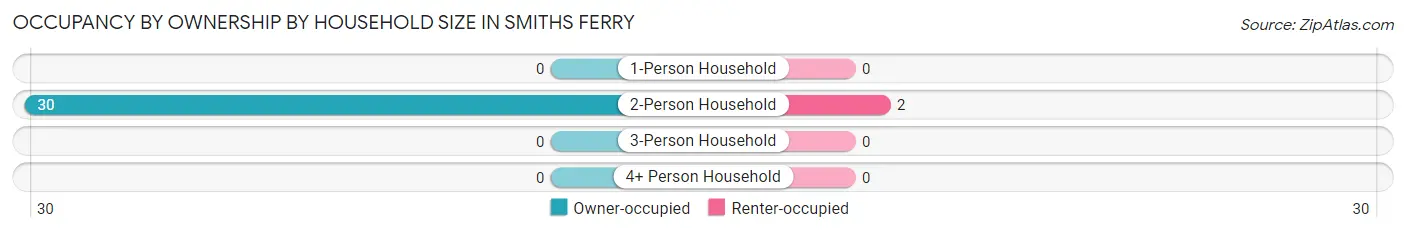
Occupancy by Ownership by Household Size in Smiths Ferry
Household Size
Owner-occupied
Renter-occupied
1-Person Household
0 (0.0%)
0 (0.0%)
2-Person Household
30 (93.8%)
2 (6.2%)
3-Person Household
0 (0.0%)
0 (0.0%)
4+ Person Household
0 (0.0%)
0 (0.0%)
Total Housing Units
30 (93.8%)
2 (6.2%)
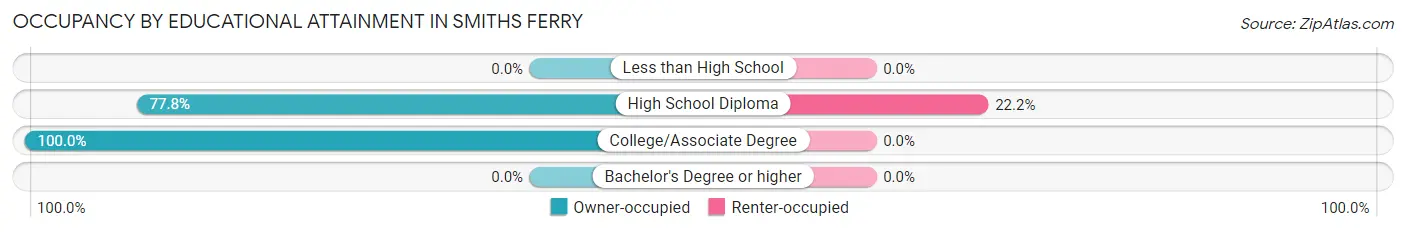
Occupancy by Educational Attainment in Smiths Ferry
Household Size
Owner-occupied
Renter-occupied
Less than High School
0 (0.0%)
0 (0.0%)
High School Diploma
7 (77.8%)
2 (22.2%)
College/Associate Degree
23 (100.0%)
0 (0.0%)
Bachelor's Degree or higher
0 (0.0%)
0 (0.0%)
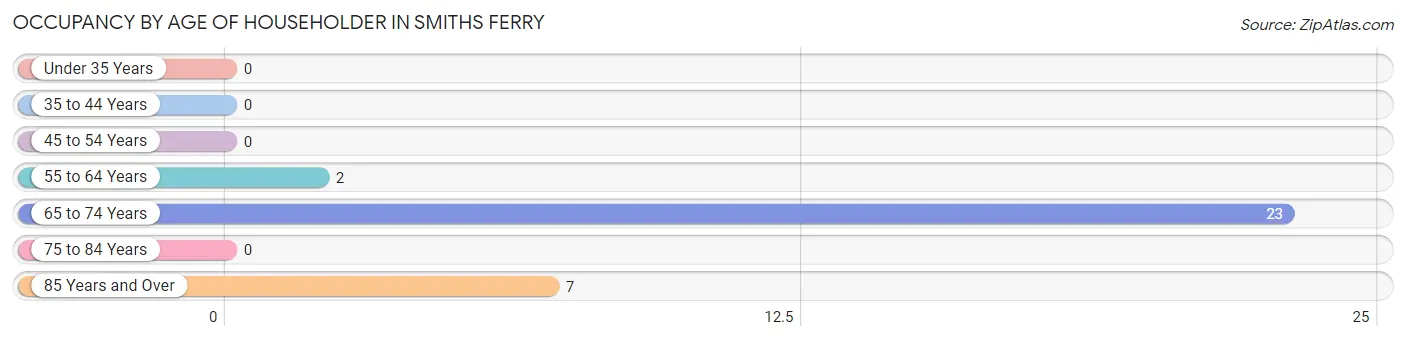
Occupancy by Age of Householder in Smiths Ferry
Age Bracket
# Households
% Households
Under 35 Years
0
0.0%
35 to 44 Years
0
0.0%
45 to 54 Years
0
0.0%
55 to 64 Years
2
6.2%
65 to 74 Years
23
71.9%
75 to 84 Years
0
0.0%
85 Years and Over
7
21.9%
Total
32
100.0%
Housing Finances in Smiths Ferry
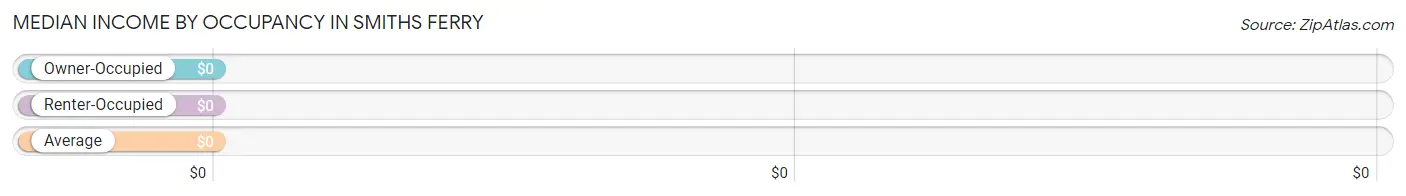
Median Income by Occupancy in Smiths Ferry
Occupancy Type
# Households
Median Income
Owner-Occupied
30 (93.8%)
$0
Renter-Occupied
2 (6.2%)
$0
Average
32 (100.0%)
$0
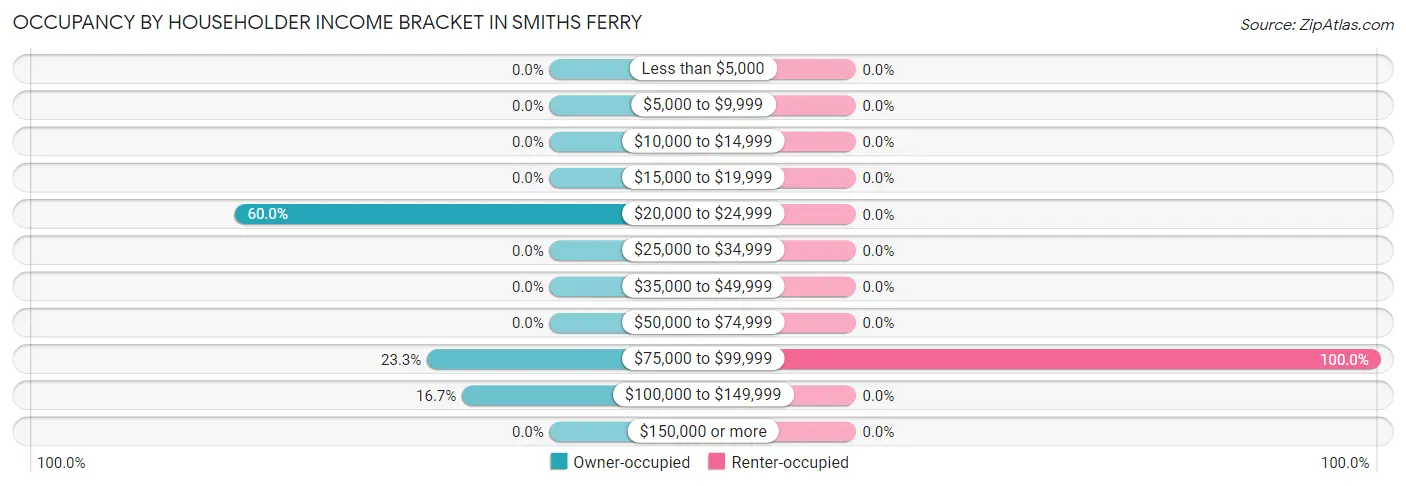
Occupancy by Householder Income Bracket in Smiths Ferry
Income Bracket
Owner-occupied
Renter-occupied
Less than $5,000
0 (0.0%)
0 (0.0%)
$5,000 to $9,999
0 (0.0%)
0 (0.0%)
$10,000 to $14,999
0 (0.0%)
0 (0.0%)
$15,000 to $19,999
0 (0.0%)
0 (0.0%)
$20,000 to $24,999
18 (60.0%)
0 (0.0%)
$25,000 to $34,999
0 (0.0%)
0 (0.0%)
$35,000 to $49,999
0 (0.0%)
0 (0.0%)
$50,000 to $74,999
0 (0.0%)
0 (0.0%)
$75,000 to $99,999
7 (23.3%)
2 (100.0%)
$100,000 to $149,999
5 (16.7%)
0 (0.0%)
$150,000 or more
0 (0.0%)
0 (0.0%)
Total
30 (100.0%)
2 (100.0%)
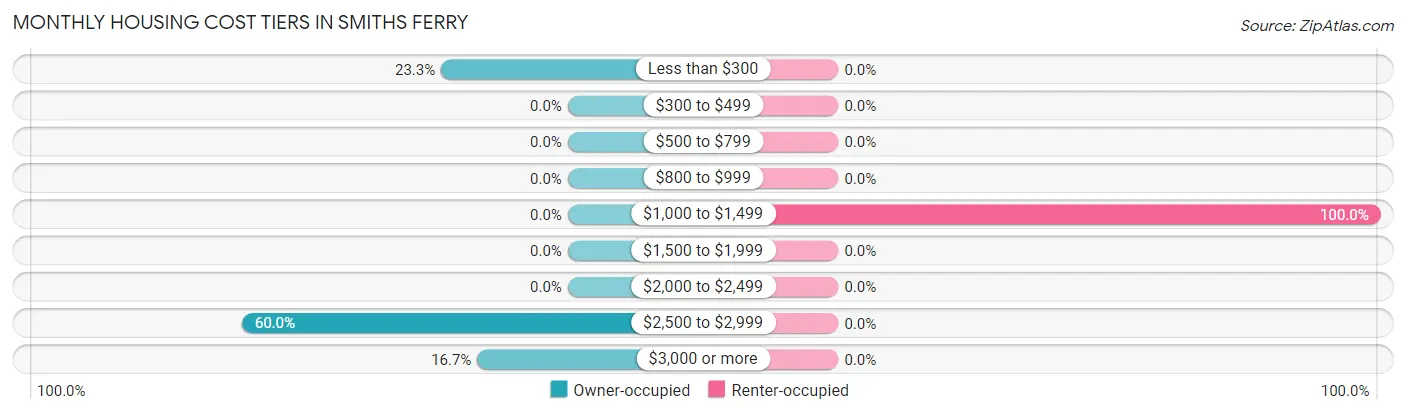
Monthly Housing Cost Tiers in Smiths Ferry
Monthly Cost
Owner-occupied
Renter-occupied
Less than $300
7 (23.3%)
0 (0.0%)
$300 to $499
0 (0.0%)
0 (0.0%)
$500 to $799
0 (0.0%)
0 (0.0%)
$800 to $999
0 (0.0%)
0 (0.0%)
$1,000 to $1,499
0 (0.0%)
2 (100.0%)
$1,500 to $1,999
0 (0.0%)
0 (0.0%)
$2,000 to $2,499
0 (0.0%)
0 (0.0%)
$2,500 to $2,999
18 (60.0%)
0 (0.0%)
$3,000 or more
5 (16.7%)
0 (0.0%)
Total
30 (100.0%)
2 (100.0%)
Physical Housing Characteristics in Smiths Ferry
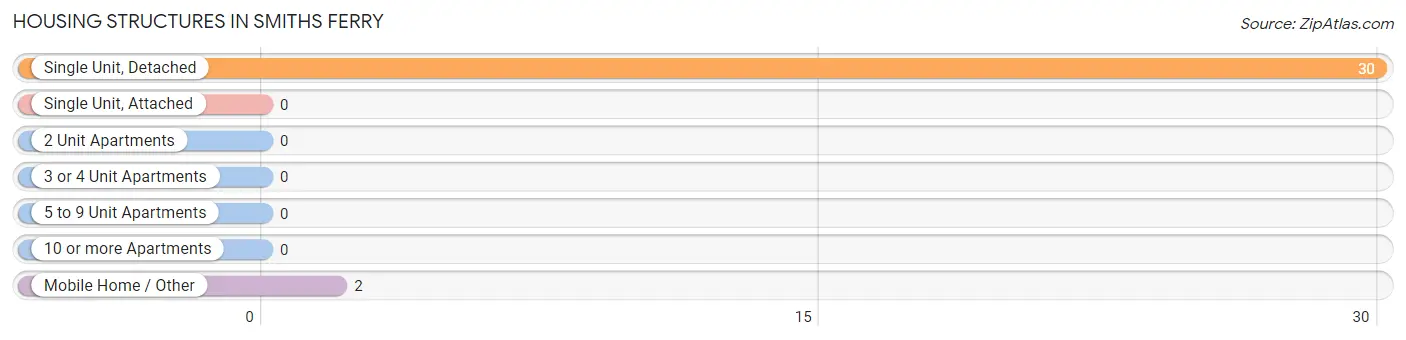
Housing Structures in Smiths Ferry
Structure Type
# Housing Units
% Housing Units
Single Unit, Detached
30
93.8%
Single Unit, Attached
0
0.0%
2 Unit Apartments
0
0.0%
3 or 4 Unit Apartments
0
0.0%
5 to 9 Unit Apartments
0
0.0%
10 or more Apartments
0
0.0%
Mobile Home / Other
2
6.2%
Total
32
100.0%
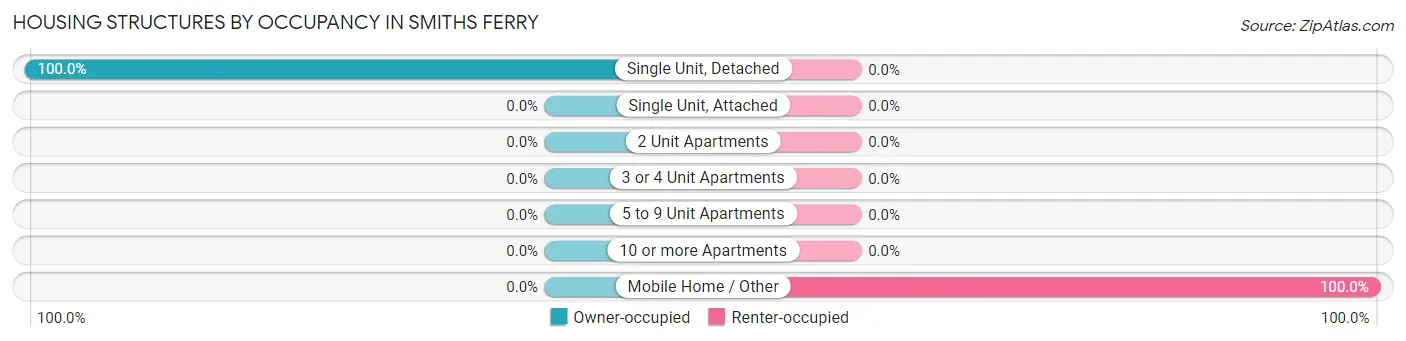
Housing Structures by Occupancy in Smiths Ferry
Structure Type
Owner-occupied
Renter-occupied
Single Unit, Detached
30 (100.0%)
0 (0.0%)
Single Unit, Attached
0 (0.0%)
0 (0.0%)
2 Unit Apartments
0 (0.0%)
0 (0.0%)
3 or 4 Unit Apartments
0 (0.0%)
0 (0.0%)
5 to 9 Unit Apartments
0 (0.0%)
0 (0.0%)
10 or more Apartments
0 (0.0%)
0 (0.0%)
Mobile Home / Other
0 (0.0%)
2 (100.0%)
Total
30 (93.8%)
2 (6.2%)
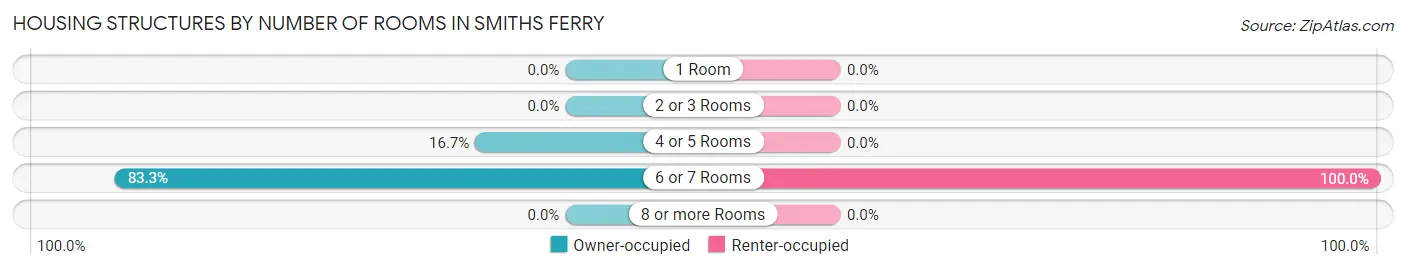
Housing Structures by Number of Rooms in Smiths Ferry
Number of Rooms
Owner-occupied
Renter-occupied
1 Room
0 (0.0%)
0 (0.0%)
2 or 3 Rooms
0 (0.0%)
0 (0.0%)
4 or 5 Rooms
5 (16.7%)
0 (0.0%)
6 or 7 Rooms
25 (83.3%)
2 (100.0%)
8 or more Rooms
0 (0.0%)
0 (0.0%)
Total
30 (100.0%)
2 (100.0%)
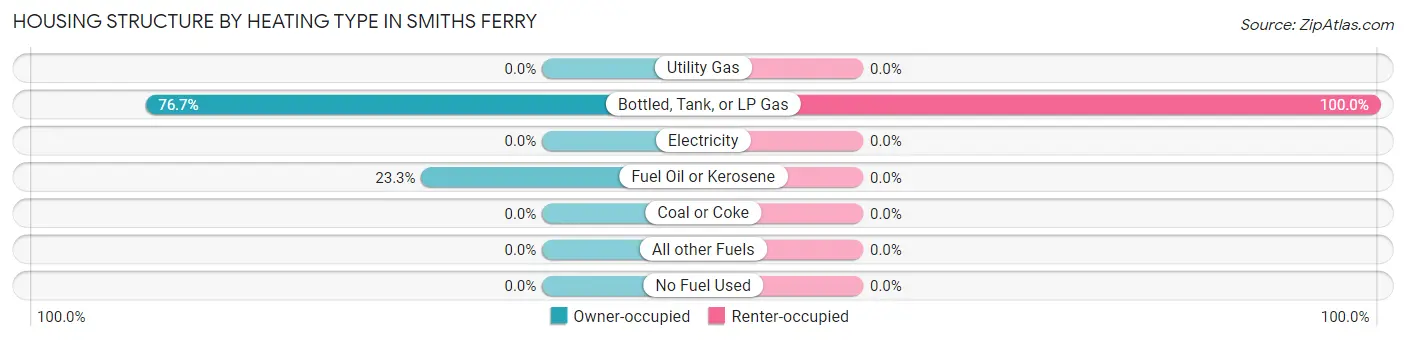
Housing Structure by Heating Type in Smiths Ferry
Heating Type
Owner-occupied
Renter-occupied
Utility Gas
0 (0.0%)
0 (0.0%)
Bottled, Tank, or LP Gas
23 (76.7%)
2 (100.0%)
Electricity
0 (0.0%)
0 (0.0%)
Fuel Oil or Kerosene
7 (23.3%)
0 (0.0%)
Coal or Coke
0 (0.0%)
0 (0.0%)
All other Fuels
0 (0.0%)
0 (0.0%)
No Fuel Used
0 (0.0%)
0 (0.0%)
Total
30 (100.0%)
2 (100.0%)
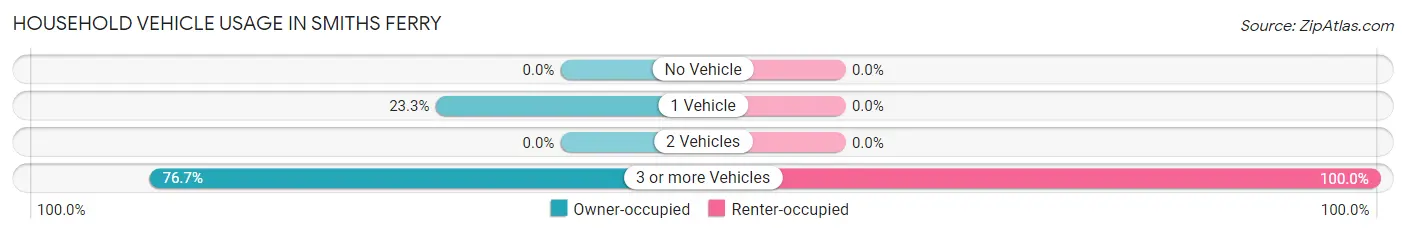
Household Vehicle Usage in Smiths Ferry
Vehicles per Household
Owner-occupied
Renter-occupied
No Vehicle
0 (0.0%)
0 (0.0%)
1 Vehicle
7 (23.3%)
0 (0.0%)
2 Vehicles
0 (0.0%)
0 (0.0%)
3 or more Vehicles
23 (76.7%)
2 (100.0%)
Total
30 (100.0%)
2 (100.0%)
Real Estate & Mortgages in Smiths Ferry
Real Estate and Mortgage Overview in Smiths Ferry
Characteristic
Without Mortgage
With Mortgage
Housing Units
7
23
Median Property Value
-
-
Median Household Income
-
-
Monthly Housing Costs
-
-
Real Estate Taxes
-
-
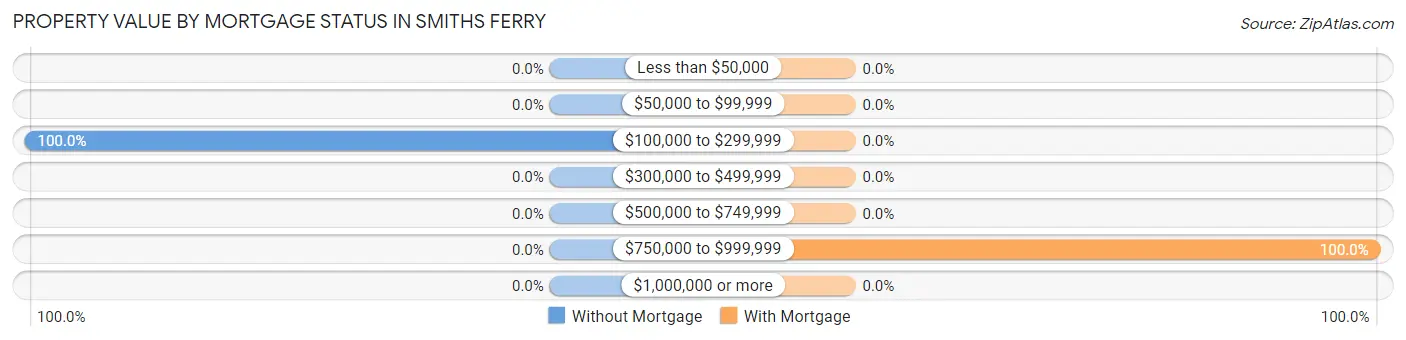
Property Value by Mortgage Status in Smiths Ferry
Property Value
Without Mortgage
With Mortgage
Less than $50,000
0 (0.0%)
0 (0.0%)
$50,000 to $99,999
0 (0.0%)
0 (0.0%)
$100,000 to $299,999
7 (100.0%)
0 (0.0%)
$300,000 to $499,999
0 (0.0%)
0 (0.0%)
$500,000 to $749,999
0 (0.0%)
0 (0.0%)
$750,000 to $999,999
0 (0.0%)
23 (100.0%)
$1,000,000 or more
0 (0.0%)
0 (0.0%)
Total
7 (100.0%)
23 (100.0%)
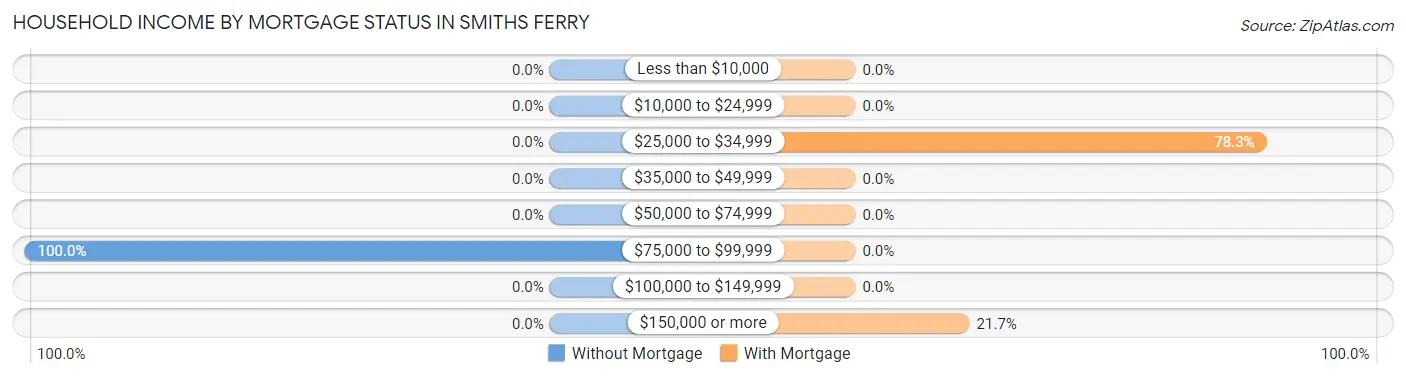
Household Income by Mortgage Status in Smiths Ferry
Household Income
Without Mortgage
With Mortgage
Less than $10,000
0 (0.0%)
0 (0.0%)
$10,000 to $24,999
0 (0.0%)
0 (0.0%)
$25,000 to $34,999
0 (0.0%)
18 (78.3%)
$35,000 to $49,999
0 (0.0%)
0 (0.0%)
$50,000 to $74,999
0 (0.0%)
0 (0.0%)
$75,000 to $99,999
7 (100.0%)
0 (0.0%)
$100,000 to $149,999
0 (0.0%)
0 (0.0%)
$150,000 or more
0 (0.0%)
5 (21.7%)
Total
7 (100.0%)
23 (100.0%)
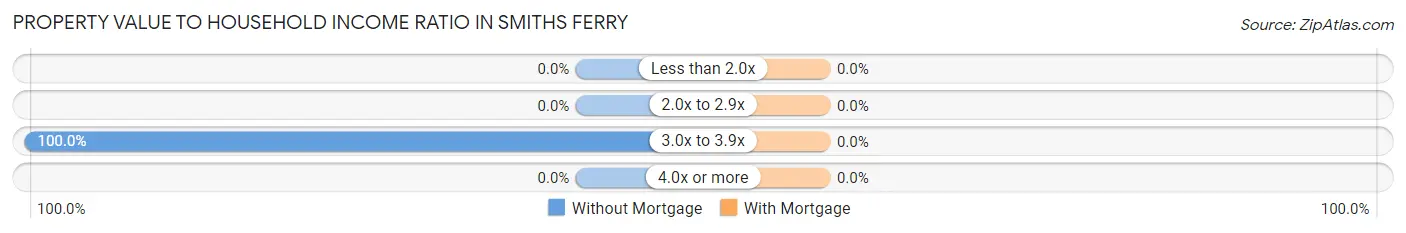
Property Value to Household Income Ratio in Smiths Ferry
Value-to-Income Ratio
Without Mortgage
With Mortgage
Less than 2.0x
0 (0.0%)
0 (0.0%)
2.0x to 2.9x
0 (0.0%)
0 (0.0%)
3.0x to 3.9x
7 (100.0%)
0 (0.0%)
4.0x or more
0 (0.0%)
0 (0.0%)
Total
7 (100.0%)
23 (100.0%)
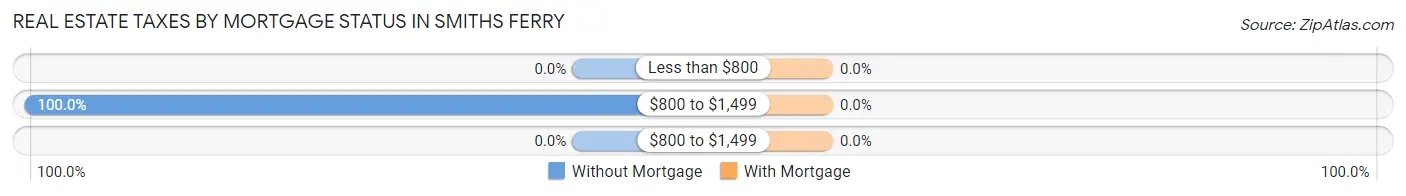
Real Estate Taxes by Mortgage Status in Smiths Ferry
Property Taxes
Without Mortgage
With Mortgage
Less than $800
0 (0.0%)
0 (0.0%)
$800 to $1,499
7 (100.0%)
0 (0.0%)
$800 to $1,499
0 (0.0%)
0 (0.0%)
Total
7 (100.0%)
23 (100.0%)
Health & Disability in Smiths Ferry
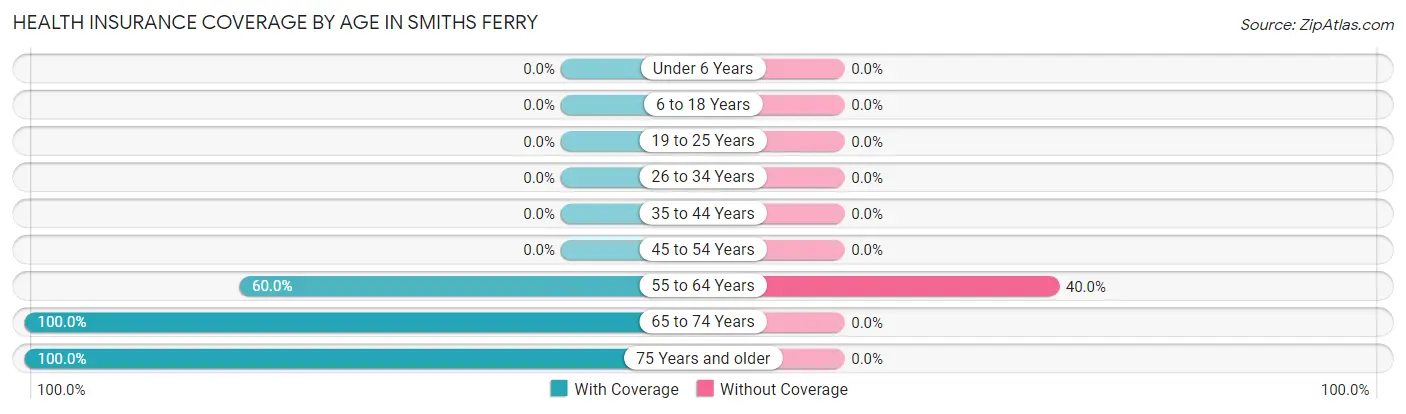
Health Insurance Coverage by Age in Smiths Ferry
Age Bracket
With Coverage
Without Coverage
Under 6 Years
0 (0.0%)
0 (0.0%)
6 to 18 Years
0 (0.0%)
0 (0.0%)
19 to 25 Years
0 (0.0%)
0 (0.0%)
26 to 34 Years
0 (0.0%)
0 (0.0%)
35 to 44 Years
0 (0.0%)
0 (0.0%)
45 to 54 Years
0 (0.0%)
0 (0.0%)
55 to 64 Years
3 (60.0%)
2 (40.0%)
65 to 74 Years
70 (100.0%)
0 (0.0%)
75 Years and older
7 (100.0%)
0 (0.0%)
Total
80 (97.6%)
2 (2.4%)
Health Insurance Coverage by Citizenship Status in Smiths Ferry
Citizenship Status
With Coverage
Without Coverage
Native Born
0 (0.0%)
0 (0.0%)
Foreign Born, Citizen
0 (0.0%)
0 (0.0%)
Foreign Born, not a Citizen
0 (0.0%)
0 (0.0%)
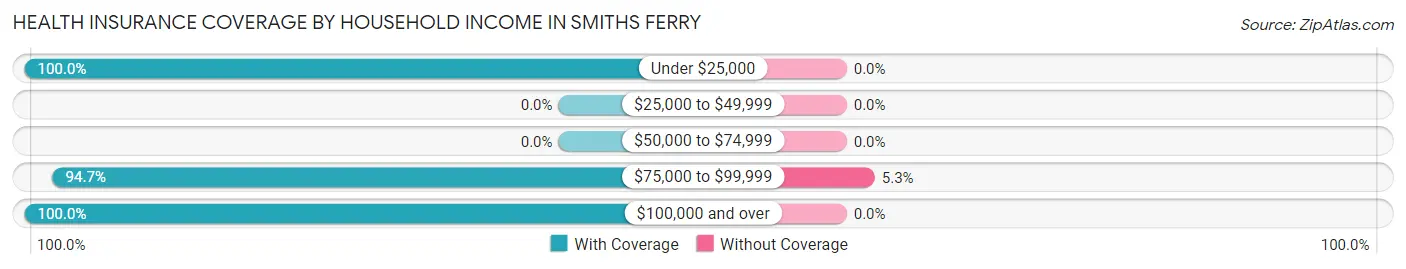
Health Insurance Coverage by Household Income in Smiths Ferry
Household Income
With Coverage
Without Coverage
Under $25,000
34 (100.0%)
0 (0.0%)
$25,000 to $49,999
0 (0.0%)
0 (0.0%)
$50,000 to $74,999
0 (0.0%)
0 (0.0%)
$75,000 to $99,999
36 (94.7%)
2 (5.3%)
$100,000 and over
10 (100.0%)
0 (0.0%)
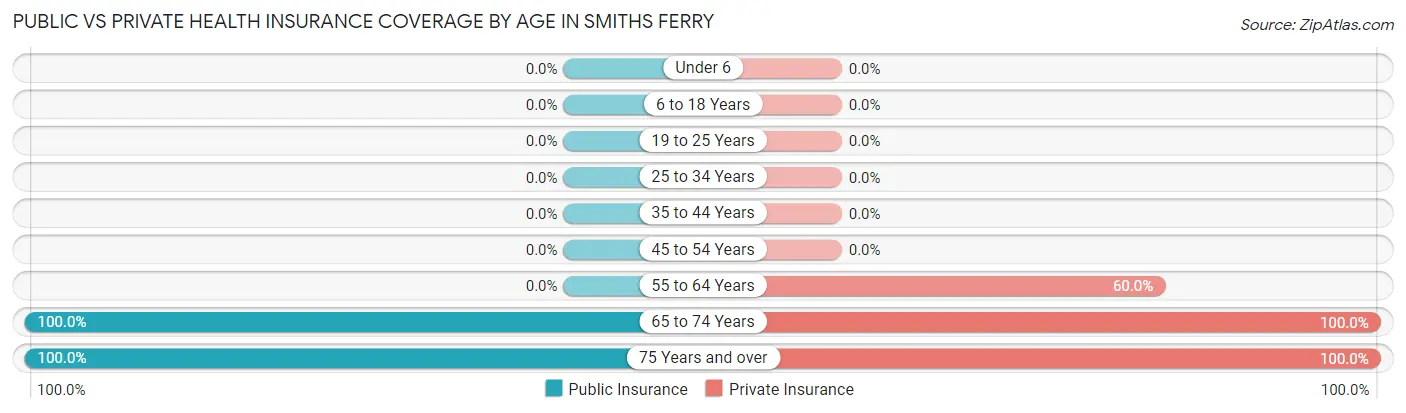
Public vs Private Health Insurance Coverage by Age in Smiths Ferry
Age Bracket
Public Insurance
Private Insurance
Under 6
0 (0.0%)
0 (0.0%)
6 to 18 Years
0 (0.0%)
0 (0.0%)
19 to 25 Years
0 (0.0%)
0 (0.0%)
25 to 34 Years
0 (0.0%)
0 (0.0%)
35 to 44 Years
0 (0.0%)
0 (0.0%)
45 to 54 Years
0 (0.0%)
0 (0.0%)
55 to 64 Years
0 (0.0%)
3 (60.0%)
65 to 74 Years
70 (100.0%)
70 (100.0%)
75 Years and over
7 (100.0%)
7 (100.0%)
Total
77 (93.9%)
80 (97.6%)
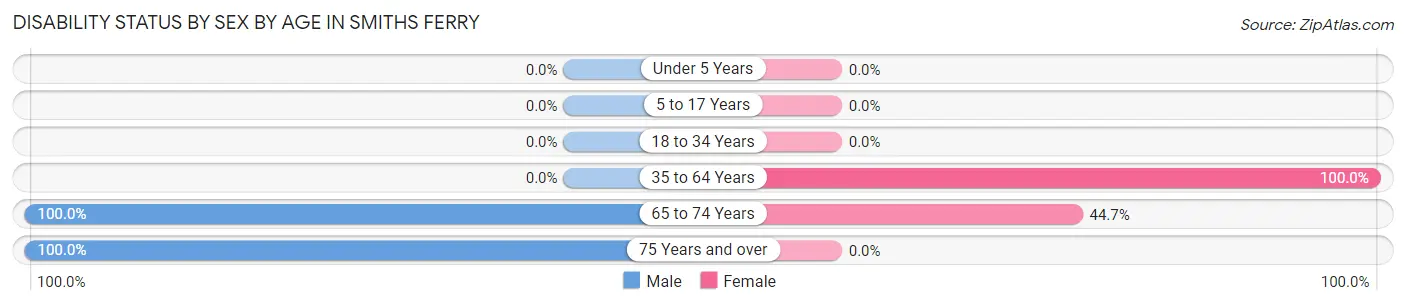
Disability Status by Sex by Age in Smiths Ferry
Age Bracket
Male
Female
Under 5 Years
0 (0.0%)
0 (0.0%)
5 to 17 Years
0 (0.0%)
0 (0.0%)
18 to 34 Years
0 (0.0%)
0 (0.0%)
35 to 64 Years
0 (0.0%)
3 (100.0%)
65 to 74 Years
23 (100.0%)
21 (44.7%)
75 Years and over
7 (100.0%)
0 (0.0%)
Disability Class by Sex by Age in Smiths Ferry
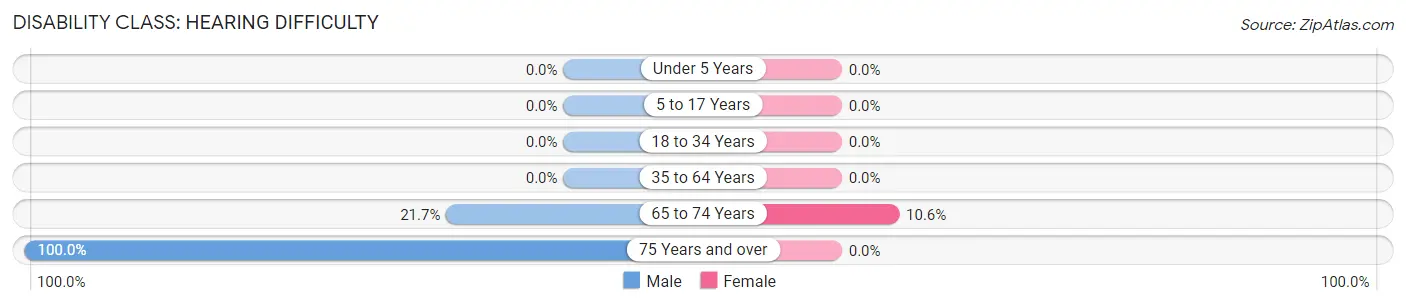
Disability Class: Hearing Difficulty
Age Bracket
Male
Female
Under 5 Years
0 (0.0%)
0 (0.0%)
5 to 17 Years
0 (0.0%)
0 (0.0%)
18 to 34 Years
0 (0.0%)
0 (0.0%)
35 to 64 Years
0 (0.0%)
0 (0.0%)
65 to 74 Years
5 (21.7%)
5 (10.6%)
75 Years and over
7 (100.0%)
0 (0.0%)
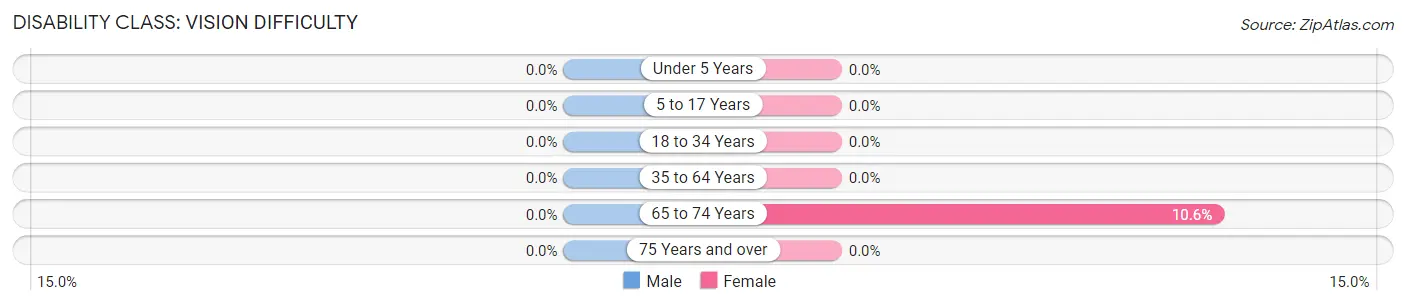
Disability Class: Vision Difficulty
Age Bracket
Male
Female
Under 5 Years
0 (0.0%)
0 (0.0%)
5 to 17 Years
0 (0.0%)
0 (0.0%)
18 to 34 Years
0 (0.0%)
0 (0.0%)
35 to 64 Years
0 (0.0%)
0 (0.0%)
65 to 74 Years
0 (0.0%)
5 (10.6%)
75 Years and over
0 (0.0%)
0 (0.0%)
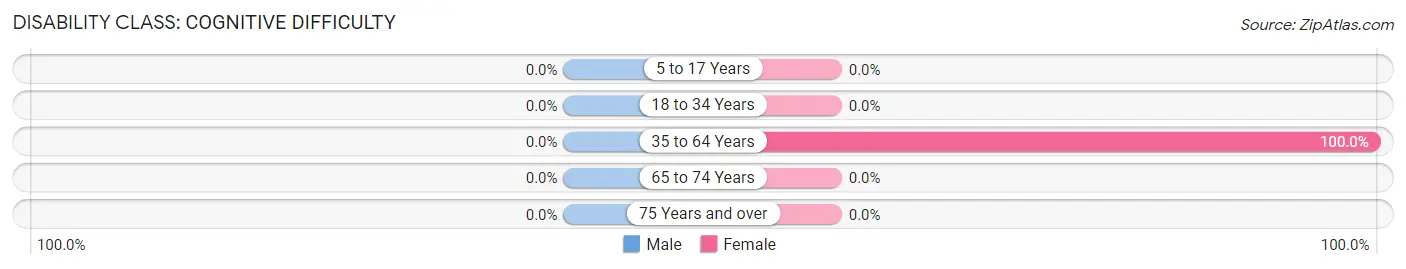
Disability Class: Cognitive Difficulty
Age Bracket
Male
Female
5 to 17 Years
0 (0.0%)
0 (0.0%)
18 to 34 Years
0 (0.0%)
0 (0.0%)
35 to 64 Years
0 (0.0%)
3 (100.0%)
65 to 74 Years
0 (0.0%)
0 (0.0%)
75 Years and over
0 (0.0%)
0 (0.0%)
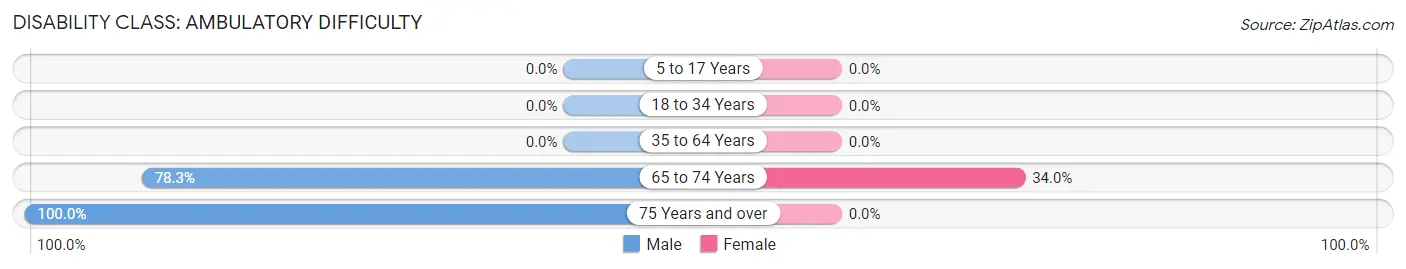
Disability Class: Ambulatory Difficulty
Age Bracket
Male
Female
5 to 17 Years
0 (0.0%)
0 (0.0%)
18 to 34 Years
0 (0.0%)
0 (0.0%)
35 to 64 Years
0 (0.0%)
0 (0.0%)
65 to 74 Years
18 (78.3%)
16 (34.0%)
75 Years and over
7 (100.0%)
0 (0.0%)
Disability Class: Self-Care Difficulty
Age Bracket
Male
Female
5 to 17 Years
0 (0.0%)
0 (0.0%)
18 to 34 Years
0 (0.0%)
0 (0.0%)
35 to 64 Years
0 (0.0%)
0 (0.0%)
65 to 74 Years
0 (0.0%)
0 (0.0%)
75 Years and over
0 (0.0%)
0 (0.0%)
Technology Access in Smiths Ferry
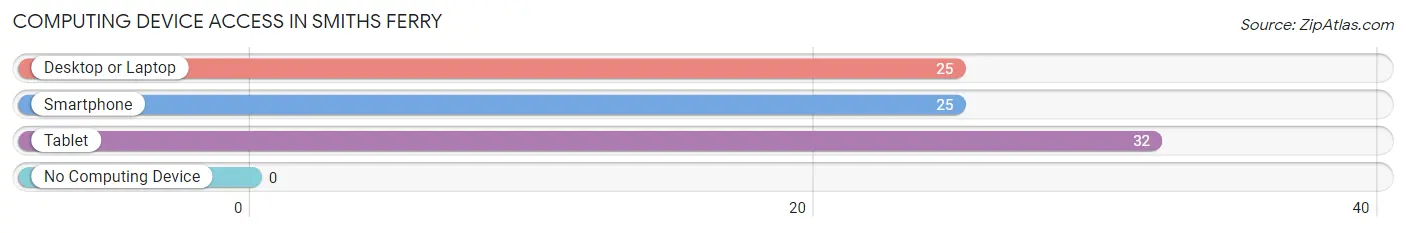
Computing Device Access in Smiths Ferry
Device Type
# Households
% Households
Desktop or Laptop
25
78.1%
Smartphone
25
78.1%
Tablet
32
100.0%
No Computing Device
0
0.0%
Total
32
100.0%
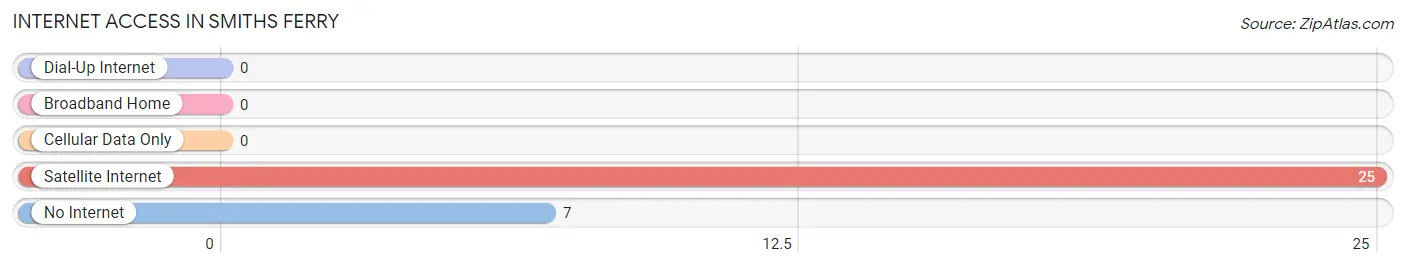
Internet Access in Smiths Ferry
Internet Type
# Households
% Households
Dial-Up Internet
0
0.0%
Broadband Home
0
0.0%
Cellular Data Only
0
0.0%
Satellite Internet
25
78.1%
No Internet
7
21.9%
Total
32
100.0%
Smiths Ferry Summary
Smiths Ferry, Idaho is a small unincorporated community located in the western part of the state, in the county of Shoshone. It is situated on the banks of the Snake River, near the Idaho-Oregon border. The population of Smiths Ferry is estimated to be around 200 people.
History
Smiths Ferry was first settled in the late 1800s by a group of settlers from the Midwest. The settlers were looking for a place to settle and start a new life. They chose Smiths Ferry because of its proximity to the Snake River and the abundance of natural resources in the area. The settlers built a ferry to cross the river and named it after the first settler, John Smith.
The town grew slowly but steadily over the years, and by the early 1900s, it had become a thriving community. The town was home to a variety of businesses, including a general store, a blacksmith shop, a hotel, and a saloon. The town also had a school, a post office, and a church.
Geography
Smiths Ferry is located in the western part of the state of Idaho, in the county of Shoshone. It is situated on the banks of the Snake River, near the Idaho-Oregon border. The town is surrounded by mountains and forests, and is located in a valley. The climate in Smiths Ferry is generally mild, with temperatures ranging from the low 30s in the winter to the high 80s in the summer.
Economy
The economy of Smiths Ferry is largely based on agriculture and tourism. The town is home to several farms, which produce a variety of crops, including potatoes, wheat, and hay. The town also has a few small businesses, including a general store, a restaurant, and a gas station.
Tourism is an important part of the economy of Smiths Ferry. The town is a popular destination for fishing, camping, and hiking. The nearby Snake River is a popular spot for rafting and kayaking. The town also has several historic sites, including the old Smiths Ferry Ferry, which is now a museum.
Demographics
The population of Smiths Ferry is estimated to be around 200 people. The town is predominantly white, with a small percentage of African Americans, Native Americans, and Hispanics. The median household income in Smiths Ferry is around $30,000, and the median age is around 40 years old. The town has a low unemployment rate, and most of the residents are employed in the agricultural and tourism industries.
Smiths Ferry is a small, rural community with a rich history and a strong sense of community. The town is a popular destination for tourists, and the local economy is largely based on agriculture and tourism. The town is home to a variety of businesses, and the residents are friendly and welcoming. Smiths Ferry is a great place to live and visit.
Common Questions
What is Per Capita Income in Smiths Ferry?
Per Capita income in Smiths Ferry is $27,123.
What is Inequality or Gini Index in Smiths Ferry?
Inequality or Gini Index in Smiths Ferry is 0.36.
What is the Total Population of Smiths Ferry?
Total Population of Smiths Ferry is 82.
What is the Total Male Population of Smiths Ferry?
Total Male Population of Smiths Ferry is 32.
What is the Total Female Population of Smiths Ferry?
Total Female Population of Smiths Ferry is 50.
What is the Ratio of Males per 100 Females in Smiths Ferry?
There are 64.00 Males per 100 Females in Smiths Ferry.
What is the Ratio of Females per 100 Males in Smiths Ferry?
There are 156.25 Females per 100 Males in Smiths Ferry.
What is the Median Population Age in Smiths Ferry?
Median Population Age in Smiths Ferry is 71.4 Years.
What is the Average Family Size in Smiths Ferry
Average Family Size in Smiths Ferry is 2.6 People.
What is the Average Household Size in Smiths Ferry
Average Household Size in Smiths Ferry is 2.6 People.
How Large is the Labor Force in Smiths Ferry?
There are 7 People in the Labor Forcein in Smiths Ferry.
What is the Percentage of People in the Labor Force in Smiths Ferry?
8.5% of People are in the Labor Force in Smiths Ferry.
Report Title
Report Link
HTML Copy & Paste Link
Social Media
Copy and paste the folowing code into any webpage where you would like this interactive chart to display