Bennington, ID Map & Demographics
Bennington Map
Bennington Overview
$37,023
PER CAPITA INCOME
$79,000
AVG FAMILY INCOME
$95,341
AVG HOUSEHOLD INCOME
0.22
INEQUALITY / GINI INDEX
142
TOTAL POPULATION
54
MALE POPULATION
88
FEMALE POPULATION
61.36
MALES / 100 FEMALES
162.96
FEMALES / 100 MALES
60.4
MEDIAN AGE
2.9
AVG FAMILY SIZE
2.5
AVG HOUSEHOLD SIZE
59
LABOR FORCE [ PEOPLE ]
46.5%
PERCENT IN LABOR FORCE
Bennington Area Codes
Income in Bennington
Income Overview in Bennington
Per Capita Income in Bennington is $37,023, while median incomes of families and households are $79,000 and $95,341 respectively.
| Characteristic | Number | Measure |
| Per Capita Income | 142 | $37,023 |
| Median Family Income | 46 | $79,000 |
| Mean Family Income | 46 | $79,830 |
| Median Household Income | 57 | $95,341 |
| Mean Household Income | 57 | $89,477 |
| Income Deficit | 46 | $0 |
| Wage / Income Gap (%) | 142 | 0.00% |
| Wage / Income Gap ($) | 142 | 100.00¢ per $1 |
| Gini / Inequality Index | 142 | 0.22 |
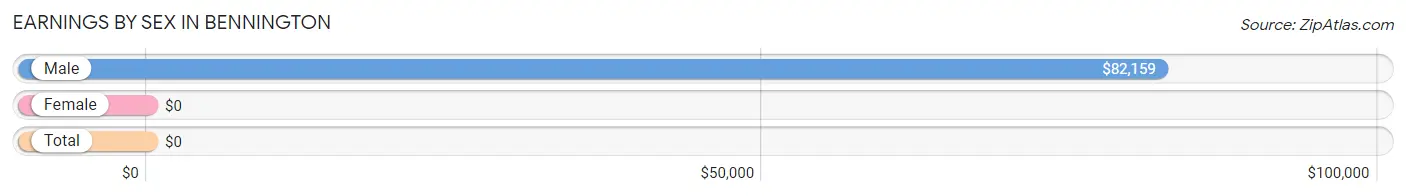
Earnings by Sex in Bennington
| Sex | Number | Average Earnings |
| Male | 39 (56.5%) | $82,159 |
| Female | 30 (43.5%) | $0 |
| Total | 69 (100.0%) | $0 |
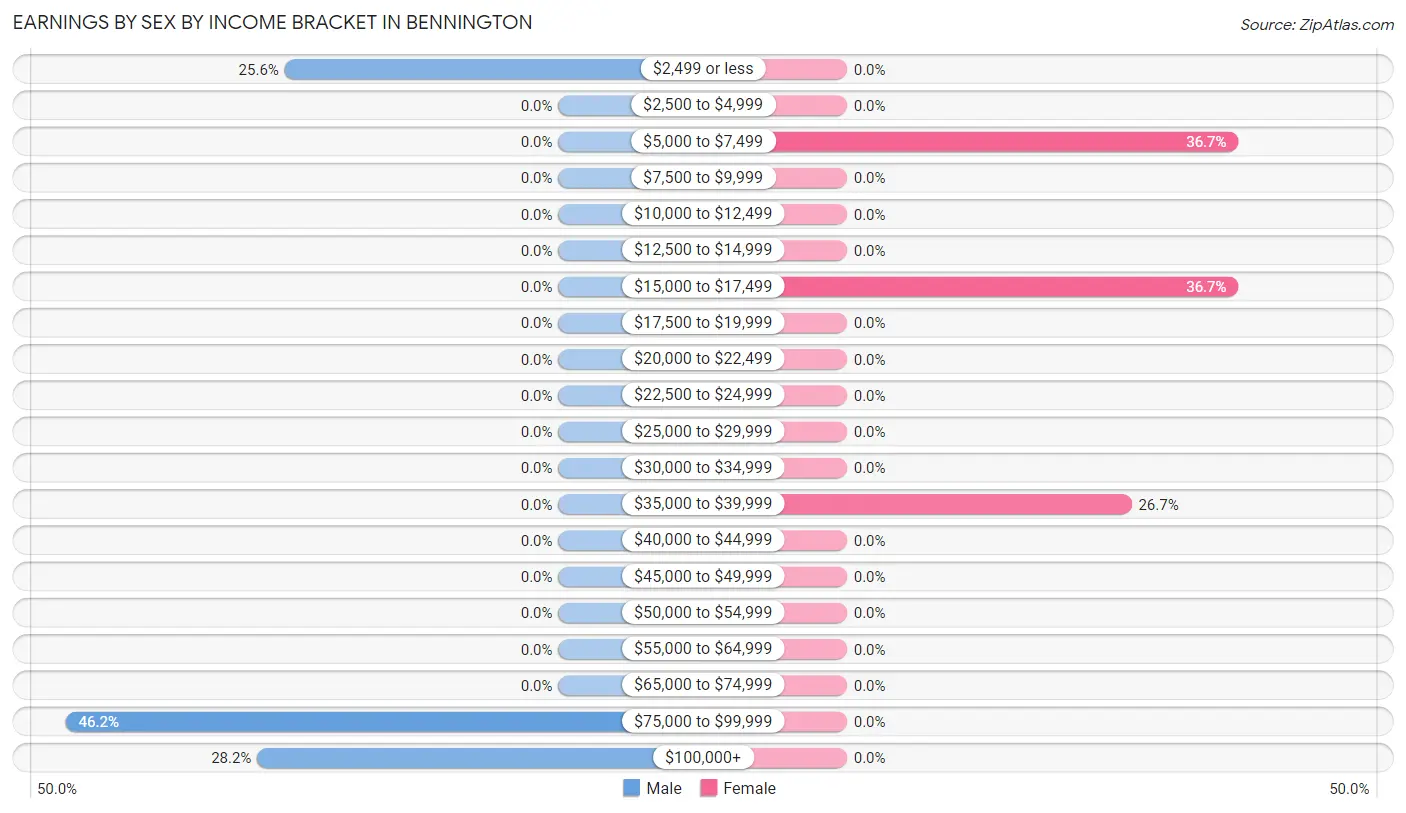
Earnings by Sex by Income Bracket in Bennington
The most common earnings brackets in Bennington are $75,000 to $99,999 for men (18 | 46.2%) and $5,000 to $7,499 for women (11 | 36.7%).
| Income | Male | Female |
| $2,499 or less | 10 (25.6%) | 0 (0.0%) |
| $2,500 to $4,999 | 0 (0.0%) | 0 (0.0%) |
| $5,000 to $7,499 | 0 (0.0%) | 11 (36.7%) |
| $7,500 to $9,999 | 0 (0.0%) | 0 (0.0%) |
| $10,000 to $12,499 | 0 (0.0%) | 0 (0.0%) |
| $12,500 to $14,999 | 0 (0.0%) | 0 (0.0%) |
| $15,000 to $17,499 | 0 (0.0%) | 11 (36.7%) |
| $17,500 to $19,999 | 0 (0.0%) | 0 (0.0%) |
| $20,000 to $22,499 | 0 (0.0%) | 0 (0.0%) |
| $22,500 to $24,999 | 0 (0.0%) | 0 (0.0%) |
| $25,000 to $29,999 | 0 (0.0%) | 0 (0.0%) |
| $30,000 to $34,999 | 0 (0.0%) | 0 (0.0%) |
| $35,000 to $39,999 | 0 (0.0%) | 8 (26.7%) |
| $40,000 to $44,999 | 0 (0.0%) | 0 (0.0%) |
| $45,000 to $49,999 | 0 (0.0%) | 0 (0.0%) |
| $50,000 to $54,999 | 0 (0.0%) | 0 (0.0%) |
| $55,000 to $64,999 | 0 (0.0%) | 0 (0.0%) |
| $65,000 to $74,999 | 0 (0.0%) | 0 (0.0%) |
| $75,000 to $99,999 | 18 (46.2%) | 0 (0.0%) |
| $100,000+ | 11 (28.2%) | 0 (0.0%) |
| Total | 39 (100.0%) | 30 (100.0%) |
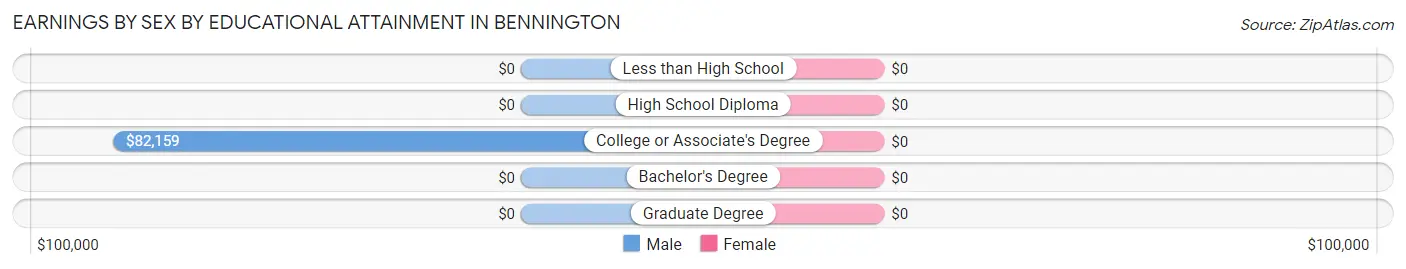
Earnings by Sex by Educational Attainment in Bennington
| Educational Attainment | Male Income | Female Income |
| Less than High School | - | - |
| High School Diploma | - | - |
| College or Associate's Degree | $82,159 | $0 |
| Bachelor's Degree | - | - |
| Graduate Degree | - | - |
| Total | $82,159 | $0 |
Family Income in Bennington
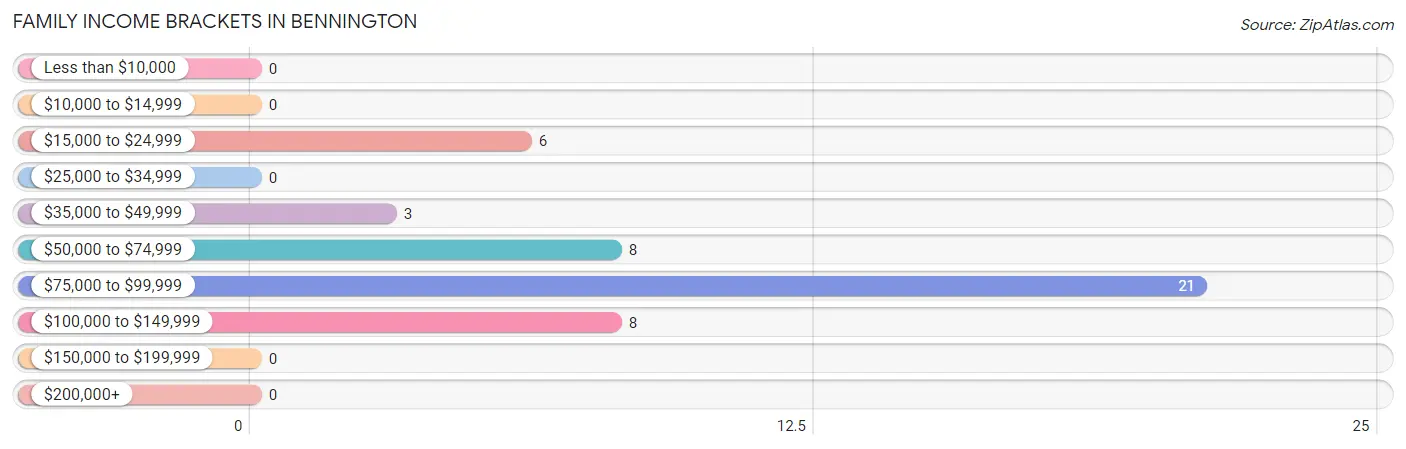
Family Income Brackets in Bennington
According to the Bennington family income data, there are 21 families falling into the $75,000 to $99,999 income range, which is the most common income bracket and makes up 45.7% of all families.
| Income Bracket | # Families | % Families |
| Less than $10,000 | 0 | 0.0% |
| $10,000 to $14,999 | 0 | 0.0% |
| $15,000 to $24,999 | 6 | 13.0% |
| $25,000 to $34,999 | 0 | 0.0% |
| $35,000 to $49,999 | 3 | 6.5% |
| $50,000 to $74,999 | 8 | 17.4% |
| $75,000 to $99,999 | 21 | 45.7% |
| $100,000 to $149,999 | 8 | 17.4% |
| $150,000 to $199,999 | 0 | 0.0% |
| $200,000+ | 0 | 0.0% |
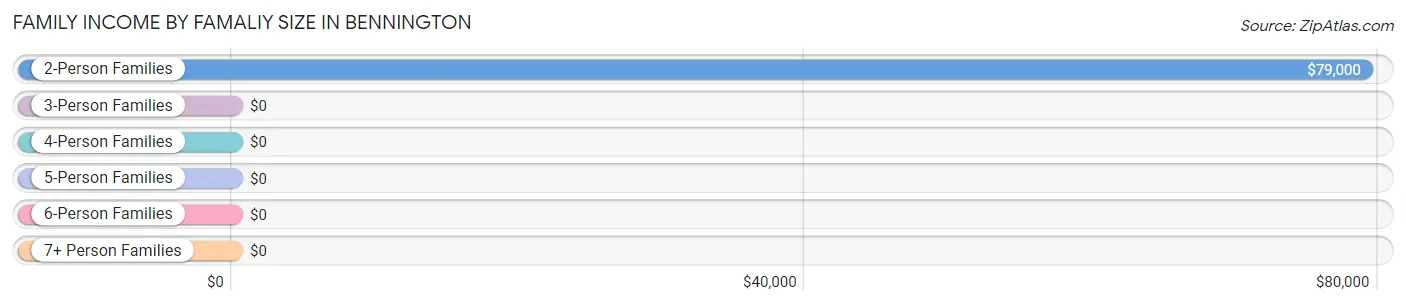
Family Income by Famaliy Size in Bennington
2-person families (30 | 65.2%) account for the highest median family income in Bennington with $79,000 per family, while 2-person families (30 | 65.2%) have the highest median income of $39,500 per family member.
| Income Bracket | # Families | Median Income |
| 2-Person Families | 30 (65.2%) | $79,000 |
| 3-Person Families | 8 (17.4%) | $0 |
| 4-Person Families | 8 (17.4%) | $0 |
| 5-Person Families | 0 (0.0%) | $0 |
| 6-Person Families | 0 (0.0%) | $0 |
| 7+ Person Families | 0 (0.0%) | $0 |
| Total | 46 (100.0%) | $79,000 |
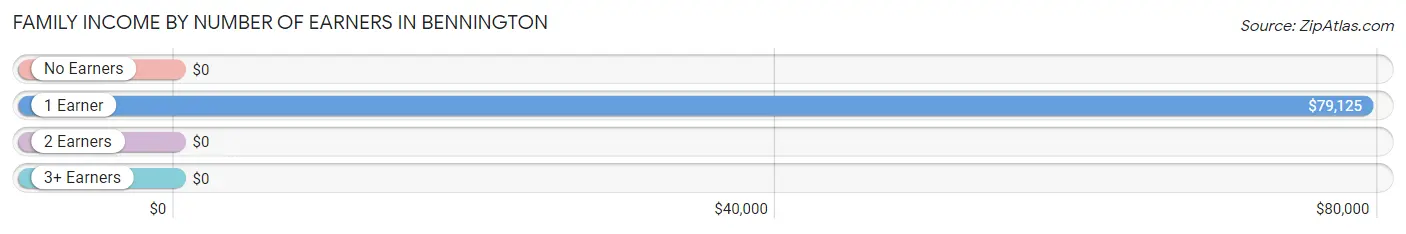
Family Income by Number of Earners in Bennington
| Number of Earners | # Families | Median Income |
| No Earners | 6 (13.0%) | $0 |
| 1 Earner | 29 (63.0%) | $79,125 |
| 2 Earners | 11 (23.9%) | $0 |
| 3+ Earners | 0 (0.0%) | $0 |
| Total | 46 (100.0%) | $79,000 |
Household Income in Bennington
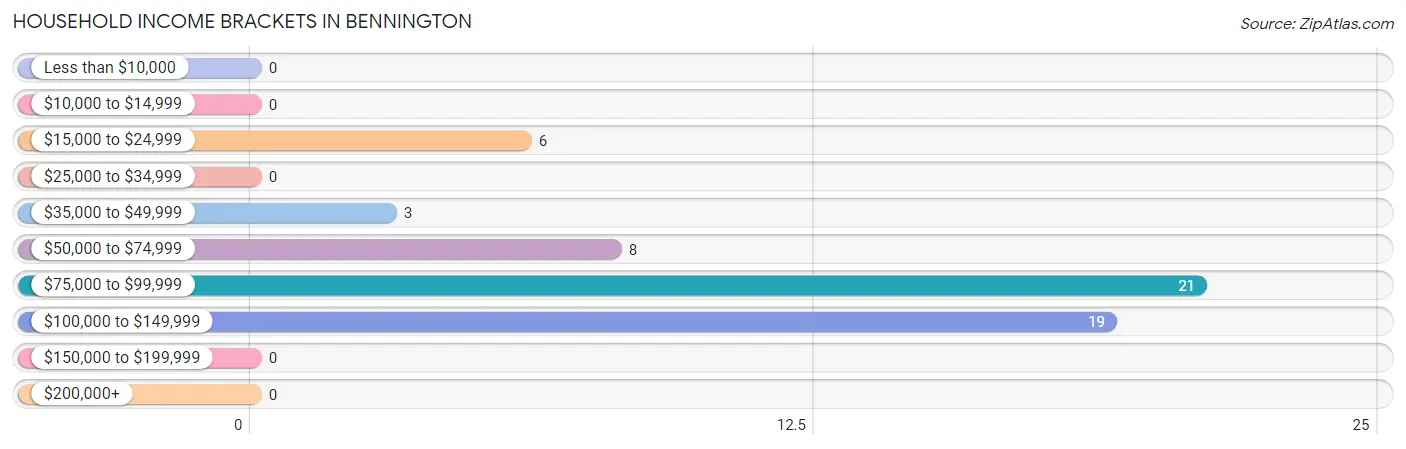
Household Income Brackets in Bennington
With 21 households falling in the category, the $75,000 to $99,999 income range is the most frequent in Bennington, accounting for 36.8% of all households.
| Income Bracket | # Households | % Households |
| Less than $10,000 | 0 | 0.0% |
| $10,000 to $14,999 | 0 | 0.0% |
| $15,000 to $24,999 | 6 | 10.5% |
| $25,000 to $34,999 | 0 | 0.0% |
| $35,000 to $49,999 | 3 | 5.3% |
| $50,000 to $74,999 | 8 | 14.0% |
| $75,000 to $99,999 | 21 | 36.8% |
| $100,000 to $149,999 | 19 | 33.3% |
| $150,000 to $199,999 | 0 | 0.0% |
| $200,000+ | 0 | 0.0% |
Household Income by Householder Age in Bennington
The median household income in Bennington is $95,341, with the highest median household income of $81,250 found in the 45 to 64 years age bracket for the primary householder. A total of 22 households (38.6%) fall into this category.
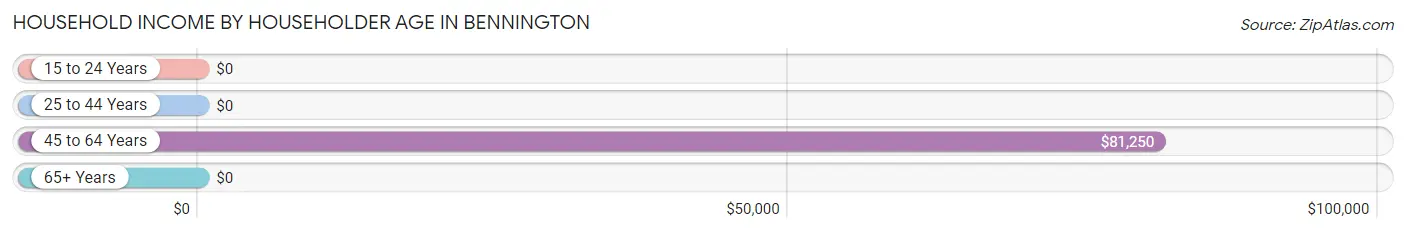
| Income Bracket | # Households | Median Income |
| 15 to 24 Years | 0 (0.0%) | $0 |
| 25 to 44 Years | 19 (33.3%) | $0 |
| 45 to 64 Years | 22 (38.6%) | $81,250 |
| 65+ Years | 16 (28.1%) | $0 |
| Total | 57 (100.0%) | $95,341 |
Poverty in Bennington
Income Below Poverty by Sex and Age in Bennington
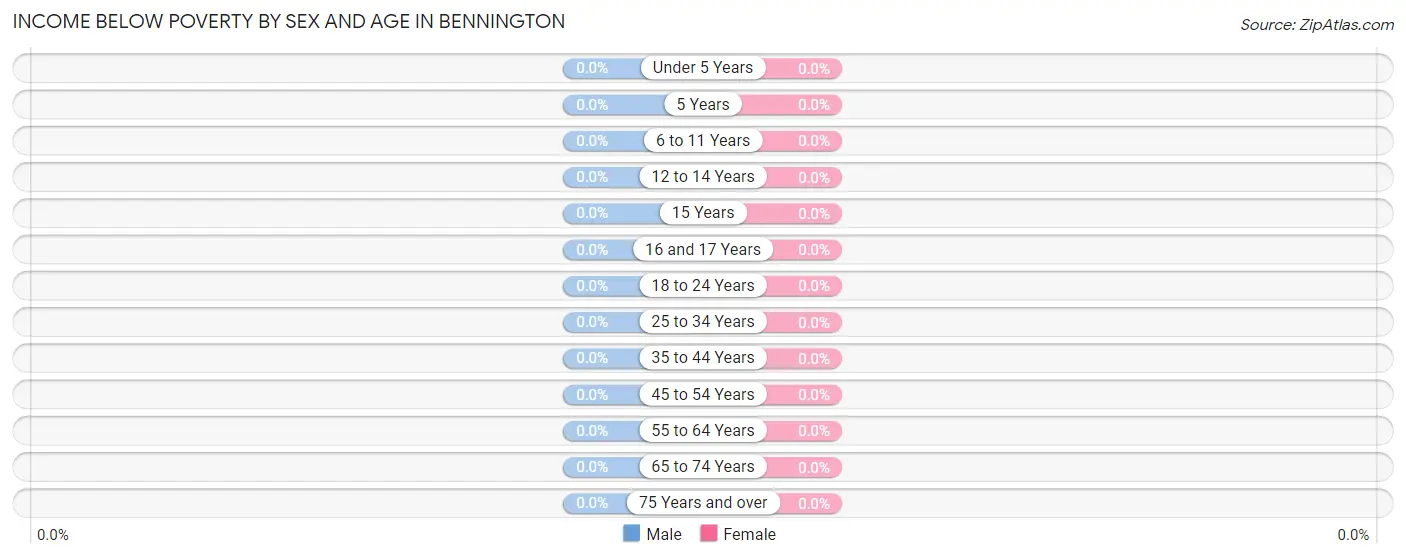
| Age Bracket | Male | Female |
| Under 5 Years | 0 (0.0%) | 0 (0.0%) |
| 5 Years | 0 (0.0%) | 0 (0.0%) |
| 6 to 11 Years | 0 (0.0%) | 0 (0.0%) |
| 12 to 14 Years | 0 (0.0%) | 0 (0.0%) |
| 15 Years | 0 (0.0%) | 0 (0.0%) |
| 16 and 17 Years | 0 (0.0%) | 0 (0.0%) |
| 18 to 24 Years | 0 (0.0%) | 0 (0.0%) |
| 25 to 34 Years | 0 (0.0%) | 0 (0.0%) |
| 35 to 44 Years | 0 (0.0%) | 0 (0.0%) |
| 45 to 54 Years | 0 (0.0%) | 0 (0.0%) |
| 55 to 64 Years | 0 (0.0%) | 0 (0.0%) |
| 65 to 74 Years | 0 (0.0%) | 0 (0.0%) |
| 75 Years and over | 0 (0.0%) | 0 (0.0%) |
| Total | 0 (0.0%) | 0 (0.0%) |
Income Above Poverty by Sex and Age in Bennington
According to the poverty statistics in Bennington, males aged under 5 years and females aged under 5 years are the age groups that are most secure financially, with 100.0% of males and 100.0% of females in these age groups living above the poverty line.
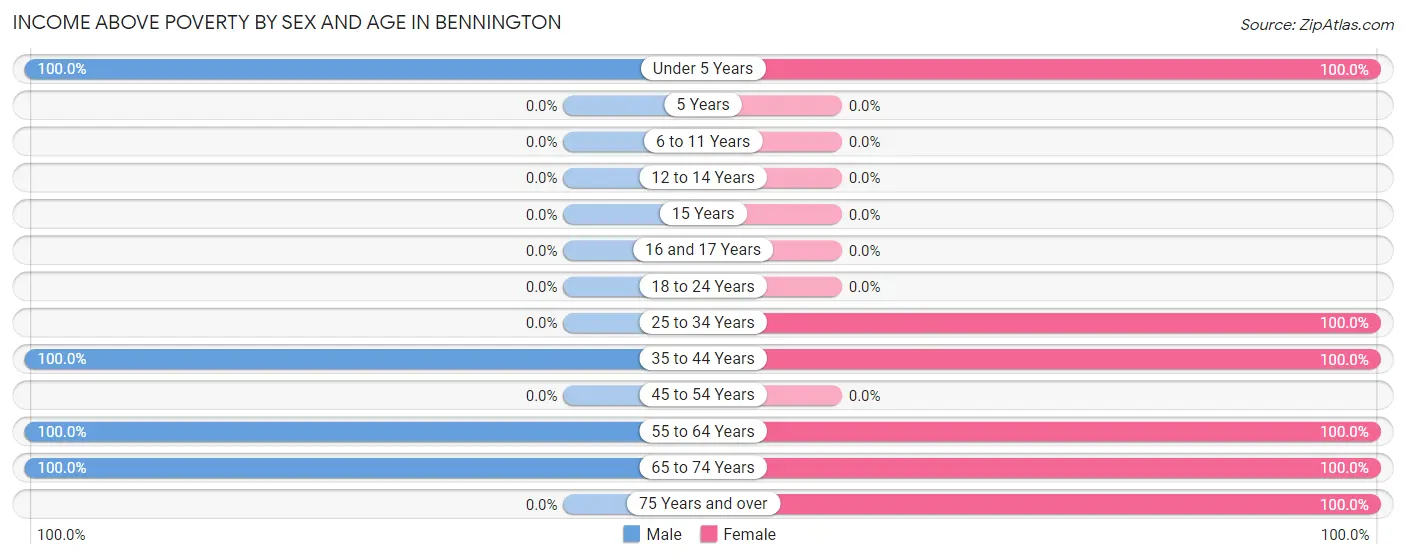
| Age Bracket | Male | Female |
| Under 5 Years | 9 (100.0%) | 6 (100.0%) |
| 5 Years | 0 (0.0%) | 0 (0.0%) |
| 6 to 11 Years | 0 (0.0%) | 0 (0.0%) |
| 12 to 14 Years | 0 (0.0%) | 0 (0.0%) |
| 15 Years | 0 (0.0%) | 0 (0.0%) |
| 16 and 17 Years | 0 (0.0%) | 0 (0.0%) |
| 18 to 24 Years | 0 (0.0%) | 0 (0.0%) |
| 25 to 34 Years | 0 (0.0%) | 23 (100.0%) |
| 35 to 44 Years | 18 (100.0%) | 11 (100.0%) |
| 45 to 54 Years | 0 (0.0%) | 0 (0.0%) |
| 55 to 64 Years | 11 (100.0%) | 20 (100.0%) |
| 65 to 74 Years | 16 (100.0%) | 16 (100.0%) |
| 75 Years and over | 0 (0.0%) | 12 (100.0%) |
| Total | 54 (100.0%) | 88 (100.0%) |
Income Below Poverty Among Married-Couple Families in Bennington
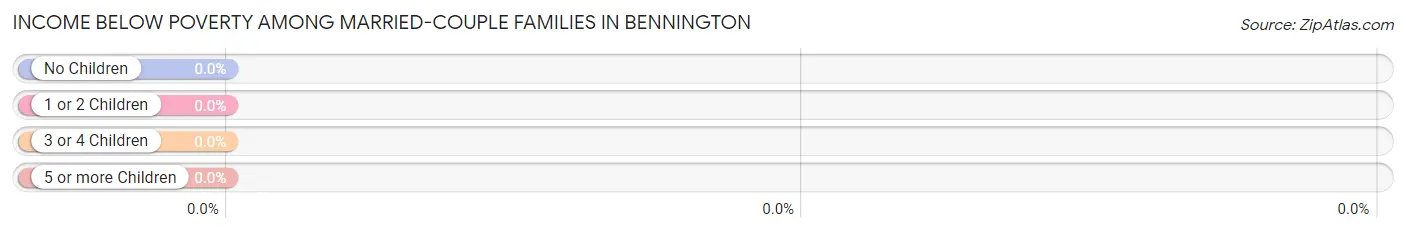
| Children | Above Poverty | Below Poverty |
| No Children | 27 (100.0%) | 0 (0.0%) |
| 1 or 2 Children | 8 (100.0%) | 0 (0.0%) |
| 3 or 4 Children | 0 (0.0%) | 0 (0.0%) |
| 5 or more Children | 0 (0.0%) | 0 (0.0%) |
| Total | 35 (100.0%) | 0 (0.0%) |
Income Below Poverty Among Single-Parent Households in Bennington
| Children | Single Father | Single Mother |
| No Children | 0 (0.0%) | 0 (0.0%) |
| 1 or 2 Children | 0 (0.0%) | 0 (0.0%) |
| 3 or 4 Children | 0 (0.0%) | 0 (0.0%) |
| 5 or more Children | 0 (0.0%) | 0 (0.0%) |
| Total | 0 (0.0%) | 0 (0.0%) |
Income Below Poverty Among Married-Couple vs Single-Parent Households in Bennington
| Children | Married-Couple Families | Single-Parent Households |
| No Children | 0 (0.0%) | 0 (0.0%) |
| 1 or 2 Children | 0 (0.0%) | 0 (0.0%) |
| 3 or 4 Children | 0 (0.0%) | 0 (0.0%) |
| 5 or more Children | 0 (0.0%) | 0 (0.0%) |
| Total | 0 (0.0%) | 0 (0.0%) |
Race in Bennington
The most populous races in Bennington are , and White / Caucasian (142 | 100.0%).
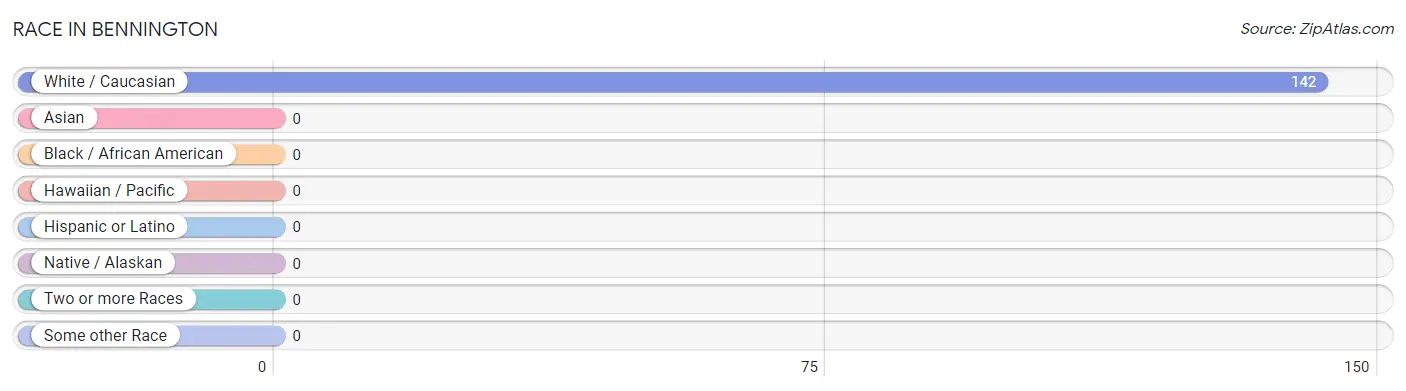
| Race | # Population | % Population |
| Asian | 0 | 0.0% |
| Black / African American | 0 | 0.0% |
| Hawaiian / Pacific | 0 | 0.0% |
| Hispanic or Latino | 0 | 0.0% |
| Native / Alaskan | 0 | 0.0% |
| White / Caucasian | 142 | 100.0% |
| Two or more Races | 0 | 0.0% |
| Some other Race | 0 | 0.0% |
| Total | 142 | 100.0% |
Ancestry in Bennington
The most populous ancestries reported in Bennington are English (93 | 65.5%), German (37 | 26.1%), and Swiss (11 | 7.7%), together accounting for 99.3% of all Bennington residents.
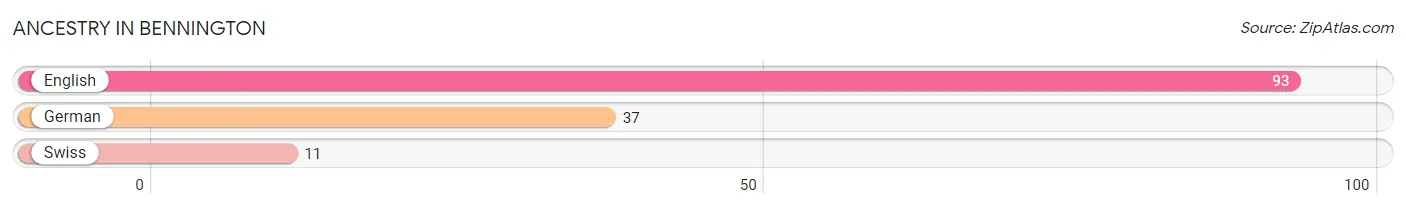
| Ancestry | # Population | % Population |
| English | 93 | 65.5% |
| German | 37 | 26.1% |
| Swiss | 11 | 7.7% | View All 3 Rows |
Immigrants in Bennington

| Immigration Origin | # Population | % Population | View All 0 Rows |
Sex and Age in Bennington
Sex and Age in Bennington
The most populous age groups in Bennington are 70 to 74 Years (16 | 29.6%) for men and 30 to 34 Years (23 | 26.1%) for women.
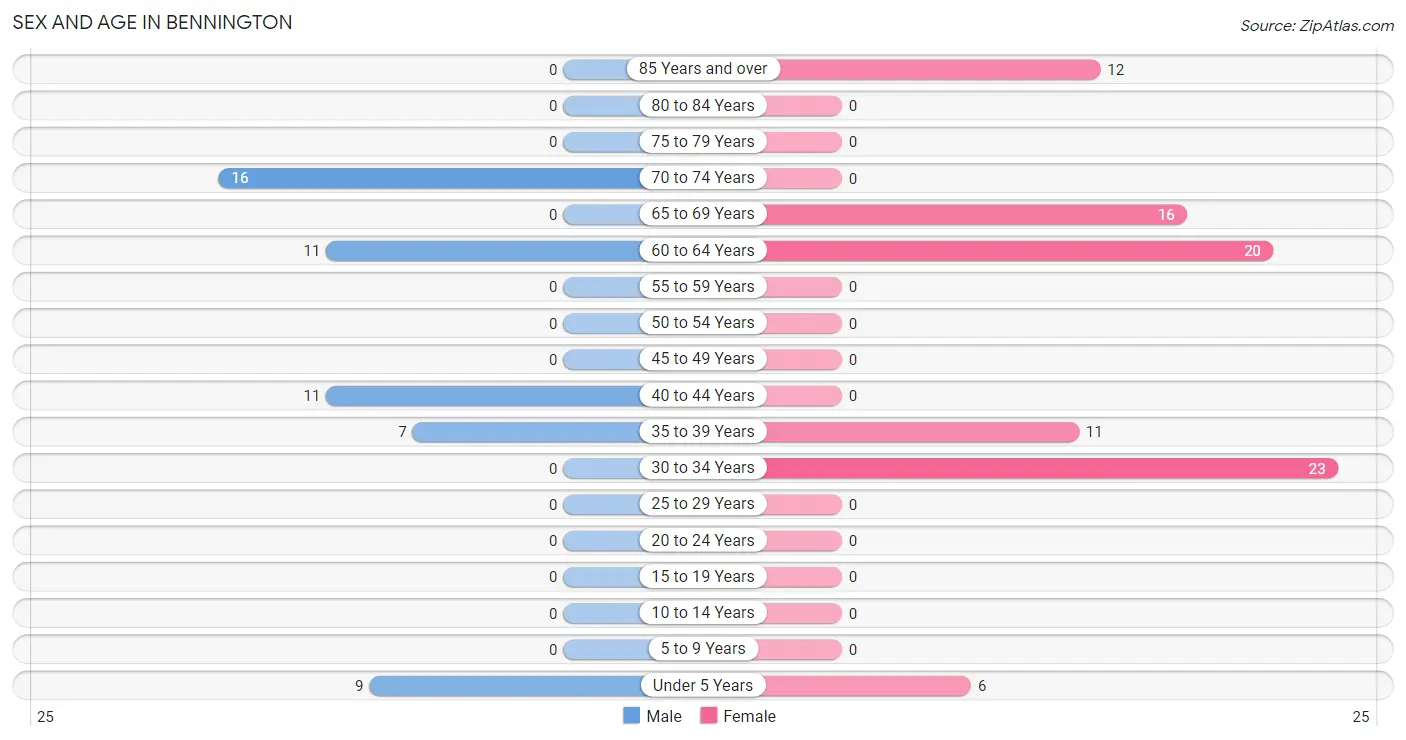
| Age Bracket | Male | Female |
| Under 5 Years | 9 (16.7%) | 6 (6.8%) |
| 5 to 9 Years | 0 (0.0%) | 0 (0.0%) |
| 10 to 14 Years | 0 (0.0%) | 0 (0.0%) |
| 15 to 19 Years | 0 (0.0%) | 0 (0.0%) |
| 20 to 24 Years | 0 (0.0%) | 0 (0.0%) |
| 25 to 29 Years | 0 (0.0%) | 0 (0.0%) |
| 30 to 34 Years | 0 (0.0%) | 23 (26.1%) |
| 35 to 39 Years | 7 (13.0%) | 11 (12.5%) |
| 40 to 44 Years | 11 (20.4%) | 0 (0.0%) |
| 45 to 49 Years | 0 (0.0%) | 0 (0.0%) |
| 50 to 54 Years | 0 (0.0%) | 0 (0.0%) |
| 55 to 59 Years | 0 (0.0%) | 0 (0.0%) |
| 60 to 64 Years | 11 (20.4%) | 20 (22.7%) |
| 65 to 69 Years | 0 (0.0%) | 16 (18.2%) |
| 70 to 74 Years | 16 (29.6%) | 0 (0.0%) |
| 75 to 79 Years | 0 (0.0%) | 0 (0.0%) |
| 80 to 84 Years | 0 (0.0%) | 0 (0.0%) |
| 85 Years and over | 0 (0.0%) | 12 (13.6%) |
| Total | 54 (100.0%) | 88 (100.0%) |
Families and Households in Bennington
Median Family Size in Bennington
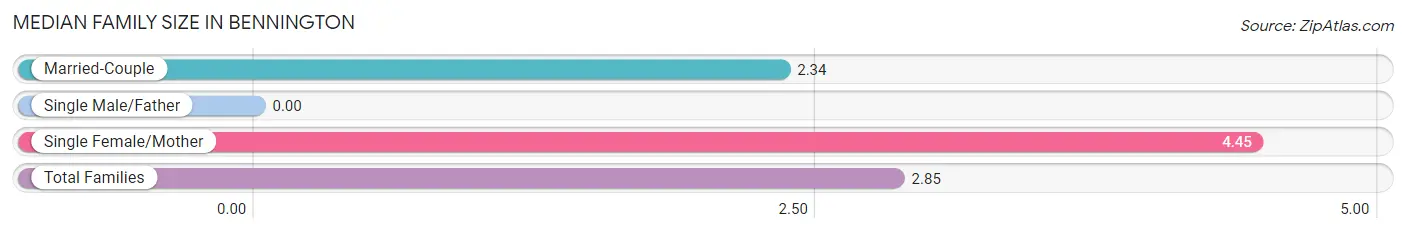
| Family Type | # Families | Family Size |
| Married-Couple | 35 (76.1%) | 2.34 |
| Single Male/Father | 0 (0.0%) | - |
| Single Female/Mother | 11 (23.9%) | 4.45 |
| Total Families | 46 (100.0%) | 2.85 |
Median Household Size in Bennington
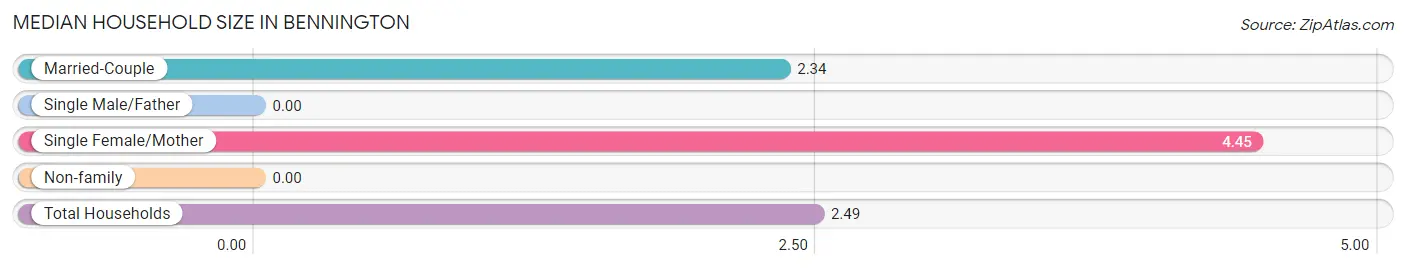
| Household Type | # Households | Household Size |
| Married-Couple | 35 (61.4%) | 2.34 |
| Single Male/Father | 0 (0.0%) | - |
| Single Female/Mother | 11 (19.3%) | 4.45 |
| Non-family | 11 (19.3%) | - |
| Total Households | 57 (100.0%) | 2.49 |
Household Size by Marriage Status in Bennington
Out of a total of 57 households in Bennington, 46 (80.7%) are family households, while 11 (19.3%) are nonfamily households. The most numerous type of family households are 2-person households, comprising 30, and the most common type of nonfamily households are 1-person households, comprising 11.
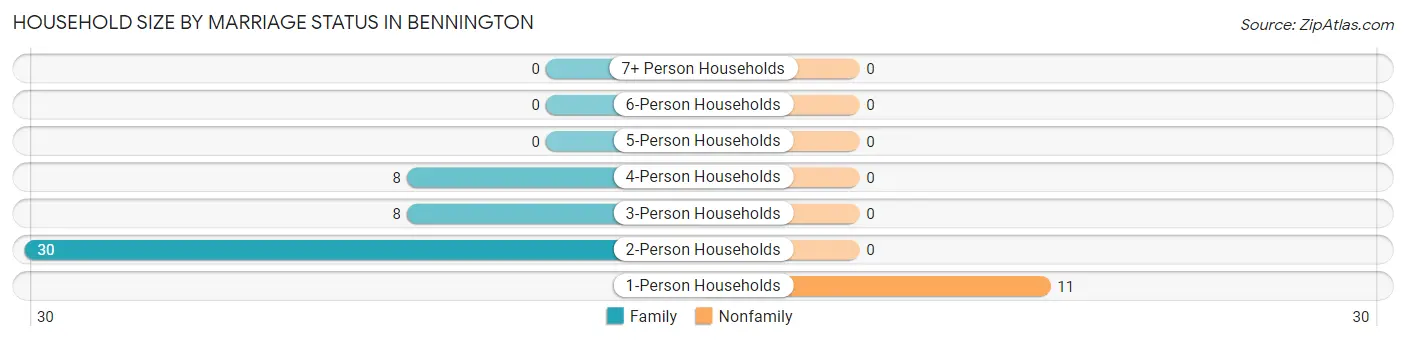
| Household Size | Family Households | Nonfamily Households |
| 1-Person Households | - | 11 (19.3%) |
| 2-Person Households | 30 (52.6%) | 0 (0.0%) |
| 3-Person Households | 8 (14.0%) | 0 (0.0%) |
| 4-Person Households | 8 (14.0%) | 0 (0.0%) |
| 5-Person Households | 0 (0.0%) | 0 (0.0%) |
| 6-Person Households | 0 (0.0%) | 0 (0.0%) |
| 7+ Person Households | 0 (0.0%) | 0 (0.0%) |
| Total | 46 (80.7%) | 11 (19.3%) |
Female Fertility in Bennington
Fertility by Age in Bennington
| Age Bracket | Women with Births | Births / 1,000 Women |
| 15 to 19 years | 0 (0.0%) | 0.0 |
| 20 to 34 years | 0 (0.0%) | 0.0 |
| 35 to 50 years | 0 (0.0%) | 0.0 |
| Total | 0 (0.0%) | 0.0 |
Fertility by Age by Marriage Status in Bennington
| Age Bracket | Married | Unmarried |
| 15 to 19 years | 0 (0.0%) | 0 (0.0%) |
| 20 to 34 years | 0 (0.0%) | 0 (0.0%) |
| 35 to 50 years | 0 (0.0%) | 0 (0.0%) |
| Total | 0 (0.0%) | 0 (0.0%) |
Fertility by Education in Bennington
| Educational Attainment | Women with Births | Births / 1,000 Women |
| Less than High School | 0 (0.0%) | 0.0 |
| High School Diploma | 0 (0.0%) | 0.0 |
| College or Associate's Degree | 0 (0.0%) | 0.0 |
| Bachelor's Degree | 0 (0.0%) | 0.0 |
| Graduate Degree | 0 (0.0%) | 0.0 |
| Total | 0 (0.0%) | 0.0 |
Fertility by Education by Marriage Status in Bennington
| Educational Attainment | Married | Unmarried |
| Less than High School | 0 (0.0%) | 0 (0.0%) |
| High School Diploma | 0 (0.0%) | 0 (0.0%) |
| College or Associate's Degree | 0 (0.0%) | 0 (0.0%) |
| Bachelor's Degree | 0 (0.0%) | 0 (0.0%) |
| Graduate Degree | 0 (0.0%) | 0 (0.0%) |
| Total | 0 (0.0%) | 0 (0.0%) |
Employment Characteristics in Bennington
Employment by Class of Employer in Bennington
Among the 48 employed individuals in Bennington, private company employees (37 | 77.1%), not-for-profit organizations (8 | 16.7%), and local government employees (3 | 6.2%) make up the most common classes of employment.
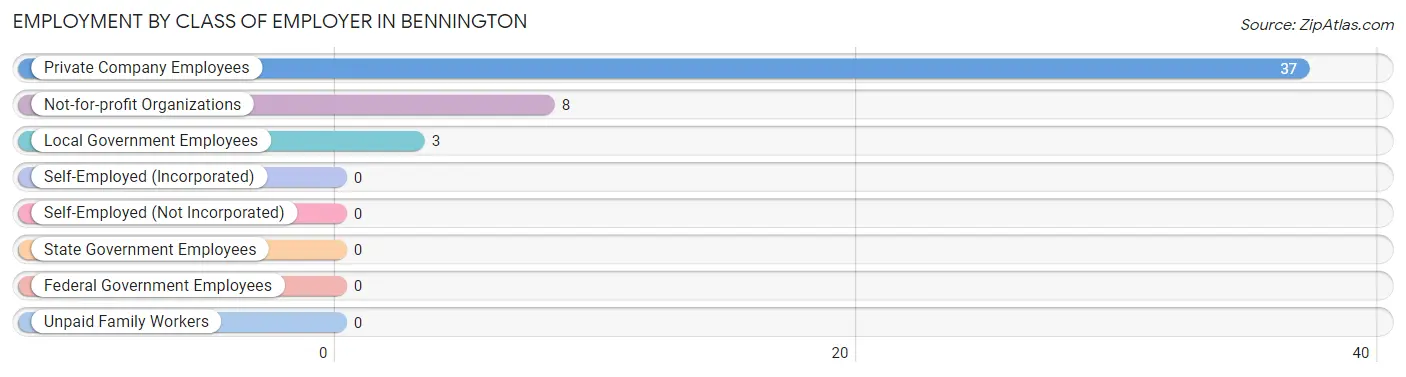
| Employer Class | # Employees | % Employees |
| Private Company Employees | 37 | 77.1% |
| Self-Employed (Incorporated) | 0 | 0.0% |
| Self-Employed (Not Incorporated) | 0 | 0.0% |
| Not-for-profit Organizations | 8 | 16.7% |
| Local Government Employees | 3 | 6.2% |
| State Government Employees | 0 | 0.0% |
| Federal Government Employees | 0 | 0.0% |
| Unpaid Family Workers | 0 | 0.0% |
| Total | 48 | 100.0% |
Employment Status by Age in Bennington
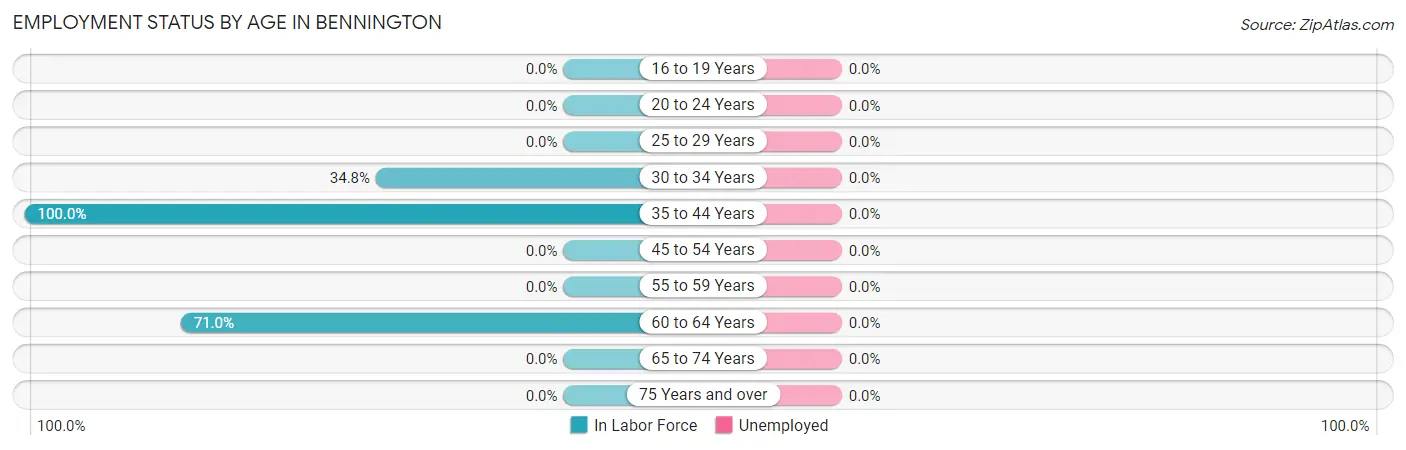
| Age Bracket | In Labor Force | Unemployed |
| 16 to 19 Years | 0 (0.0%) | 0 (0.0%) |
| 20 to 24 Years | 0 (0.0%) | 0 (0.0%) |
| 25 to 29 Years | 0 (0.0%) | 0 (0.0%) |
| 30 to 34 Years | 8 (34.8%) | 0 (0.0%) |
| 35 to 44 Years | 29 (100.0%) | 0 (0.0%) |
| 45 to 54 Years | 0 (0.0%) | 0 (0.0%) |
| 55 to 59 Years | 0 (0.0%) | 0 (0.0%) |
| 60 to 64 Years | 22 (71.0%) | 0 (0.0%) |
| 65 to 74 Years | 0 (0.0%) | 0 (0.0%) |
| 75 Years and over | 0 (0.0%) | 0 (0.0%) |
| Total | 59 (46.5%) | 0 (0.0%) |
Employment Status by Educational Attainment in Bennington
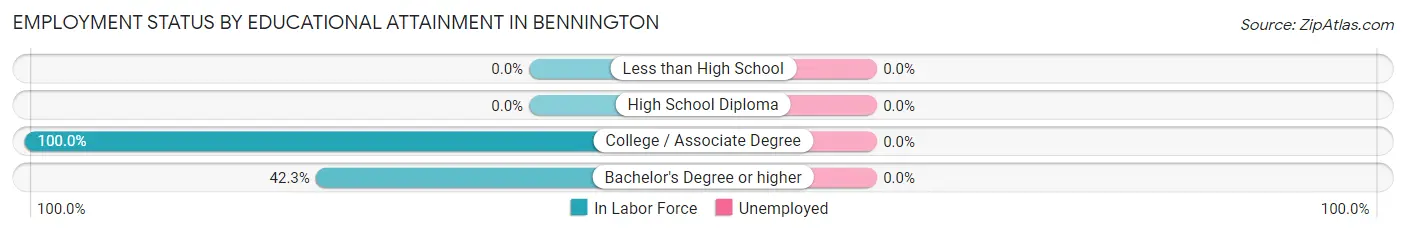
| Educational Attainment | In Labor Force | Unemployed |
| Less than High School | 0 (0.0%) | 0 (0.0%) |
| High School Diploma | 0 (0.0%) | 0 (0.0%) |
| College / Associate Degree | 48 (100.0%) | 0 (0.0%) |
| Bachelor's Degree or higher | 11 (42.3%) | 0 (0.0%) |
| Total | 59 (71.1%) | 0 (0.0%) |
Employment Occupations by Sex in Bennington
Management, Business, Science and Arts Occupations
The most common Management, Business, Science and Arts occupations in Bennington are Community & Social Service (11 | 18.6%), and Education Instruction & Library (11 | 18.6%).
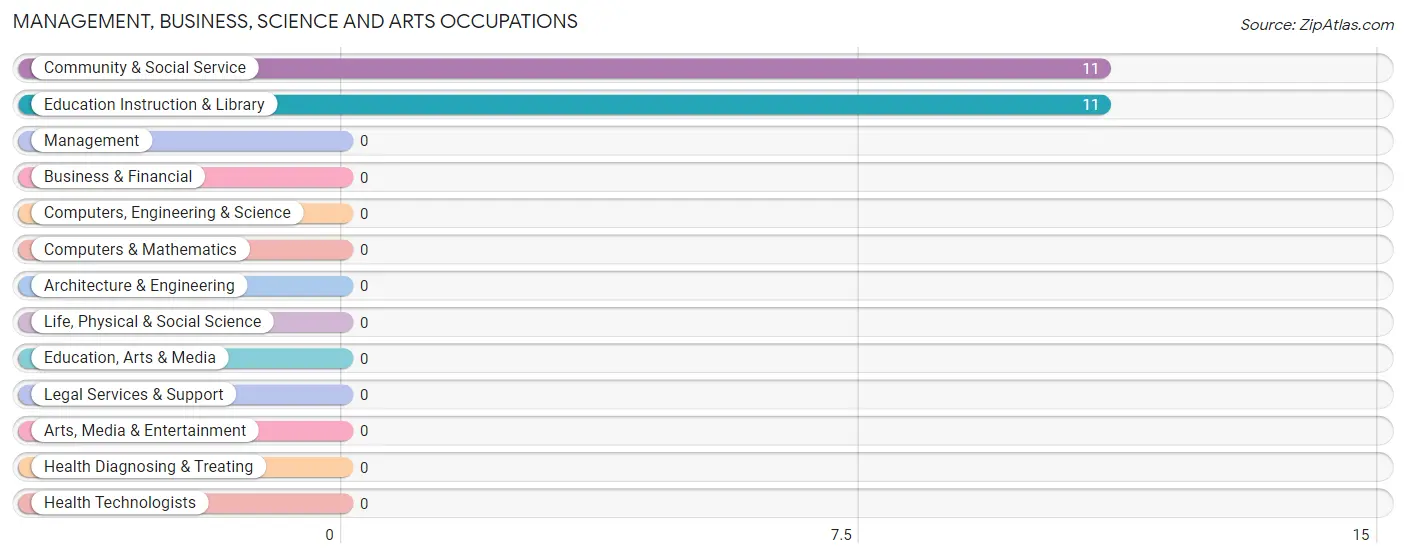
Management, Business, Science and Arts Occupations by Sex
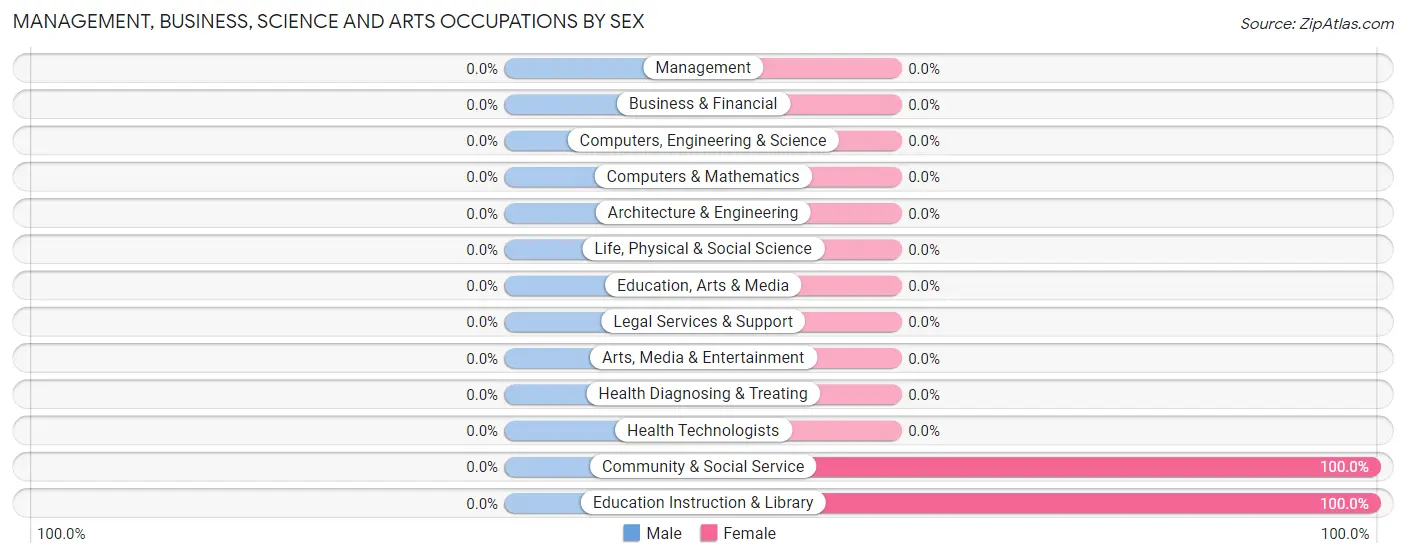
| Occupation | Male | Female |
| Management | 0 (0.0%) | 0 (0.0%) |
| Business & Financial | 0 (0.0%) | 0 (0.0%) |
| Computers, Engineering & Science | 0 (0.0%) | 0 (0.0%) |
| Computers & Mathematics | 0 (0.0%) | 0 (0.0%) |
| Architecture & Engineering | 0 (0.0%) | 0 (0.0%) |
| Life, Physical & Social Science | 0 (0.0%) | 0 (0.0%) |
| Community & Social Service | 0 (0.0%) | 11 (100.0%) |
| Education, Arts & Media | 0 (0.0%) | 0 (0.0%) |
| Legal Services & Support | 0 (0.0%) | 0 (0.0%) |
| Education Instruction & Library | 0 (0.0%) | 11 (100.0%) |
| Arts, Media & Entertainment | 0 (0.0%) | 0 (0.0%) |
| Health Diagnosing & Treating | 0 (0.0%) | 0 (0.0%) |
| Health Technologists | 0 (0.0%) | 0 (0.0%) |
| Total (Category) | 0 (0.0%) | 11 (100.0%) |
| Total (Overall) | 29 (49.1%) | 30 (50.8%) |
Services Occupations
The most common Services occupations in Bennington are Healthcare Support (8 | 13.6%), and Cleaning & Maintenance (3 | 5.1%).
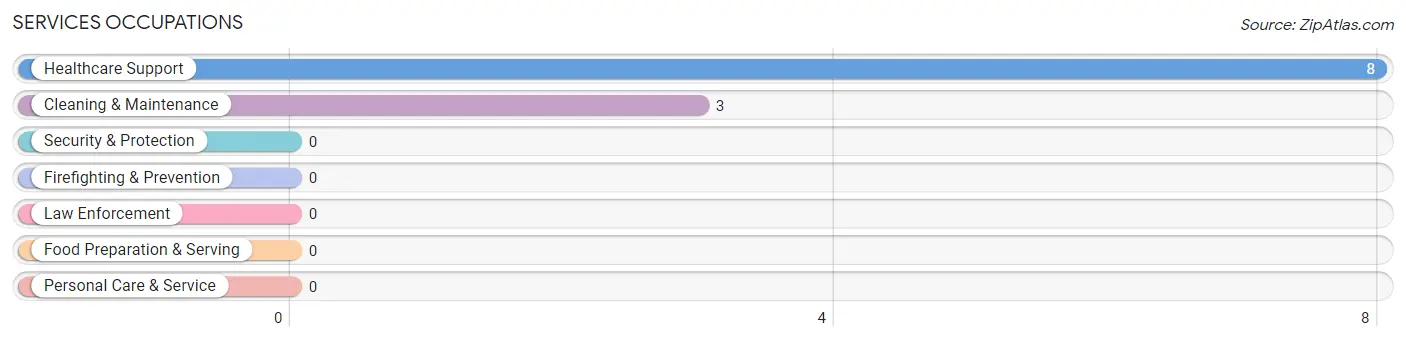
Services Occupations by Sex
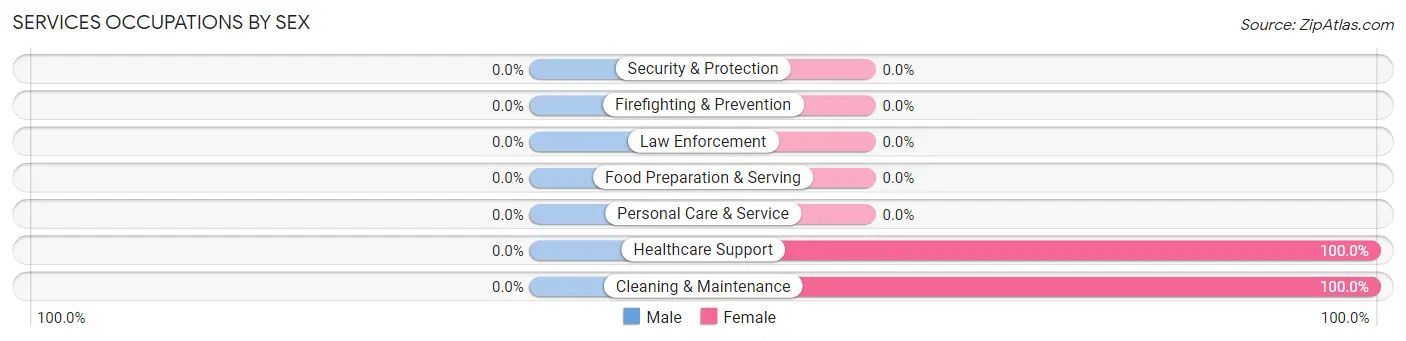
| Occupation | Male | Female |
| Healthcare Support | 0 (0.0%) | 8 (100.0%) |
| Security & Protection | 0 (0.0%) | 0 (0.0%) |
| Firefighting & Prevention | 0 (0.0%) | 0 (0.0%) |
| Law Enforcement | 0 (0.0%) | 0 (0.0%) |
| Food Preparation & Serving | 0 (0.0%) | 0 (0.0%) |
| Cleaning & Maintenance | 0 (0.0%) | 3 (100.0%) |
| Personal Care & Service | 0 (0.0%) | 0 (0.0%) |
| Total (Category) | 0 (0.0%) | 11 (100.0%) |
| Total (Overall) | 29 (49.1%) | 30 (50.8%) |
Sales and Office Occupations
The most common Sales and Office occupations in Bennington are , and Office & Administration (8 | 13.6%).
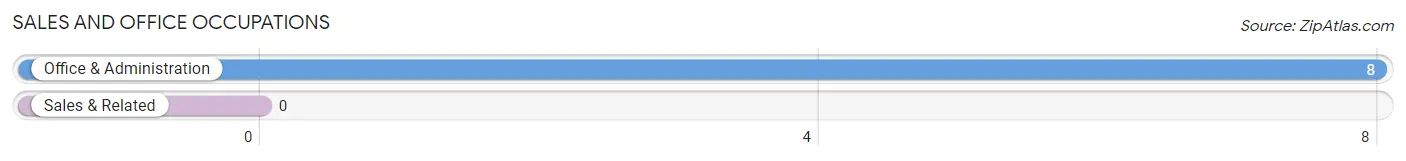
Sales and Office Occupations by Sex
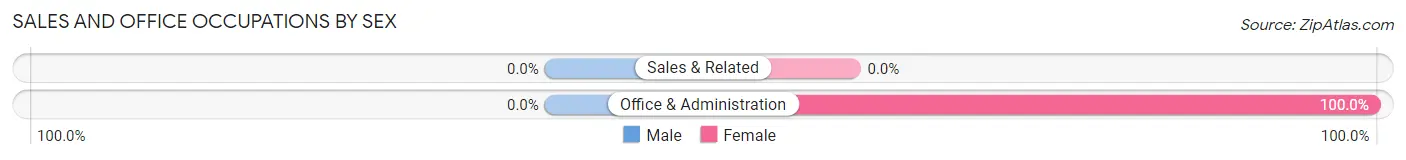
| Occupation | Male | Female |
| Sales & Related | 0 (0.0%) | 0 (0.0%) |
| Office & Administration | 0 (0.0%) | 8 (100.0%) |
| Total (Category) | 0 (0.0%) | 8 (100.0%) |
| Total (Overall) | 29 (49.1%) | 30 (50.8%) |
Natural Resources, Construction and Maintenance Occupations
The most common Natural Resources, Construction and Maintenance occupations in Bennington are , and Construction & Extraction (18 | 30.5%).
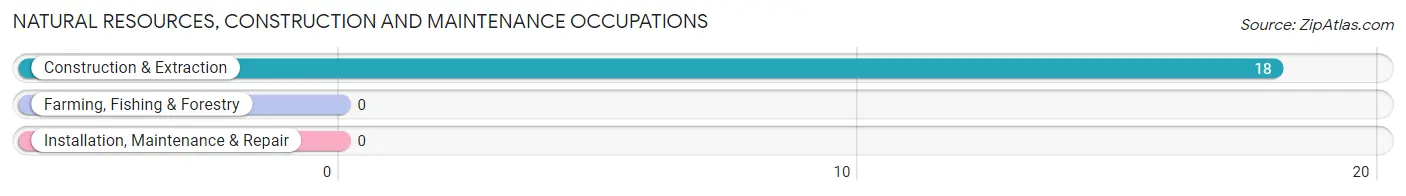
Natural Resources, Construction and Maintenance Occupations by Sex
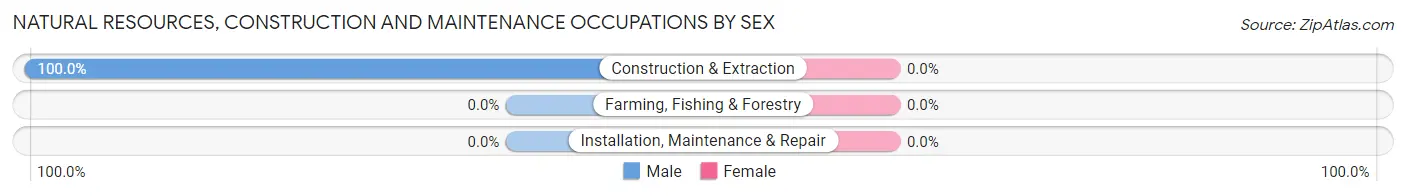
| Occupation | Male | Female |
| Farming, Fishing & Forestry | 0 (0.0%) | 0 (0.0%) |
| Construction & Extraction | 18 (100.0%) | 0 (0.0%) |
| Installation, Maintenance & Repair | 0 (0.0%) | 0 (0.0%) |
| Total (Category) | 18 (100.0%) | 0 (0.0%) |
| Total (Overall) | 29 (49.1%) | 30 (50.8%) |
Production, Transportation and Moving Occupations
The most common Production, Transportation and Moving occupations in Bennington are , and Production (11 | 18.6%).
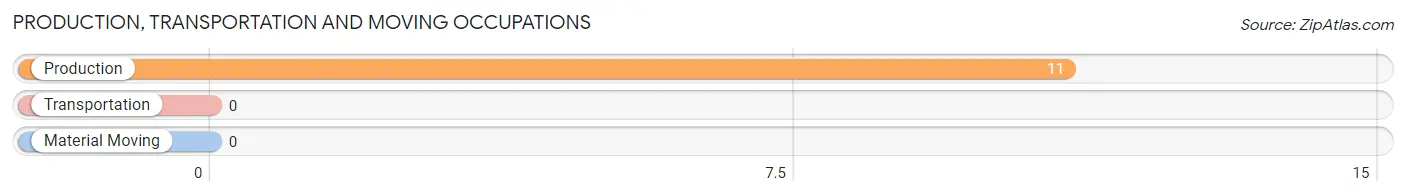
Production, Transportation and Moving Occupations by Sex
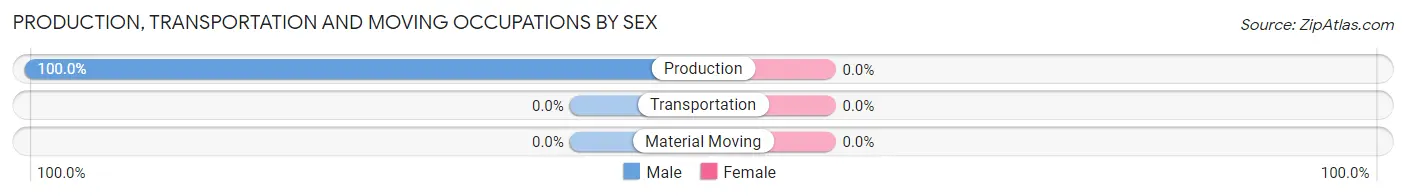
| Occupation | Male | Female |
| Production | 11 (100.0%) | 0 (0.0%) |
| Transportation | 0 (0.0%) | 0 (0.0%) |
| Material Moving | 0 (0.0%) | 0 (0.0%) |
| Total (Category) | 11 (100.0%) | 0 (0.0%) |
| Total (Overall) | 29 (49.1%) | 30 (50.8%) |
Employment Industries by Sex in Bennington
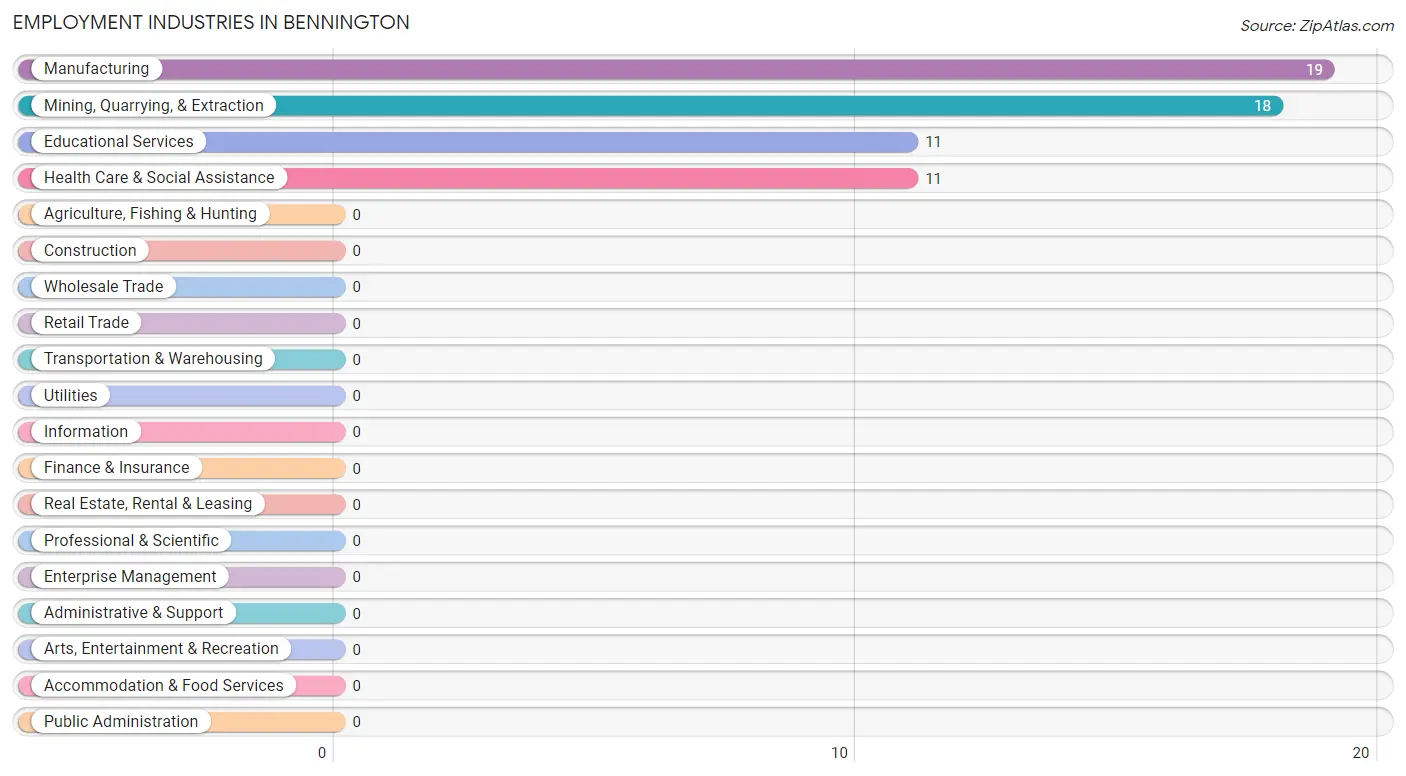
Employment Industries in Bennington
The major employment industries in Bennington include Manufacturing (19 | 32.2%), Mining, Quarrying, & Extraction (18 | 30.5%), Educational Services (11 | 18.6%), and Health Care & Social Assistance (11 | 18.6%).
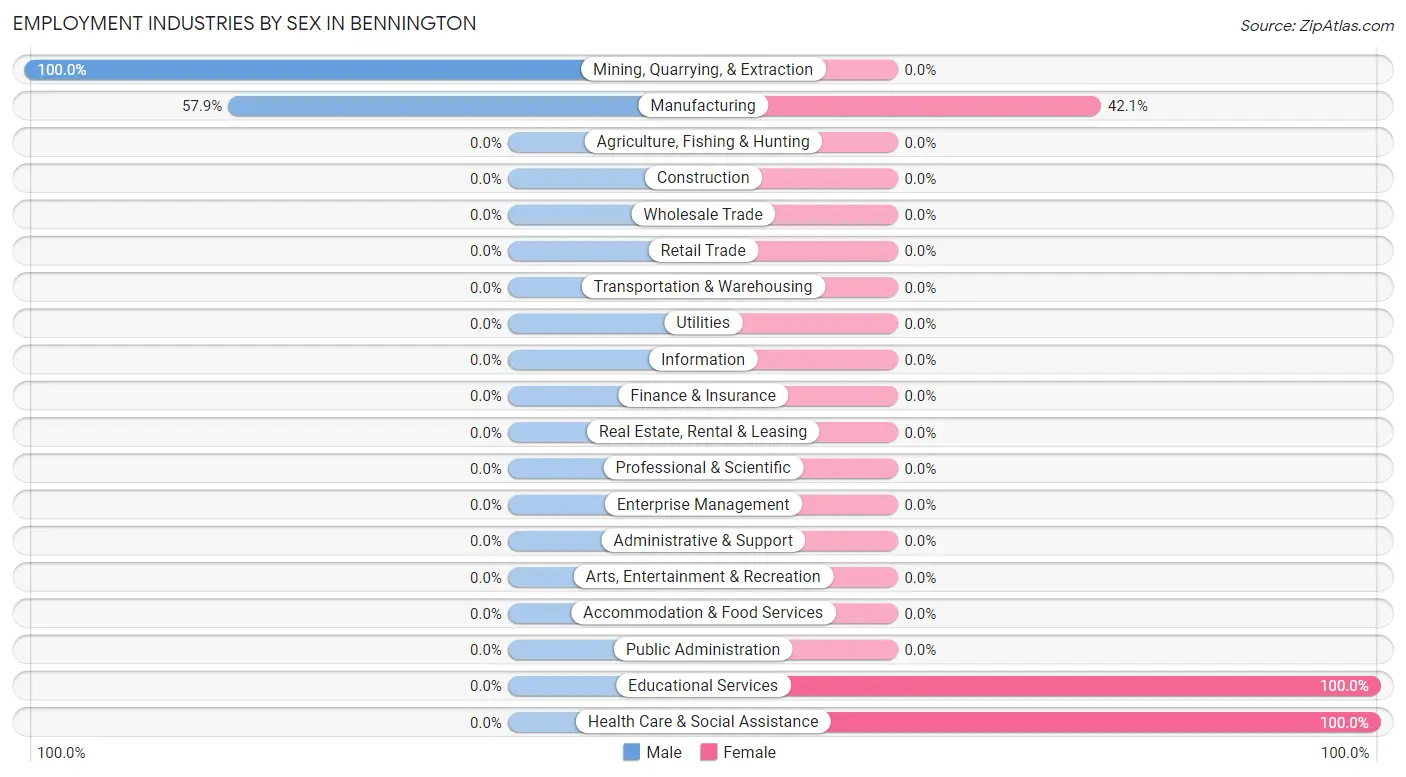
Employment Industries by Sex in Bennington
The Bennington industries that see more men than women are Mining, Quarrying, & Extraction (100.0%), and Manufacturing (57.9%), whereas the industries that tend to have a higher number of women are Educational Services (100.0%), Health Care & Social Assistance (100.0%), and Manufacturing (42.1%).
| Industry | Male | Female |
| Agriculture, Fishing & Hunting | 0 (0.0%) | 0 (0.0%) |
| Mining, Quarrying, & Extraction | 18 (100.0%) | 0 (0.0%) |
| Construction | 0 (0.0%) | 0 (0.0%) |
| Manufacturing | 11 (57.9%) | 8 (42.1%) |
| Wholesale Trade | 0 (0.0%) | 0 (0.0%) |
| Retail Trade | 0 (0.0%) | 0 (0.0%) |
| Transportation & Warehousing | 0 (0.0%) | 0 (0.0%) |
| Utilities | 0 (0.0%) | 0 (0.0%) |
| Information | 0 (0.0%) | 0 (0.0%) |
| Finance & Insurance | 0 (0.0%) | 0 (0.0%) |
| Real Estate, Rental & Leasing | 0 (0.0%) | 0 (0.0%) |
| Professional & Scientific | 0 (0.0%) | 0 (0.0%) |
| Enterprise Management | 0 (0.0%) | 0 (0.0%) |
| Administrative & Support | 0 (0.0%) | 0 (0.0%) |
| Educational Services | 0 (0.0%) | 11 (100.0%) |
| Health Care & Social Assistance | 0 (0.0%) | 11 (100.0%) |
| Arts, Entertainment & Recreation | 0 (0.0%) | 0 (0.0%) |
| Accommodation & Food Services | 0 (0.0%) | 0 (0.0%) |
| Public Administration | 0 (0.0%) | 0 (0.0%) |
| Total | 29 (49.1%) | 30 (50.8%) |
Education in Bennington
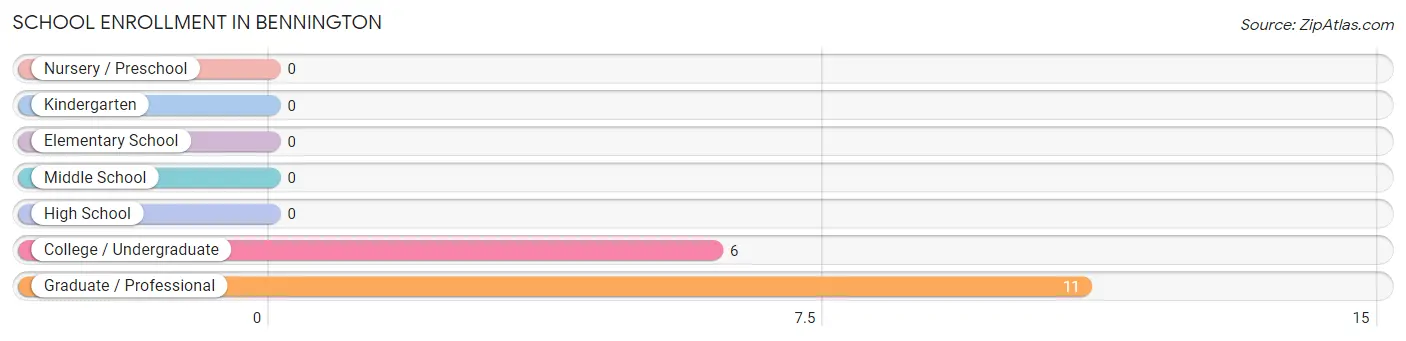
School Enrollment in Bennington
The most common levels of schooling among the 17 students in Bennington are graduate / professional (11 | 64.7%), and college / undergraduate (6 | 35.3%).
| School Level | # Students | % Students |
| Nursery / Preschool | 0 | 0.0% |
| Kindergarten | 0 | 0.0% |
| Elementary School | 0 | 0.0% |
| Middle School | 0 | 0.0% |
| High School | 0 | 0.0% |
| College / Undergraduate | 6 | 35.3% |
| Graduate / Professional | 11 | 64.7% |
| Total | 17 | 100.0% |
School Enrollment by Age by Funding Source in Bennington
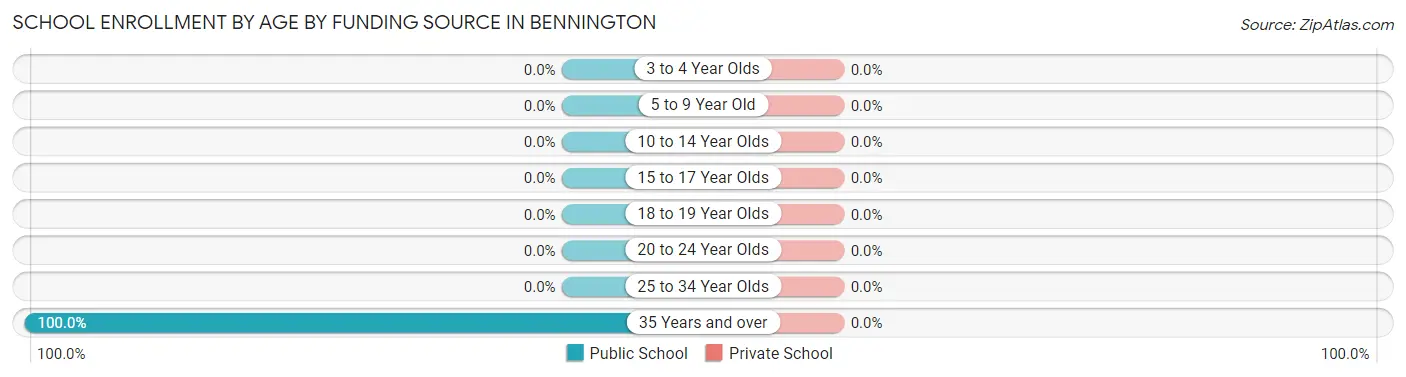
| Age Bracket | Public School | Private School |
| 3 to 4 Year Olds | 0 (0.0%) | 0 (0.0%) |
| 5 to 9 Year Old | 0 (0.0%) | 0 (0.0%) |
| 10 to 14 Year Olds | 0 (0.0%) | 0 (0.0%) |
| 15 to 17 Year Olds | 0 (0.0%) | 0 (0.0%) |
| 18 to 19 Year Olds | 0 (0.0%) | 0 (0.0%) |
| 20 to 24 Year Olds | 0 (0.0%) | 0 (0.0%) |
| 25 to 34 Year Olds | 0 (0.0%) | 0 (0.0%) |
| 35 Years and over | 17 (100.0%) | 0 (0.0%) |
| Total | 17 (100.0%) | 0 (0.0%) |
Educational Attainment by Field of Study in Bennington
, and social sciences (26 | 100.0%) are the most common fields of study among 26 individuals in Bennington who have obtained a bachelor's degree or higher.
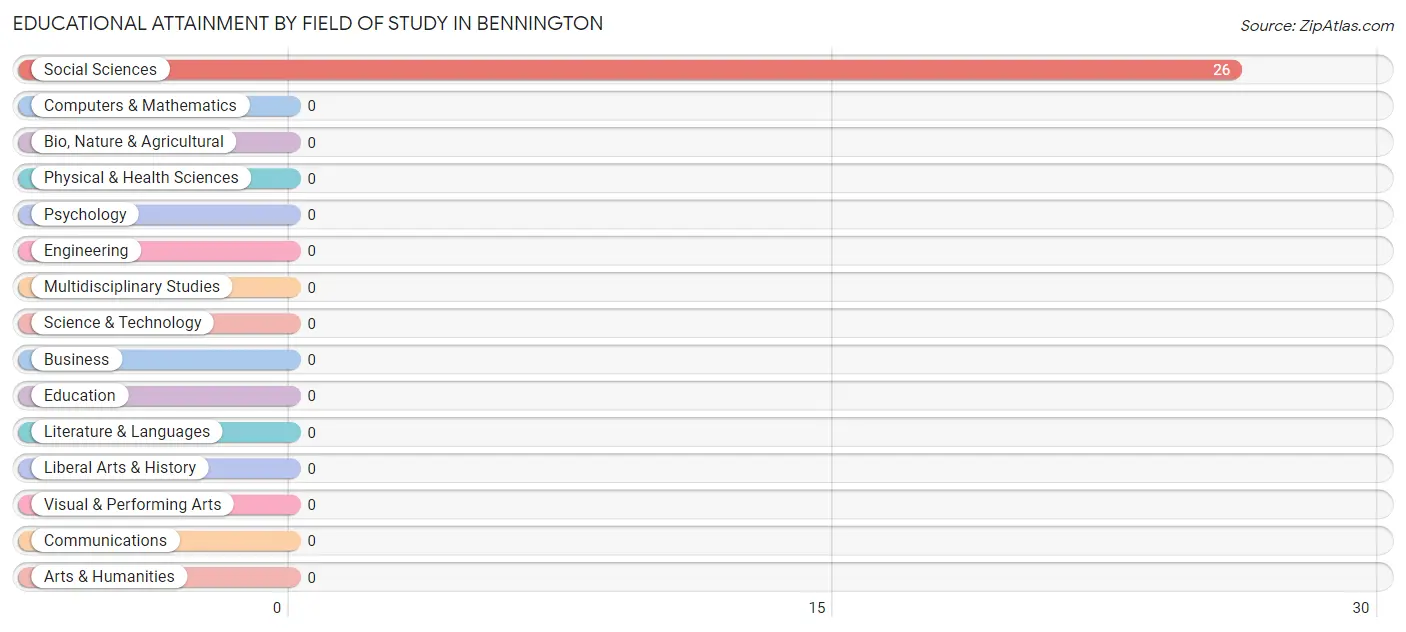
| Field of Study | # Graduates | % Graduates |
| Computers & Mathematics | 0 | 0.0% |
| Bio, Nature & Agricultural | 0 | 0.0% |
| Physical & Health Sciences | 0 | 0.0% |
| Psychology | 0 | 0.0% |
| Social Sciences | 26 | 100.0% |
| Engineering | 0 | 0.0% |
| Multidisciplinary Studies | 0 | 0.0% |
| Science & Technology | 0 | 0.0% |
| Business | 0 | 0.0% |
| Education | 0 | 0.0% |
| Literature & Languages | 0 | 0.0% |
| Liberal Arts & History | 0 | 0.0% |
| Visual & Performing Arts | 0 | 0.0% |
| Communications | 0 | 0.0% |
| Arts & Humanities | 0 | 0.0% |
| Total | 26 | 100.0% |
Transportation & Commute in Bennington
Vehicle Availability by Sex in Bennington
The most prevalent vehicle ownership categories in Bennington are males with 4 vehicles (18, accounting for 62.1%) and females with 4 vehicles (8, making up 94.7%).
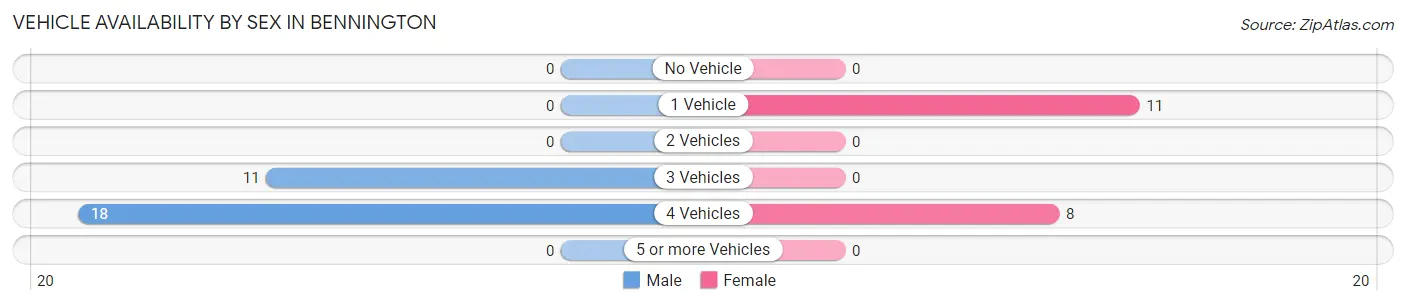
| Vehicles Available | Male | Female |
| No Vehicle | 0 (0.0%) | 0 (0.0%) |
| 1 Vehicle | 0 (0.0%) | 11 (57.9%) |
| 2 Vehicles | 0 (0.0%) | 0 (0.0%) |
| 3 Vehicles | 11 (37.9%) | 0 (0.0%) |
| 4 Vehicles | 18 (62.1%) | 8 (42.1%) |
| 5 or more Vehicles | 0 (0.0%) | 0 (0.0%) |
| Total | 29 (100.0%) | 19 (100.0%) |
Commute Time in Bennington
The most frequently occuring commute durations in Bennington are 40 to 44 minutes (11 commuters, 27.5%), 60 to 89 minutes (11 commuters, 27.5%), and 10 to 14 minutes (8 commuters, 20.0%).
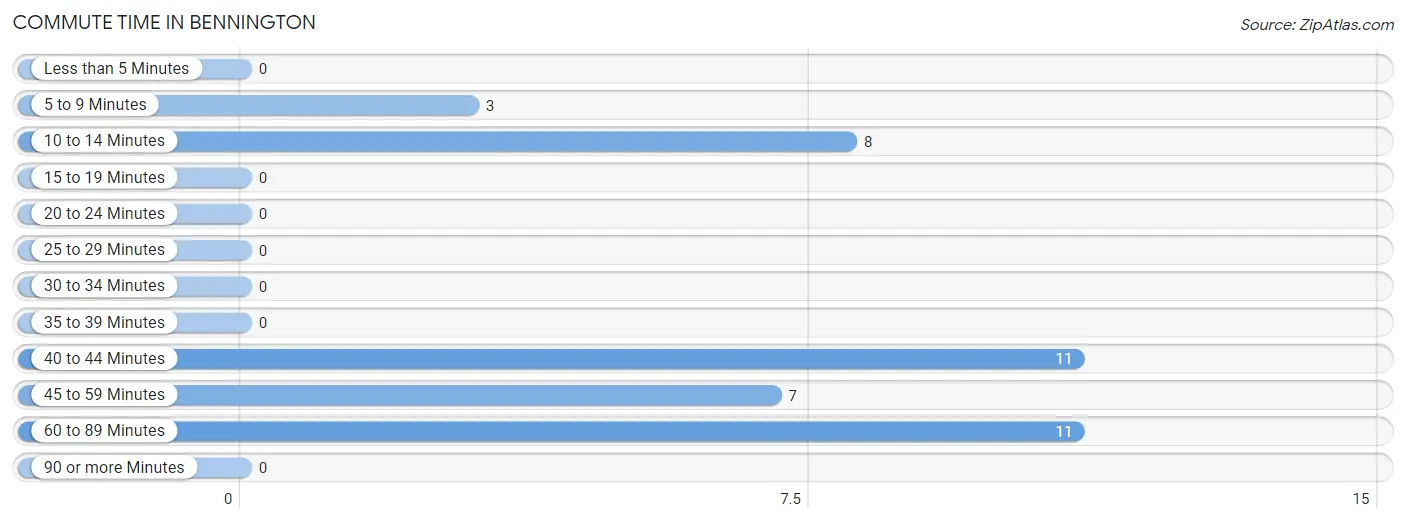
| Commute Time | # Commuters | % Commuters |
| Less than 5 Minutes | 0 | 0.0% |
| 5 to 9 Minutes | 3 | 7.5% |
| 10 to 14 Minutes | 8 | 20.0% |
| 15 to 19 Minutes | 0 | 0.0% |
| 20 to 24 Minutes | 0 | 0.0% |
| 25 to 29 Minutes | 0 | 0.0% |
| 30 to 34 Minutes | 0 | 0.0% |
| 35 to 39 Minutes | 0 | 0.0% |
| 40 to 44 Minutes | 11 | 27.5% |
| 45 to 59 Minutes | 7 | 17.5% |
| 60 to 89 Minutes | 11 | 27.5% |
| 90 or more Minutes | 0 | 0.0% |
Commute Time by Sex in Bennington
The most common commute times in Bennington are 40 to 44 minutes (11 commuters, 37.9%) for males and 10 to 14 minutes (8 commuters, 72.7%) for females.
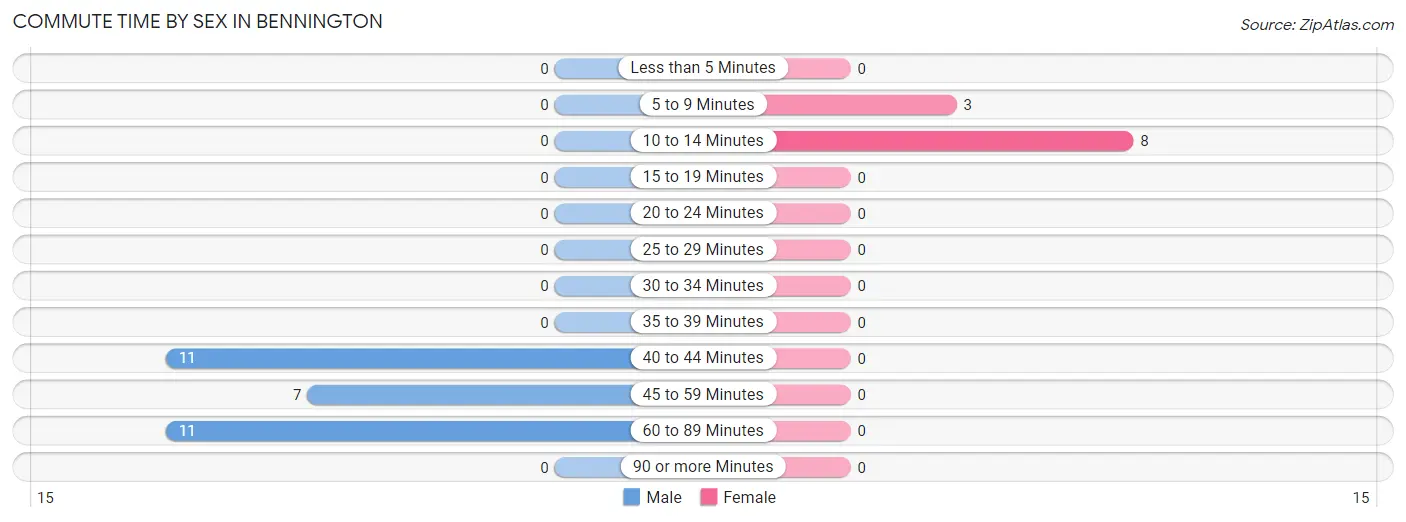
| Commute Time | Male | Female |
| Less than 5 Minutes | 0 (0.0%) | 0 (0.0%) |
| 5 to 9 Minutes | 0 (0.0%) | 3 (27.3%) |
| 10 to 14 Minutes | 0 (0.0%) | 8 (72.7%) |
| 15 to 19 Minutes | 0 (0.0%) | 0 (0.0%) |
| 20 to 24 Minutes | 0 (0.0%) | 0 (0.0%) |
| 25 to 29 Minutes | 0 (0.0%) | 0 (0.0%) |
| 30 to 34 Minutes | 0 (0.0%) | 0 (0.0%) |
| 35 to 39 Minutes | 0 (0.0%) | 0 (0.0%) |
| 40 to 44 Minutes | 11 (37.9%) | 0 (0.0%) |
| 45 to 59 Minutes | 7 (24.1%) | 0 (0.0%) |
| 60 to 89 Minutes | 11 (37.9%) | 0 (0.0%) |
| 90 or more Minutes | 0 (0.0%) | 0 (0.0%) |
Time of Departure to Work by Sex in Bennington
The most frequent times of departure to work in Bennington are 12:00 AM to 4:59 AM (18, 62.1%) for males and 9:00 AM to 9:59 AM (8, 72.7%) for females.
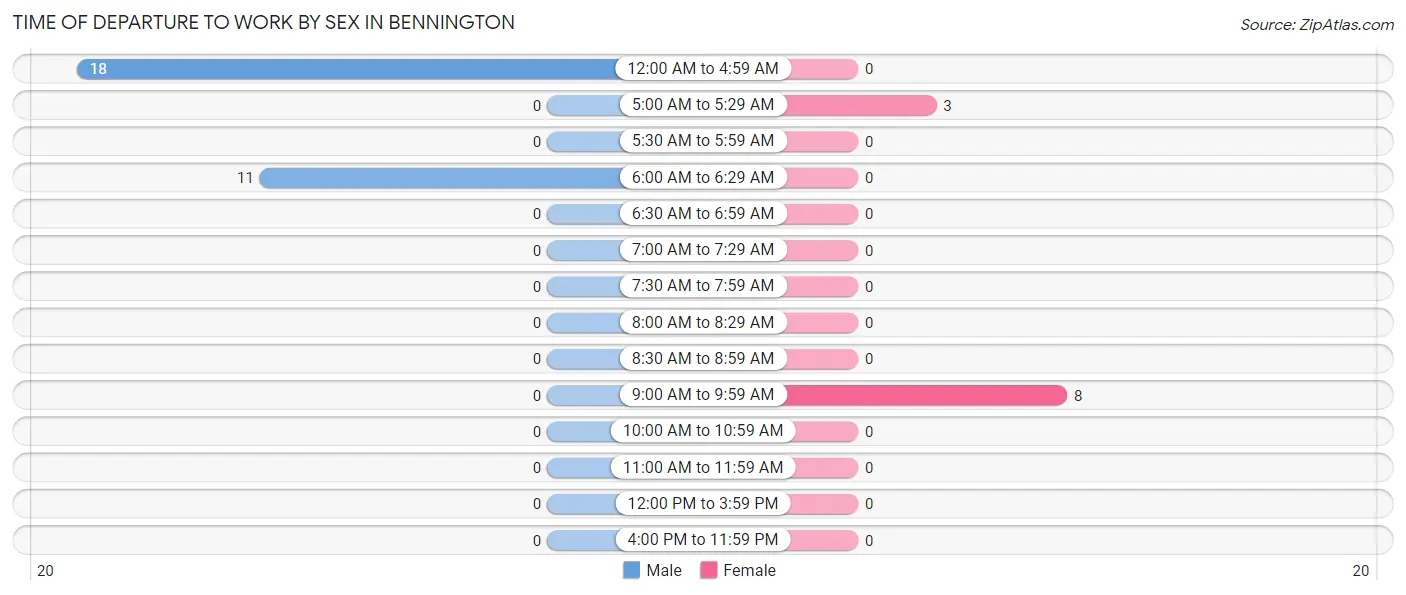
| Time of Departure | Male | Female |
| 12:00 AM to 4:59 AM | 18 (62.1%) | 0 (0.0%) |
| 5:00 AM to 5:29 AM | 0 (0.0%) | 3 (27.3%) |
| 5:30 AM to 5:59 AM | 0 (0.0%) | 0 (0.0%) |
| 6:00 AM to 6:29 AM | 11 (37.9%) | 0 (0.0%) |
| 6:30 AM to 6:59 AM | 0 (0.0%) | 0 (0.0%) |
| 7:00 AM to 7:29 AM | 0 (0.0%) | 0 (0.0%) |
| 7:30 AM to 7:59 AM | 0 (0.0%) | 0 (0.0%) |
| 8:00 AM to 8:29 AM | 0 (0.0%) | 0 (0.0%) |
| 8:30 AM to 8:59 AM | 0 (0.0%) | 0 (0.0%) |
| 9:00 AM to 9:59 AM | 0 (0.0%) | 8 (72.7%) |
| 10:00 AM to 10:59 AM | 0 (0.0%) | 0 (0.0%) |
| 11:00 AM to 11:59 AM | 0 (0.0%) | 0 (0.0%) |
| 12:00 PM to 3:59 PM | 0 (0.0%) | 0 (0.0%) |
| 4:00 PM to 11:59 PM | 0 (0.0%) | 0 (0.0%) |
| Total | 29 (100.0%) | 11 (100.0%) |
Housing Occupancy in Bennington
Occupancy by Ownership in Bennington
Of the total 57 dwellings in Bennington, owner-occupied units account for 57 (100.0%), while renter-occupied units make up 0 (0.0%).
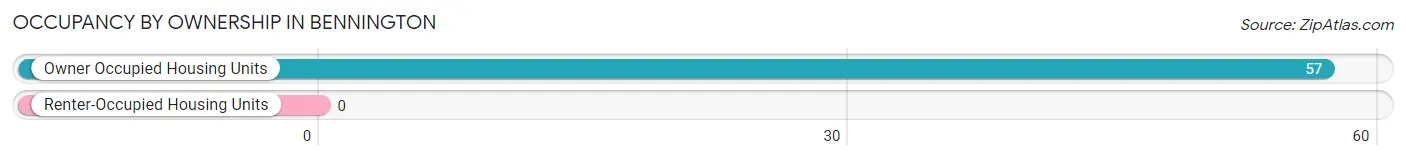
| Occupancy | # Housing Units | % Housing Units |
| Owner Occupied Housing Units | 57 | 100.0% |
| Renter-Occupied Housing Units | 0 | 0.0% |
| Total Occupied Housing Units | 57 | 100.0% |
Occupancy by Household Size in Bennington
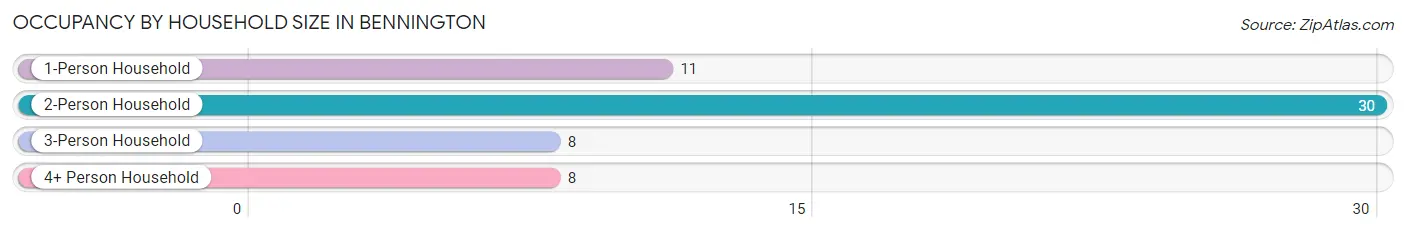
| Household Size | # Housing Units | % Housing Units |
| 1-Person Household | 11 | 19.3% |
| 2-Person Household | 30 | 52.6% |
| 3-Person Household | 8 | 14.0% |
| 4+ Person Household | 8 | 14.0% |
| Total Housing Units | 57 | 100.0% |
Occupancy by Ownership by Household Size in Bennington
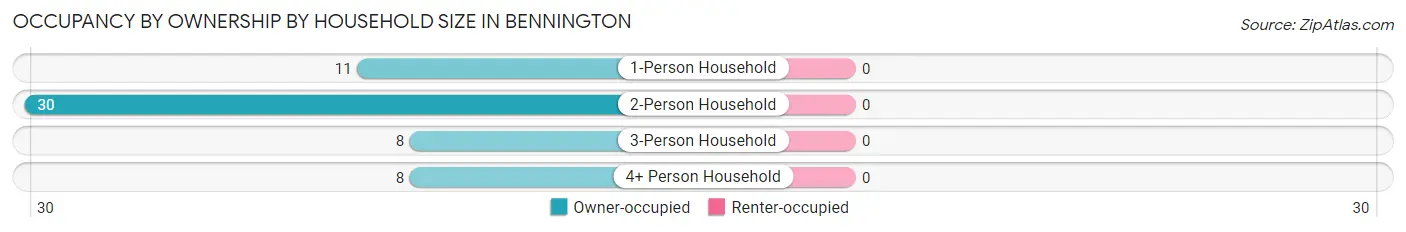
| Household Size | Owner-occupied | Renter-occupied |
| 1-Person Household | 11 (100.0%) | 0 (0.0%) |
| 2-Person Household | 30 (100.0%) | 0 (0.0%) |
| 3-Person Household | 8 (100.0%) | 0 (0.0%) |
| 4+ Person Household | 8 (100.0%) | 0 (0.0%) |
| Total Housing Units | 57 (100.0%) | 0 (0.0%) |
Occupancy by Educational Attainment in Bennington
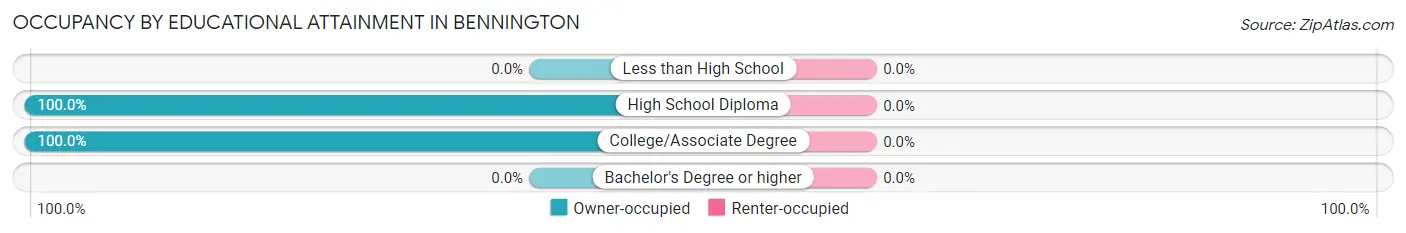
| Household Size | Owner-occupied | Renter-occupied |
| Less than High School | 0 (0.0%) | 0 (0.0%) |
| High School Diploma | 10 (100.0%) | 0 (0.0%) |
| College/Associate Degree | 47 (100.0%) | 0 (0.0%) |
| Bachelor's Degree or higher | 0 (0.0%) | 0 (0.0%) |
Occupancy by Age of Householder in Bennington
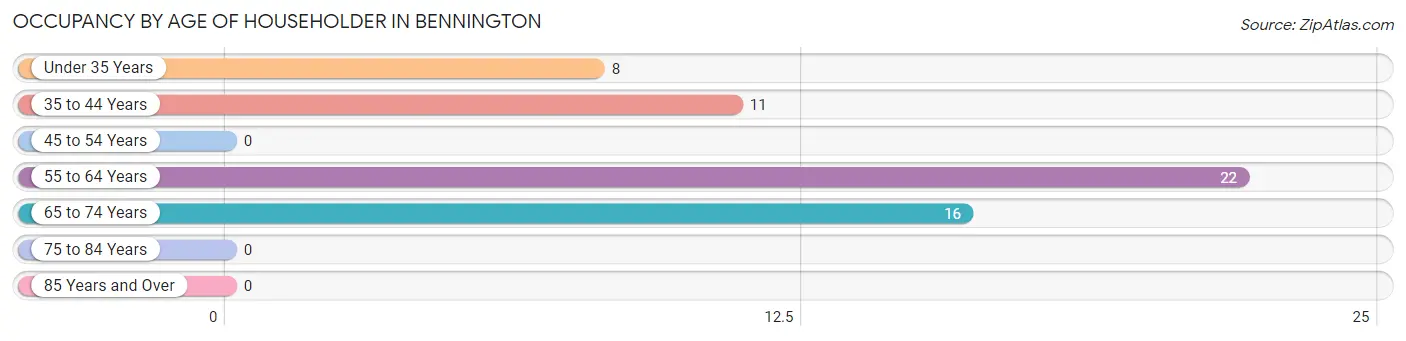
| Age Bracket | # Households | % Households |
| Under 35 Years | 8 | 14.0% |
| 35 to 44 Years | 11 | 19.3% |
| 45 to 54 Years | 0 | 0.0% |
| 55 to 64 Years | 22 | 38.6% |
| 65 to 74 Years | 16 | 28.1% |
| 75 to 84 Years | 0 | 0.0% |
| 85 Years and Over | 0 | 0.0% |
| Total | 57 | 100.0% |
Housing Finances in Bennington
Median Income by Occupancy in Bennington
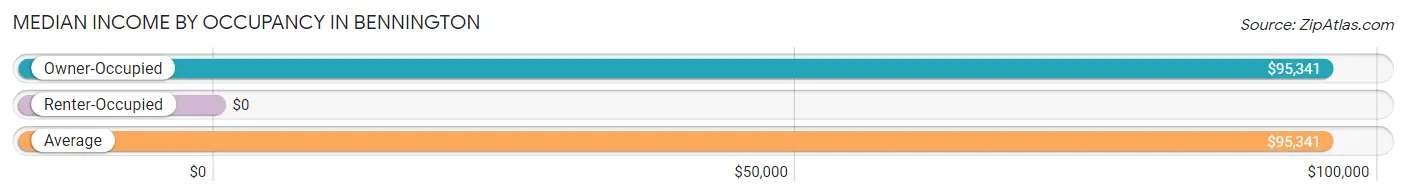
| Occupancy Type | # Households | Median Income |
| Owner-Occupied | 57 (100.0%) | $95,341 |
| Renter-Occupied | 0 (0.0%) | $0 |
| Average | 57 (100.0%) | $95,341 |
Occupancy by Householder Income Bracket in Bennington
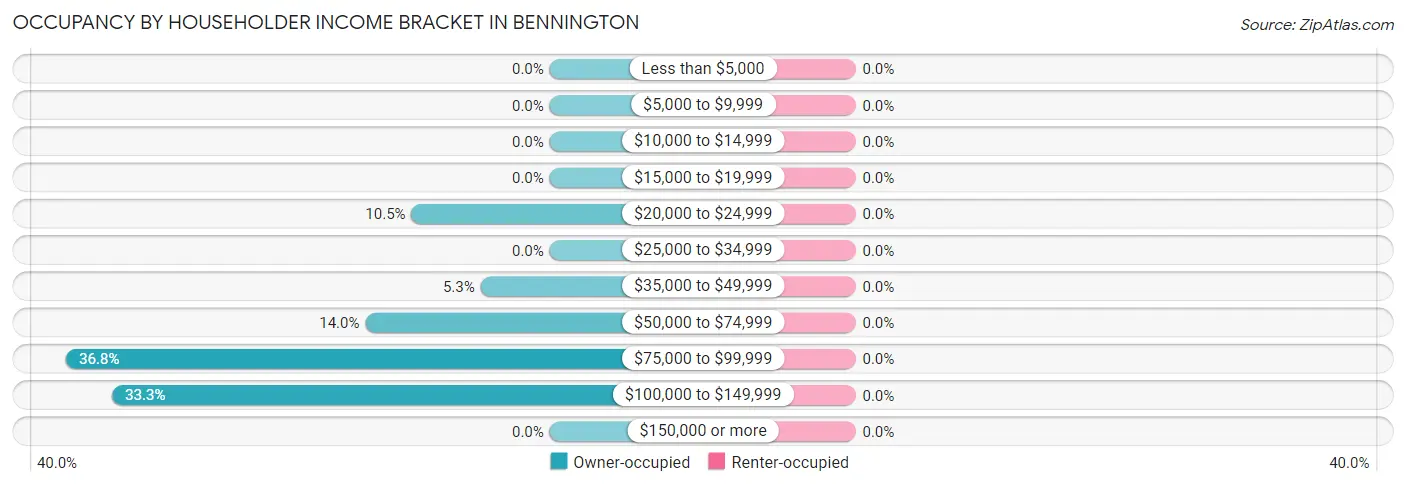
| Income Bracket | Owner-occupied | Renter-occupied |
| Less than $5,000 | 0 (0.0%) | 0 (0.0%) |
| $5,000 to $9,999 | 0 (0.0%) | 0 (0.0%) |
| $10,000 to $14,999 | 0 (0.0%) | 0 (0.0%) |
| $15,000 to $19,999 | 0 (0.0%) | 0 (0.0%) |
| $20,000 to $24,999 | 6 (10.5%) | 0 (0.0%) |
| $25,000 to $34,999 | 0 (0.0%) | 0 (0.0%) |
| $35,000 to $49,999 | 3 (5.3%) | 0 (0.0%) |
| $50,000 to $74,999 | 8 (14.0%) | 0 (0.0%) |
| $75,000 to $99,999 | 21 (36.8%) | 0 (0.0%) |
| $100,000 to $149,999 | 19 (33.3%) | 0 (0.0%) |
| $150,000 or more | 0 (0.0%) | 0 (0.0%) |
| Total | 57 (100.0%) | 0 (0.0%) |
Monthly Housing Cost Tiers in Bennington
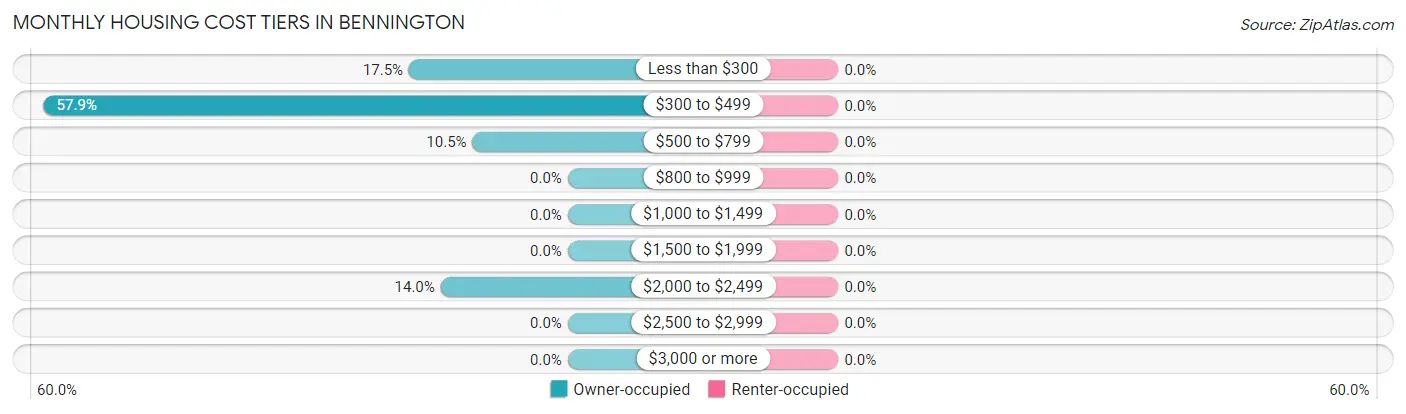
| Monthly Cost | Owner-occupied | Renter-occupied |
| Less than $300 | 10 (17.5%) | 0 (0.0%) |
| $300 to $499 | 33 (57.9%) | 0 (0.0%) |
| $500 to $799 | 6 (10.5%) | 0 (0.0%) |
| $800 to $999 | 0 (0.0%) | 0 (0.0%) |
| $1,000 to $1,499 | 0 (0.0%) | 0 (0.0%) |
| $1,500 to $1,999 | 0 (0.0%) | 0 (0.0%) |
| $2,000 to $2,499 | 8 (14.0%) | 0 (0.0%) |
| $2,500 to $2,999 | 0 (0.0%) | 0 (0.0%) |
| $3,000 or more | 0 (0.0%) | 0 (0.0%) |
| Total | 57 (100.0%) | 0 (0.0%) |
Physical Housing Characteristics in Bennington
Housing Structures in Bennington
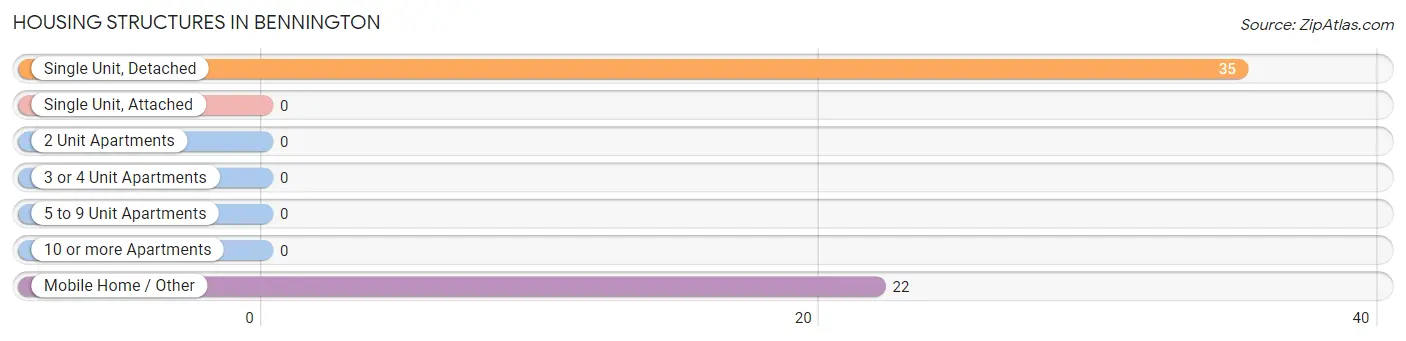
| Structure Type | # Housing Units | % Housing Units |
| Single Unit, Detached | 35 | 61.4% |
| Single Unit, Attached | 0 | 0.0% |
| 2 Unit Apartments | 0 | 0.0% |
| 3 or 4 Unit Apartments | 0 | 0.0% |
| 5 to 9 Unit Apartments | 0 | 0.0% |
| 10 or more Apartments | 0 | 0.0% |
| Mobile Home / Other | 22 | 38.6% |
| Total | 57 | 100.0% |
Housing Structures by Occupancy in Bennington
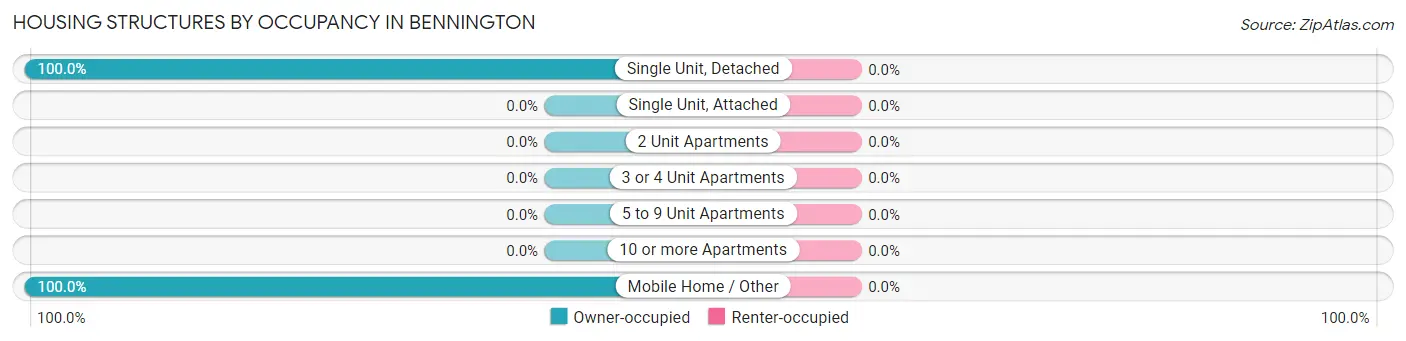
| Structure Type | Owner-occupied | Renter-occupied |
| Single Unit, Detached | 35 (100.0%) | 0 (0.0%) |
| Single Unit, Attached | 0 (0.0%) | 0 (0.0%) |
| 2 Unit Apartments | 0 (0.0%) | 0 (0.0%) |
| 3 or 4 Unit Apartments | 0 (0.0%) | 0 (0.0%) |
| 5 to 9 Unit Apartments | 0 (0.0%) | 0 (0.0%) |
| 10 or more Apartments | 0 (0.0%) | 0 (0.0%) |
| Mobile Home / Other | 22 (100.0%) | 0 (0.0%) |
| Total | 57 (100.0%) | 0 (0.0%) |
Housing Structures by Number of Rooms in Bennington
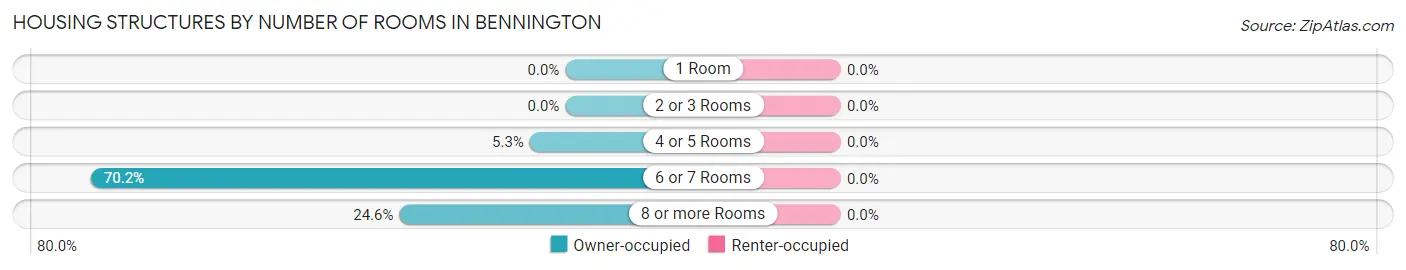
| Number of Rooms | Owner-occupied | Renter-occupied |
| 1 Room | 0 (0.0%) | 0 (0.0%) |
| 2 or 3 Rooms | 0 (0.0%) | 0 (0.0%) |
| 4 or 5 Rooms | 3 (5.3%) | 0 (0.0%) |
| 6 or 7 Rooms | 40 (70.2%) | 0 (0.0%) |
| 8 or more Rooms | 14 (24.6%) | 0 (0.0%) |
| Total | 57 (100.0%) | 0 (0.0%) |
Housing Structure by Heating Type in Bennington
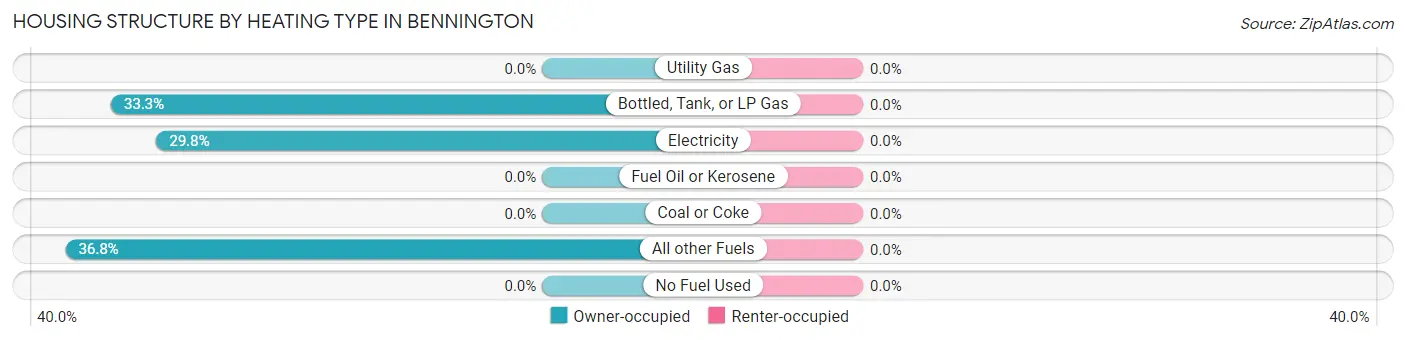
| Heating Type | Owner-occupied | Renter-occupied |
| Utility Gas | 0 (0.0%) | 0 (0.0%) |
| Bottled, Tank, or LP Gas | 19 (33.3%) | 0 (0.0%) |
| Electricity | 17 (29.8%) | 0 (0.0%) |
| Fuel Oil or Kerosene | 0 (0.0%) | 0 (0.0%) |
| Coal or Coke | 0 (0.0%) | 0 (0.0%) |
| All other Fuels | 21 (36.8%) | 0 (0.0%) |
| No Fuel Used | 0 (0.0%) | 0 (0.0%) |
| Total | 57 (100.0%) | 0 (0.0%) |
Household Vehicle Usage in Bennington
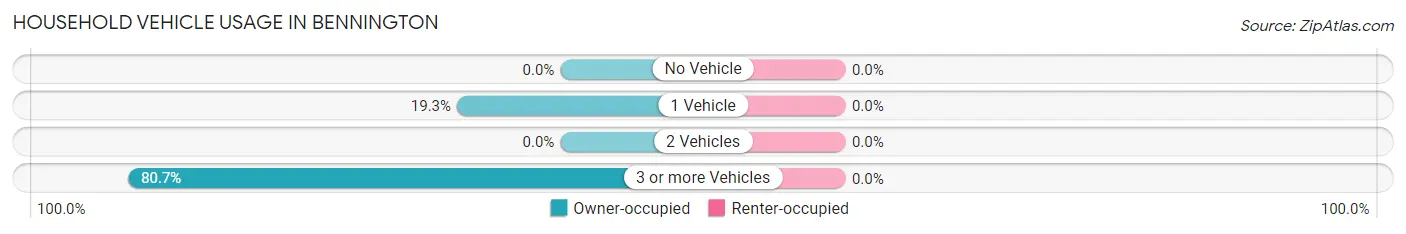
| Vehicles per Household | Owner-occupied | Renter-occupied |
| No Vehicle | 0 (0.0%) | 0 (0.0%) |
| 1 Vehicle | 11 (19.3%) | 0 (0.0%) |
| 2 Vehicles | 0 (0.0%) | 0 (0.0%) |
| 3 or more Vehicles | 46 (80.7%) | 0 (0.0%) |
| Total | 57 (100.0%) | 0 (0.0%) |
Real Estate & Mortgages in Bennington
Real Estate and Mortgage Overview in Bennington
| Characteristic | Without Mortgage | With Mortgage |
| Housing Units | 49 | 8 |
| Median Property Value | $77,900 | $0 |
| Median Household Income | $79,375 | $0 |
| Monthly Housing Costs | $352 | $0 |
| Real Estate Taxes | $819 | $0 |
Property Value by Mortgage Status in Bennington
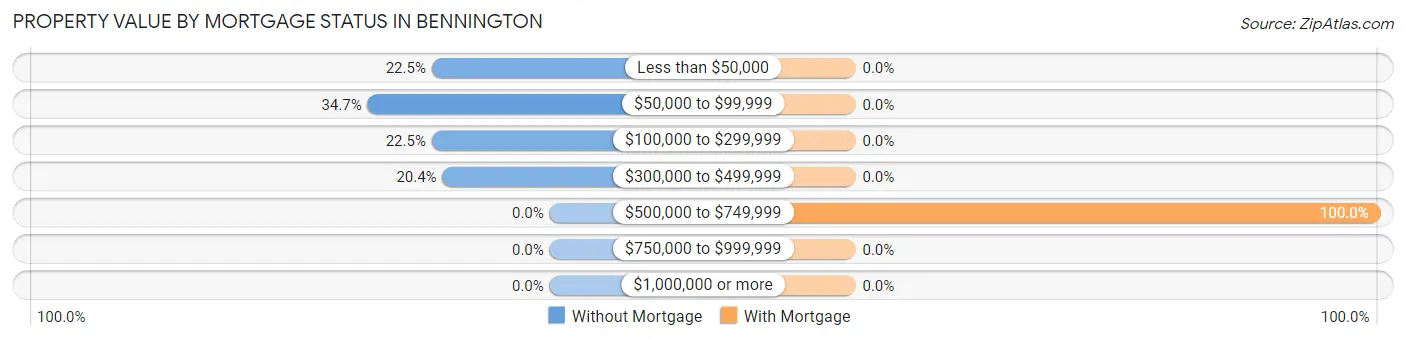
| Property Value | Without Mortgage | With Mortgage |
| Less than $50,000 | 11 (22.5%) | 0 (0.0%) |
| $50,000 to $99,999 | 17 (34.7%) | 0 (0.0%) |
| $100,000 to $299,999 | 11 (22.5%) | 0 (0.0%) |
| $300,000 to $499,999 | 10 (20.4%) | 0 (0.0%) |
| $500,000 to $749,999 | 0 (0.0%) | 8 (100.0%) |
| $750,000 to $999,999 | 0 (0.0%) | 0 (0.0%) |
| $1,000,000 or more | 0 (0.0%) | 0 (0.0%) |
| Total | 49 (100.0%) | 8 (100.0%) |
Household Income by Mortgage Status in Bennington
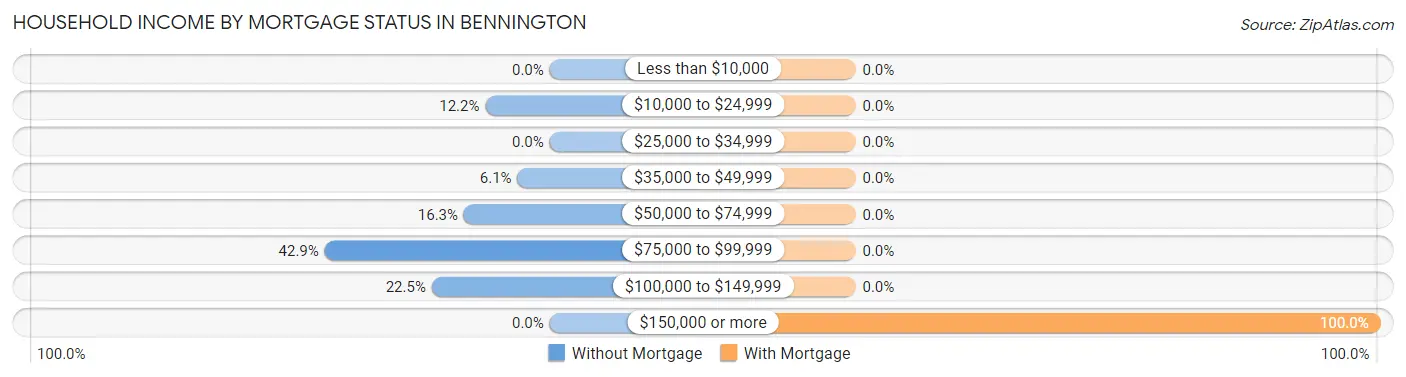
| Household Income | Without Mortgage | With Mortgage |
| Less than $10,000 | 0 (0.0%) | 0 (0.0%) |
| $10,000 to $24,999 | 6 (12.2%) | 0 (0.0%) |
| $25,000 to $34,999 | 0 (0.0%) | 0 (0.0%) |
| $35,000 to $49,999 | 3 (6.1%) | 0 (0.0%) |
| $50,000 to $74,999 | 8 (16.3%) | 0 (0.0%) |
| $75,000 to $99,999 | 21 (42.9%) | 0 (0.0%) |
| $100,000 to $149,999 | 11 (22.5%) | 0 (0.0%) |
| $150,000 or more | 0 (0.0%) | 8 (100.0%) |
| Total | 49 (100.0%) | 8 (100.0%) |
Property Value to Household Income Ratio in Bennington
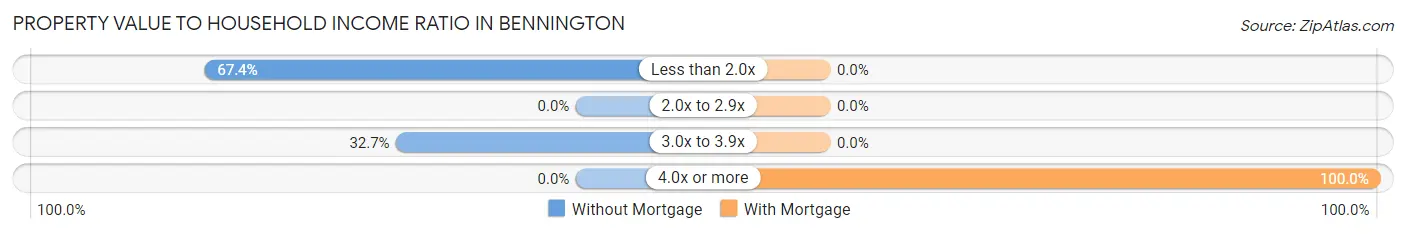
| Value-to-Income Ratio | Without Mortgage | With Mortgage |
| Less than 2.0x | 33 (67.3%) | 0 (0.0%) |
| 2.0x to 2.9x | 0 (0.0%) | 0 (0.0%) |
| 3.0x to 3.9x | 16 (32.7%) | 0 (0.0%) |
| 4.0x or more | 0 (0.0%) | 8 (100.0%) |
| Total | 49 (100.0%) | 8 (100.0%) |
Real Estate Taxes by Mortgage Status in Bennington
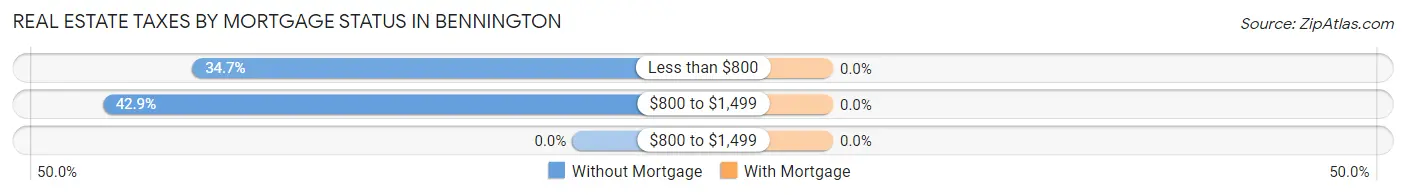
| Property Taxes | Without Mortgage | With Mortgage |
| Less than $800 | 17 (34.7%) | 0 (0.0%) |
| $800 to $1,499 | 21 (42.9%) | 0 (0.0%) |
| $800 to $1,499 | 0 (0.0%) | 0 (0.0%) |
| Total | 49 (100.0%) | 8 (100.0%) |
Health & Disability in Bennington
Health Insurance Coverage by Age in Bennington
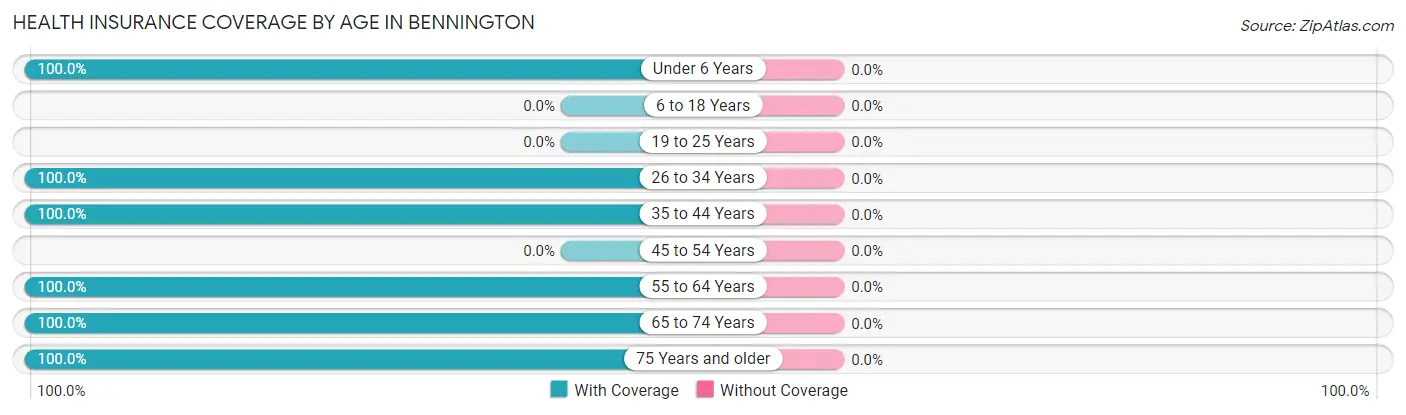
| Age Bracket | With Coverage | Without Coverage |
| Under 6 Years | 15 (100.0%) | 0 (0.0%) |
| 6 to 18 Years | 0 (0.0%) | 0 (0.0%) |
| 19 to 25 Years | 0 (0.0%) | 0 (0.0%) |
| 26 to 34 Years | 23 (100.0%) | 0 (0.0%) |
| 35 to 44 Years | 29 (100.0%) | 0 (0.0%) |
| 45 to 54 Years | 0 (0.0%) | 0 (0.0%) |
| 55 to 64 Years | 31 (100.0%) | 0 (0.0%) |
| 65 to 74 Years | 32 (100.0%) | 0 (0.0%) |
| 75 Years and older | 12 (100.0%) | 0 (0.0%) |
| Total | 142 (100.0%) | 0 (0.0%) |
Health Insurance Coverage by Citizenship Status in Bennington
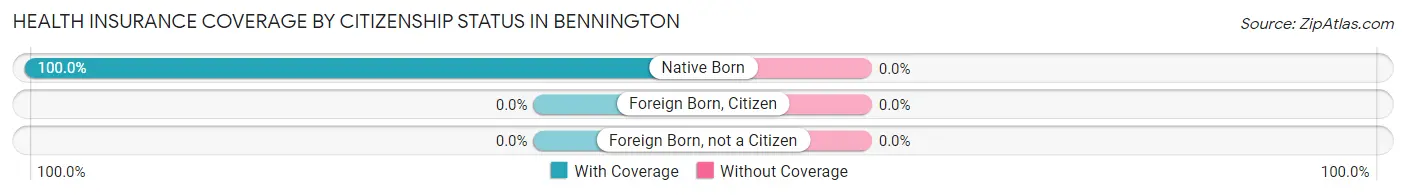
| Citizenship Status | With Coverage | Without Coverage |
| Native Born | 15 (100.0%) | 0 (0.0%) |
| Foreign Born, Citizen | 0 (0.0%) | 0 (0.0%) |
| Foreign Born, not a Citizen | 0 (0.0%) | 0 (0.0%) |
Health Insurance Coverage by Household Income in Bennington
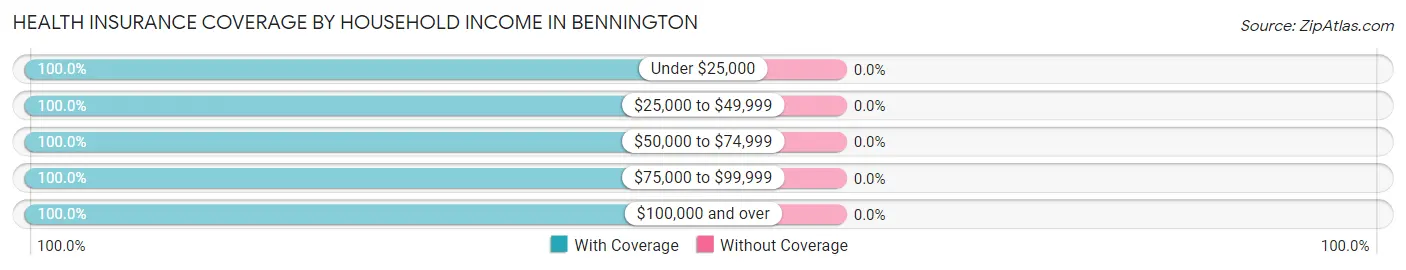
| Household Income | With Coverage | Without Coverage |
| Under $25,000 | 12 (100.0%) | 0 (0.0%) |
| $25,000 to $49,999 | 14 (100.0%) | 0 (0.0%) |
| $50,000 to $74,999 | 35 (100.0%) | 0 (0.0%) |
| $75,000 to $99,999 | 40 (100.0%) | 0 (0.0%) |
| $100,000 and over | 41 (100.0%) | 0 (0.0%) |
Public vs Private Health Insurance Coverage by Age in Bennington
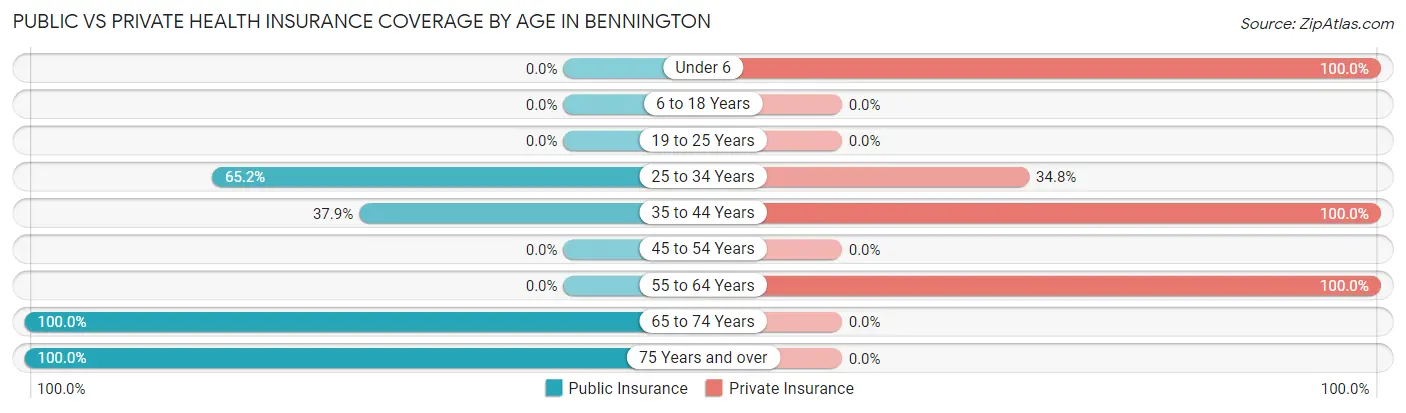
| Age Bracket | Public Insurance | Private Insurance |
| Under 6 | 0 (0.0%) | 15 (100.0%) |
| 6 to 18 Years | 0 (0.0%) | 0 (0.0%) |
| 19 to 25 Years | 0 (0.0%) | 0 (0.0%) |
| 25 to 34 Years | 15 (65.2%) | 8 (34.8%) |
| 35 to 44 Years | 11 (37.9%) | 29 (100.0%) |
| 45 to 54 Years | 0 (0.0%) | 0 (0.0%) |
| 55 to 64 Years | 0 (0.0%) | 31 (100.0%) |
| 65 to 74 Years | 32 (100.0%) | 0 (0.0%) |
| 75 Years and over | 12 (100.0%) | 0 (0.0%) |
| Total | 70 (49.3%) | 83 (58.5%) |
Disability Status by Sex by Age in Bennington
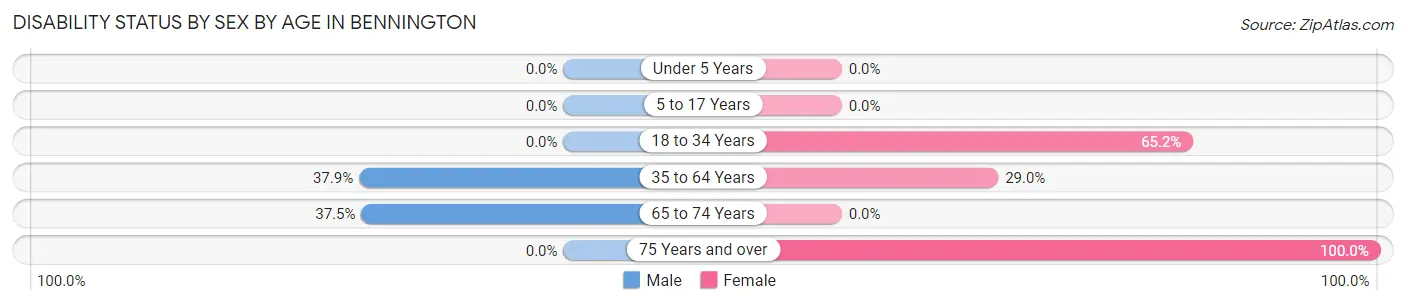
| Age Bracket | Male | Female |
| Under 5 Years | 0 (0.0%) | 0 (0.0%) |
| 5 to 17 Years | 0 (0.0%) | 0 (0.0%) |
| 18 to 34 Years | 0 (0.0%) | 15 (65.2%) |
| 35 to 64 Years | 11 (37.9%) | 9 (29.0%) |
| 65 to 74 Years | 6 (37.5%) | 0 (0.0%) |
| 75 Years and over | 0 (0.0%) | 12 (100.0%) |
Disability Class by Sex by Age in Bennington
Disability Class: Hearing Difficulty
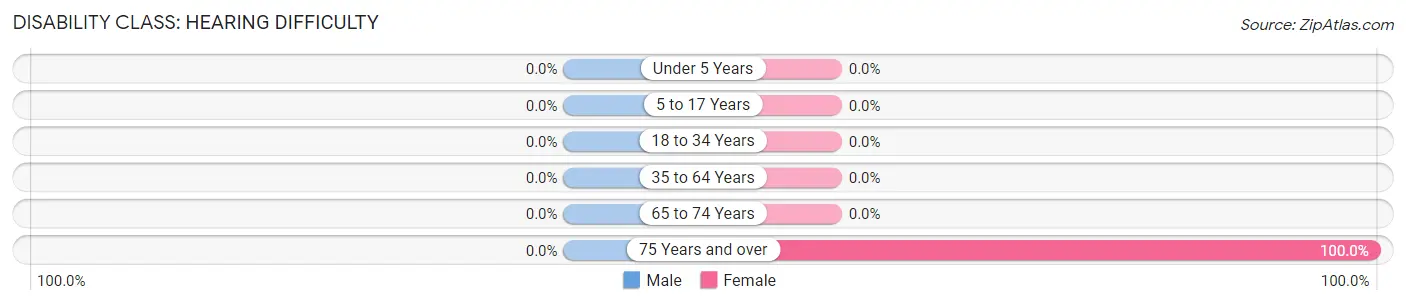
| Age Bracket | Male | Female |
| Under 5 Years | 0 (0.0%) | 0 (0.0%) |
| 5 to 17 Years | 0 (0.0%) | 0 (0.0%) |
| 18 to 34 Years | 0 (0.0%) | 0 (0.0%) |
| 35 to 64 Years | 0 (0.0%) | 0 (0.0%) |
| 65 to 74 Years | 0 (0.0%) | 0 (0.0%) |
| 75 Years and over | 0 (0.0%) | 12 (100.0%) |
Disability Class: Vision Difficulty
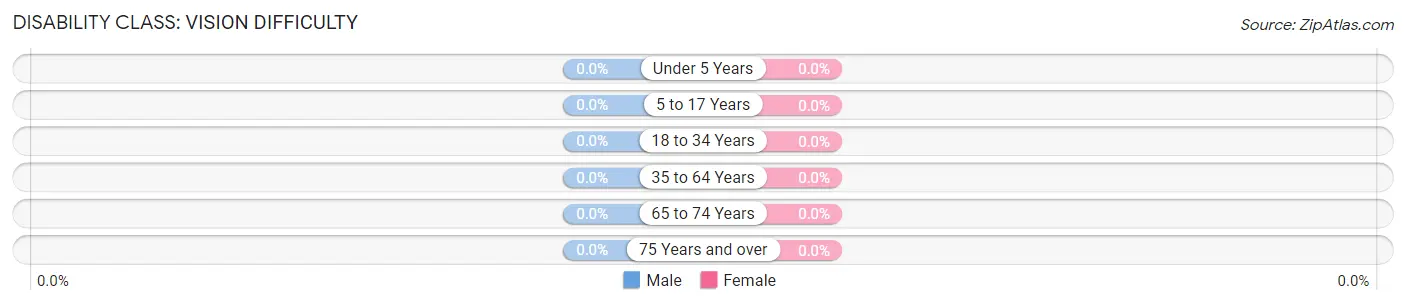
| Age Bracket | Male | Female |
| Under 5 Years | 0 (0.0%) | 0 (0.0%) |
| 5 to 17 Years | 0 (0.0%) | 0 (0.0%) |
| 18 to 34 Years | 0 (0.0%) | 0 (0.0%) |
| 35 to 64 Years | 0 (0.0%) | 0 (0.0%) |
| 65 to 74 Years | 0 (0.0%) | 0 (0.0%) |
| 75 Years and over | 0 (0.0%) | 0 (0.0%) |
Disability Class: Cognitive Difficulty
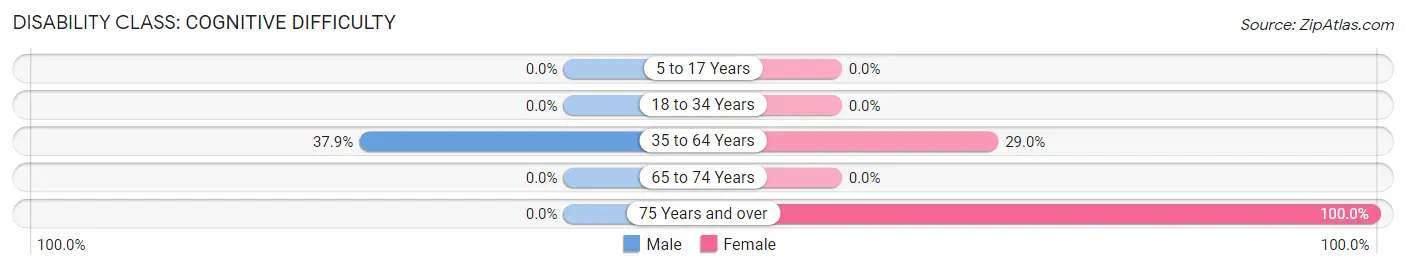
| Age Bracket | Male | Female |
| 5 to 17 Years | 0 (0.0%) | 0 (0.0%) |
| 18 to 34 Years | 0 (0.0%) | 0 (0.0%) |
| 35 to 64 Years | 11 (37.9%) | 9 (29.0%) |
| 65 to 74 Years | 0 (0.0%) | 0 (0.0%) |
| 75 Years and over | 0 (0.0%) | 12 (100.0%) |
Disability Class: Ambulatory Difficulty
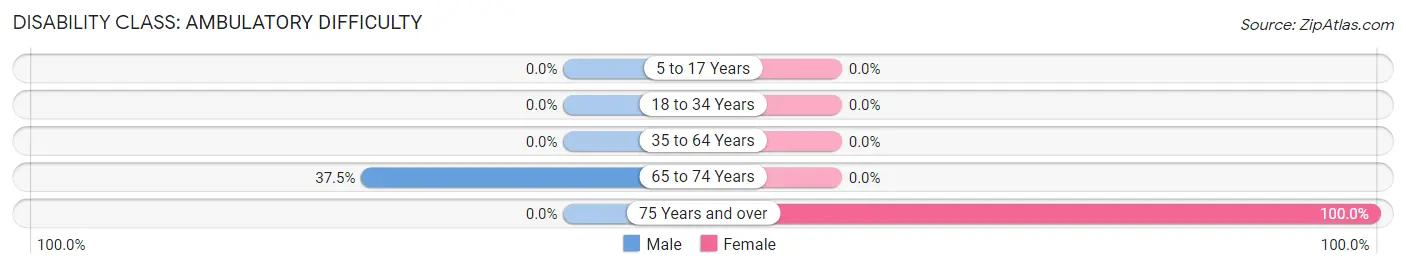
| Age Bracket | Male | Female |
| 5 to 17 Years | 0 (0.0%) | 0 (0.0%) |
| 18 to 34 Years | 0 (0.0%) | 0 (0.0%) |
| 35 to 64 Years | 0 (0.0%) | 0 (0.0%) |
| 65 to 74 Years | 6 (37.5%) | 0 (0.0%) |
| 75 Years and over | 0 (0.0%) | 12 (100.0%) |
Disability Class: Self-Care Difficulty
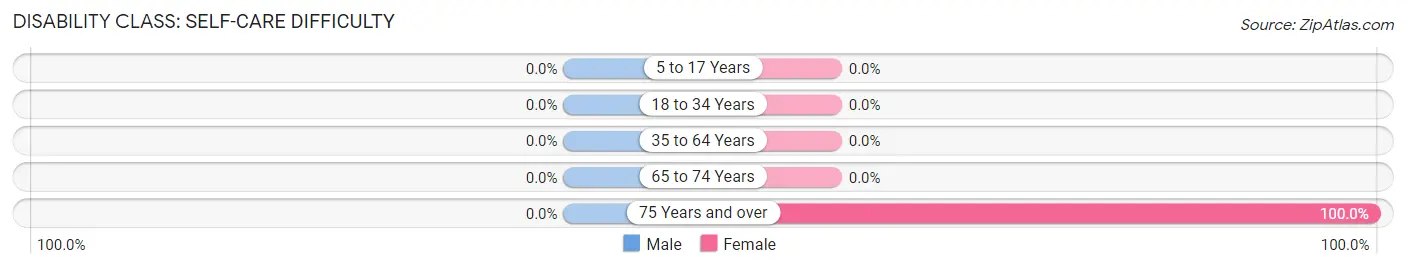
| Age Bracket | Male | Female |
| 5 to 17 Years | 0 (0.0%) | 0 (0.0%) |
| 18 to 34 Years | 0 (0.0%) | 0 (0.0%) |
| 35 to 64 Years | 0 (0.0%) | 0 (0.0%) |
| 65 to 74 Years | 0 (0.0%) | 0 (0.0%) |
| 75 Years and over | 0 (0.0%) | 12 (100.0%) |
Technology Access in Bennington
Computing Device Access in Bennington
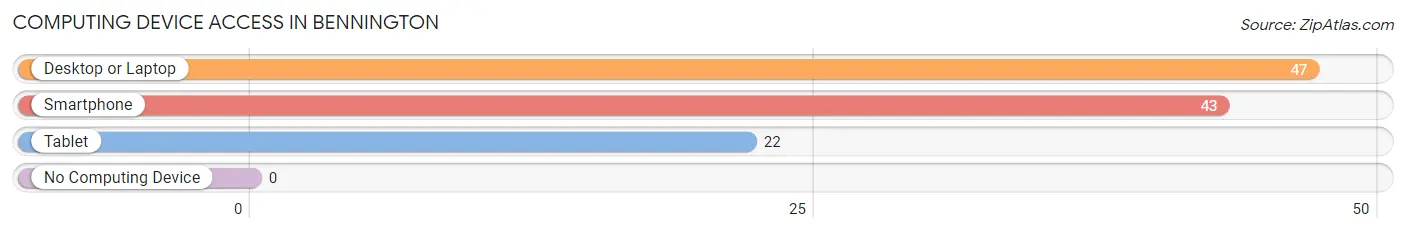
| Device Type | # Households | % Households |
| Desktop or Laptop | 47 | 82.5% |
| Smartphone | 43 | 75.4% |
| Tablet | 22 | 38.6% |
| No Computing Device | 0 | 0.0% |
| Total | 57 | 100.0% |
Internet Access in Bennington
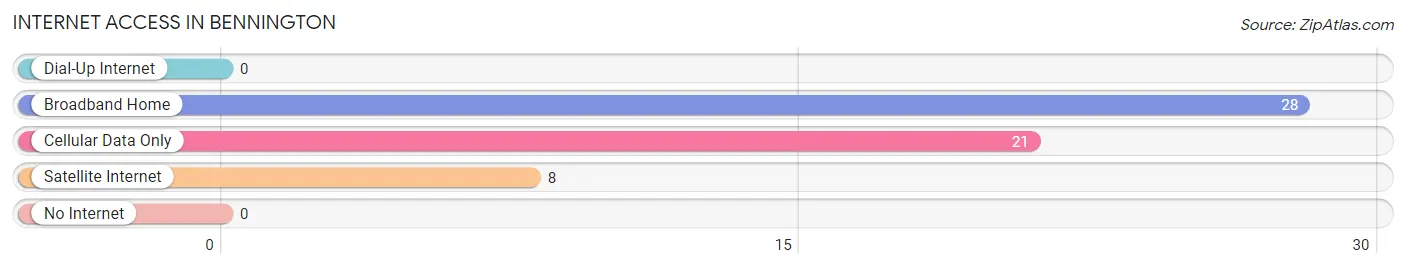
| Internet Type | # Households | % Households |
| Dial-Up Internet | 0 | 0.0% |
| Broadband Home | 28 | 49.1% |
| Cellular Data Only | 21 | 36.8% |
| Satellite Internet | 8 | 14.0% |
| No Internet | 0 | 0.0% |
| Total | 57 | 100.0% |
Bennington Summary
Bennington, Idaho is a small town located in the southeastern corner of the state, near the border of Utah. It is situated in the Snake River Valley, and is surrounded by the Owyhee Mountains to the east and the Snake River to the west. The town is home to just over 1,000 people, and is the county seat of Power County.
History
Bennington was first settled in 1883 by a group of Mormon pioneers. The town was named after Bennington, Vermont, the birthplace of one of the settlers. The town was incorporated in 1891, and the first post office was established in 1892.
In the early 1900s, Bennington was a thriving agricultural community, with many farms and ranches in the area. The town was also home to a number of businesses, including a hotel, a bank, a general store, and a blacksmith shop.
In the 1950s, the town began to decline as many of the farms and ranches in the area were sold off or abandoned. The population of Bennington dropped from over 1,000 in 1950 to just over 500 in 1970.
Geography
Bennington is located in the Snake River Valley, at an elevation of 4,400 feet. The town is surrounded by the Owyhee Mountains to the east and the Snake River to the west. The town is located about 30 miles south of Pocatello, Idaho, and about 50 miles north of Salt Lake City, Utah.
The climate in Bennington is semi-arid, with hot summers and cold winters. The average high temperature in July is 90 degrees Fahrenheit, and the average low temperature in January is 18 degrees Fahrenheit.
Economy
The economy of Bennington is largely based on agriculture. The town is home to several farms and ranches, and the surrounding area is known for its production of potatoes, wheat, and hay.
The town is also home to a number of small businesses, including a grocery store, a hardware store, and a few restaurants. There is also a small manufacturing plant in town that produces agricultural equipment.
Demographics
As of the 2010 census, the population of Bennington was 1,072. The racial makeup of the town was 95.3% White, 0.7% Native American, 0.3% Asian, 0.2% African American, and 3.5% from other races.
The median household income in Bennington was $37,500, and the median family income was $45,000. The per capita income was $17,000. About 11.5% of the population was below the poverty line.
Conclusion
Bennington, Idaho is a small town located in the southeastern corner of the state, near the border of Utah. It is situated in the Snake River Valley, and is surrounded by the Owyhee Mountains to the east and the Snake River to the west. The town is home to just over 1,000 people, and is the county seat of Power County. The economy of Bennington is largely based on agriculture, and the town is home to several farms and ranches. The town is also home to a number of small businesses, including a grocery store, a hardware store, and a few restaurants. The population of Bennington is mostly White, with a small percentage of Native American, Asian, and African American residents. The median household income in Bennington was $37,500, and the median family income was $45,000.
Common Questions
What is Per Capita Income in Bennington?
Per Capita income in Bennington is $37,023.
What is the Median Family Income in Bennington?
Median Family Income in Bennington is $79,000.
What is the Median Household income in Bennington?
Median Household Income in Bennington is $95,341.
What is Inequality or Gini Index in Bennington?
Inequality or Gini Index in Bennington is 0.22.
What is the Total Population of Bennington?
Total Population of Bennington is 142.
What is the Total Male Population of Bennington?
Total Male Population of Bennington is 54.
What is the Total Female Population of Bennington?
Total Female Population of Bennington is 88.
What is the Ratio of Males per 100 Females in Bennington?
There are 61.36 Males per 100 Females in Bennington.
What is the Ratio of Females per 100 Males in Bennington?
There are 162.96 Females per 100 Males in Bennington.
What is the Median Population Age in Bennington?
Median Population Age in Bennington is 60.4 Years.
What is the Average Family Size in Bennington
Average Family Size in Bennington is 2.9 People.
What is the Average Household Size in Bennington
Average Household Size in Bennington is 2.5 People.
How Large is the Labor Force in Bennington?
There are 59 People in the Labor Forcein in Bennington.
What is the Percentage of People in the Labor Force in Bennington?
46.5% of People are in the Labor Force in Bennington.