Union, AL Map & Demographics
Union Map
Union Overview
$19,368
PER CAPITA INCOME
$63,750
AVG FAMILY INCOME
32.9%
WAGE / INCOME GAP [ % ]
67.1¢/ $1
WAGE / INCOME GAP [ $ ]
0.47
INEQUALITY / GINI INDEX
267
TOTAL POPULATION
111
MALE POPULATION
156
FEMALE POPULATION
71.15
MALES / 100 FEMALES
140.54
FEMALES / 100 MALES
59.8
MEDIAN AGE
4.4
AVG FAMILY SIZE
2.7
AVG HOUSEHOLD SIZE
78
LABOR FORCE [ PEOPLE ]
31.0%
PERCENT IN LABOR FORCE
Union Area Codes
Income in Union
Income Overview in Union
| Characteristic | Number | Measure |
| Per Capita Income | 267 | $19,368 |
| Median Family Income | 46 | $63,750 |
| Mean Family Income | 46 | $64,359 |
| Median Household Income | 100 | $0 |
| Mean Household Income | 100 | $41,473 |
| Income Deficit | 46 | $0 |
| Wage / Income Gap (%) | 267 | 32.90% |
| Wage / Income Gap ($) | 267 | 67.10¢ per $1 |
| Gini / Inequality Index | 267 | 0.47 |
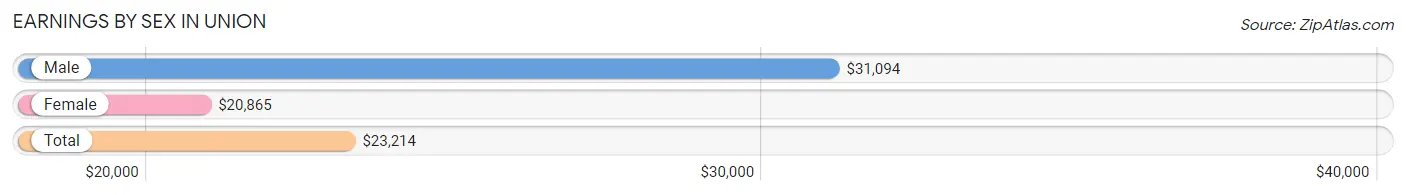
Earnings by Sex in Union
Average Earnings in Union are $23,214, $31,094 for men and $20,865 for women, a difference of 32.9%.
| Sex | Number | Average Earnings |
| Male | 27 (34.6%) | $31,094 |
| Female | 51 (65.4%) | $20,865 |
| Total | 78 (100.0%) | $23,214 |
Earnings by Sex by Income Bracket in Union
The most common earnings brackets in Union are $30,000 to $34,999 for men (8 | 29.6%) and $20,000 to $22,499 for women (13 | 25.5%).
| Income | Male | Female |
| $2,499 or less | 0 (0.0%) | 0 (0.0%) |
| $2,500 to $4,999 | 0 (0.0%) | 0 (0.0%) |
| $5,000 to $7,499 | 3 (11.1%) | 1 (2.0%) |
| $7,500 to $9,999 | 0 (0.0%) | 0 (0.0%) |
| $10,000 to $12,499 | 0 (0.0%) | 4 (7.8%) |
| $12,500 to $14,999 | 0 (0.0%) | 0 (0.0%) |
| $15,000 to $17,499 | 0 (0.0%) | 10 (19.6%) |
| $17,500 to $19,999 | 0 (0.0%) | 6 (11.8%) |
| $20,000 to $22,499 | 0 (0.0%) | 13 (25.5%) |
| $22,500 to $24,999 | 7 (25.9%) | 0 (0.0%) |
| $25,000 to $29,999 | 0 (0.0%) | 8 (15.7%) |
| $30,000 to $34,999 | 8 (29.6%) | 2 (3.9%) |
| $35,000 to $39,999 | 1 (3.7%) | 0 (0.0%) |
| $40,000 to $44,999 | 7 (25.9%) | 0 (0.0%) |
| $45,000 to $49,999 | 0 (0.0%) | 0 (0.0%) |
| $50,000 to $54,999 | 0 (0.0%) | 0 (0.0%) |
| $55,000 to $64,999 | 0 (0.0%) | 0 (0.0%) |
| $65,000 to $74,999 | 0 (0.0%) | 0 (0.0%) |
| $75,000 to $99,999 | 0 (0.0%) | 0 (0.0%) |
| $100,000+ | 1 (3.7%) | 7 (13.7%) |
| Total | 27 (100.0%) | 51 (100.0%) |
Earnings by Sex by Educational Attainment in Union
Average earnings in Union are $31,094 for men and $21,250 for women, a difference of 31.7%. Men with an educational attainment of college or associate's degree enjoy the highest average annual earnings of $30,469, while those with college or associate's degree education earn the least with $30,469. Women with an educational attainment of college or associate's degree earn the most with the average annual earnings of $21,442, while those with high school diploma education have the smallest earnings of $17,917.
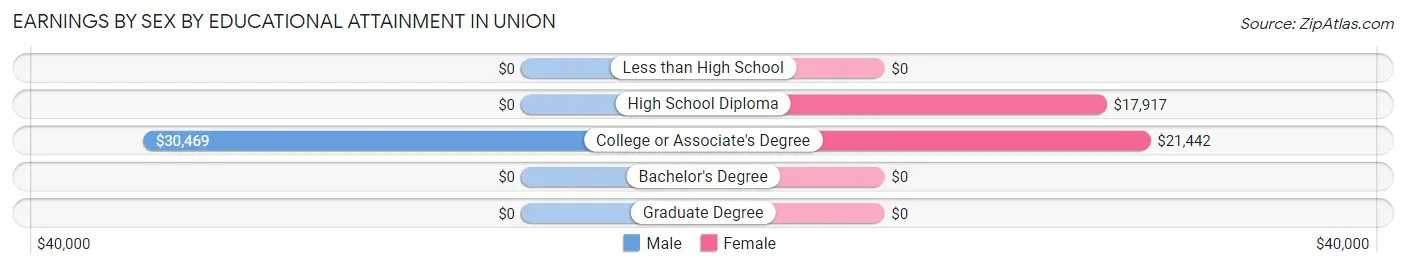
| Educational Attainment | Male Income | Female Income |
| Less than High School | - | - |
| High School Diploma | - | - |
| College or Associate's Degree | $30,469 | $21,442 |
| Bachelor's Degree | - | - |
| Graduate Degree | - | - |
| Total | $31,094 | $21,250 |
Family Income in Union
Family Income Brackets in Union
According to the Union family income data, there are 16 families falling into the $50,000 to $74,999 income range, which is the most common income bracket and makes up 34.8% of all families.
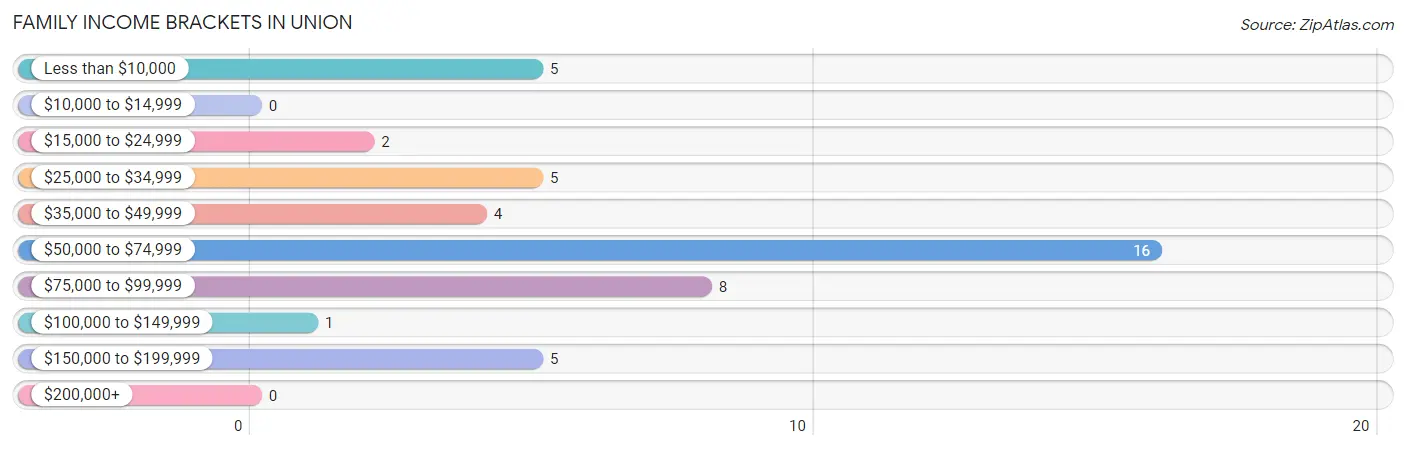
| Income Bracket | # Families | % Families |
| Less than $10,000 | 5 | 10.9% |
| $10,000 to $14,999 | 0 | 0.0% |
| $15,000 to $24,999 | 2 | 4.3% |
| $25,000 to $34,999 | 5 | 10.9% |
| $35,000 to $49,999 | 4 | 8.7% |
| $50,000 to $74,999 | 16 | 34.8% |
| $75,000 to $99,999 | 8 | 17.4% |
| $100,000 to $149,999 | 1 | 2.2% |
| $150,000 to $199,999 | 5 | 10.9% |
| $200,000+ | 0 | 0.0% |
Family Income by Famaliy Size in Union
2-person families (24 | 52.2%) account for the highest median family income in Union with $58,333 per family, while 2-person families (24 | 52.2%) have the highest median income of $29,166 per family member.
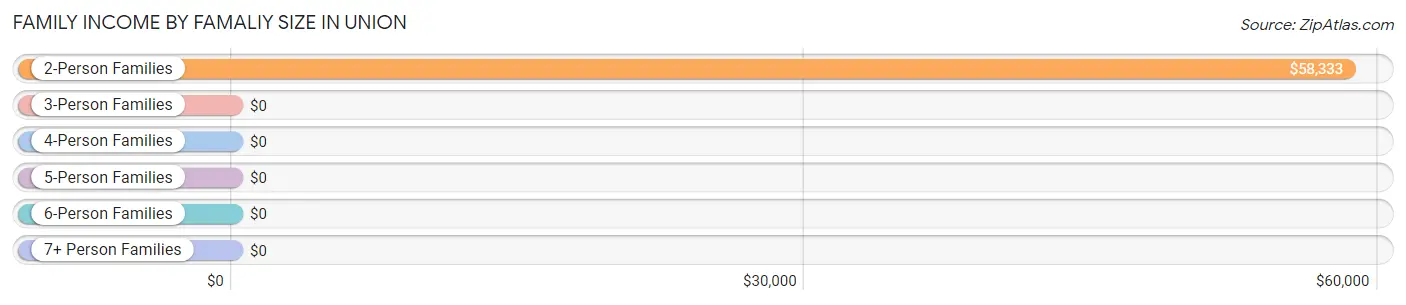
| Income Bracket | # Families | Median Income |
| 2-Person Families | 24 (52.2%) | $58,333 |
| 3-Person Families | 13 (28.3%) | $0 |
| 4-Person Families | 9 (19.6%) | $0 |
| 5-Person Families | 0 (0.0%) | $0 |
| 6-Person Families | 0 (0.0%) | $0 |
| 7+ Person Families | 0 (0.0%) | $0 |
| Total | 46 (100.0%) | $63,750 |
Family Income by Number of Earners in Union
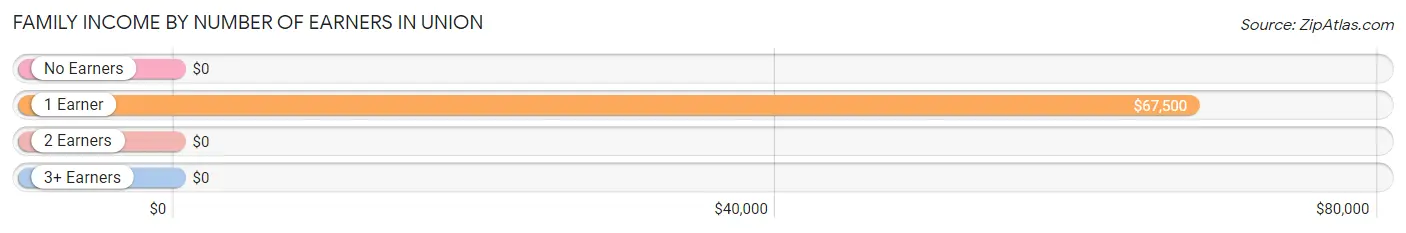
| Number of Earners | # Families | Median Income |
| No Earners | 19 (41.3%) | $0 |
| 1 Earner | 24 (52.2%) | $67,500 |
| 2 Earners | 1 (2.2%) | $0 |
| 3+ Earners | 2 (4.3%) | $0 |
| Total | 46 (100.0%) | $63,750 |
Household Income in Union
Household Income Brackets in Union
With 42 households falling in the category, the $15,000 to $24,999 income range is the most frequent in Union, accounting for 42.0% of all households.
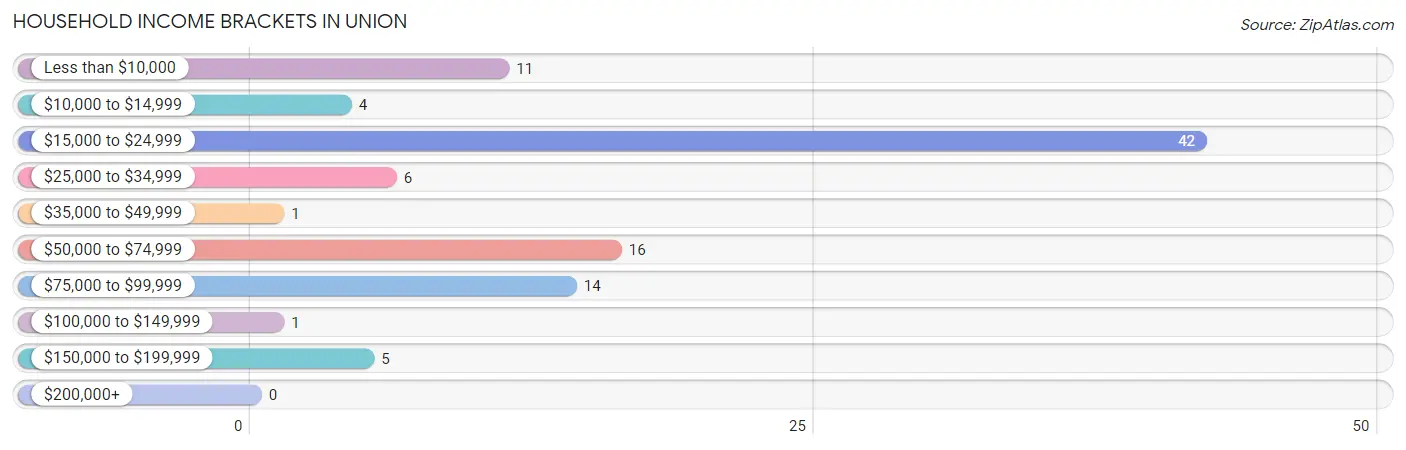
| Income Bracket | # Households | % Households |
| Less than $10,000 | 11 | 11.0% |
| $10,000 to $14,999 | 4 | 4.0% |
| $15,000 to $24,999 | 42 | 42.0% |
| $25,000 to $34,999 | 6 | 6.0% |
| $35,000 to $49,999 | 1 | 1.0% |
| $50,000 to $74,999 | 16 | 16.0% |
| $75,000 to $99,999 | 14 | 14.0% |
| $100,000 to $149,999 | 1 | 1.0% |
| $150,000 to $199,999 | 5 | 5.0% |
| $200,000+ | 0 | 0.0% |
Household Income by Householder Age in Union
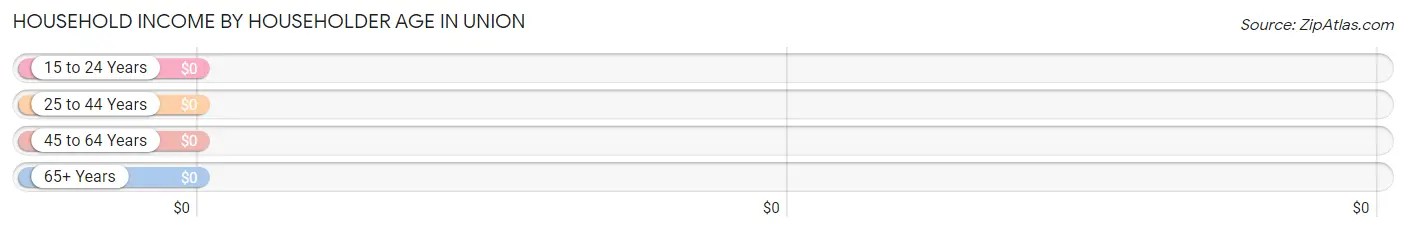
| Income Bracket | # Households | Median Income |
| 15 to 24 Years | 0 (0.0%) | $0 |
| 25 to 44 Years | 4 (4.0%) | $0 |
| 45 to 64 Years | 32 (32.0%) | $0 |
| 65+ Years | 64 (64.0%) | $0 |
| Total | 100 (100.0%) | $0 |
Poverty in Union
Income Below Poverty by Sex and Age in Union
With 9.0% poverty level for males and 6.5% for females among the residents of Union, under 5 year old males and 55 to 64 year old females are the most vulnerable to poverty, with 5 males (100.0%) and 9 females (17.3%) in their respective age groups living below the poverty level.
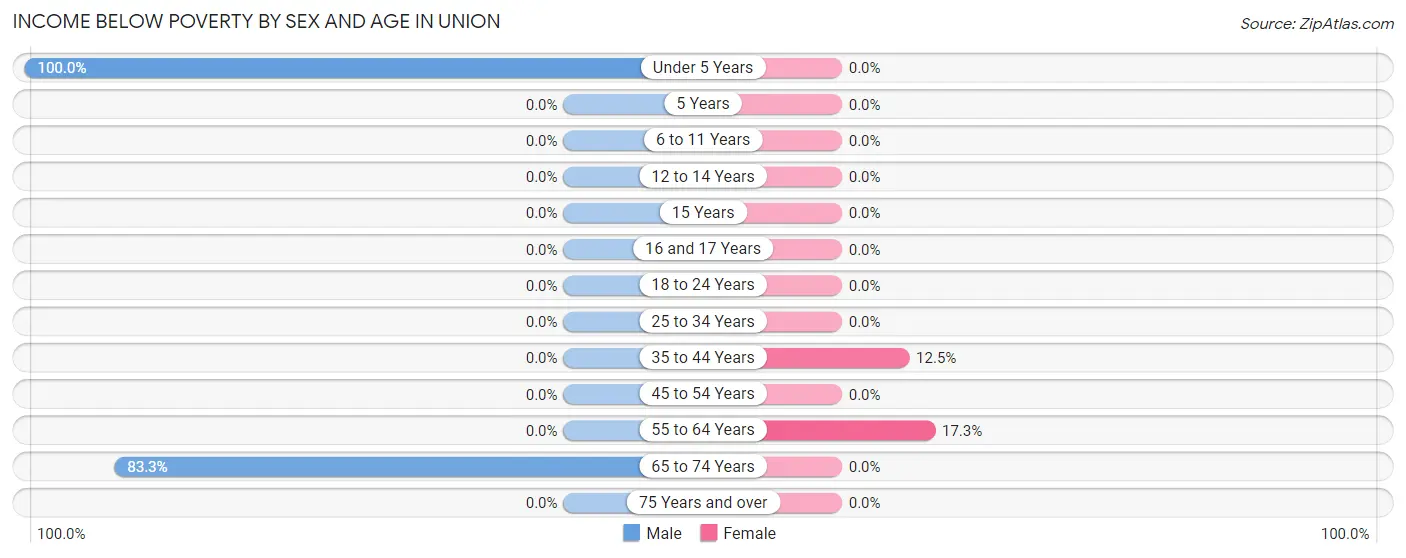
| Age Bracket | Male | Female |
| Under 5 Years | 5 (100.0%) | 0 (0.0%) |
| 5 Years | 0 (0.0%) | 0 (0.0%) |
| 6 to 11 Years | 0 (0.0%) | 0 (0.0%) |
| 12 to 14 Years | 0 (0.0%) | 0 (0.0%) |
| 15 Years | 0 (0.0%) | 0 (0.0%) |
| 16 and 17 Years | 0 (0.0%) | 0 (0.0%) |
| 18 to 24 Years | 0 (0.0%) | 0 (0.0%) |
| 25 to 34 Years | 0 (0.0%) | 0 (0.0%) |
| 35 to 44 Years | 0 (0.0%) | 1 (12.5%) |
| 45 to 54 Years | 0 (0.0%) | 0 (0.0%) |
| 55 to 64 Years | 0 (0.0%) | 9 (17.3%) |
| 65 to 74 Years | 5 (83.3%) | 0 (0.0%) |
| 75 Years and over | 0 (0.0%) | 0 (0.0%) |
| Total | 10 (9.0%) | 10 (6.5%) |
Income Above Poverty by Sex and Age in Union
According to the poverty statistics in Union, males aged 12 to 14 years and females aged 6 to 11 years are the age groups that are most secure financially, with 100.0% of males and 100.0% of females in these age groups living above the poverty line.
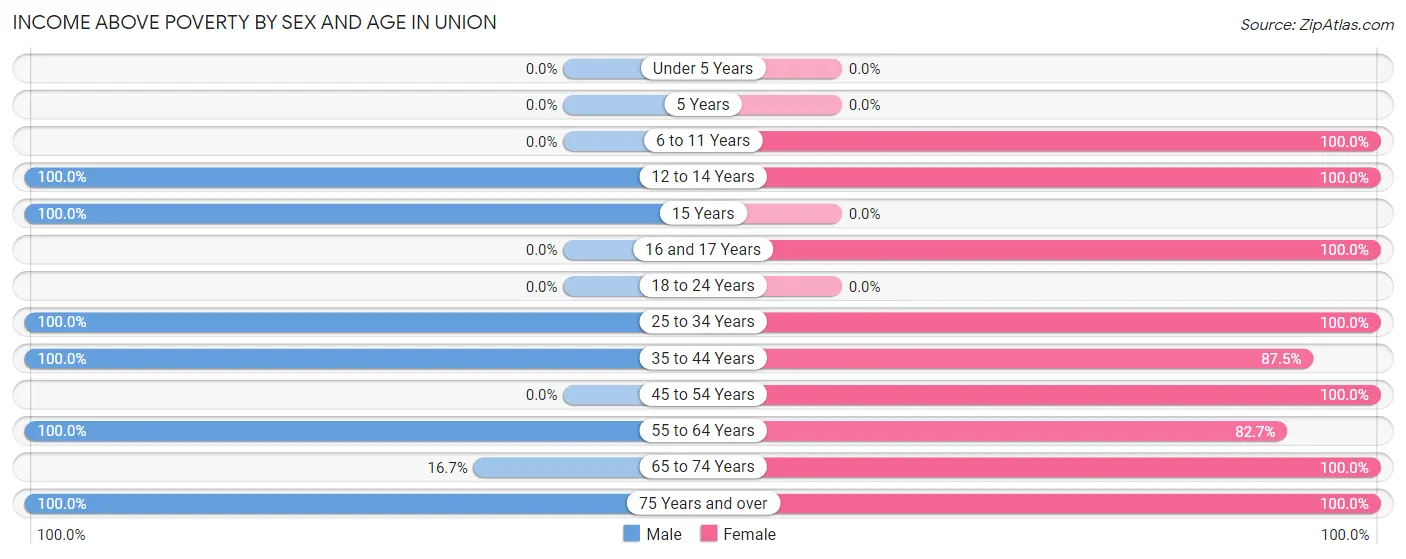
| Age Bracket | Male | Female |
| Under 5 Years | 0 (0.0%) | 0 (0.0%) |
| 5 Years | 0 (0.0%) | 0 (0.0%) |
| 6 to 11 Years | 0 (0.0%) | 3 (100.0%) |
| 12 to 14 Years | 2 (100.0%) | 1 (100.0%) |
| 15 Years | 1 (100.0%) | 0 (0.0%) |
| 16 and 17 Years | 0 (0.0%) | 4 (100.0%) |
| 18 to 24 Years | 0 (0.0%) | 0 (0.0%) |
| 25 to 34 Years | 23 (100.0%) | 19 (100.0%) |
| 35 to 44 Years | 41 (100.0%) | 7 (87.5%) |
| 45 to 54 Years | 0 (0.0%) | 1 (100.0%) |
| 55 to 64 Years | 3 (100.0%) | 43 (82.7%) |
| 65 to 74 Years | 1 (16.7%) | 18 (100.0%) |
| 75 Years and over | 30 (100.0%) | 47 (100.0%) |
| Total | 101 (91.0%) | 143 (93.5%) |
Income Below Poverty Among Married-Couple Families in Union
| Children | Above Poverty | Below Poverty |
| No Children | 14 (100.0%) | 0 (0.0%) |
| 1 or 2 Children | 2 (100.0%) | 0 (0.0%) |
| 3 or 4 Children | 0 (0.0%) | 0 (0.0%) |
| 5 or more Children | 0 (0.0%) | 0 (0.0%) |
| Total | 16 (100.0%) | 0 (0.0%) |
Income Below Poverty Among Single-Parent Households in Union
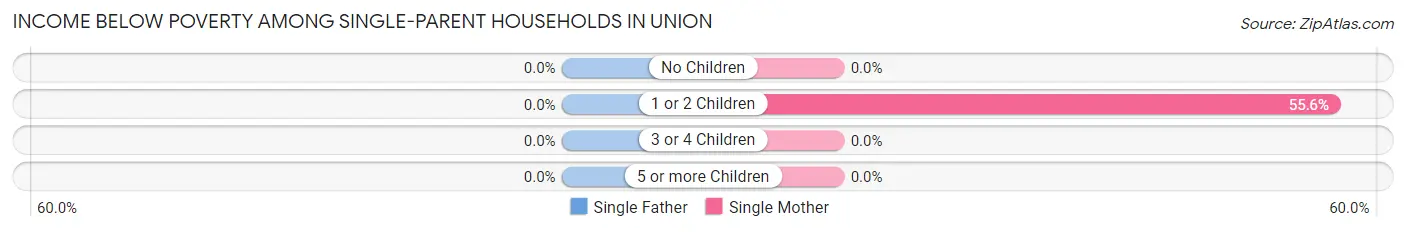
| Children | Single Father | Single Mother |
| No Children | 0 (0.0%) | 0 (0.0%) |
| 1 or 2 Children | 0 (0.0%) | 5 (55.6%) |
| 3 or 4 Children | 0 (0.0%) | 0 (0.0%) |
| 5 or more Children | 0 (0.0%) | 0 (0.0%) |
| Total | 0 (0.0%) | 5 (22.7%) |
Income Below Poverty Among Married-Couple vs Single-Parent Households in Union
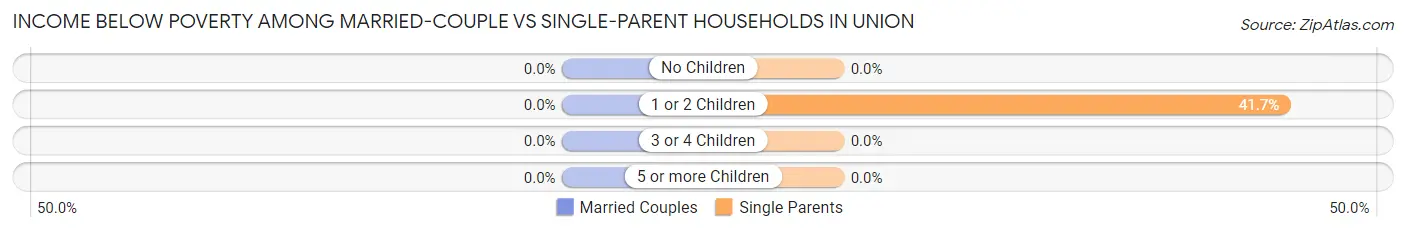
| Children | Married-Couple Families | Single-Parent Households |
| No Children | 0 (0.0%) | 0 (0.0%) |
| 1 or 2 Children | 0 (0.0%) | 5 (41.7%) |
| 3 or 4 Children | 0 (0.0%) | 0 (0.0%) |
| 5 or more Children | 0 (0.0%) | 0 (0.0%) |
| Total | 0 (0.0%) | 5 (16.7%) |
Race in Union
The most populous races in Union are Black / African American (251 | 94.0%), White / Caucasian (11 | 4.1%), and Two or more Races (5 | 1.9%).
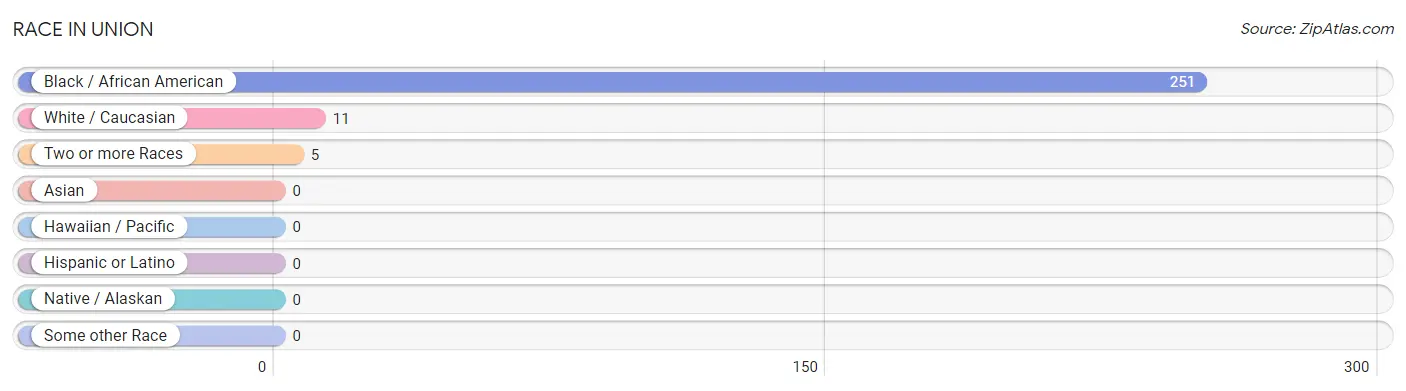
| Race | # Population | % Population |
| Asian | 0 | 0.0% |
| Black / African American | 251 | 94.0% |
| Hawaiian / Pacific | 0 | 0.0% |
| Hispanic or Latino | 0 | 0.0% |
| Native / Alaskan | 0 | 0.0% |
| White / Caucasian | 11 | 4.1% |
| Two or more Races | 5 | 1.9% |
| Some other Race | 0 | 0.0% |
| Total | 267 | 100.0% |
Ancestry in Union
The most populous ancestries reported in Union are , and American (3 | 1.1%), together accounting for 1.1% of all Union residents.

| Ancestry | # Population | % Population |
| American | 3 | 1.1% | View All 1 Rows |
Immigrants in Union

| Immigration Origin | # Population | % Population | View All 0 Rows |
Sex and Age in Union
Sex and Age in Union
The most populous age groups in Union are 75 to 79 Years (26 | 23.4%) for men and 55 to 59 Years (26 | 16.7%) for women.
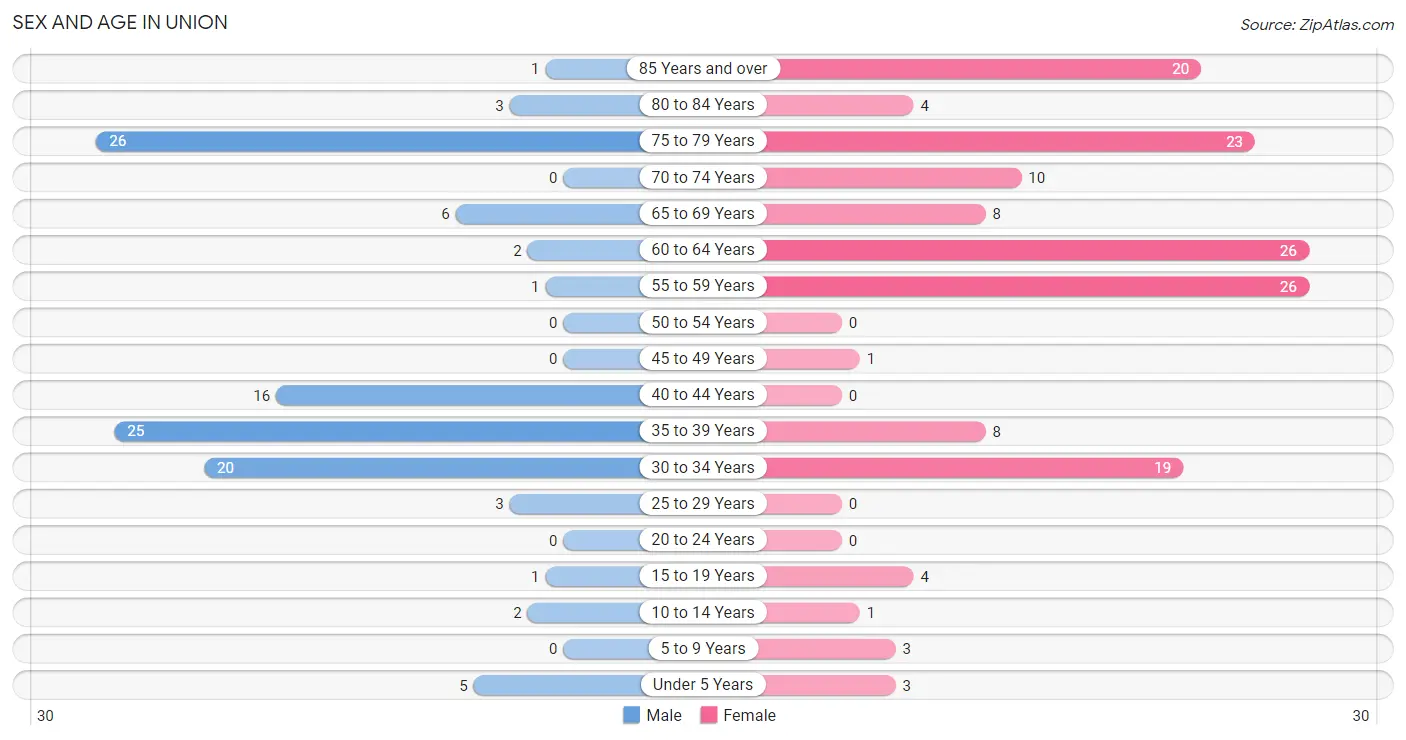
| Age Bracket | Male | Female |
| Under 5 Years | 5 (4.5%) | 3 (1.9%) |
| 5 to 9 Years | 0 (0.0%) | 3 (1.9%) |
| 10 to 14 Years | 2 (1.8%) | 1 (0.6%) |
| 15 to 19 Years | 1 (0.9%) | 4 (2.6%) |
| 20 to 24 Years | 0 (0.0%) | 0 (0.0%) |
| 25 to 29 Years | 3 (2.7%) | 0 (0.0%) |
| 30 to 34 Years | 20 (18.0%) | 19 (12.2%) |
| 35 to 39 Years | 25 (22.5%) | 8 (5.1%) |
| 40 to 44 Years | 16 (14.4%) | 0 (0.0%) |
| 45 to 49 Years | 0 (0.0%) | 1 (0.6%) |
| 50 to 54 Years | 0 (0.0%) | 0 (0.0%) |
| 55 to 59 Years | 1 (0.9%) | 26 (16.7%) |
| 60 to 64 Years | 2 (1.8%) | 26 (16.7%) |
| 65 to 69 Years | 6 (5.4%) | 8 (5.1%) |
| 70 to 74 Years | 0 (0.0%) | 10 (6.4%) |
| 75 to 79 Years | 26 (23.4%) | 23 (14.7%) |
| 80 to 84 Years | 3 (2.7%) | 4 (2.6%) |
| 85 Years and over | 1 (0.9%) | 20 (12.8%) |
| Total | 111 (100.0%) | 156 (100.0%) |
Families and Households in Union
Median Family Size in Union
The median family size in Union is 4.41 persons per family, with married-couple families (16 | 34.8%) accounting for the largest median family size of 6.06 persons per family. On the other hand, single male/father families (8 | 17.4%) represent the smallest median family size with 3.50 persons per family.
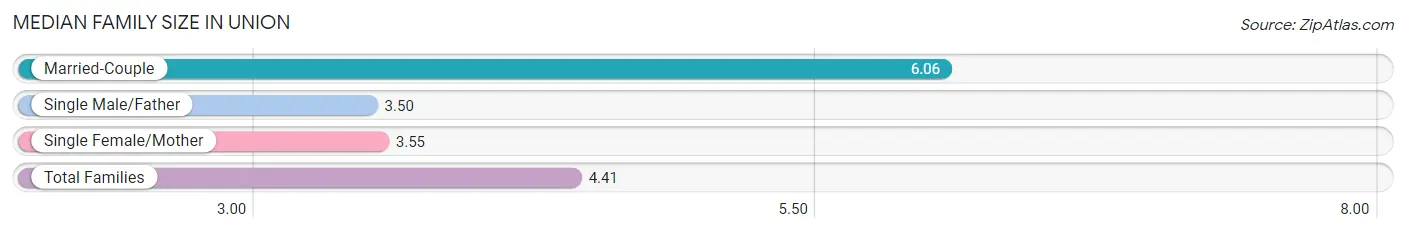
| Family Type | # Families | Family Size |
| Married-Couple | 16 (34.8%) | 6.06 |
| Single Male/Father | 8 (17.4%) | 3.50 |
| Single Female/Mother | 22 (47.8%) | 3.55 |
| Total Families | 46 (100.0%) | 4.41 |
Median Household Size in Union
The median household size in Union is 2.67 persons per household, with married-couple households (16 | 16.0%) accounting for the largest median household size of 6.06 persons per household. non-family households (54 | 54.0%) represent the smallest median household size with 1.17 persons per household.
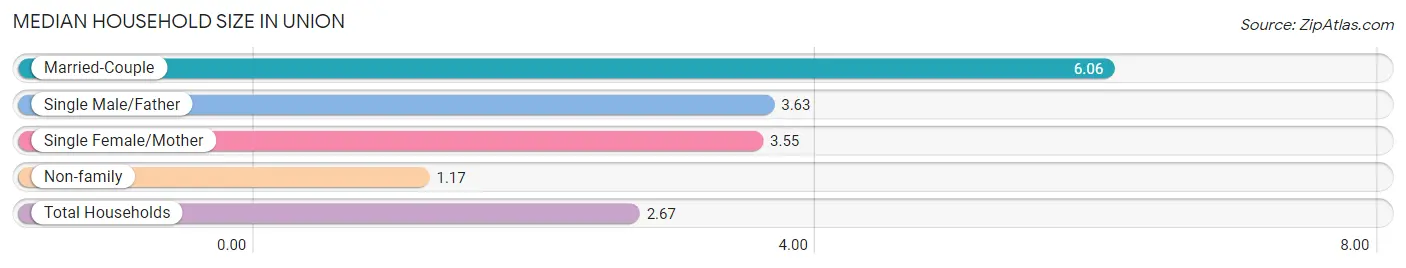
| Household Type | # Households | Household Size |
| Married-Couple | 16 (16.0%) | 6.06 |
| Single Male/Father | 8 (8.0%) | 3.63 |
| Single Female/Mother | 22 (22.0%) | 3.55 |
| Non-family | 54 (54.0%) | 1.17 |
| Total Households | 100 (100.0%) | 2.67 |
Household Size by Marriage Status in Union
Out of a total of 100 households in Union, 46 (46.0%) are family households, while 54 (54.0%) are nonfamily households. The most numerous type of family households are 2-person households, comprising 24, and the most common type of nonfamily households are 1-person households, comprising 52.
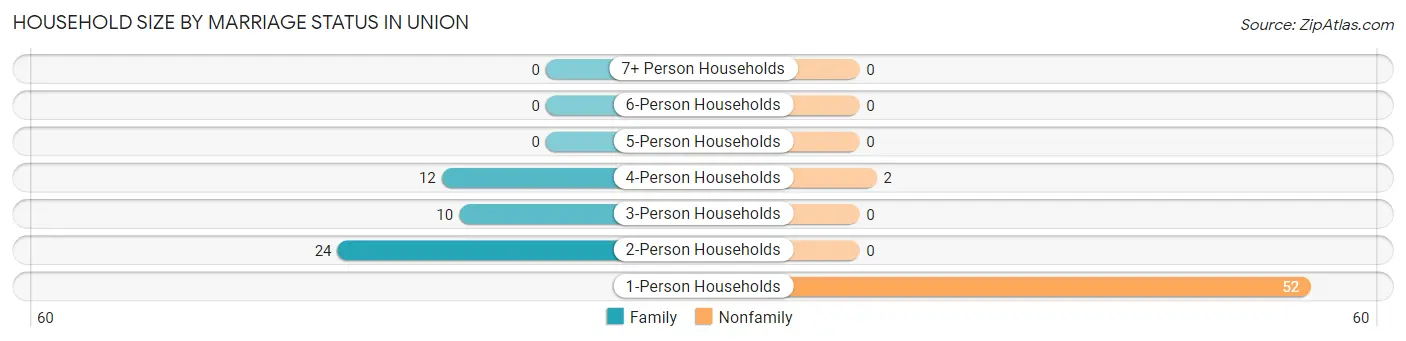
| Household Size | Family Households | Nonfamily Households |
| 1-Person Households | - | 52 (52.0%) |
| 2-Person Households | 24 (24.0%) | 0 (0.0%) |
| 3-Person Households | 10 (10.0%) | 0 (0.0%) |
| 4-Person Households | 12 (12.0%) | 2 (2.0%) |
| 5-Person Households | 0 (0.0%) | 0 (0.0%) |
| 6-Person Households | 0 (0.0%) | 0 (0.0%) |
| 7+ Person Households | 0 (0.0%) | 0 (0.0%) |
| Total | 46 (46.0%) | 54 (54.0%) |
Female Fertility in Union
Fertility by Age in Union
| Age Bracket | Women with Births | Births / 1,000 Women |
| 15 to 19 years | 0 (0.0%) | 0.0 |
| 20 to 34 years | 0 (0.0%) | 0.0 |
| 35 to 50 years | 0 (0.0%) | 0.0 |
| Total | 0 (0.0%) | 0.0 |
Fertility by Age by Marriage Status in Union
| Age Bracket | Married | Unmarried |
| 15 to 19 years | 0 (0.0%) | 0 (0.0%) |
| 20 to 34 years | 0 (0.0%) | 0 (0.0%) |
| 35 to 50 years | 0 (0.0%) | 0 (0.0%) |
| Total | 0 (0.0%) | 0 (0.0%) |
Fertility by Education in Union
| Educational Attainment | Women with Births | Births / 1,000 Women |
| Less than High School | 0 (0.0%) | 0.0 |
| High School Diploma | 0 (0.0%) | 0.0 |
| College or Associate's Degree | 0 (0.0%) | 0.0 |
| Bachelor's Degree | 0 (0.0%) | 0.0 |
| Graduate Degree | 0 (0.0%) | 0.0 |
| Total | 0 (0.0%) | 0.0 |
Fertility by Education by Marriage Status in Union
| Educational Attainment | Married | Unmarried |
| Less than High School | 0 (0.0%) | 0 (0.0%) |
| High School Diploma | 0 (0.0%) | 0 (0.0%) |
| College or Associate's Degree | 0 (0.0%) | 0 (0.0%) |
| Bachelor's Degree | 0 (0.0%) | 0 (0.0%) |
| Graduate Degree | 0 (0.0%) | 0 (0.0%) |
| Total | 0 (0.0%) | 0 (0.0%) |
Employment Characteristics in Union
Employment by Class of Employer in Union
Among the 74 employed individuals in Union, private company employees (53 | 71.6%), self-employed (incorporated) (10 | 13.5%), and local government employees (8 | 10.8%) make up the most common classes of employment.
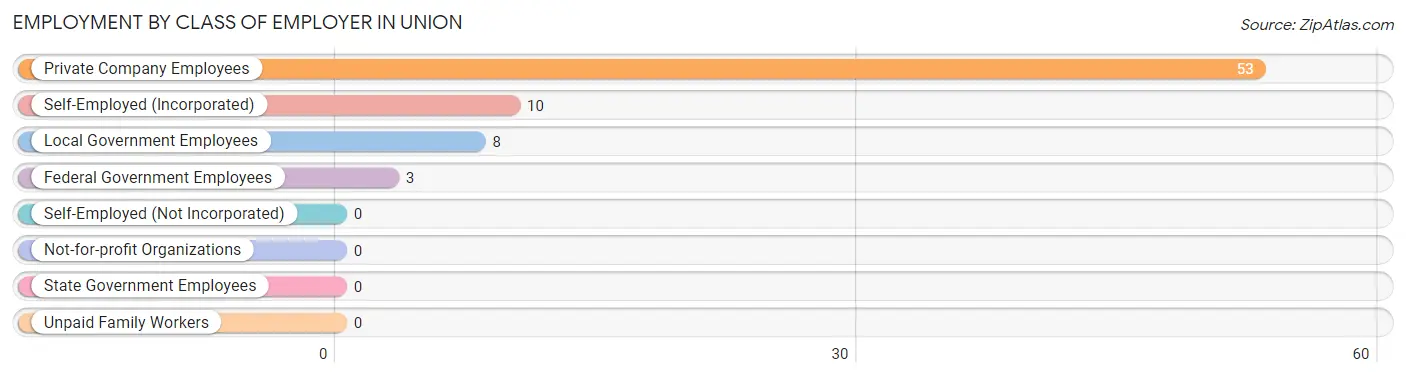
| Employer Class | # Employees | % Employees |
| Private Company Employees | 53 | 71.6% |
| Self-Employed (Incorporated) | 10 | 13.5% |
| Self-Employed (Not Incorporated) | 0 | 0.0% |
| Not-for-profit Organizations | 0 | 0.0% |
| Local Government Employees | 8 | 10.8% |
| State Government Employees | 0 | 0.0% |
| Federal Government Employees | 3 | 4.1% |
| Unpaid Family Workers | 0 | 0.0% |
| Total | 74 | 100.0% |
Employment Status by Age in Union
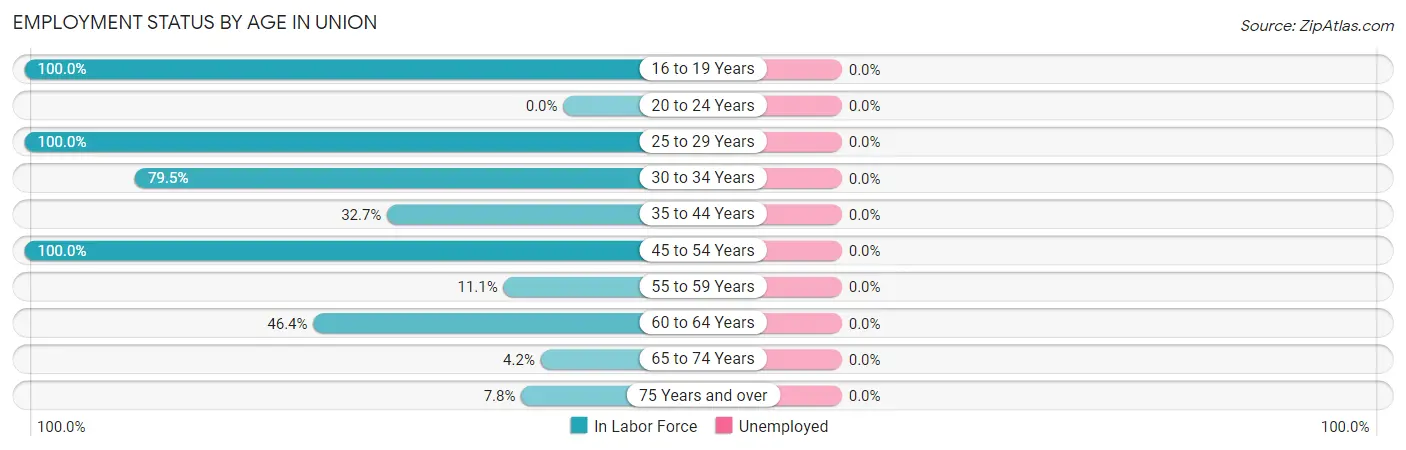
| Age Bracket | In Labor Force | Unemployed |
| 16 to 19 Years | 4 (100.0%) | 0 (0.0%) |
| 20 to 24 Years | 0 (0.0%) | 0 (0.0%) |
| 25 to 29 Years | 3 (100.0%) | 0 (0.0%) |
| 30 to 34 Years | 31 (79.5%) | 0 (0.0%) |
| 35 to 44 Years | 16 (32.7%) | 0 (0.0%) |
| 45 to 54 Years | 1 (100.0%) | 0 (0.0%) |
| 55 to 59 Years | 3 (11.1%) | 0 (0.0%) |
| 60 to 64 Years | 13 (46.4%) | 0 (0.0%) |
| 65 to 74 Years | 1 (4.2%) | 0 (0.0%) |
| 75 Years and over | 6 (7.8%) | 0 (0.0%) |
| Total | 78 (31.0%) | 0 (0.0%) |
Employment Status by Educational Attainment in Union
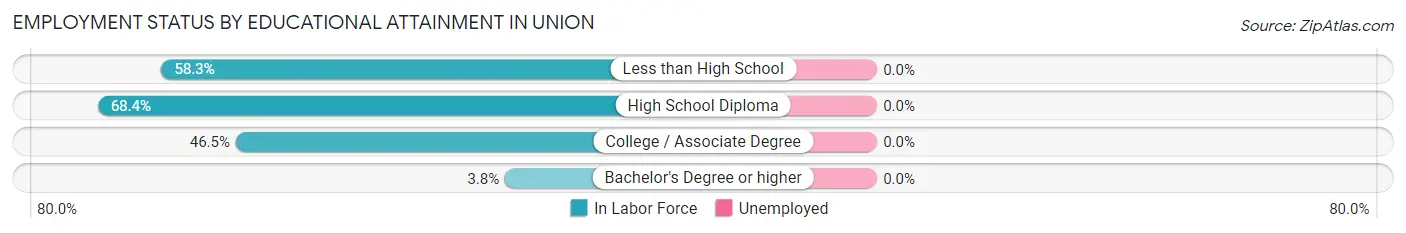
| Educational Attainment | In Labor Force | Unemployed |
| Less than High School | 7 (58.3%) | 0 (0.0%) |
| High School Diploma | 26 (68.4%) | 0 (0.0%) |
| College / Associate Degree | 33 (46.5%) | 0 (0.0%) |
| Bachelor's Degree or higher | 1 (3.8%) | 0 (0.0%) |
| Total | 67 (45.6%) | 0 (0.0%) |
Employment Occupations by Sex in Union
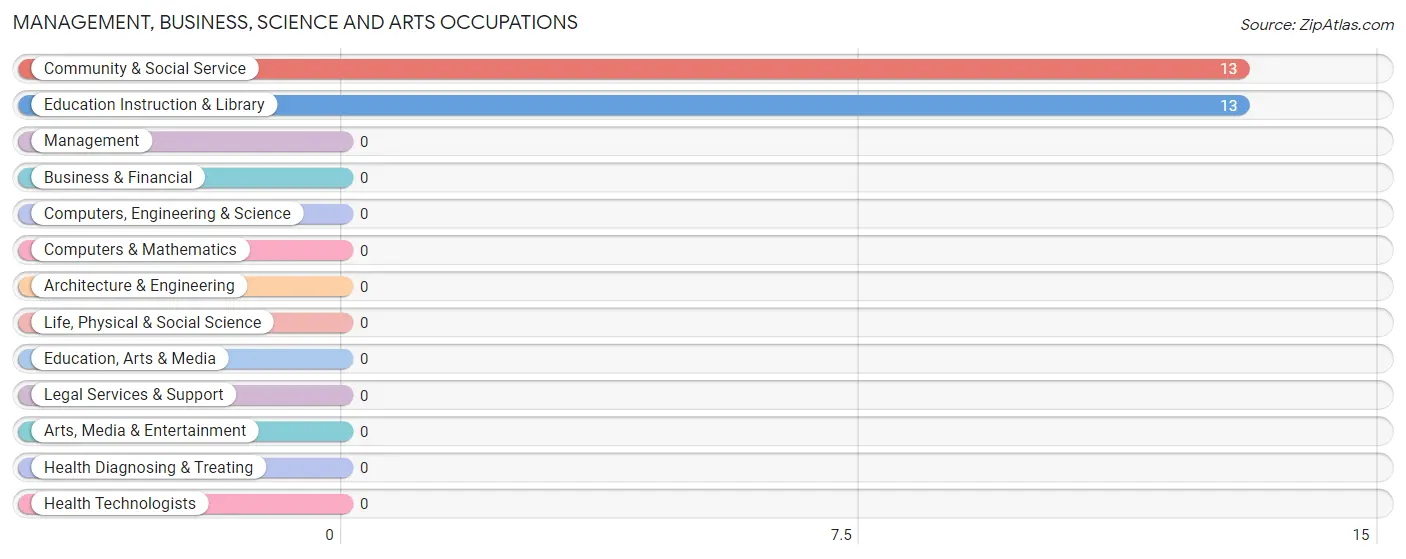
Management, Business, Science and Arts Occupations
The most common Management, Business, Science and Arts occupations in Union are Community & Social Service (13 | 16.7%), and Education Instruction & Library (13 | 16.7%).
Management, Business, Science and Arts Occupations by Sex
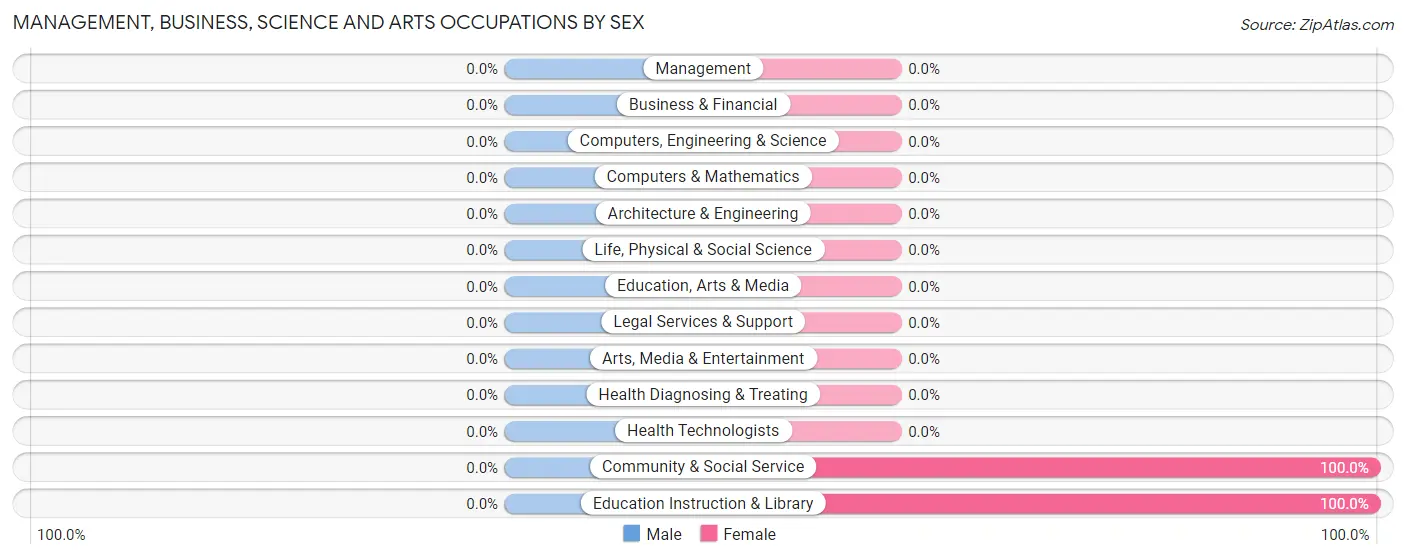
| Occupation | Male | Female |
| Management | 0 (0.0%) | 0 (0.0%) |
| Business & Financial | 0 (0.0%) | 0 (0.0%) |
| Computers, Engineering & Science | 0 (0.0%) | 0 (0.0%) |
| Computers & Mathematics | 0 (0.0%) | 0 (0.0%) |
| Architecture & Engineering | 0 (0.0%) | 0 (0.0%) |
| Life, Physical & Social Science | 0 (0.0%) | 0 (0.0%) |
| Community & Social Service | 0 (0.0%) | 13 (100.0%) |
| Education, Arts & Media | 0 (0.0%) | 0 (0.0%) |
| Legal Services & Support | 0 (0.0%) | 0 (0.0%) |
| Education Instruction & Library | 0 (0.0%) | 13 (100.0%) |
| Arts, Media & Entertainment | 0 (0.0%) | 0 (0.0%) |
| Health Diagnosing & Treating | 0 (0.0%) | 0 (0.0%) |
| Health Technologists | 0 (0.0%) | 0 (0.0%) |
| Total (Category) | 0 (0.0%) | 13 (100.0%) |
| Total (Overall) | 27 (34.6%) | 51 (65.4%) |
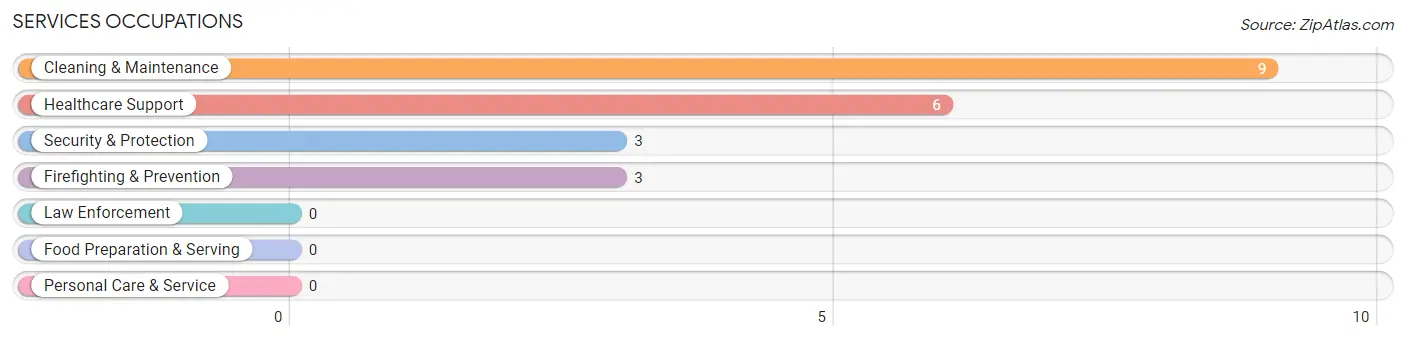
Services Occupations
The most common Services occupations in Union are Cleaning & Maintenance (9 | 11.5%), Healthcare Support (6 | 7.7%), Security & Protection (3 | 3.8%), and Firefighting & Prevention (3 | 3.8%).
Services Occupations by Sex
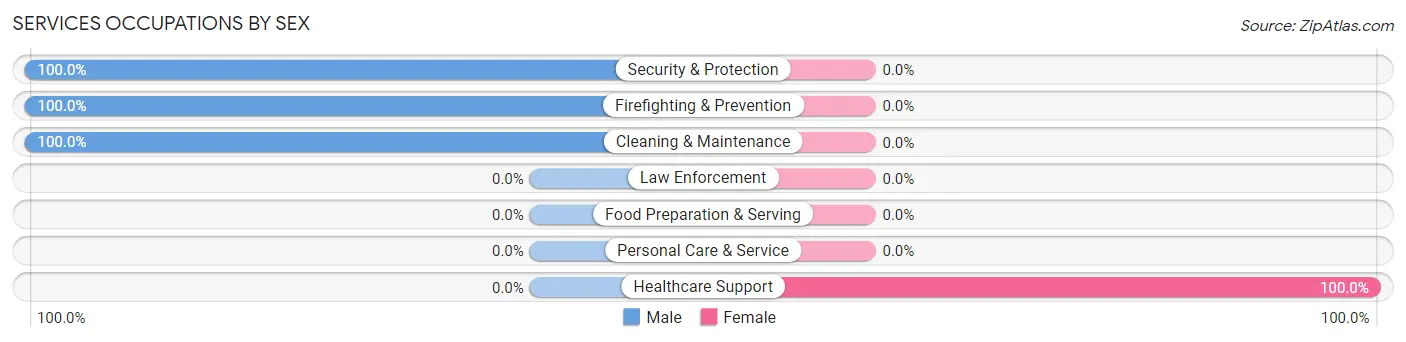
| Occupation | Male | Female |
| Healthcare Support | 0 (0.0%) | 6 (100.0%) |
| Security & Protection | 3 (100.0%) | 0 (0.0%) |
| Firefighting & Prevention | 3 (100.0%) | 0 (0.0%) |
| Law Enforcement | 0 (0.0%) | 0 (0.0%) |
| Food Preparation & Serving | 0 (0.0%) | 0 (0.0%) |
| Cleaning & Maintenance | 9 (100.0%) | 0 (0.0%) |
| Personal Care & Service | 0 (0.0%) | 0 (0.0%) |
| Total (Category) | 12 (66.7%) | 6 (33.3%) |
| Total (Overall) | 27 (34.6%) | 51 (65.4%) |
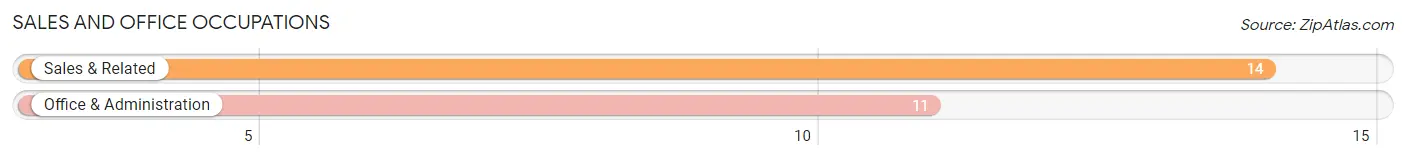
Sales and Office Occupations
The most common Sales and Office occupations in Union are Sales & Related (14 | 17.9%), and Office & Administration (11 | 14.1%).
Sales and Office Occupations by Sex
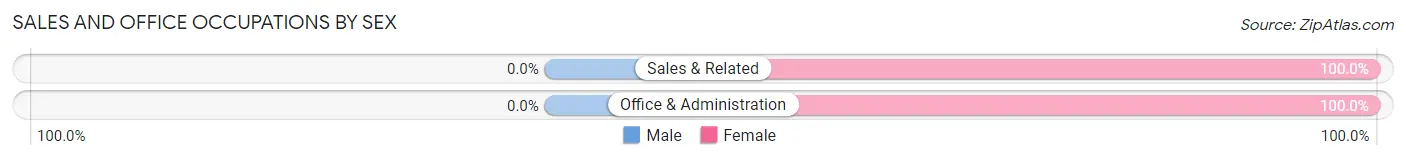
| Occupation | Male | Female |
| Sales & Related | 0 (0.0%) | 14 (100.0%) |
| Office & Administration | 0 (0.0%) | 11 (100.0%) |
| Total (Category) | 0 (0.0%) | 25 (100.0%) |
| Total (Overall) | 27 (34.6%) | 51 (65.4%) |
Natural Resources, Construction and Maintenance Occupations
The most common Natural Resources, Construction and Maintenance occupations in Union are , and Installation, Maintenance & Repair (8 | 10.3%).
Natural Resources, Construction and Maintenance Occupations by Sex
| Occupation | Male | Female |
| Farming, Fishing & Forestry | 0 (0.0%) | 0 (0.0%) |
| Construction & Extraction | 0 (0.0%) | 0 (0.0%) |
| Installation, Maintenance & Repair | 8 (100.0%) | 0 (0.0%) |
| Total (Category) | 8 (100.0%) | 0 (0.0%) |
| Total (Overall) | 27 (34.6%) | 51 (65.4%) |
Production, Transportation and Moving Occupations
The most common Production, Transportation and Moving occupations in Union are Production (8 | 10.3%), Material Moving (5 | 6.4%), and Transportation (1 | 1.3%).
Production, Transportation and Moving Occupations by Sex
| Occupation | Male | Female |
| Production | 1 (12.5%) | 7 (87.5%) |
| Transportation | 1 (100.0%) | 0 (0.0%) |
| Material Moving | 5 (100.0%) | 0 (0.0%) |
| Total (Category) | 7 (50.0%) | 7 (50.0%) |
| Total (Overall) | 27 (34.6%) | 51 (65.4%) |
Employment Industries by Sex in Union
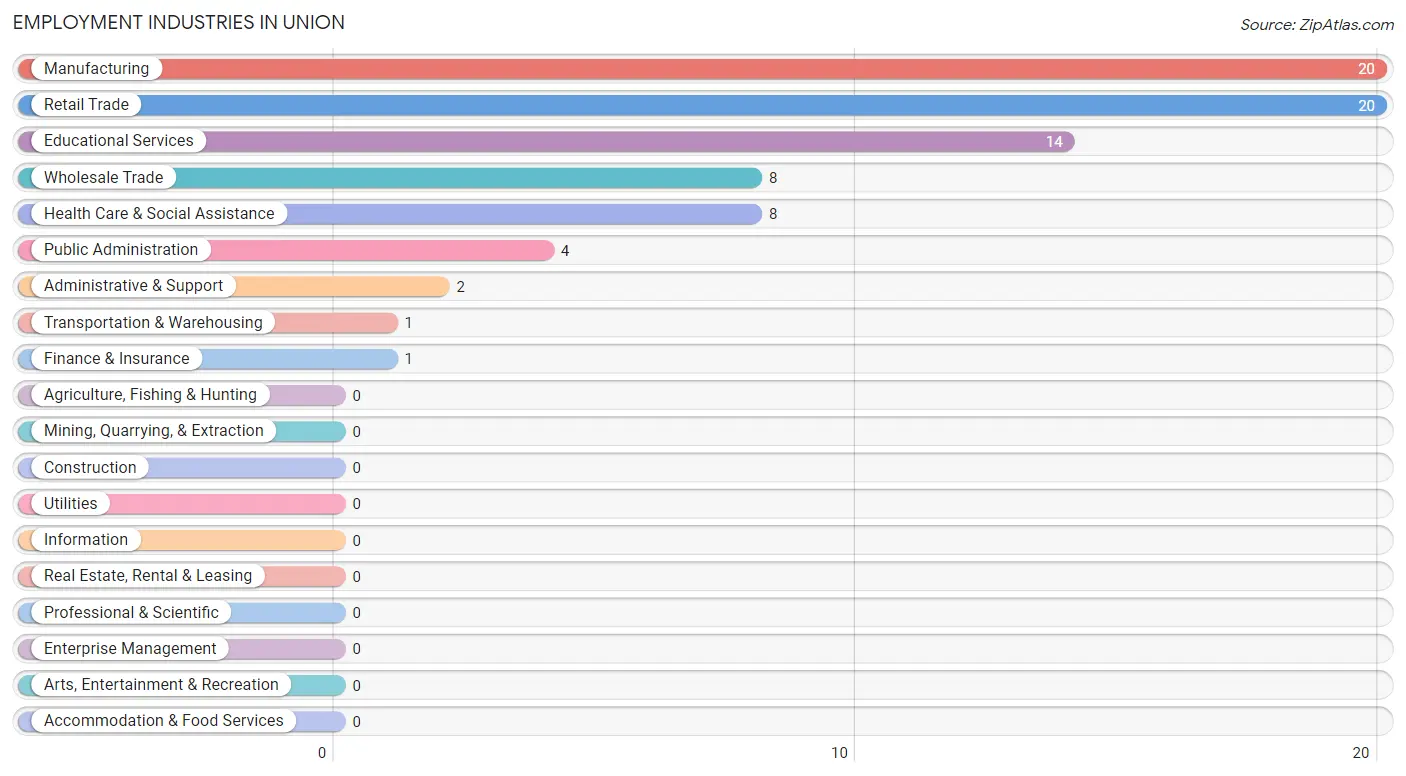
Employment Industries in Union
The major employment industries in Union include Manufacturing (20 | 25.6%), Retail Trade (20 | 25.6%), Educational Services (14 | 17.9%), Wholesale Trade (8 | 10.3%), and Health Care & Social Assistance (8 | 10.3%).
Employment Industries by Sex in Union
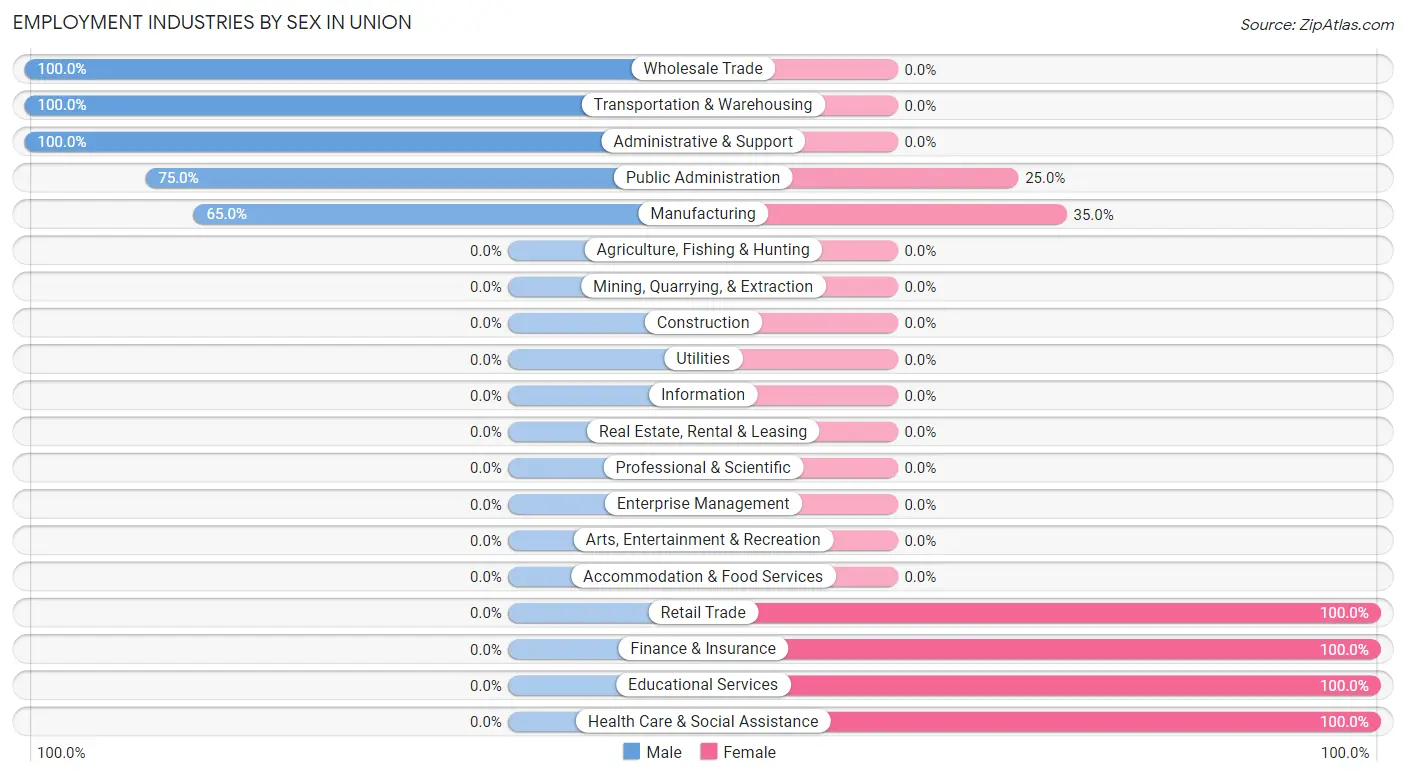
The Union industries that see more men than women are Wholesale Trade (100.0%), Transportation & Warehousing (100.0%), and Administrative & Support (100.0%), whereas the industries that tend to have a higher number of women are Retail Trade (100.0%), Finance & Insurance (100.0%), and Educational Services (100.0%).
| Industry | Male | Female |
| Agriculture, Fishing & Hunting | 0 (0.0%) | 0 (0.0%) |
| Mining, Quarrying, & Extraction | 0 (0.0%) | 0 (0.0%) |
| Construction | 0 (0.0%) | 0 (0.0%) |
| Manufacturing | 13 (65.0%) | 7 (35.0%) |
| Wholesale Trade | 8 (100.0%) | 0 (0.0%) |
| Retail Trade | 0 (0.0%) | 20 (100.0%) |
| Transportation & Warehousing | 1 (100.0%) | 0 (0.0%) |
| Utilities | 0 (0.0%) | 0 (0.0%) |
| Information | 0 (0.0%) | 0 (0.0%) |
| Finance & Insurance | 0 (0.0%) | 1 (100.0%) |
| Real Estate, Rental & Leasing | 0 (0.0%) | 0 (0.0%) |
| Professional & Scientific | 0 (0.0%) | 0 (0.0%) |
| Enterprise Management | 0 (0.0%) | 0 (0.0%) |
| Administrative & Support | 2 (100.0%) | 0 (0.0%) |
| Educational Services | 0 (0.0%) | 14 (100.0%) |
| Health Care & Social Assistance | 0 (0.0%) | 8 (100.0%) |
| Arts, Entertainment & Recreation | 0 (0.0%) | 0 (0.0%) |
| Accommodation & Food Services | 0 (0.0%) | 0 (0.0%) |
| Public Administration | 3 (75.0%) | 1 (25.0%) |
| Total | 27 (34.6%) | 51 (65.4%) |
Education in Union
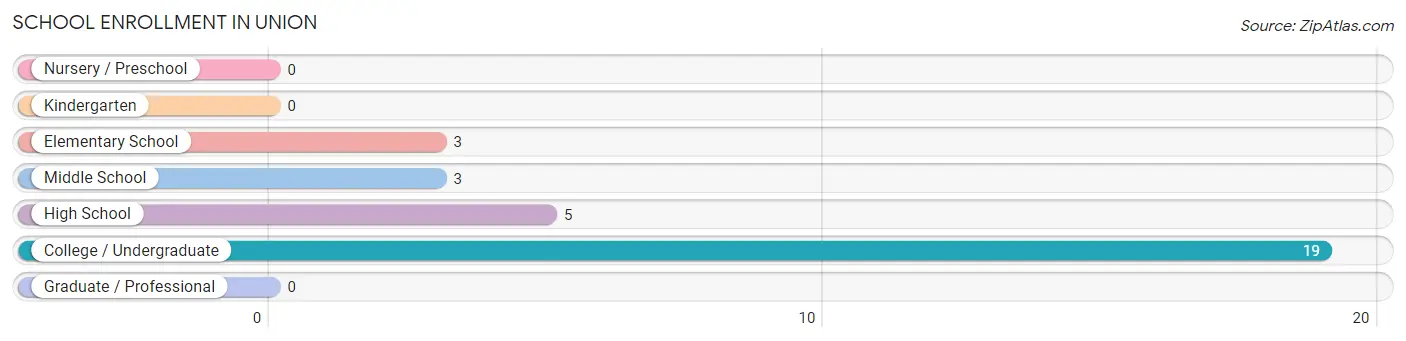
School Enrollment in Union
The most common levels of schooling among the 30 students in Union are college / undergraduate (19 | 63.3%), high school (5 | 16.7%), and elementary school (3 | 10.0%).
| School Level | # Students | % Students |
| Nursery / Preschool | 0 | 0.0% |
| Kindergarten | 0 | 0.0% |
| Elementary School | 3 | 10.0% |
| Middle School | 3 | 10.0% |
| High School | 5 | 16.7% |
| College / Undergraduate | 19 | 63.3% |
| Graduate / Professional | 0 | 0.0% |
| Total | 30 | 100.0% |
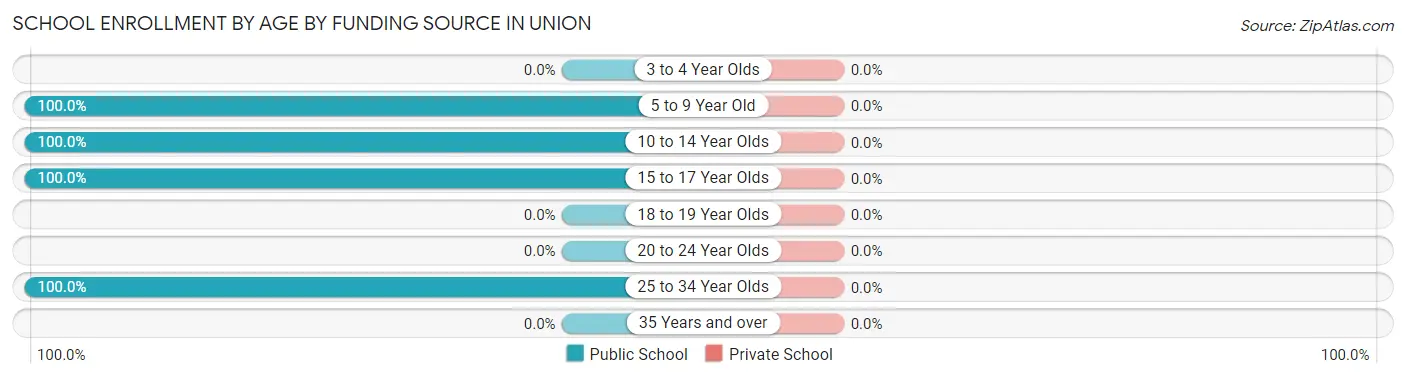
School Enrollment by Age by Funding Source in Union
| Age Bracket | Public School | Private School |
| 3 to 4 Year Olds | 0 (0.0%) | 0 (0.0%) |
| 5 to 9 Year Old | 3 (100.0%) | 0 (0.0%) |
| 10 to 14 Year Olds | 3 (100.0%) | 0 (0.0%) |
| 15 to 17 Year Olds | 5 (100.0%) | 0 (0.0%) |
| 18 to 19 Year Olds | 0 (0.0%) | 0 (0.0%) |
| 20 to 24 Year Olds | 0 (0.0%) | 0 (0.0%) |
| 25 to 34 Year Olds | 19 (100.0%) | 0 (0.0%) |
| 35 Years and over | 0 (0.0%) | 0 (0.0%) |
| Total | 30 (100.0%) | 0 (0.0%) |
Educational Attainment by Field of Study in Union
Liberal arts & history (20 | 66.7%), visual & performing arts (8 | 26.7%), business (1 | 3.3%), and education (1 | 3.3%) are the most common fields of study among 30 individuals in Union who have obtained a bachelor's degree or higher.
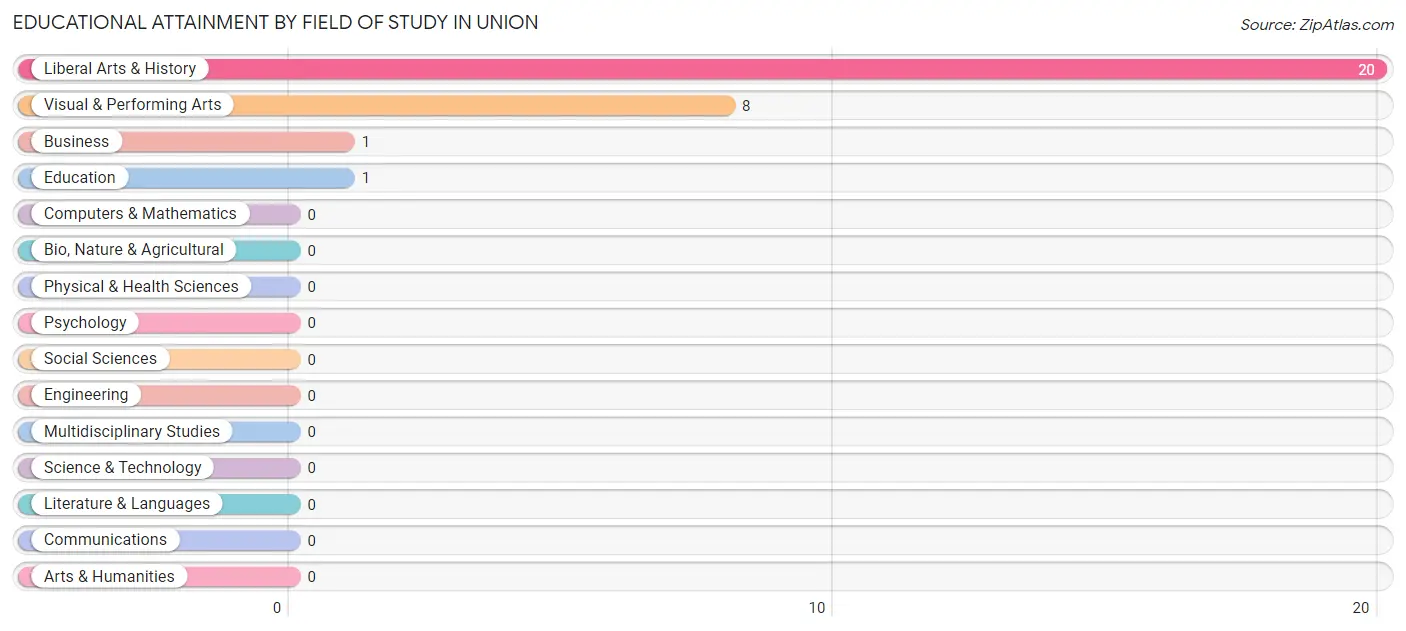
| Field of Study | # Graduates | % Graduates |
| Computers & Mathematics | 0 | 0.0% |
| Bio, Nature & Agricultural | 0 | 0.0% |
| Physical & Health Sciences | 0 | 0.0% |
| Psychology | 0 | 0.0% |
| Social Sciences | 0 | 0.0% |
| Engineering | 0 | 0.0% |
| Multidisciplinary Studies | 0 | 0.0% |
| Science & Technology | 0 | 0.0% |
| Business | 1 | 3.3% |
| Education | 1 | 3.3% |
| Literature & Languages | 0 | 0.0% |
| Liberal Arts & History | 20 | 66.7% |
| Visual & Performing Arts | 8 | 26.7% |
| Communications | 0 | 0.0% |
| Arts & Humanities | 0 | 0.0% |
| Total | 30 | 100.0% |
Transportation & Commute in Union
Vehicle Availability by Sex in Union
The most prevalent vehicle ownership categories in Union are males with 4 vehicles (9, accounting for 33.3%) and females with 4 vehicles (2, making up 19.2%).
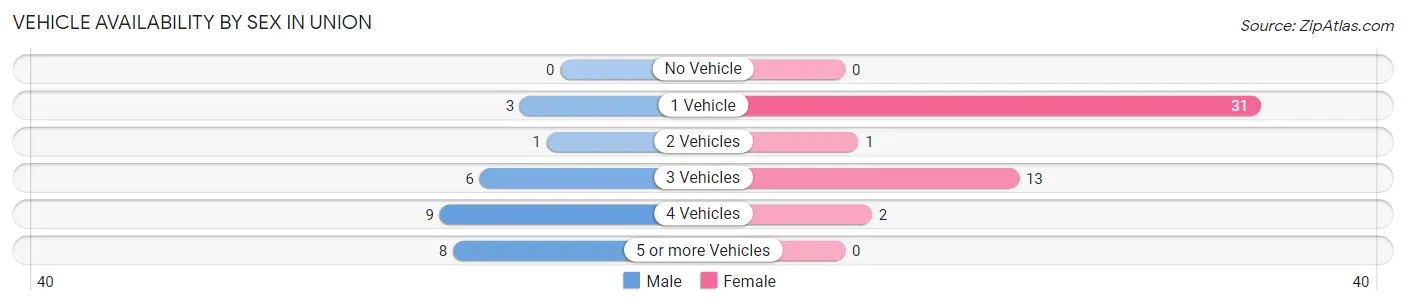
| Vehicles Available | Male | Female |
| No Vehicle | 0 (0.0%) | 0 (0.0%) |
| 1 Vehicle | 3 (11.1%) | 31 (66.0%) |
| 2 Vehicles | 1 (3.7%) | 1 (2.1%) |
| 3 Vehicles | 6 (22.2%) | 13 (27.7%) |
| 4 Vehicles | 9 (33.3%) | 2 (4.3%) |
| 5 or more Vehicles | 8 (29.6%) | 0 (0.0%) |
| Total | 27 (100.0%) | 47 (100.0%) |
Commute Time in Union
The most frequently occuring commute durations in Union are 15 to 19 minutes (15 commuters, 20.3%), 35 to 39 minutes (15 commuters, 20.3%), and 45 to 59 minutes (14 commuters, 18.9%).
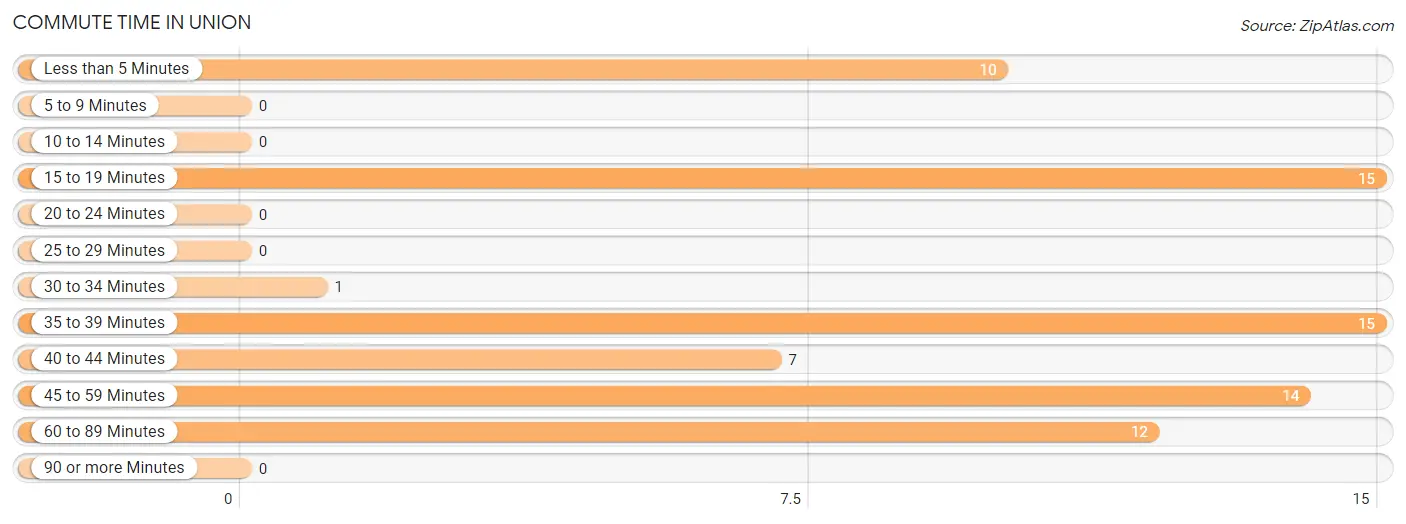
| Commute Time | # Commuters | % Commuters |
| Less than 5 Minutes | 10 | 13.5% |
| 5 to 9 Minutes | 0 | 0.0% |
| 10 to 14 Minutes | 0 | 0.0% |
| 15 to 19 Minutes | 15 | 20.3% |
| 20 to 24 Minutes | 0 | 0.0% |
| 25 to 29 Minutes | 0 | 0.0% |
| 30 to 34 Minutes | 1 | 1.3% |
| 35 to 39 Minutes | 15 | 20.3% |
| 40 to 44 Minutes | 7 | 9.5% |
| 45 to 59 Minutes | 14 | 18.9% |
| 60 to 89 Minutes | 12 | 16.2% |
| 90 or more Minutes | 0 | 0.0% |
Commute Time by Sex in Union
The most common commute times in Union are 35 to 39 minutes (15 commuters, 55.6%) for males and 15 to 19 minutes (15 commuters, 31.9%) for females.
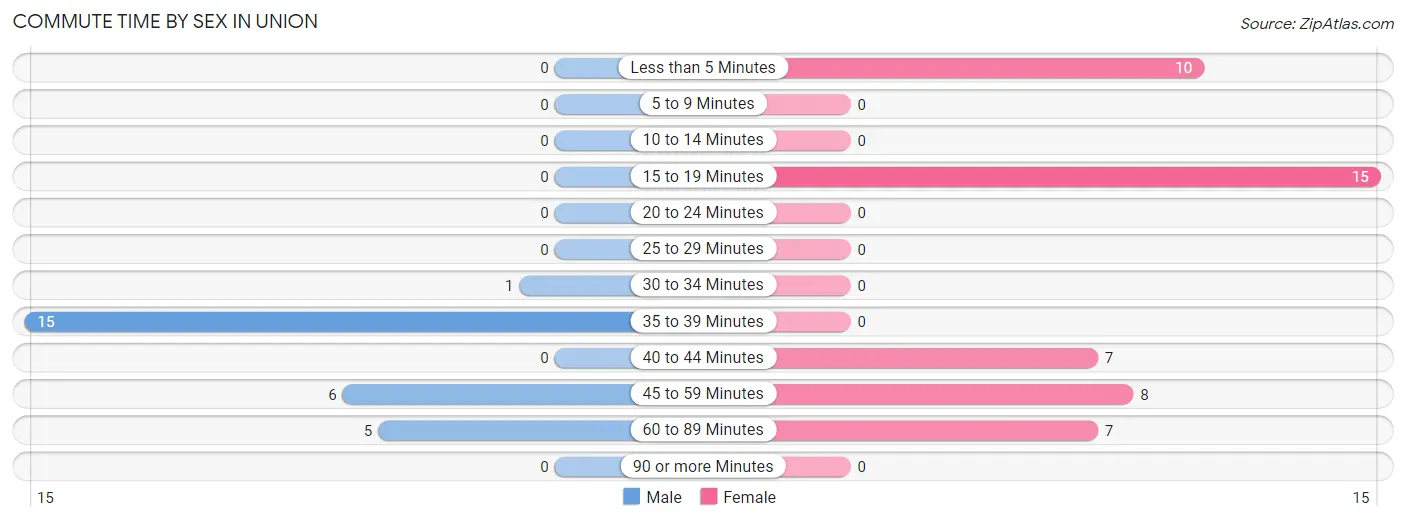
| Commute Time | Male | Female |
| Less than 5 Minutes | 0 (0.0%) | 10 (21.3%) |
| 5 to 9 Minutes | 0 (0.0%) | 0 (0.0%) |
| 10 to 14 Minutes | 0 (0.0%) | 0 (0.0%) |
| 15 to 19 Minutes | 0 (0.0%) | 15 (31.9%) |
| 20 to 24 Minutes | 0 (0.0%) | 0 (0.0%) |
| 25 to 29 Minutes | 0 (0.0%) | 0 (0.0%) |
| 30 to 34 Minutes | 1 (3.7%) | 0 (0.0%) |
| 35 to 39 Minutes | 15 (55.6%) | 0 (0.0%) |
| 40 to 44 Minutes | 0 (0.0%) | 7 (14.9%) |
| 45 to 59 Minutes | 6 (22.2%) | 8 (17.0%) |
| 60 to 89 Minutes | 5 (18.5%) | 7 (14.9%) |
| 90 or more Minutes | 0 (0.0%) | 0 (0.0%) |
Time of Departure to Work by Sex in Union
The most frequent times of departure to work in Union are 5:30 AM to 5:59 AM (10, 37.0%) for males and 8:00 AM to 8:29 AM (13, 27.7%) for females.
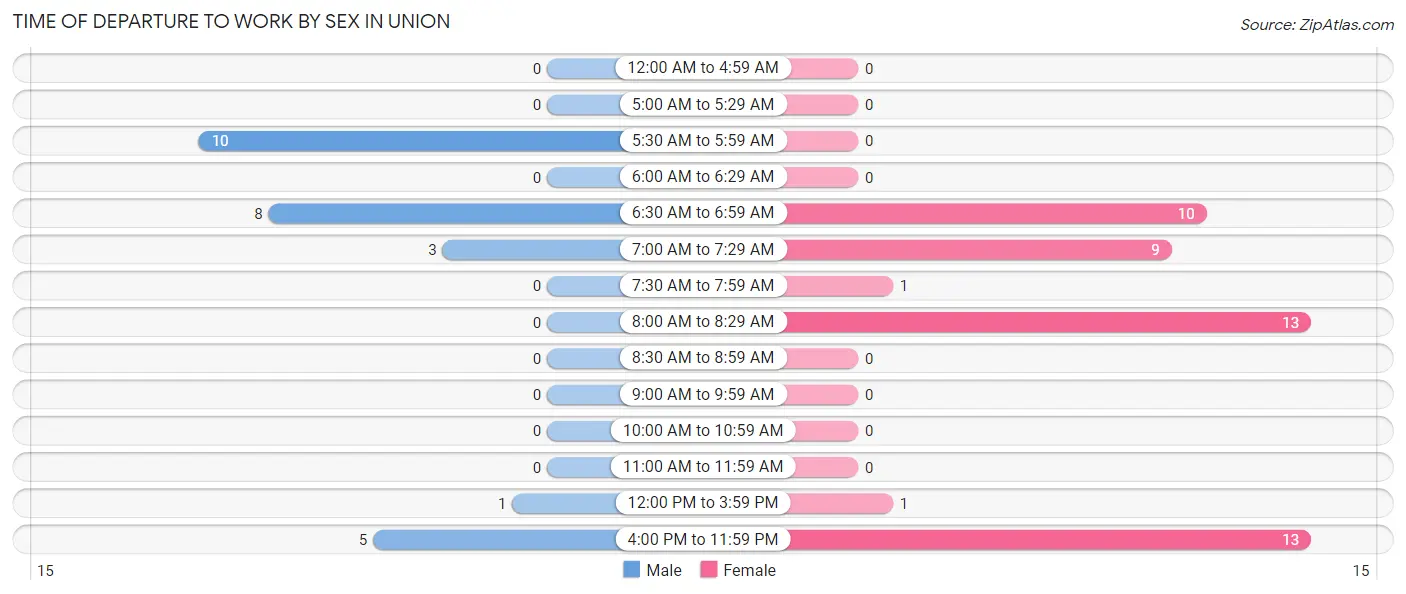
| Time of Departure | Male | Female |
| 12:00 AM to 4:59 AM | 0 (0.0%) | 0 (0.0%) |
| 5:00 AM to 5:29 AM | 0 (0.0%) | 0 (0.0%) |
| 5:30 AM to 5:59 AM | 10 (37.0%) | 0 (0.0%) |
| 6:00 AM to 6:29 AM | 0 (0.0%) | 0 (0.0%) |
| 6:30 AM to 6:59 AM | 8 (29.6%) | 10 (21.3%) |
| 7:00 AM to 7:29 AM | 3 (11.1%) | 9 (19.2%) |
| 7:30 AM to 7:59 AM | 0 (0.0%) | 1 (2.1%) |
| 8:00 AM to 8:29 AM | 0 (0.0%) | 13 (27.7%) |
| 8:30 AM to 8:59 AM | 0 (0.0%) | 0 (0.0%) |
| 9:00 AM to 9:59 AM | 0 (0.0%) | 0 (0.0%) |
| 10:00 AM to 10:59 AM | 0 (0.0%) | 0 (0.0%) |
| 11:00 AM to 11:59 AM | 0 (0.0%) | 0 (0.0%) |
| 12:00 PM to 3:59 PM | 1 (3.7%) | 1 (2.1%) |
| 4:00 PM to 11:59 PM | 5 (18.5%) | 13 (27.7%) |
| Total | 27 (100.0%) | 47 (100.0%) |
Housing Occupancy in Union
Occupancy by Ownership in Union
Of the total 100 dwellings in Union, owner-occupied units account for 98 (98.0%), while renter-occupied units make up 2 (2.0%).
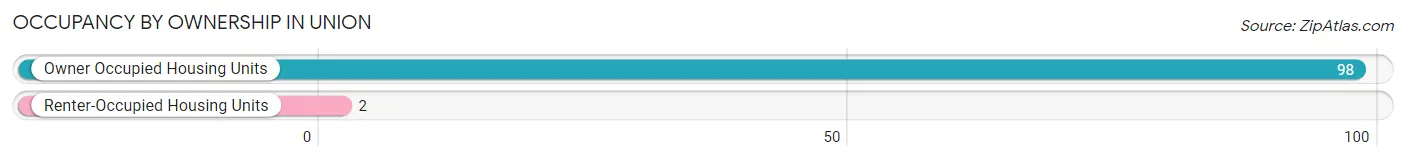
| Occupancy | # Housing Units | % Housing Units |
| Owner Occupied Housing Units | 98 | 98.0% |
| Renter-Occupied Housing Units | 2 | 2.0% |
| Total Occupied Housing Units | 100 | 100.0% |
Occupancy by Household Size in Union
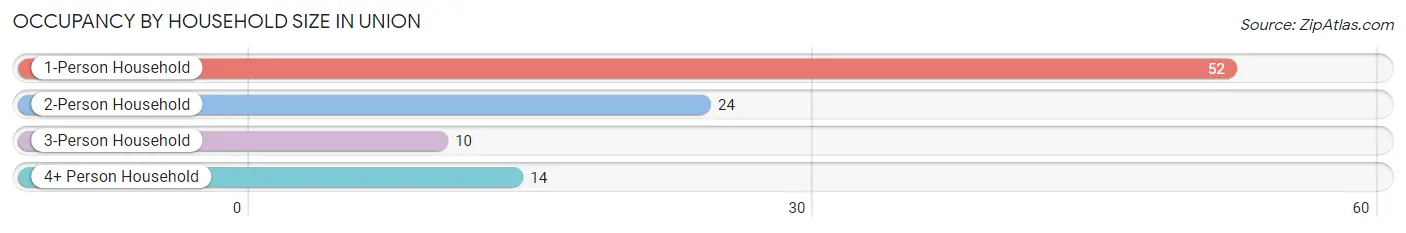
| Household Size | # Housing Units | % Housing Units |
| 1-Person Household | 52 | 52.0% |
| 2-Person Household | 24 | 24.0% |
| 3-Person Household | 10 | 10.0% |
| 4+ Person Household | 14 | 14.0% |
| Total Housing Units | 100 | 100.0% |
Occupancy by Ownership by Household Size in Union
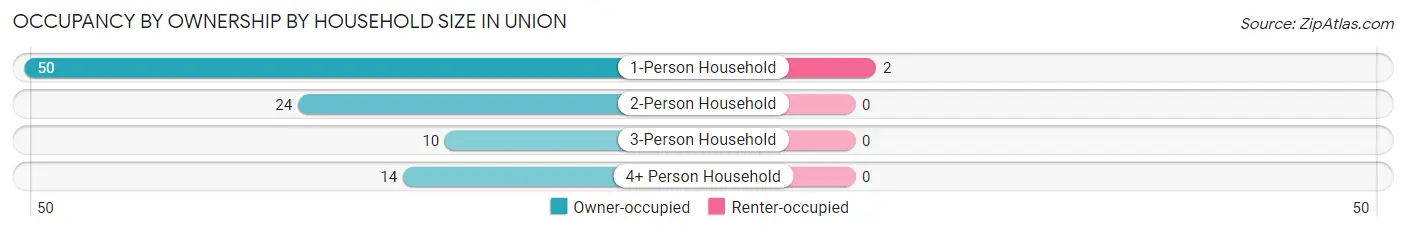
| Household Size | Owner-occupied | Renter-occupied |
| 1-Person Household | 50 (96.2%) | 2 (3.8%) |
| 2-Person Household | 24 (100.0%) | 0 (0.0%) |
| 3-Person Household | 10 (100.0%) | 0 (0.0%) |
| 4+ Person Household | 14 (100.0%) | 0 (0.0%) |
| Total Housing Units | 98 (98.0%) | 2 (2.0%) |
Occupancy by Educational Attainment in Union
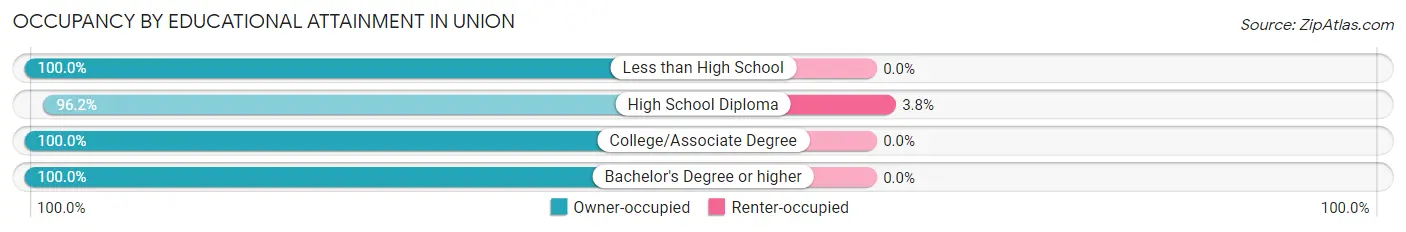
| Household Size | Owner-occupied | Renter-occupied |
| Less than High School | 28 (100.0%) | 0 (0.0%) |
| High School Diploma | 51 (96.2%) | 2 (3.8%) |
| College/Associate Degree | 17 (100.0%) | 0 (0.0%) |
| Bachelor's Degree or higher | 2 (100.0%) | 0 (0.0%) |
Occupancy by Age of Householder in Union
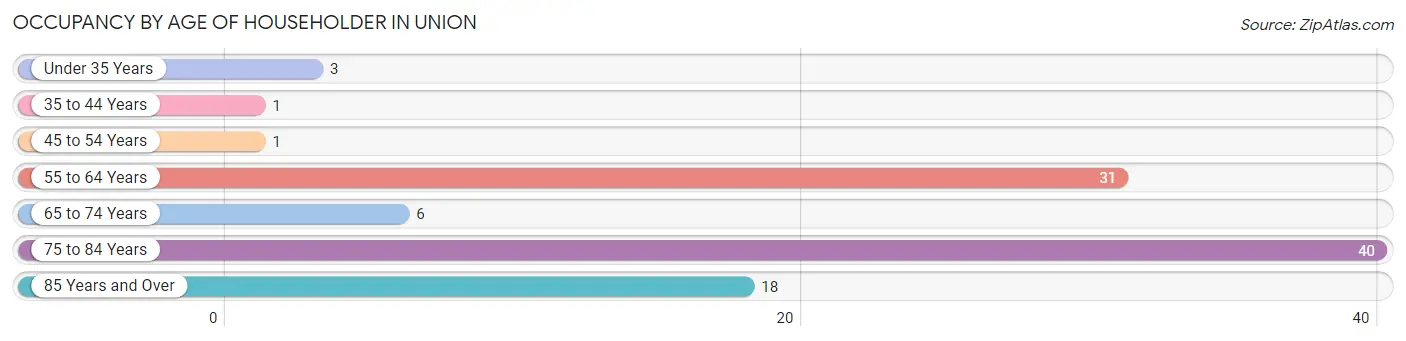
| Age Bracket | # Households | % Households |
| Under 35 Years | 3 | 3.0% |
| 35 to 44 Years | 1 | 1.0% |
| 45 to 54 Years | 1 | 1.0% |
| 55 to 64 Years | 31 | 31.0% |
| 65 to 74 Years | 6 | 6.0% |
| 75 to 84 Years | 40 | 40.0% |
| 85 Years and Over | 18 | 18.0% |
| Total | 100 | 100.0% |
Housing Finances in Union
Median Income by Occupancy in Union
| Occupancy Type | # Households | Median Income |
| Owner-Occupied | 98 (98.0%) | $0 |
| Renter-Occupied | 2 (2.0%) | $0 |
| Average | 100 (100.0%) | $0 |
Occupancy by Householder Income Bracket in Union
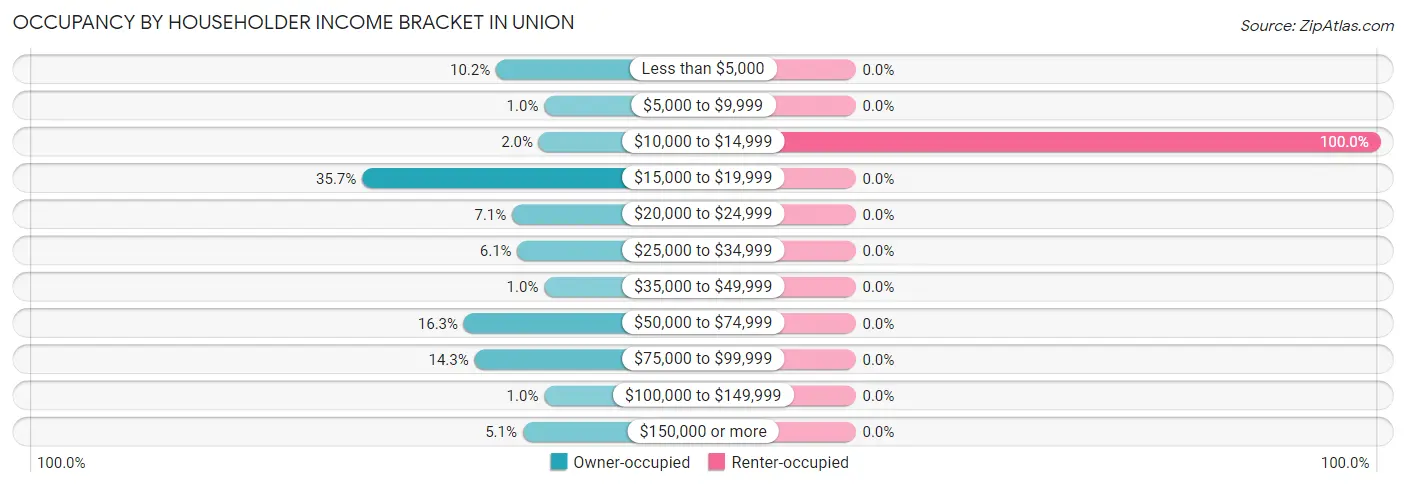
| Income Bracket | Owner-occupied | Renter-occupied |
| Less than $5,000 | 10 (10.2%) | 0 (0.0%) |
| $5,000 to $9,999 | 1 (1.0%) | 0 (0.0%) |
| $10,000 to $14,999 | 2 (2.0%) | 2 (100.0%) |
| $15,000 to $19,999 | 35 (35.7%) | 0 (0.0%) |
| $20,000 to $24,999 | 7 (7.1%) | 0 (0.0%) |
| $25,000 to $34,999 | 6 (6.1%) | 0 (0.0%) |
| $35,000 to $49,999 | 1 (1.0%) | 0 (0.0%) |
| $50,000 to $74,999 | 16 (16.3%) | 0 (0.0%) |
| $75,000 to $99,999 | 14 (14.3%) | 0 (0.0%) |
| $100,000 to $149,999 | 1 (1.0%) | 0 (0.0%) |
| $150,000 or more | 5 (5.1%) | 0 (0.0%) |
| Total | 98 (100.0%) | 2 (100.0%) |
Monthly Housing Cost Tiers in Union
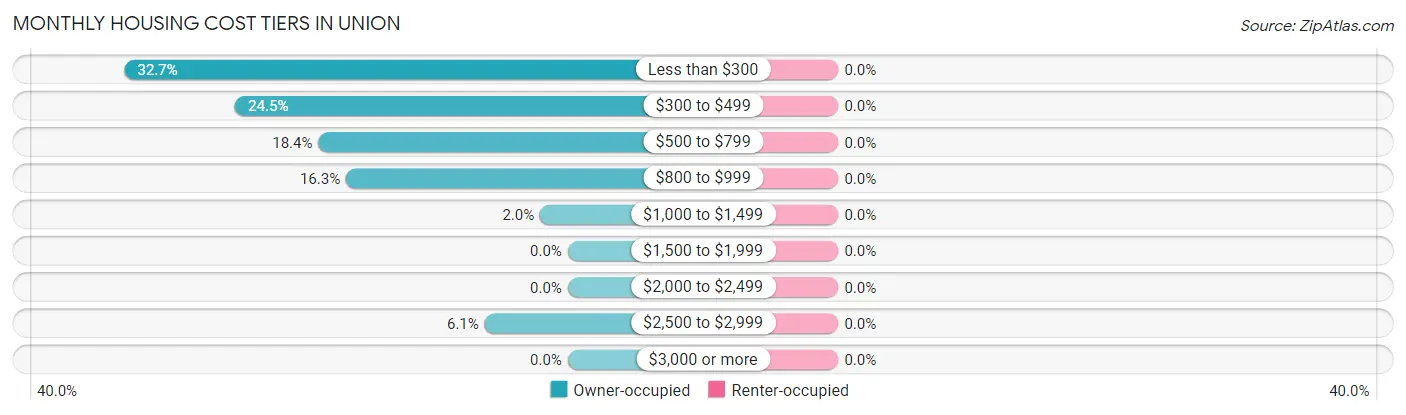
| Monthly Cost | Owner-occupied | Renter-occupied |
| Less than $300 | 32 (32.7%) | 0 (0.0%) |
| $300 to $499 | 24 (24.5%) | 0 (0.0%) |
| $500 to $799 | 18 (18.4%) | 0 (0.0%) |
| $800 to $999 | 16 (16.3%) | 0 (0.0%) |
| $1,000 to $1,499 | 2 (2.0%) | 0 (0.0%) |
| $1,500 to $1,999 | 0 (0.0%) | 0 (0.0%) |
| $2,000 to $2,499 | 0 (0.0%) | 0 (0.0%) |
| $2,500 to $2,999 | 6 (6.1%) | 0 (0.0%) |
| $3,000 or more | 0 (0.0%) | 0 (0.0%) |
| Total | 98 (100.0%) | 2 (100.0%) |
Physical Housing Characteristics in Union
Housing Structures in Union
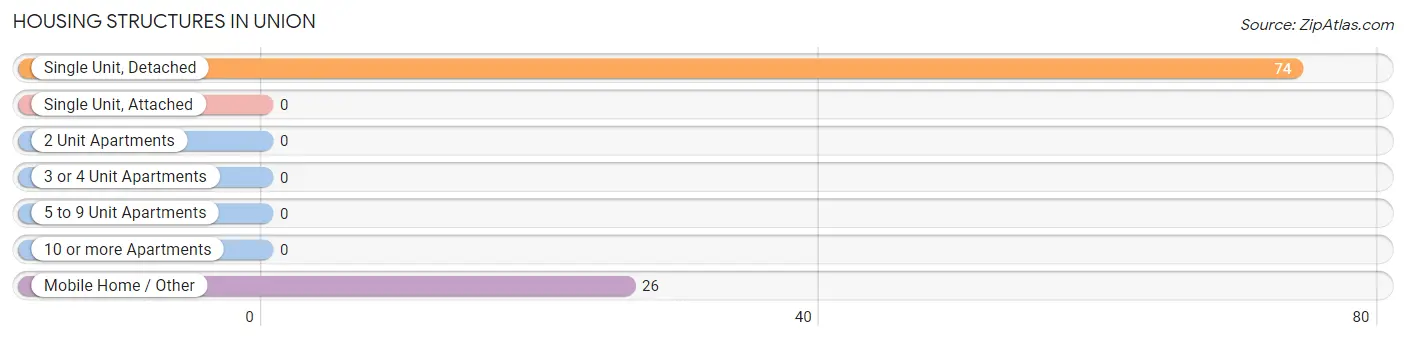
| Structure Type | # Housing Units | % Housing Units |
| Single Unit, Detached | 74 | 74.0% |
| Single Unit, Attached | 0 | 0.0% |
| 2 Unit Apartments | 0 | 0.0% |
| 3 or 4 Unit Apartments | 0 | 0.0% |
| 5 to 9 Unit Apartments | 0 | 0.0% |
| 10 or more Apartments | 0 | 0.0% |
| Mobile Home / Other | 26 | 26.0% |
| Total | 100 | 100.0% |
Housing Structures by Occupancy in Union
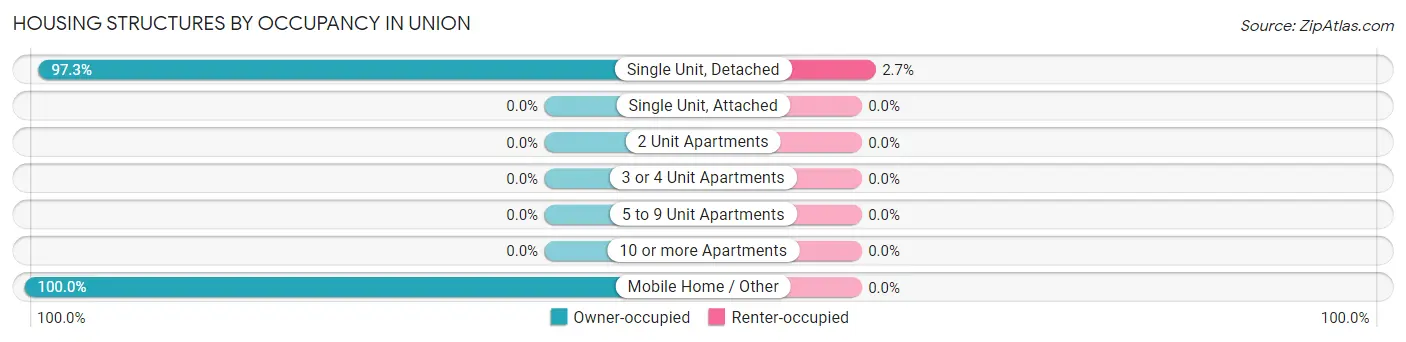
| Structure Type | Owner-occupied | Renter-occupied |
| Single Unit, Detached | 72 (97.3%) | 2 (2.7%) |
| Single Unit, Attached | 0 (0.0%) | 0 (0.0%) |
| 2 Unit Apartments | 0 (0.0%) | 0 (0.0%) |
| 3 or 4 Unit Apartments | 0 (0.0%) | 0 (0.0%) |
| 5 to 9 Unit Apartments | 0 (0.0%) | 0 (0.0%) |
| 10 or more Apartments | 0 (0.0%) | 0 (0.0%) |
| Mobile Home / Other | 26 (100.0%) | 0 (0.0%) |
| Total | 98 (98.0%) | 2 (2.0%) |
Housing Structures by Number of Rooms in Union
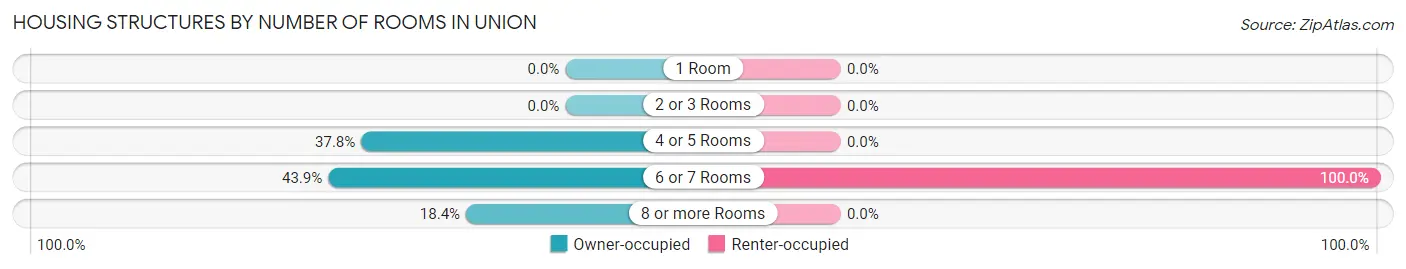
| Number of Rooms | Owner-occupied | Renter-occupied |
| 1 Room | 0 (0.0%) | 0 (0.0%) |
| 2 or 3 Rooms | 0 (0.0%) | 0 (0.0%) |
| 4 or 5 Rooms | 37 (37.8%) | 0 (0.0%) |
| 6 or 7 Rooms | 43 (43.9%) | 2 (100.0%) |
| 8 or more Rooms | 18 (18.4%) | 0 (0.0%) |
| Total | 98 (100.0%) | 2 (100.0%) |
Housing Structure by Heating Type in Union
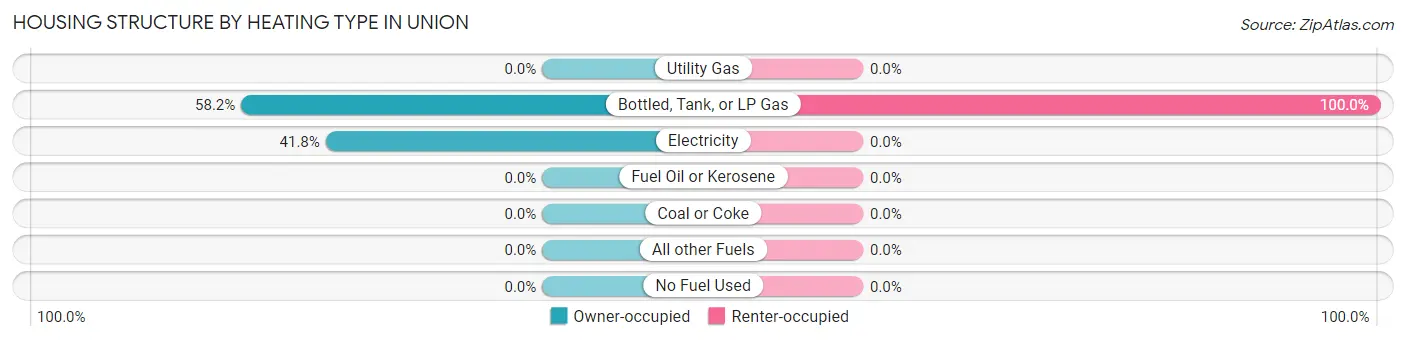
| Heating Type | Owner-occupied | Renter-occupied |
| Utility Gas | 0 (0.0%) | 0 (0.0%) |
| Bottled, Tank, or LP Gas | 57 (58.2%) | 2 (100.0%) |
| Electricity | 41 (41.8%) | 0 (0.0%) |
| Fuel Oil or Kerosene | 0 (0.0%) | 0 (0.0%) |
| Coal or Coke | 0 (0.0%) | 0 (0.0%) |
| All other Fuels | 0 (0.0%) | 0 (0.0%) |
| No Fuel Used | 0 (0.0%) | 0 (0.0%) |
| Total | 98 (100.0%) | 2 (100.0%) |
Household Vehicle Usage in Union
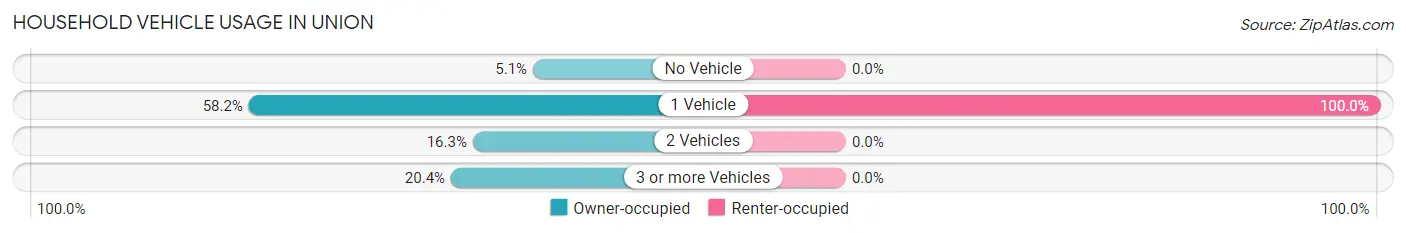
| Vehicles per Household | Owner-occupied | Renter-occupied |
| No Vehicle | 5 (5.1%) | 0 (0.0%) |
| 1 Vehicle | 57 (58.2%) | 2 (100.0%) |
| 2 Vehicles | 16 (16.3%) | 0 (0.0%) |
| 3 or more Vehicles | 20 (20.4%) | 0 (0.0%) |
| Total | 98 (100.0%) | 2 (100.0%) |
Real Estate & Mortgages in Union
Real Estate and Mortgage Overview in Union
| Characteristic | Without Mortgage | With Mortgage |
| Housing Units | 81 | 17 |
| Median Property Value | $43,500 | $0 |
| Median Household Income | - | - |
| Monthly Housing Costs | $339 | $0 |
| Real Estate Taxes | $252 | $0 |
Property Value by Mortgage Status in Union
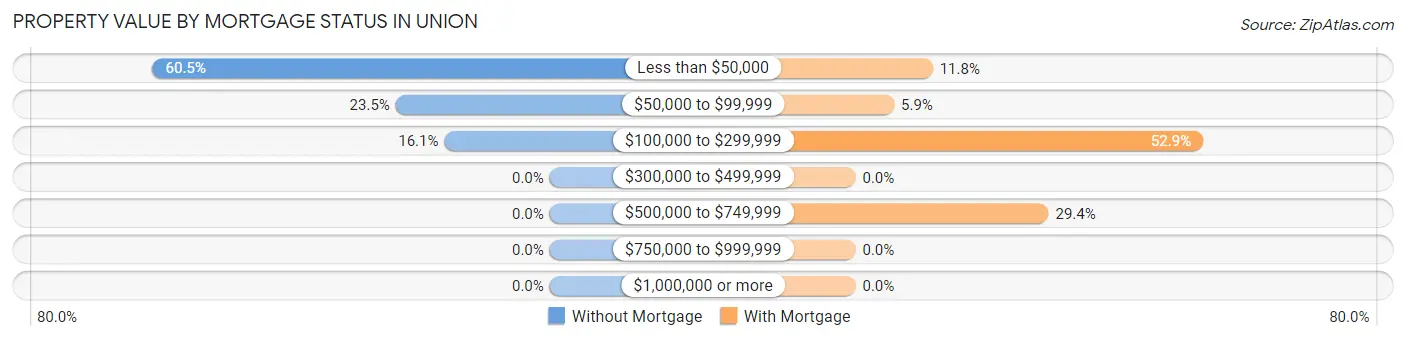
| Property Value | Without Mortgage | With Mortgage |
| Less than $50,000 | 49 (60.5%) | 2 (11.8%) |
| $50,000 to $99,999 | 19 (23.5%) | 1 (5.9%) |
| $100,000 to $299,999 | 13 (16.1%) | 9 (52.9%) |
| $300,000 to $499,999 | 0 (0.0%) | 0 (0.0%) |
| $500,000 to $749,999 | 0 (0.0%) | 5 (29.4%) |
| $750,000 to $999,999 | 0 (0.0%) | 0 (0.0%) |
| $1,000,000 or more | 0 (0.0%) | 0 (0.0%) |
| Total | 81 (100.0%) | 17 (100.0%) |
Household Income by Mortgage Status in Union
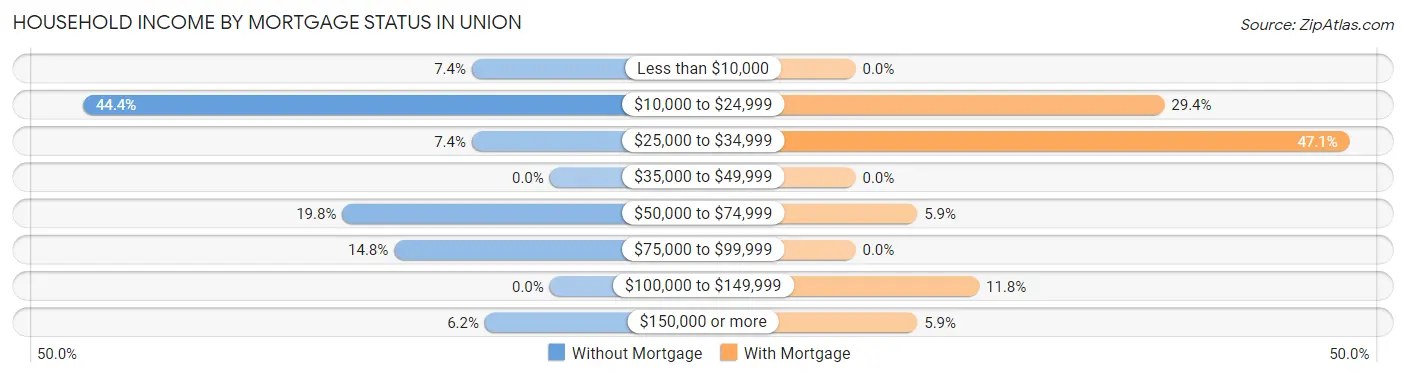
| Household Income | Without Mortgage | With Mortgage |
| Less than $10,000 | 6 (7.4%) | 0 (0.0%) |
| $10,000 to $24,999 | 36 (44.4%) | 5 (29.4%) |
| $25,000 to $34,999 | 6 (7.4%) | 8 (47.1%) |
| $35,000 to $49,999 | 0 (0.0%) | 0 (0.0%) |
| $50,000 to $74,999 | 16 (19.8%) | 1 (5.9%) |
| $75,000 to $99,999 | 12 (14.8%) | 0 (0.0%) |
| $100,000 to $149,999 | 0 (0.0%) | 2 (11.8%) |
| $150,000 or more | 5 (6.2%) | 1 (5.9%) |
| Total | 81 (100.0%) | 17 (100.0%) |
Property Value to Household Income Ratio in Union
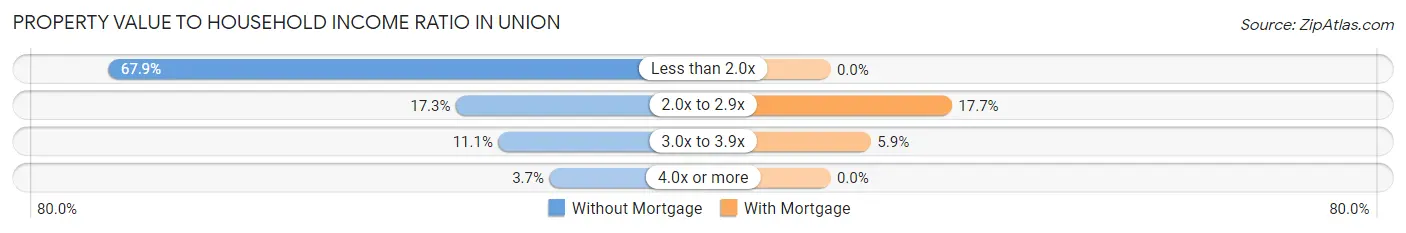
| Value-to-Income Ratio | Without Mortgage | With Mortgage |
| Less than 2.0x | 55 (67.9%) | 0 (0.0%) |
| 2.0x to 2.9x | 14 (17.3%) | 3 (17.6%) |
| 3.0x to 3.9x | 9 (11.1%) | 1 (5.9%) |
| 4.0x or more | 3 (3.7%) | 0 (0.0%) |
| Total | 81 (100.0%) | 17 (100.0%) |
Real Estate Taxes by Mortgage Status in Union
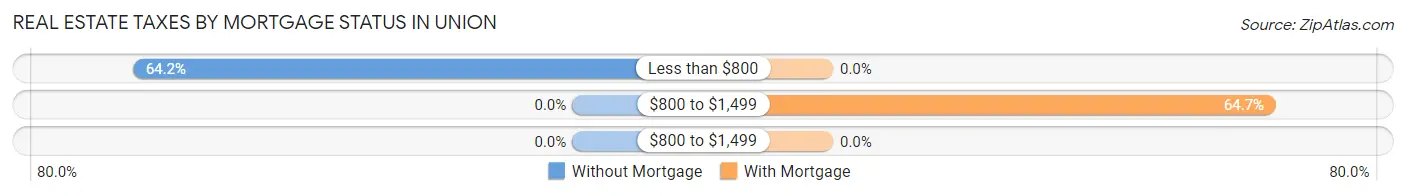
| Property Taxes | Without Mortgage | With Mortgage |
| Less than $800 | 52 (64.2%) | 0 (0.0%) |
| $800 to $1,499 | 0 (0.0%) | 11 (64.7%) |
| $800 to $1,499 | 0 (0.0%) | 0 (0.0%) |
| Total | 81 (100.0%) | 17 (100.0%) |
Health & Disability in Union
Health Insurance Coverage by Age in Union
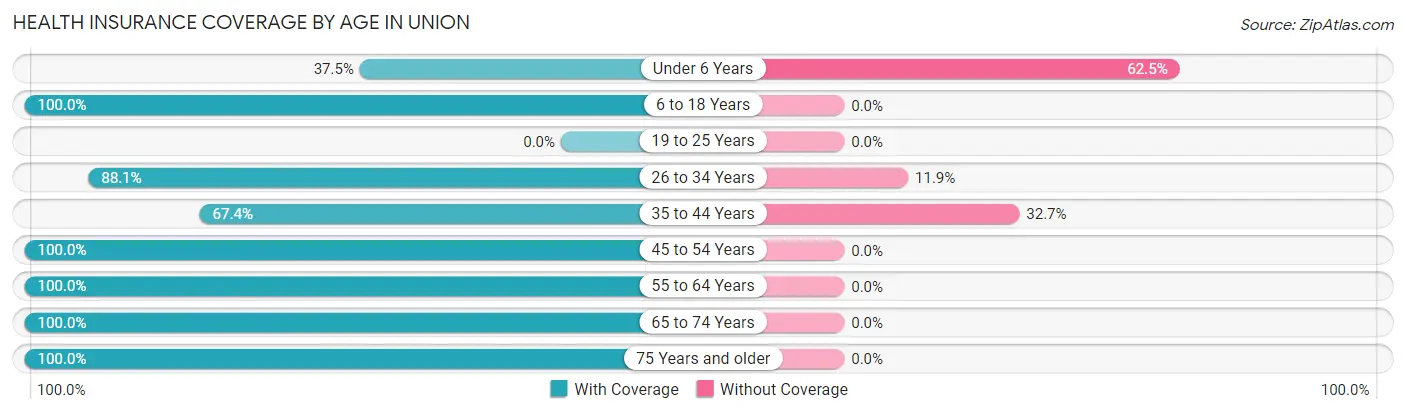
| Age Bracket | With Coverage | Without Coverage |
| Under 6 Years | 3 (37.5%) | 5 (62.5%) |
| 6 to 18 Years | 11 (100.0%) | 0 (0.0%) |
| 19 to 25 Years | 0 (0.0%) | 0 (0.0%) |
| 26 to 34 Years | 37 (88.1%) | 5 (11.9%) |
| 35 to 44 Years | 33 (67.3%) | 16 (32.7%) |
| 45 to 54 Years | 1 (100.0%) | 0 (0.0%) |
| 55 to 64 Years | 55 (100.0%) | 0 (0.0%) |
| 65 to 74 Years | 24 (100.0%) | 0 (0.0%) |
| 75 Years and older | 77 (100.0%) | 0 (0.0%) |
| Total | 241 (90.3%) | 26 (9.7%) |
Health Insurance Coverage by Citizenship Status in Union
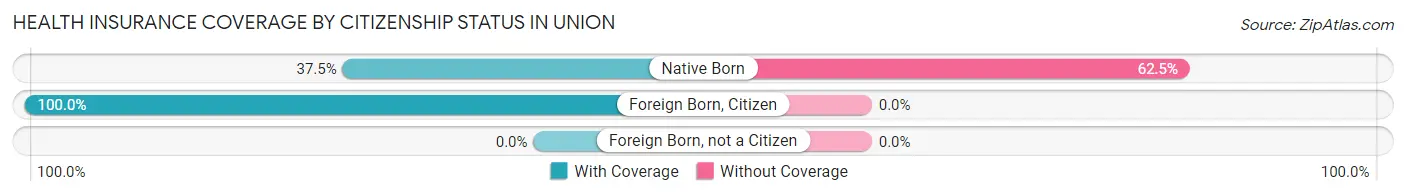
| Citizenship Status | With Coverage | Without Coverage |
| Native Born | 3 (37.5%) | 5 (62.5%) |
| Foreign Born, Citizen | 11 (100.0%) | 0 (0.0%) |
| Foreign Born, not a Citizen | 0 (0.0%) | 0 (0.0%) |
Health Insurance Coverage by Household Income in Union
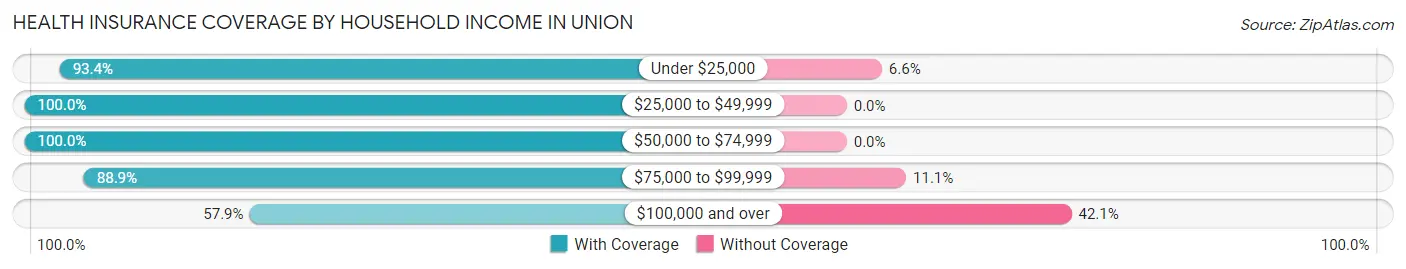
| Household Income | With Coverage | Without Coverage |
| Under $25,000 | 71 (93.4%) | 5 (6.6%) |
| $25,000 to $49,999 | 23 (100.0%) | 0 (0.0%) |
| $50,000 to $74,999 | 85 (100.0%) | 0 (0.0%) |
| $75,000 to $99,999 | 40 (88.9%) | 5 (11.1%) |
| $100,000 and over | 22 (57.9%) | 16 (42.1%) |
Public vs Private Health Insurance Coverage by Age in Union
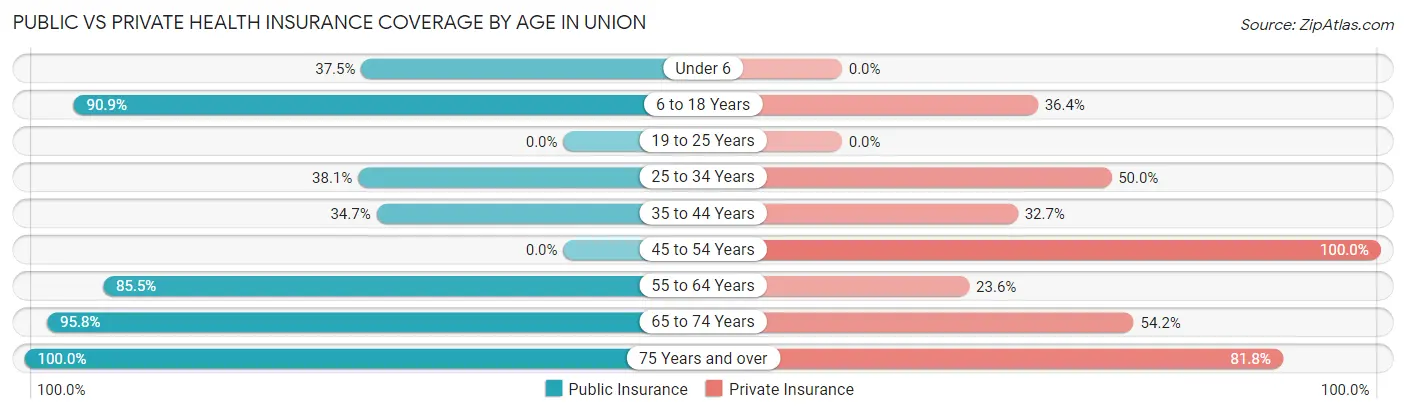
| Age Bracket | Public Insurance | Private Insurance |
| Under 6 | 3 (37.5%) | 0 (0.0%) |
| 6 to 18 Years | 10 (90.9%) | 4 (36.4%) |
| 19 to 25 Years | 0 (0.0%) | 0 (0.0%) |
| 25 to 34 Years | 16 (38.1%) | 21 (50.0%) |
| 35 to 44 Years | 17 (34.7%) | 16 (32.7%) |
| 45 to 54 Years | 0 (0.0%) | 1 (100.0%) |
| 55 to 64 Years | 47 (85.5%) | 13 (23.6%) |
| 65 to 74 Years | 23 (95.8%) | 13 (54.2%) |
| 75 Years and over | 77 (100.0%) | 63 (81.8%) |
| Total | 193 (72.3%) | 131 (49.1%) |
Disability Status by Sex by Age in Union
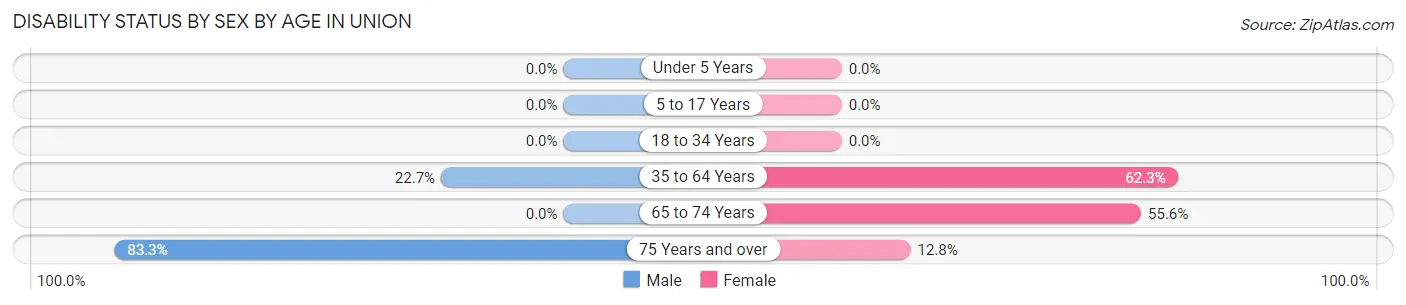
| Age Bracket | Male | Female |
| Under 5 Years | 0 (0.0%) | 0 (0.0%) |
| 5 to 17 Years | 0 (0.0%) | 0 (0.0%) |
| 18 to 34 Years | 0 (0.0%) | 0 (0.0%) |
| 35 to 64 Years | 10 (22.7%) | 38 (62.3%) |
| 65 to 74 Years | 0 (0.0%) | 10 (55.6%) |
| 75 Years and over | 25 (83.3%) | 6 (12.8%) |
Disability Class by Sex by Age in Union
Disability Class: Hearing Difficulty
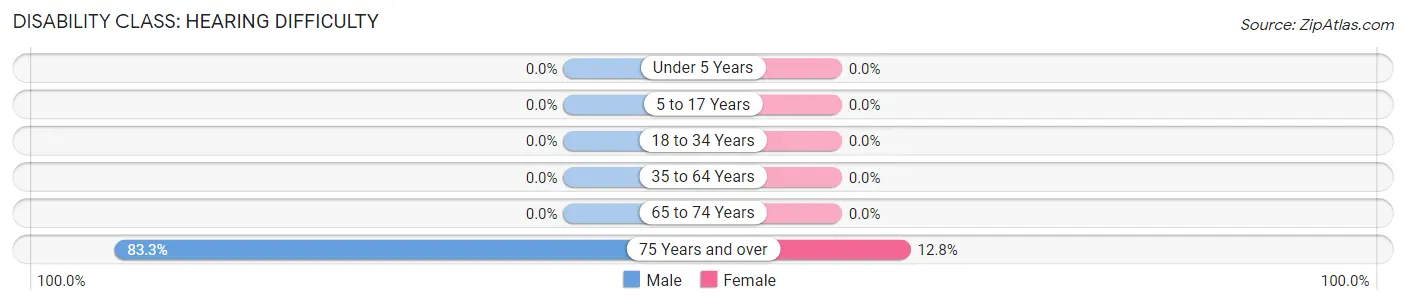
| Age Bracket | Male | Female |
| Under 5 Years | 0 (0.0%) | 0 (0.0%) |
| 5 to 17 Years | 0 (0.0%) | 0 (0.0%) |
| 18 to 34 Years | 0 (0.0%) | 0 (0.0%) |
| 35 to 64 Years | 0 (0.0%) | 0 (0.0%) |
| 65 to 74 Years | 0 (0.0%) | 0 (0.0%) |
| 75 Years and over | 25 (83.3%) | 6 (12.8%) |
Disability Class: Vision Difficulty
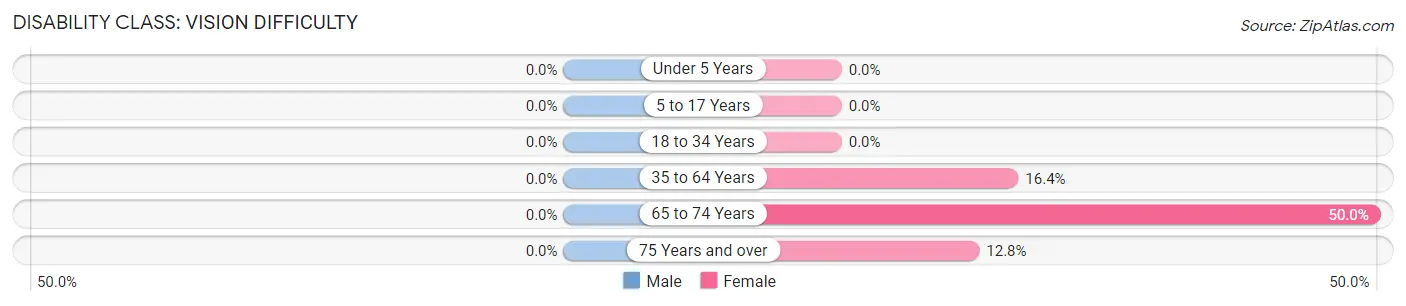
| Age Bracket | Male | Female |
| Under 5 Years | 0 (0.0%) | 0 (0.0%) |
| 5 to 17 Years | 0 (0.0%) | 0 (0.0%) |
| 18 to 34 Years | 0 (0.0%) | 0 (0.0%) |
| 35 to 64 Years | 0 (0.0%) | 10 (16.4%) |
| 65 to 74 Years | 0 (0.0%) | 9 (50.0%) |
| 75 Years and over | 0 (0.0%) | 6 (12.8%) |
Disability Class: Cognitive Difficulty
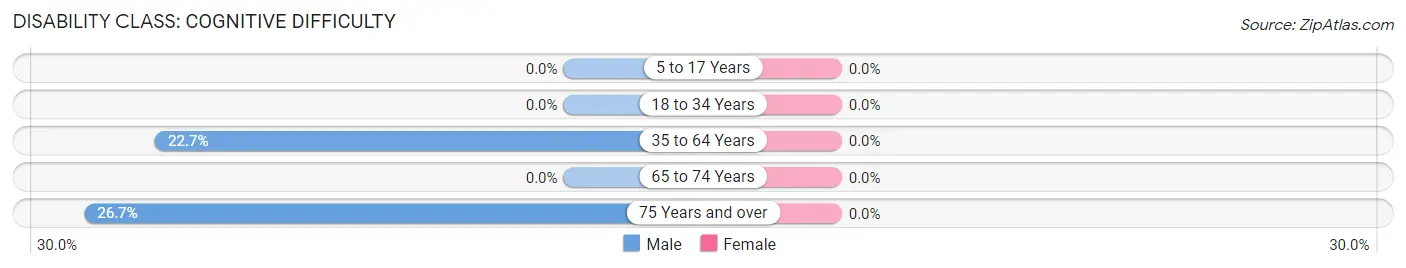
| Age Bracket | Male | Female |
| 5 to 17 Years | 0 (0.0%) | 0 (0.0%) |
| 18 to 34 Years | 0 (0.0%) | 0 (0.0%) |
| 35 to 64 Years | 10 (22.7%) | 0 (0.0%) |
| 65 to 74 Years | 0 (0.0%) | 0 (0.0%) |
| 75 Years and over | 8 (26.7%) | 0 (0.0%) |
Disability Class: Ambulatory Difficulty
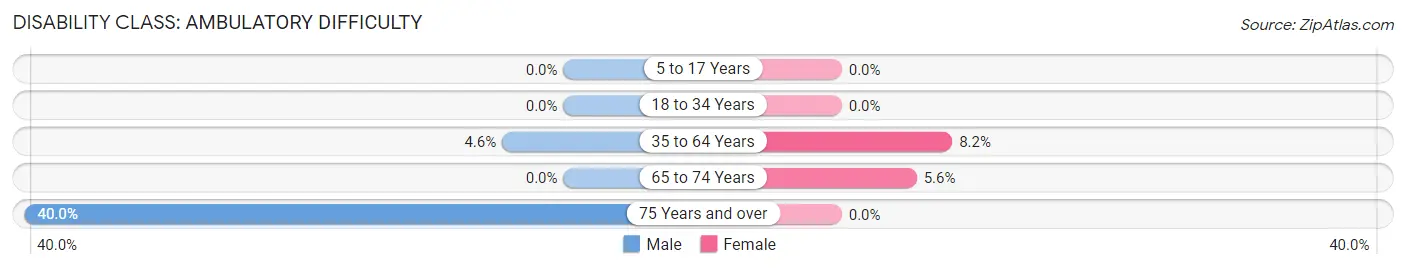
| Age Bracket | Male | Female |
| 5 to 17 Years | 0 (0.0%) | 0 (0.0%) |
| 18 to 34 Years | 0 (0.0%) | 0 (0.0%) |
| 35 to 64 Years | 2 (4.5%) | 5 (8.2%) |
| 65 to 74 Years | 0 (0.0%) | 1 (5.6%) |
| 75 Years and over | 12 (40.0%) | 0 (0.0%) |
Disability Class: Self-Care Difficulty
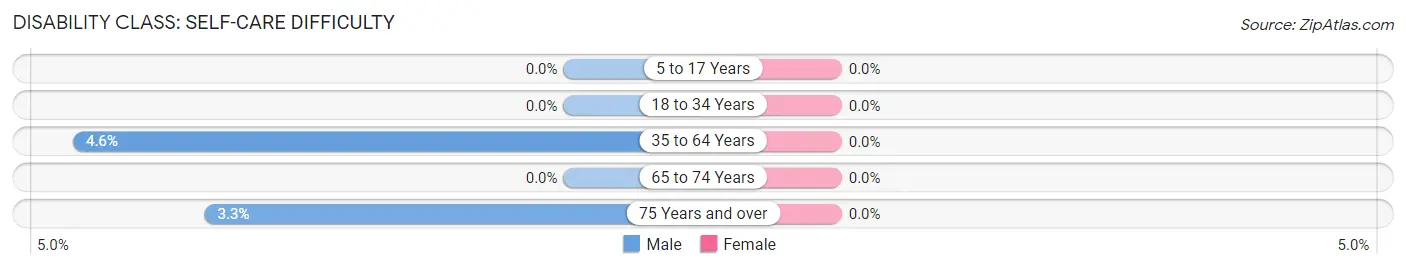
| Age Bracket | Male | Female |
| 5 to 17 Years | 0 (0.0%) | 0 (0.0%) |
| 18 to 34 Years | 0 (0.0%) | 0 (0.0%) |
| 35 to 64 Years | 2 (4.5%) | 0 (0.0%) |
| 65 to 74 Years | 0 (0.0%) | 0 (0.0%) |
| 75 Years and over | 1 (3.3%) | 0 (0.0%) |
Technology Access in Union
Computing Device Access in Union
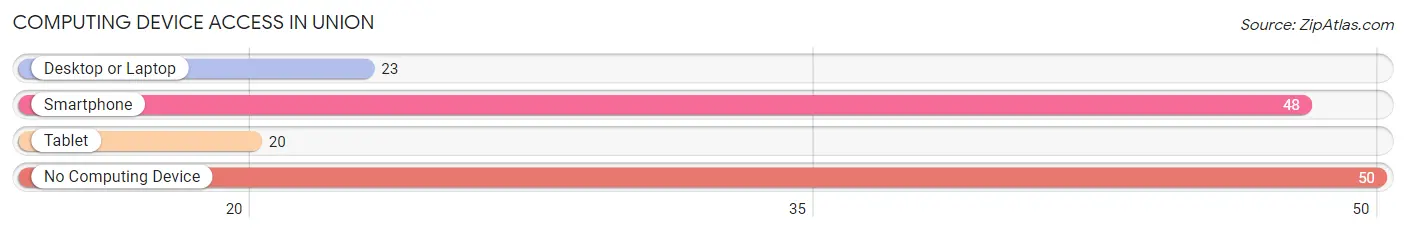
| Device Type | # Households | % Households |
| Desktop or Laptop | 23 | 23.0% |
| Smartphone | 48 | 48.0% |
| Tablet | 20 | 20.0% |
| No Computing Device | 50 | 50.0% |
| Total | 100 | 100.0% |
Internet Access in Union
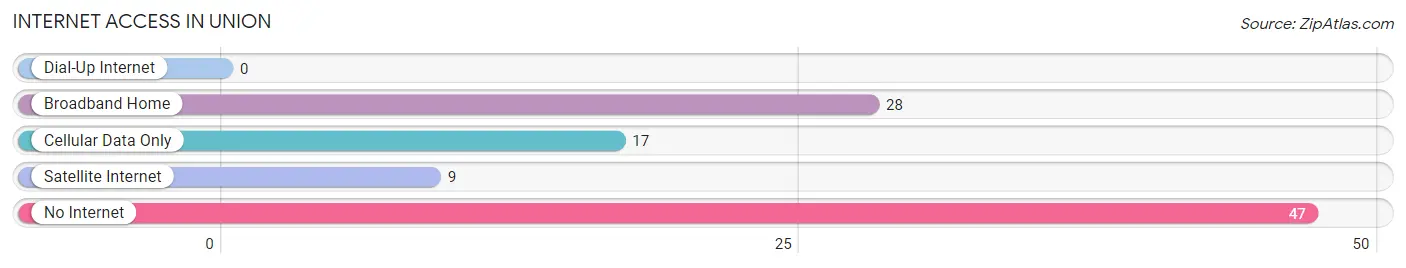
| Internet Type | # Households | % Households |
| Dial-Up Internet | 0 | 0.0% |
| Broadband Home | 28 | 28.0% |
| Cellular Data Only | 17 | 17.0% |
| Satellite Internet | 9 | 9.0% |
| No Internet | 47 | 47.0% |
| Total | 100 | 100.0% |
Union Summary
Union is a town in the northeastern corner of Alabama, located in the foothills of the Appalachian Mountains. It is the county seat of Jackson County and is part of the Huntsville-Decatur Combined Statistical Area. The town was founded in 1836 and has a population of approximately 2,000 people.
Geography
Union is located in the northeastern corner of Alabama, in the foothills of the Appalachian Mountains. It is situated in the Jackson County, and is bordered by the cities of Scottsboro, Stevenson, and Bridgeport. The town is located at the intersection of US Highway 72 and Alabama State Route 65. The terrain of the area is mostly hilly, with some flat areas in the valleys. The climate is humid subtropical, with hot summers and mild winters.
Economy
Union’s economy is largely based on agriculture and manufacturing. The town is home to several small businesses, including a lumber mill, a furniture factory, and a metal fabrication plant. The town also has a few retail stores, restaurants, and other services. The town is also home to a number of small farms, which produce a variety of crops, including corn, soybeans, and cotton.
Demographics
As of the 2010 census, Union had a population of 2,000 people. The racial makeup of the town was 95.2% White, 2.2% African American, 0.7% Native American, 0.2% Asian, 0.1% Pacific Islander, 0.4% from other races, and 1.2% from two or more races. Hispanic or Latino of any race were 1.2% of the population.
The median income for a household in Union was $30,000, and the median income for a family was $35,000. The per capita income for the town was $15,000. About 17.2% of families and 20.2% of the population were below the poverty line, including 28.2% of those under age 18 and 11.2% of those age 65 or over.
History
Union was founded in 1836 and was originally known as Unionville. The town was named after the Union Church, which was built in the area in 1835. The town was incorporated in 1839 and was the county seat of Jackson County. During the Civil War, Union was the site of a major battle between Union and Confederate forces. After the war, the town experienced a period of growth and prosperity, with the establishment of several businesses and industries. In the late 19th century, the town was home to several cotton mills and other manufacturing plants.
In the early 20th century, Union experienced a period of decline, as many of the businesses and industries closed. The town was also hit hard by the Great Depression, and many of the residents left in search of work. In the 1950s, the town began to experience a resurgence, as new businesses and industries opened in the area. Today, Union is a small, rural town with a population of approximately 2,000 people.
Common Questions
What is Per Capita Income in Union?
Per Capita income in Union is $19,368.
What is the Median Family Income in Union?
Median Family Income in Union is $63,750.
What is Income or Wage Gap in Union?
Income or Wage Gap in Union is 32.9%.
Women in Union earn 67.1 cents for every dollar earned by a man.
What is Inequality or Gini Index in Union?
Inequality or Gini Index in Union is 0.47.
What is the Total Population of Union?
Total Population of Union is 267.
What is the Total Male Population of Union?
Total Male Population of Union is 111.
What is the Total Female Population of Union?
Total Female Population of Union is 156.
What is the Ratio of Males per 100 Females in Union?
There are 71.15 Males per 100 Females in Union.
What is the Ratio of Females per 100 Males in Union?
There are 140.54 Females per 100 Males in Union.
What is the Median Population Age in Union?
Median Population Age in Union is 59.8 Years.
What is the Average Family Size in Union
Average Family Size in Union is 4.4 People.
What is the Average Household Size in Union
Average Household Size in Union is 2.7 People.
How Large is the Labor Force in Union?
There are 78 People in the Labor Forcein in Union.
What is the Percentage of People in the Labor Force in Union?
31.0% of People are in the Labor Force in Union.