Hobson City, AL Map & Demographics
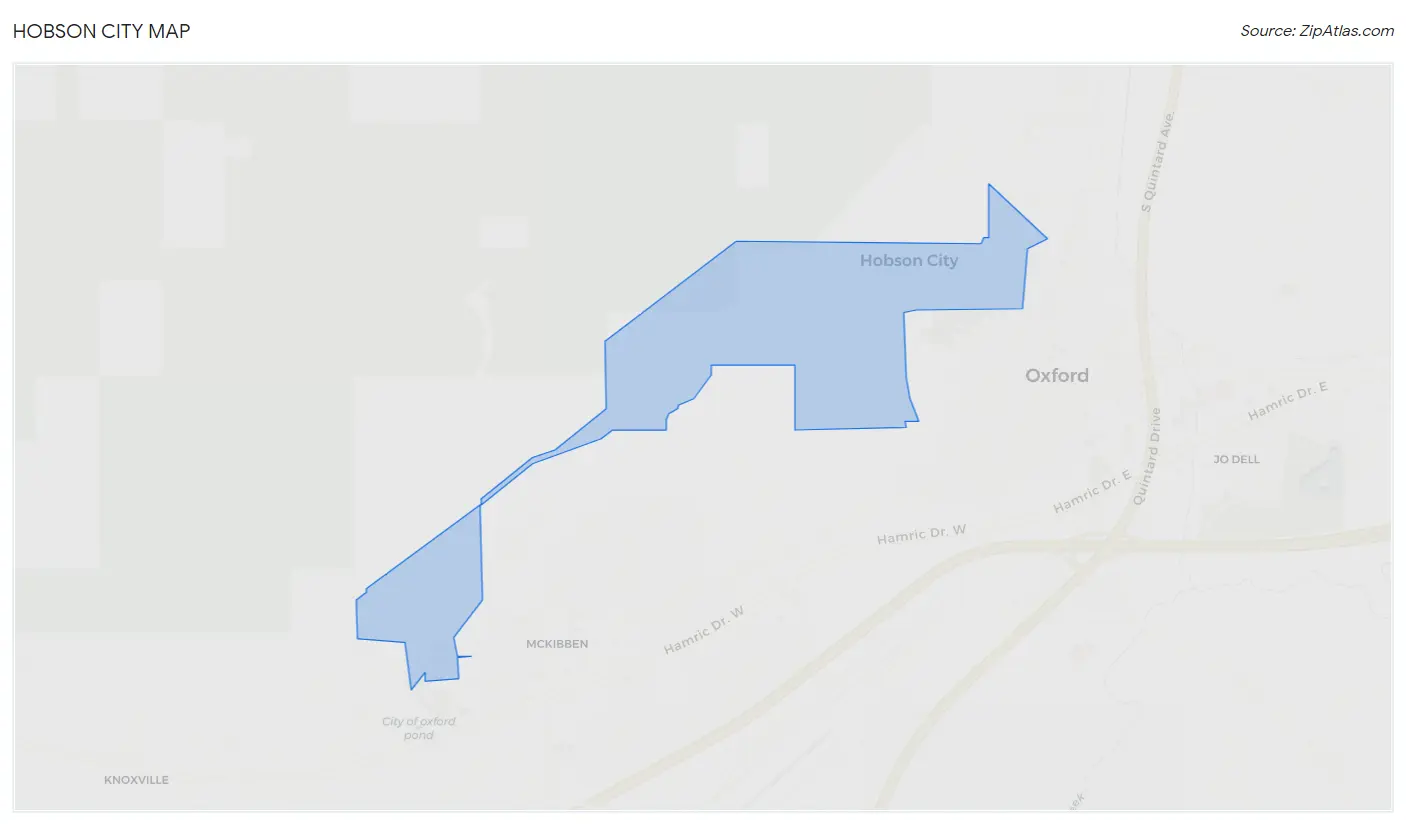
Hobson City Map
Hobson City Overview
$19,848
PER CAPITA INCOME
$58,750
AVG FAMILY INCOME
$46,346
AVG HOUSEHOLD INCOME
5.7%
WAGE / INCOME GAP [ % ]
94.3¢/ $1
WAGE / INCOME GAP [ $ ]
0.43
INEQUALITY / GINI INDEX
978
TOTAL POPULATION
514
MALE POPULATION
464
FEMALE POPULATION
110.78
MALES / 100 FEMALES
90.27
FEMALES / 100 MALES
37.4
MEDIAN AGE
3.9
AVG FAMILY SIZE
3.0
AVG HOUSEHOLD SIZE
474
LABOR FORCE [ PEOPLE ]
64.4%
PERCENT IN LABOR FORCE
4.4%
UNEMPLOYMENT RATE
Hobson City Area Codes
Income in Hobson City
Income Overview in Hobson City
Per Capita Income in Hobson City is $19,848, while median incomes of families and households are $58,750 and $46,346 respectively.
| Characteristic | Number | Measure |
| Per Capita Income | 978 | $19,848 |
| Median Family Income | 215 | $58,750 |
| Mean Family Income | 215 | $62,875 |
| Median Household Income | 326 | $46,346 |
| Mean Household Income | 326 | $53,700 |
| Income Deficit | 215 | $0 |
| Wage / Income Gap (%) | 978 | 5.68% |
| Wage / Income Gap ($) | 978 | 94.32¢ per $1 |
| Gini / Inequality Index | 978 | 0.43 |
Earnings by Sex in Hobson City
Average Earnings in Hobson City are $24,879, $25,603 for men and $24,150 for women, a difference of 5.7%.
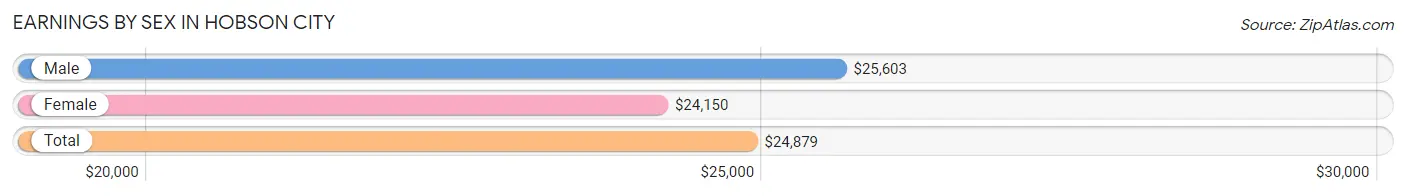
| Sex | Number | Average Earnings |
| Male | 274 (52.1%) | $25,603 |
| Female | 252 (47.9%) | $24,150 |
| Total | 526 (100.0%) | $24,879 |
Earnings by Sex by Income Bracket in Hobson City
The most common earnings brackets in Hobson City are $25,000 to $29,999 for men (58 | 21.2%) and $22,500 to $24,999 for women (50 | 19.8%).
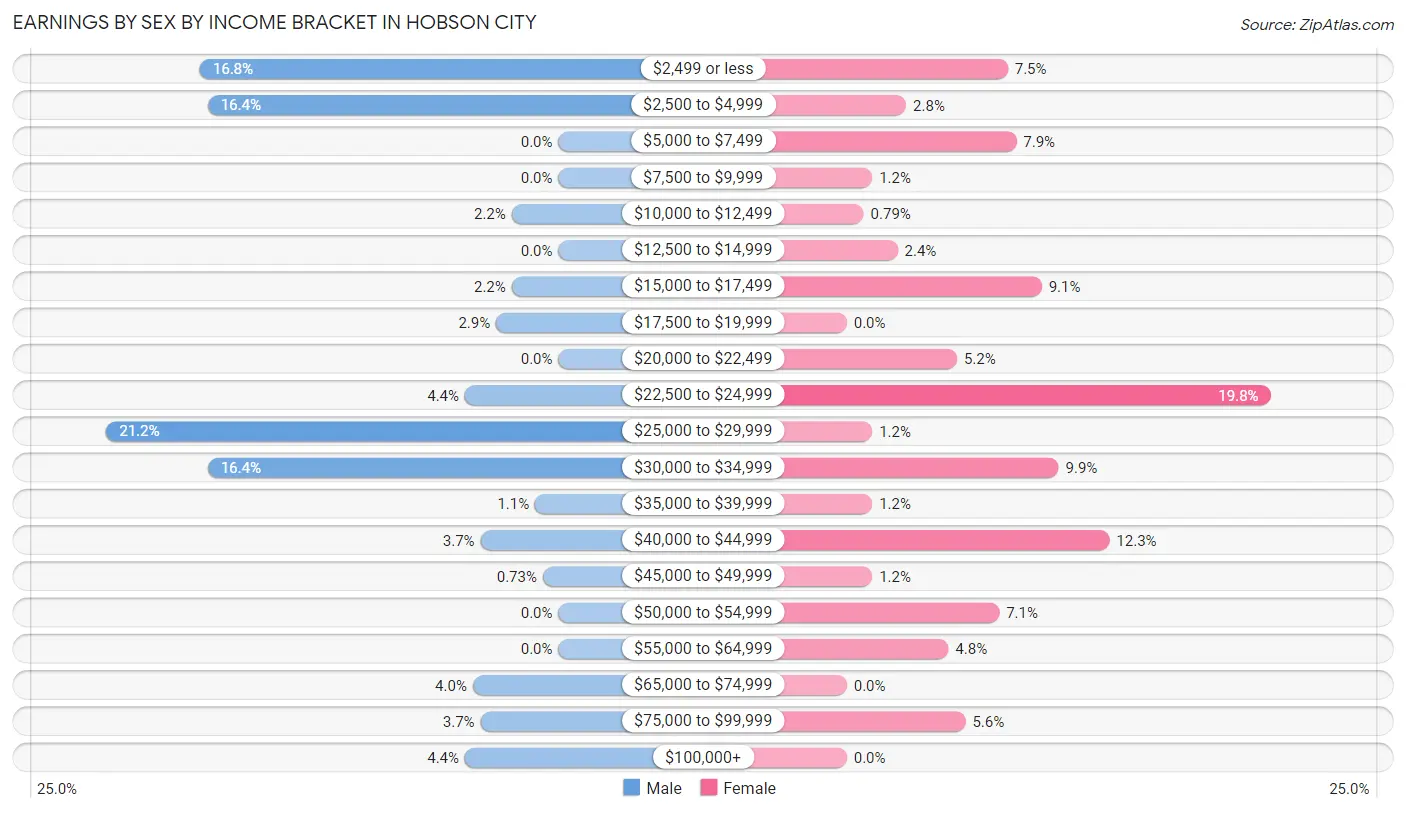
| Income | Male | Female |
| $2,499 or less | 46 (16.8%) | 19 (7.5%) |
| $2,500 to $4,999 | 45 (16.4%) | 7 (2.8%) |
| $5,000 to $7,499 | 0 (0.0%) | 20 (7.9%) |
| $7,500 to $9,999 | 0 (0.0%) | 3 (1.2%) |
| $10,000 to $12,499 | 6 (2.2%) | 2 (0.8%) |
| $12,500 to $14,999 | 0 (0.0%) | 6 (2.4%) |
| $15,000 to $17,499 | 6 (2.2%) | 23 (9.1%) |
| $17,500 to $19,999 | 8 (2.9%) | 0 (0.0%) |
| $20,000 to $22,499 | 0 (0.0%) | 13 (5.2%) |
| $22,500 to $24,999 | 12 (4.4%) | 50 (19.8%) |
| $25,000 to $29,999 | 58 (21.2%) | 3 (1.2%) |
| $30,000 to $34,999 | 45 (16.4%) | 25 (9.9%) |
| $35,000 to $39,999 | 3 (1.1%) | 3 (1.2%) |
| $40,000 to $44,999 | 10 (3.6%) | 31 (12.3%) |
| $45,000 to $49,999 | 2 (0.7%) | 3 (1.2%) |
| $50,000 to $54,999 | 0 (0.0%) | 18 (7.1%) |
| $55,000 to $64,999 | 0 (0.0%) | 12 (4.8%) |
| $65,000 to $74,999 | 11 (4.0%) | 0 (0.0%) |
| $75,000 to $99,999 | 10 (3.6%) | 14 (5.6%) |
| $100,000+ | 12 (4.4%) | 0 (0.0%) |
| Total | 274 (100.0%) | 252 (100.0%) |
Earnings by Sex by Educational Attainment in Hobson City
Average earnings in Hobson City are $26,746 for men and $24,750 for women, a difference of 7.5%. Men with an educational attainment of graduate degree enjoy the highest average annual earnings of $135,000, while those with high school diploma education earn the least with $26,358. Women with an educational attainment of graduate degree earn the most with the average annual earnings of $47,500, while those with high school diploma education have the smallest earnings of $21,731.
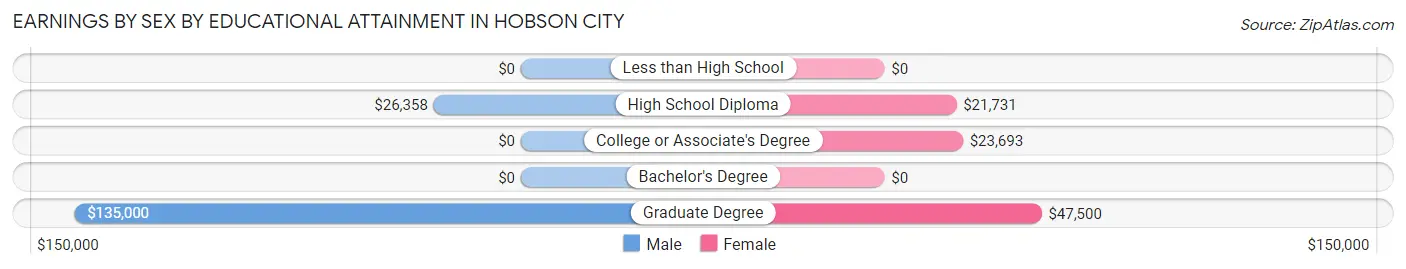
| Educational Attainment | Male Income | Female Income |
| Less than High School | - | - |
| High School Diploma | $26,358 | $21,731 |
| College or Associate's Degree | - | - |
| Bachelor's Degree | - | - |
| Graduate Degree | $135,000 | $47,500 |
| Total | $26,746 | $24,750 |
Family Income in Hobson City
Family Income Brackets in Hobson City
According to the Hobson City family income data, there are 92 families falling into the $50,000 to $74,999 income range, which is the most common income bracket and makes up 42.8% of all families.
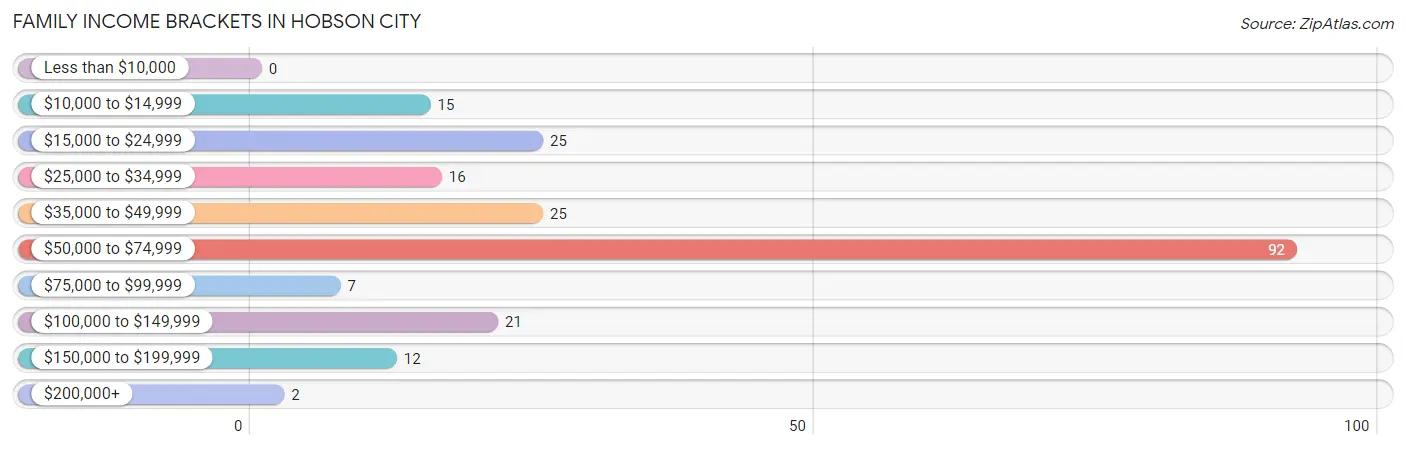
| Income Bracket | # Families | % Families |
| Less than $10,000 | 0 | 0.0% |
| $10,000 to $14,999 | 15 | 7.0% |
| $15,000 to $24,999 | 25 | 11.6% |
| $25,000 to $34,999 | 16 | 7.4% |
| $35,000 to $49,999 | 25 | 11.6% |
| $50,000 to $74,999 | 92 | 42.8% |
| $75,000 to $99,999 | 7 | 3.3% |
| $100,000 to $149,999 | 21 | 9.8% |
| $150,000 to $199,999 | 12 | 5.6% |
| $200,000+ | 2 | 0.9% |
Family Income by Famaliy Size in Hobson City
4-person families (25 | 11.6%) account for the highest median family income in Hobson City with $136,094 per family, while 4-person families (25 | 11.6%) have the highest median income of $34,024 per family member.
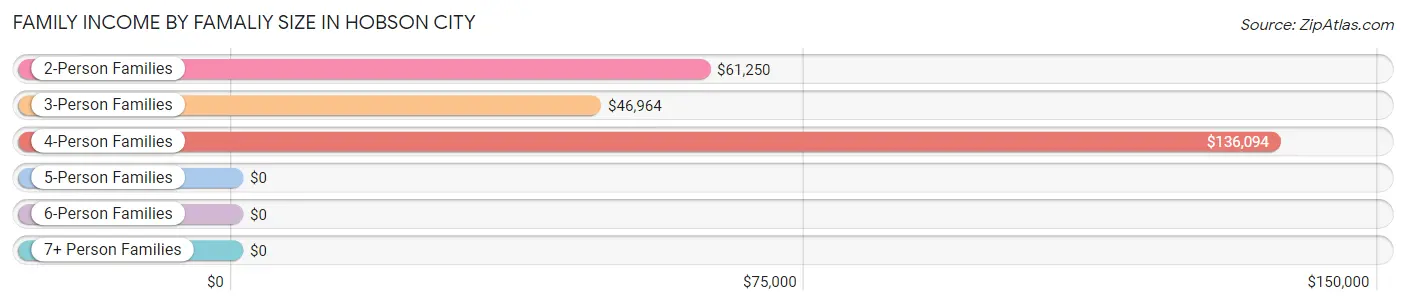
| Income Bracket | # Families | Median Income |
| 2-Person Families | 69 (32.1%) | $61,250 |
| 3-Person Families | 51 (23.7%) | $46,964 |
| 4-Person Families | 25 (11.6%) | $136,094 |
| 5-Person Families | 53 (24.6%) | $0 |
| 6-Person Families | 4 (1.9%) | $0 |
| 7+ Person Families | 13 (6.0%) | $0 |
| Total | 215 (100.0%) | $58,750 |
Family Income by Number of Earners in Hobson City
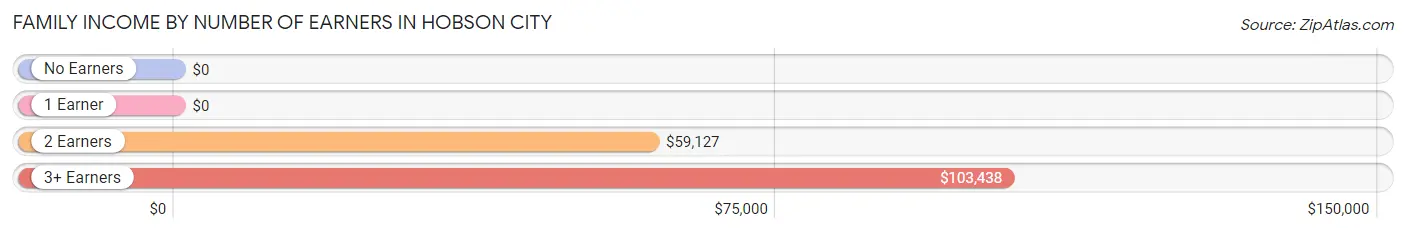
| Number of Earners | # Families | Median Income |
| No Earners | 29 (13.5%) | $0 |
| 1 Earner | 32 (14.9%) | $0 |
| 2 Earners | 145 (67.4%) | $59,127 |
| 3+ Earners | 9 (4.2%) | $103,438 |
| Total | 215 (100.0%) | $58,750 |
Household Income in Hobson City
Household Income Brackets in Hobson City
With 96 households falling in the category, the $50,000 to $74,999 income range is the most frequent in Hobson City, accounting for 29.4% of all households. In contrast, only 2 households (0.6%) fall into the $200,000+ income bracket, making it the least populous group.
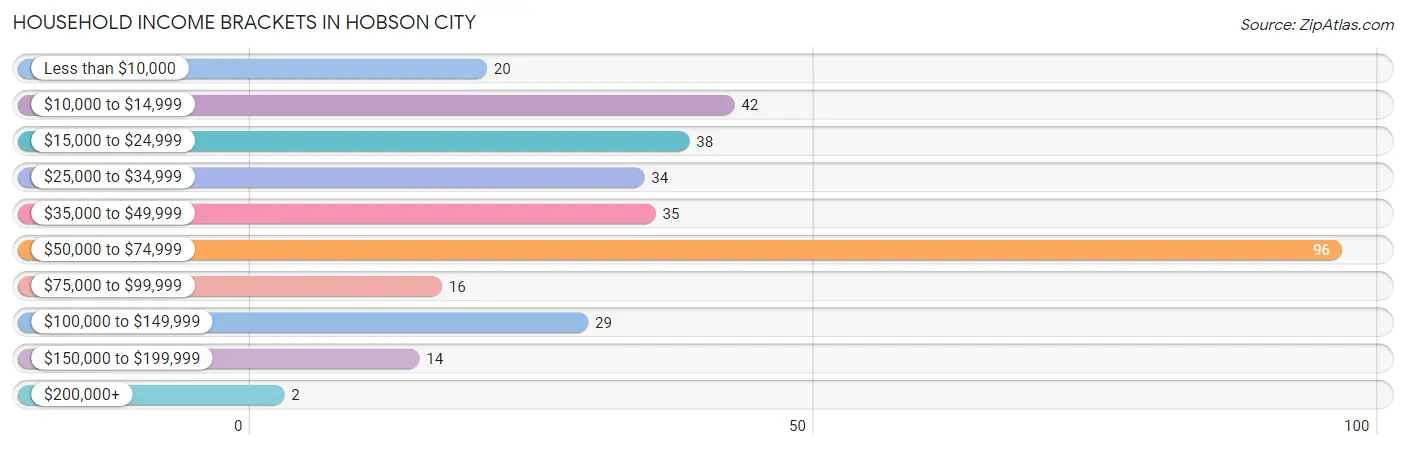
| Income Bracket | # Households | % Households |
| Less than $10,000 | 20 | 6.1% |
| $10,000 to $14,999 | 42 | 12.9% |
| $15,000 to $24,999 | 38 | 11.7% |
| $25,000 to $34,999 | 34 | 10.4% |
| $35,000 to $49,999 | 35 | 10.7% |
| $50,000 to $74,999 | 96 | 29.4% |
| $75,000 to $99,999 | 16 | 4.9% |
| $100,000 to $149,999 | 29 | 8.9% |
| $150,000 to $199,999 | 14 | 4.3% |
| $200,000+ | 2 | 0.6% |
Household Income by Householder Age in Hobson City
The median household income in Hobson City is $46,346, with the highest median household income of $57,571 found in the 45 to 64 years age bracket for the primary householder. A total of 205 households (62.9%) fall into this category.
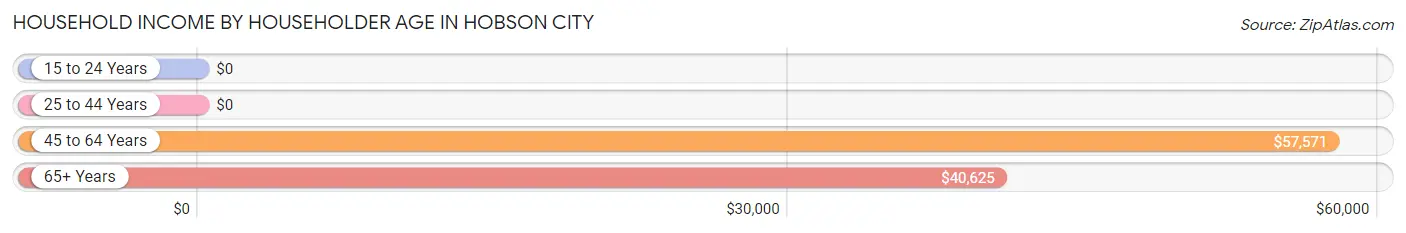
| Income Bracket | # Households | Median Income |
| 15 to 24 Years | 0 (0.0%) | $0 |
| 25 to 44 Years | 62 (19.0%) | $0 |
| 45 to 64 Years | 205 (62.9%) | $57,571 |
| 65+ Years | 59 (18.1%) | $40,625 |
| Total | 326 (100.0%) | $46,346 |
Poverty in Hobson City
Income Below Poverty by Sex and Age in Hobson City
With 14.0% poverty level for males and 29.1% for females among the residents of Hobson City, 16 and 17 year old males and 15 year old females are the most vulnerable to poverty, with 5 males (100.0%) and 3 females (100.0%) in their respective age groups living below the poverty level.
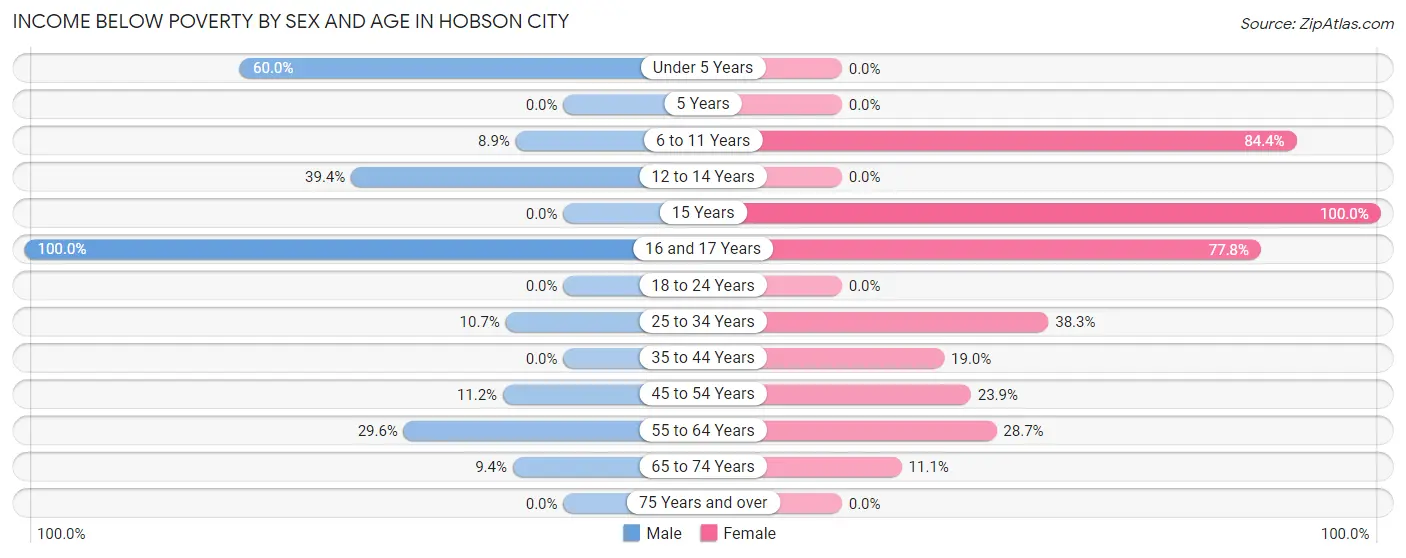
| Age Bracket | Male | Female |
| Under 5 Years | 18 (60.0%) | 0 (0.0%) |
| 5 Years | 0 (0.0%) | 0 (0.0%) |
| 6 to 11 Years | 10 (8.8%) | 27 (84.4%) |
| 12 to 14 Years | 13 (39.4%) | 0 (0.0%) |
| 15 Years | 0 (0.0%) | 3 (100.0%) |
| 16 and 17 Years | 5 (100.0%) | 14 (77.8%) |
| 18 to 24 Years | 0 (0.0%) | 0 (0.0%) |
| 25 to 34 Years | 3 (10.7%) | 23 (38.3%) |
| 35 to 44 Years | 0 (0.0%) | 15 (19.0%) |
| 45 to 54 Years | 12 (11.2%) | 17 (23.9%) |
| 55 to 64 Years | 8 (29.6%) | 31 (28.7%) |
| 65 to 74 Years | 3 (9.4%) | 3 (11.1%) |
| 75 Years and over | 0 (0.0%) | 0 (0.0%) |
| Total | 72 (14.0%) | 133 (29.1%) |
Income Above Poverty by Sex and Age in Hobson City
According to the poverty statistics in Hobson City, males aged 18 to 24 years and females aged under 5 years are the age groups that are most secure financially, with 100.0% of males and 100.0% of females in these age groups living above the poverty line.
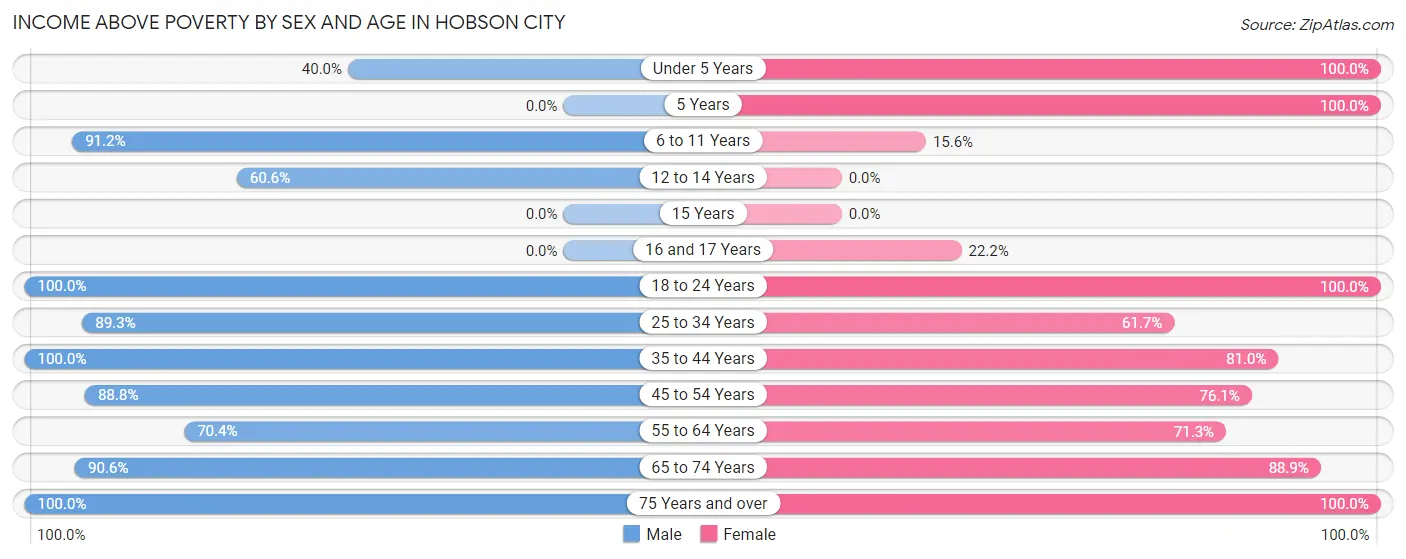
| Age Bracket | Male | Female |
| Under 5 Years | 12 (40.0%) | 21 (100.0%) |
| 5 Years | 0 (0.0%) | 3 (100.0%) |
| 6 to 11 Years | 103 (91.1%) | 5 (15.6%) |
| 12 to 14 Years | 20 (60.6%) | 0 (0.0%) |
| 15 Years | 0 (0.0%) | 0 (0.0%) |
| 16 and 17 Years | 0 (0.0%) | 4 (22.2%) |
| 18 to 24 Years | 91 (100.0%) | 21 (100.0%) |
| 25 to 34 Years | 25 (89.3%) | 37 (61.7%) |
| 35 to 44 Years | 46 (100.0%) | 64 (81.0%) |
| 45 to 54 Years | 95 (88.8%) | 54 (76.1%) |
| 55 to 64 Years | 19 (70.4%) | 77 (71.3%) |
| 65 to 74 Years | 29 (90.6%) | 24 (88.9%) |
| 75 Years and over | 2 (100.0%) | 14 (100.0%) |
| Total | 442 (86.0%) | 324 (70.9%) |
Income Below Poverty Among Married-Couple Families in Hobson City
The poverty statistics for married-couple families in Hobson City show that 2.7% or 3 of the total 112 families live below the poverty line. Families with no children have the highest poverty rate of 8.3%, comprising of 3 families. On the other hand, families with 1 or 2 children have the lowest poverty rate of 0.0%, which includes 0 families.
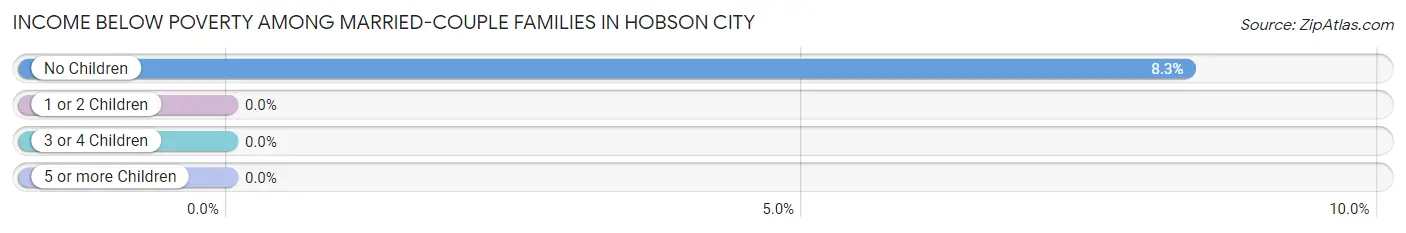
| Children | Above Poverty | Below Poverty |
| No Children | 33 (91.7%) | 3 (8.3%) |
| 1 or 2 Children | 23 (100.0%) | 0 (0.0%) |
| 3 or 4 Children | 53 (100.0%) | 0 (0.0%) |
| 5 or more Children | 0 (0.0%) | 0 (0.0%) |
| Total | 109 (97.3%) | 3 (2.7%) |
Income Below Poverty Among Single-Parent Households in Hobson City
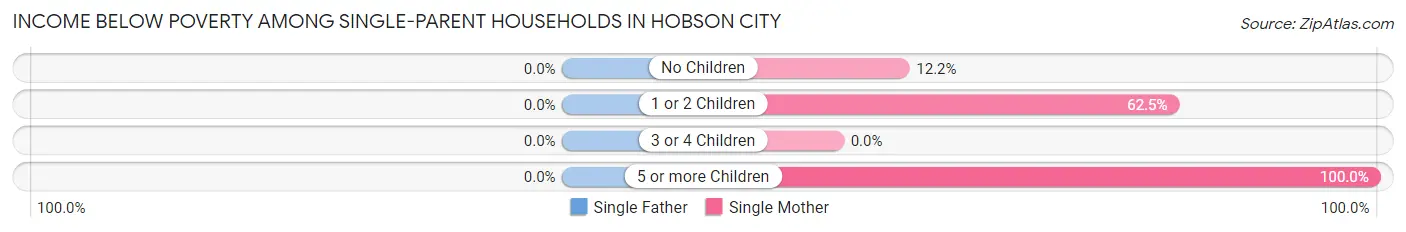
| Children | Single Father | Single Mother |
| No Children | 0 (0.0%) | 6 (12.2%) |
| 1 or 2 Children | 0 (0.0%) | 15 (62.5%) |
| 3 or 4 Children | 0 (0.0%) | 0 (0.0%) |
| 5 or more Children | 0 (0.0%) | 13 (100.0%) |
| Total | 0 (0.0%) | 34 (39.5%) |
Income Below Poverty Among Married-Couple vs Single-Parent Households in Hobson City
The poverty data for Hobson City shows that 3 of the married-couple family households (2.7%) and 34 of the single-parent households (33.0%) are living below the poverty level. Within the married-couple family households, those with no children have the highest poverty rate, with 3 households (8.3%) falling below the poverty line. Among the single-parent households, those with 5 or more children have the highest poverty rate, with 13 household (100.0%) living below poverty.
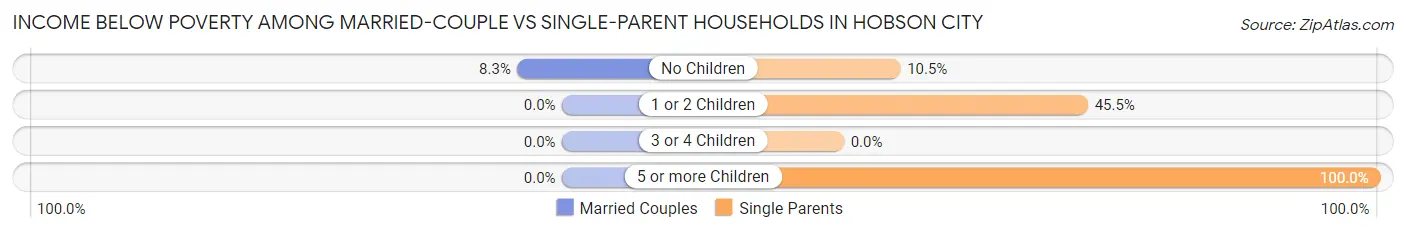
| Children | Married-Couple Families | Single-Parent Households |
| No Children | 3 (8.3%) | 6 (10.5%) |
| 1 or 2 Children | 0 (0.0%) | 15 (45.5%) |
| 3 or 4 Children | 0 (0.0%) | 0 (0.0%) |
| 5 or more Children | 0 (0.0%) | 13 (100.0%) |
| Total | 3 (2.7%) | 34 (33.0%) |
Race in Hobson City
The most populous races in Hobson City are Black / African American (885 | 90.5%), White / Caucasian (66 | 6.8%), and Two or more Races (27 | 2.8%).
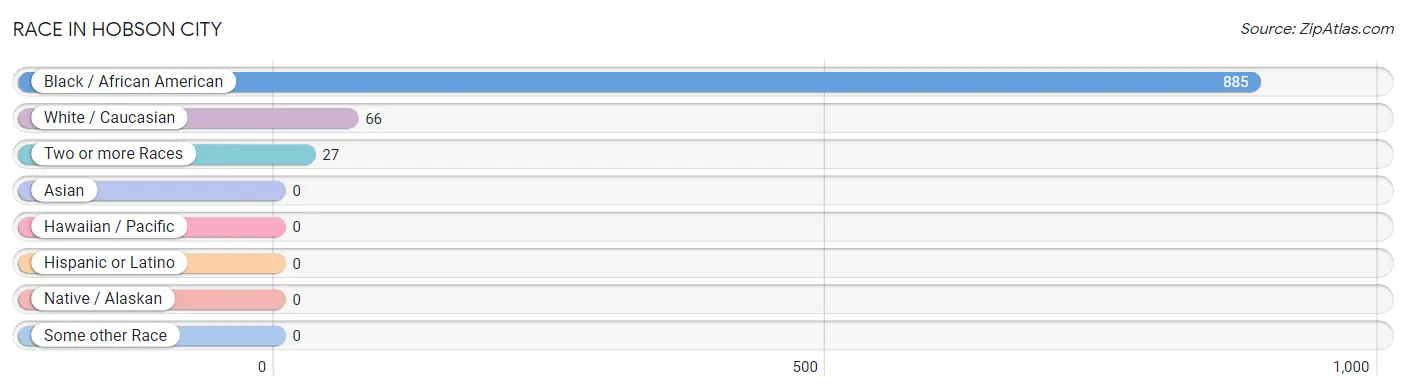
| Race | # Population | % Population |
| Asian | 0 | 0.0% |
| Black / African American | 885 | 90.5% |
| Hawaiian / Pacific | 0 | 0.0% |
| Hispanic or Latino | 0 | 0.0% |
| Native / Alaskan | 0 | 0.0% |
| White / Caucasian | 66 | 6.8% |
| Two or more Races | 27 | 2.8% |
| Some other Race | 0 | 0.0% |
| Total | 978 | 100.0% |
Ancestry in Hobson City
The most populous ancestries reported in Hobson City are American (36 | 3.7%), Blackfeet (13 | 1.3%), Irish (13 | 1.3%), African (8 | 0.8%), and Subsaharan African (8 | 0.8%), together accounting for 8.0% of all Hobson City residents.
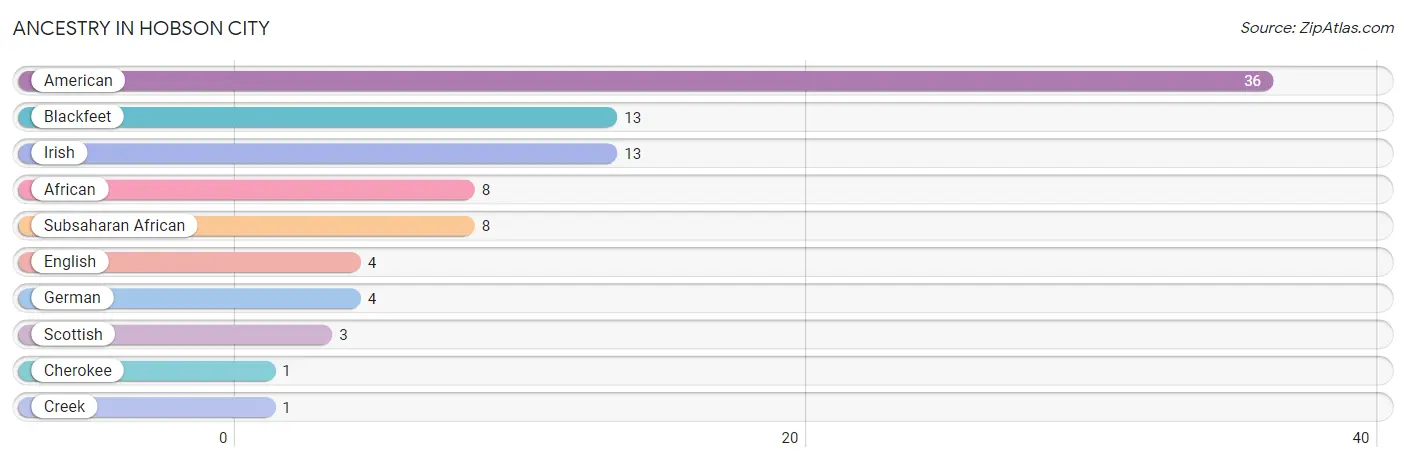
| Ancestry | # Population | % Population |
| African | 8 | 0.8% |
| American | 36 | 3.7% |
| Blackfeet | 13 | 1.3% |
| Cherokee | 1 | 0.1% |
| Creek | 1 | 0.1% |
| English | 4 | 0.4% |
| German | 4 | 0.4% |
| Irish | 13 | 1.3% |
| Scottish | 3 | 0.3% |
| Subsaharan African | 8 | 0.8% | View All 10 Rows |
Immigrants in Hobson City

| Immigration Origin | # Population | % Population | View All 0 Rows |
Sex and Age in Hobson City
Sex and Age in Hobson City
The most populous age groups in Hobson City are 10 to 14 Years (99 | 19.3%) for men and 40 to 44 Years (65 | 14.0%) for women.
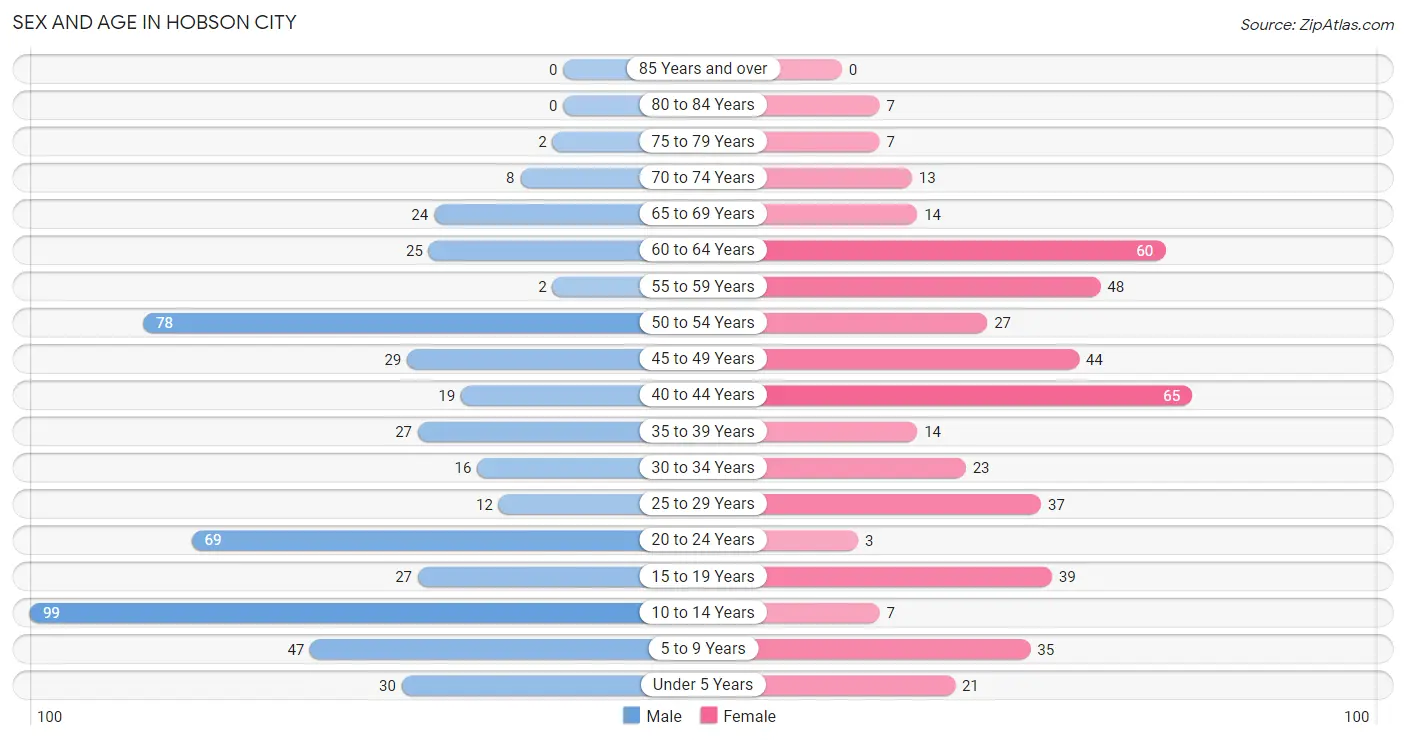
| Age Bracket | Male | Female |
| Under 5 Years | 30 (5.8%) | 21 (4.5%) |
| 5 to 9 Years | 47 (9.1%) | 35 (7.5%) |
| 10 to 14 Years | 99 (19.3%) | 7 (1.5%) |
| 15 to 19 Years | 27 (5.2%) | 39 (8.4%) |
| 20 to 24 Years | 69 (13.4%) | 3 (0.6%) |
| 25 to 29 Years | 12 (2.3%) | 37 (8.0%) |
| 30 to 34 Years | 16 (3.1%) | 23 (5.0%) |
| 35 to 39 Years | 27 (5.2%) | 14 (3.0%) |
| 40 to 44 Years | 19 (3.7%) | 65 (14.0%) |
| 45 to 49 Years | 29 (5.6%) | 44 (9.5%) |
| 50 to 54 Years | 78 (15.2%) | 27 (5.8%) |
| 55 to 59 Years | 2 (0.4%) | 48 (10.3%) |
| 60 to 64 Years | 25 (4.9%) | 60 (12.9%) |
| 65 to 69 Years | 24 (4.7%) | 14 (3.0%) |
| 70 to 74 Years | 8 (1.6%) | 13 (2.8%) |
| 75 to 79 Years | 2 (0.4%) | 7 (1.5%) |
| 80 to 84 Years | 0 (0.0%) | 7 (1.5%) |
| 85 Years and over | 0 (0.0%) | 0 (0.0%) |
| Total | 514 (100.0%) | 464 (100.0%) |
Families and Households in Hobson City
Median Family Size in Hobson City
The median family size in Hobson City is 3.93 persons per family, with single male/father families (17 | 7.9%) accounting for the largest median family size of 4.88 persons per family. On the other hand, married-couple families (112 | 52.1%) represent the smallest median family size with 3.60 persons per family.
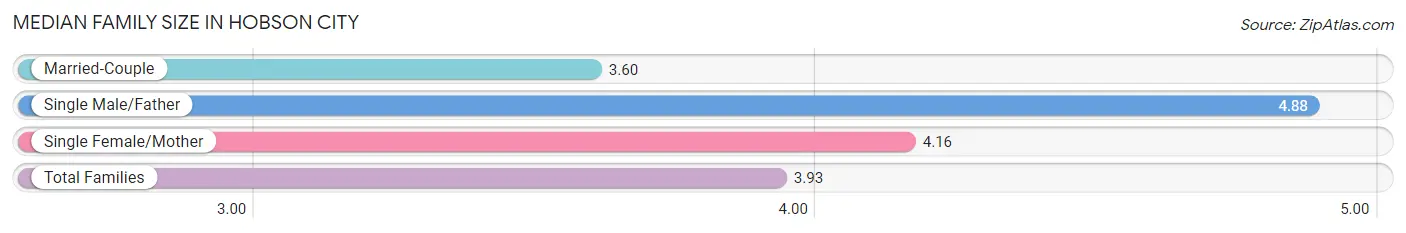
| Family Type | # Families | Family Size |
| Married-Couple | 112 (52.1%) | 3.60 |
| Single Male/Father | 17 (7.9%) | 4.88 |
| Single Female/Mother | 86 (40.0%) | 4.16 |
| Total Families | 215 (100.0%) | 3.93 |
Median Household Size in Hobson City
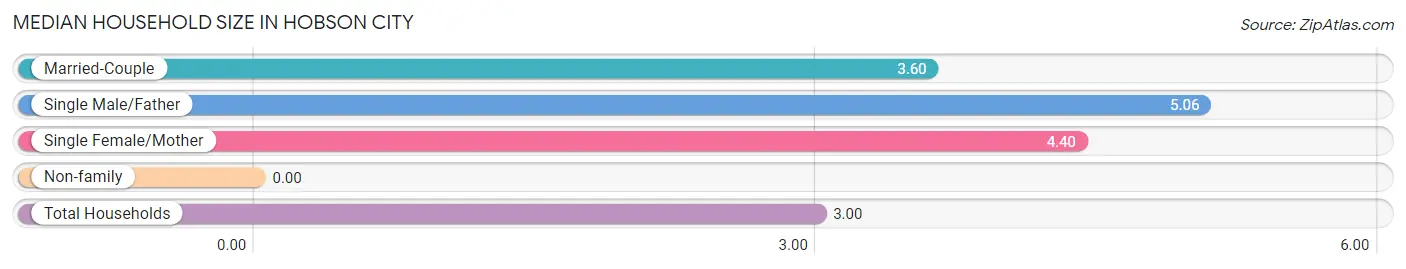
| Household Type | # Households | Household Size |
| Married-Couple | 112 (34.4%) | 3.60 |
| Single Male/Father | 17 (5.2%) | 5.06 |
| Single Female/Mother | 86 (26.4%) | 4.40 |
| Non-family | 111 (34.1%) | - |
| Total Households | 326 (100.0%) | 3.00 |
Household Size by Marriage Status in Hobson City
Out of a total of 326 households in Hobson City, 215 (65.9%) are family households, while 111 (34.1%) are nonfamily households. The most numerous type of family households are 2-person households, comprising 63, and the most common type of nonfamily households are 1-person households, comprising 111.
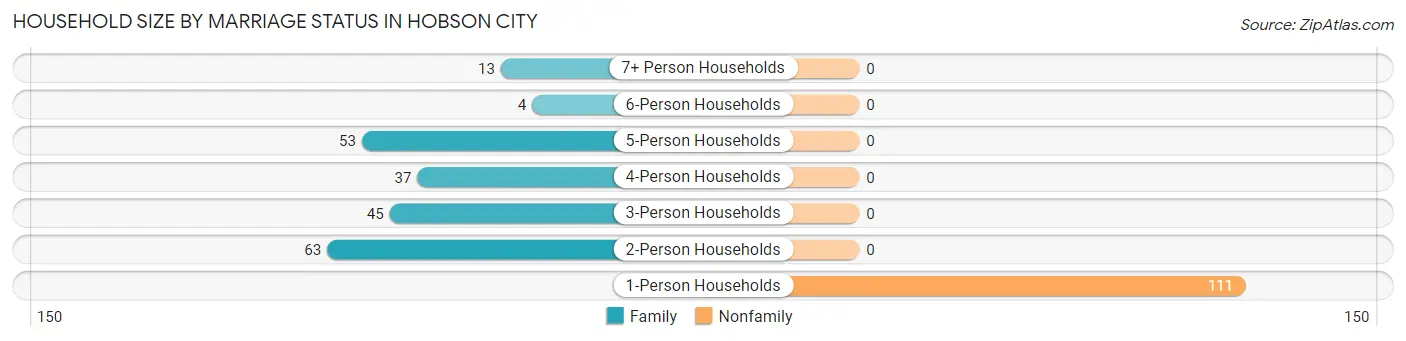
| Household Size | Family Households | Nonfamily Households |
| 1-Person Households | - | 111 (34.1%) |
| 2-Person Households | 63 (19.3%) | 0 (0.0%) |
| 3-Person Households | 45 (13.8%) | 0 (0.0%) |
| 4-Person Households | 37 (11.4%) | 0 (0.0%) |
| 5-Person Households | 53 (16.3%) | 0 (0.0%) |
| 6-Person Households | 4 (1.2%) | 0 (0.0%) |
| 7+ Person Households | 13 (4.0%) | 0 (0.0%) |
| Total | 215 (65.9%) | 111 (34.1%) |
Female Fertility in Hobson City
Fertility by Age in Hobson City
| Age Bracket | Women with Births | Births / 1,000 Women |
| 15 to 19 years | 0 (0.0%) | 0.0 |
| 20 to 34 years | 0 (0.0%) | 0.0 |
| 35 to 50 years | 0 (0.0%) | 0.0 |
| Total | 0 (0.0%) | 0.0 |
Fertility by Age by Marriage Status in Hobson City
| Age Bracket | Married | Unmarried |
| 15 to 19 years | 0 (0.0%) | 0 (0.0%) |
| 20 to 34 years | 0 (0.0%) | 0 (0.0%) |
| 35 to 50 years | 0 (0.0%) | 0 (0.0%) |
| Total | 0 (0.0%) | 0 (0.0%) |
Fertility by Education in Hobson City
| Educational Attainment | Women with Births | Births / 1,000 Women |
| Less than High School | 0 (0.0%) | 0.0 |
| High School Diploma | 0 (0.0%) | 0.0 |
| College or Associate's Degree | 0 (0.0%) | 0.0 |
| Bachelor's Degree | 0 (0.0%) | 0.0 |
| Graduate Degree | 0 (0.0%) | 0.0 |
| Total | 0 (0.0%) | 0.0 |
Fertility by Education by Marriage Status in Hobson City
| Educational Attainment | Married | Unmarried |
| Less than High School | 0 (0.0%) | 0 (0.0%) |
| High School Diploma | 0 (0.0%) | 0 (0.0%) |
| College or Associate's Degree | 0 (0.0%) | 0 (0.0%) |
| Bachelor's Degree | 0 (0.0%) | 0 (0.0%) |
| Graduate Degree | 0 (0.0%) | 0 (0.0%) |
| Total | 0 (0.0%) | 0 (0.0%) |
Employment Characteristics in Hobson City
Employment by Class of Employer in Hobson City
Among the 453 employed individuals in Hobson City, private company employees (320 | 70.6%), local government employees (65 | 14.3%), and not-for-profit organizations (34 | 7.5%) make up the most common classes of employment.
| Employer Class | # Employees | % Employees |
| Private Company Employees | 320 | 70.6% |
| Self-Employed (Incorporated) | 14 | 3.1% |
| Self-Employed (Not Incorporated) | 0 | 0.0% |
| Not-for-profit Organizations | 34 | 7.5% |
| Local Government Employees | 65 | 14.3% |
| State Government Employees | 9 | 2.0% |
| Federal Government Employees | 11 | 2.4% |
| Unpaid Family Workers | 0 | 0.0% |
| Total | 453 | 100.0% |
Employment Status by Age in Hobson City
According to the labor force statistics for Hobson City, out of the total population over 16 years of age (736), 64.4% or 474 individuals are in the labor force, with 4.4% or 21 of them unemployed. The age group with the highest labor force participation rate is 20 to 24 years, with 100.0% or 72 individuals in the labor force. Within the labor force, the 20 to 24 years age range has the highest percentage of unemployed individuals, with 20.8% or 15 of them being unemployed.
| Age Bracket | In Labor Force | Unemployed |
| 16 to 19 Years | 27 (42.9%) | 0 (0.0%) |
| 20 to 24 Years | 72 (100.0%) | 15 (20.8%) |
| 25 to 29 Years | 36 (73.5%) | 0 (0.0%) |
| 30 to 34 Years | 39 (100.0%) | 0 (0.0%) |
| 35 to 44 Years | 62 (49.6%) | 0 (0.0%) |
| 45 to 54 Years | 163 (91.6%) | 1 (0.6%) |
| 55 to 59 Years | 37 (74.0%) | 5 (13.5%) |
| 60 to 64 Years | 18 (21.2%) | 0 (0.0%) |
| 65 to 74 Years | 20 (33.9%) | 0 (0.0%) |
| 75 Years and over | 0 (0.0%) | 0 (0.0%) |
| Total | 474 (64.4%) | 21 (4.4%) |
Employment Status by Educational Attainment in Hobson City
According to labor force statistics for Hobson City, 67.5% of individuals (355) out of the total population between 25 and 64 years of age (526) are in the labor force, with 1.7% or 6 of them being unemployed. The group with the highest labor force participation rate are those with the educational attainment of bachelor's degree or higher, with 78.3% or 72 individuals in the labor force. Within the labor force, individuals with college / associate degree education have the highest percentage of unemployment, with 6.6% or 6 of them being unemployed.
| Educational Attainment | In Labor Force | Unemployed |
| Less than High School | 28 (50.0%) | 0 (0.0%) |
| High School Diploma | 164 (75.2%) | 0 (0.0%) |
| College / Associate Degree | 91 (56.9%) | 11 (6.6%) |
| Bachelor's Degree or higher | 72 (78.3%) | 0 (0.0%) |
| Total | 355 (67.5%) | 9 (1.7%) |
Employment Occupations by Sex in Hobson City
Management, Business, Science and Arts Occupations
The most common Management, Business, Science and Arts occupations in Hobson City are Management (44 | 9.7%), Community & Social Service (27 | 6.0%), Education Instruction & Library (24 | 5.3%), Health Diagnosing & Treating (13 | 2.9%), and Health Technologists (10 | 2.2%).
Management, Business, Science and Arts Occupations by Sex
Within the Management, Business, Science and Arts occupations in Hobson City, the most male-oriented occupations are Education, Arts & Media (100.0%), Health Technologists (70.0%), and Health Diagnosing & Treating (53.8%), while the most female-oriented occupations are Computers, Engineering & Science (100.0%), Computers & Mathematics (100.0%), and Management (90.9%).
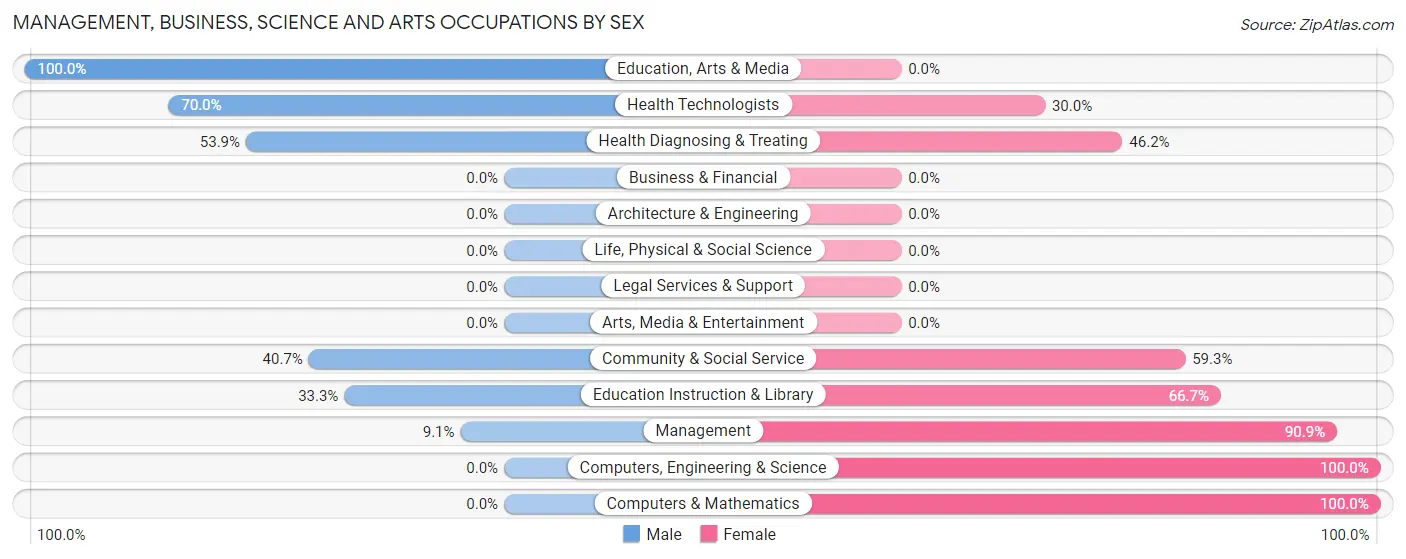
| Occupation | Male | Female |
| Management | 4 (9.1%) | 40 (90.9%) |
| Business & Financial | 0 (0.0%) | 0 (0.0%) |
| Computers, Engineering & Science | 0 (0.0%) | 6 (100.0%) |
| Computers & Mathematics | 0 (0.0%) | 6 (100.0%) |
| Architecture & Engineering | 0 (0.0%) | 0 (0.0%) |
| Life, Physical & Social Science | 0 (0.0%) | 0 (0.0%) |
| Community & Social Service | 11 (40.7%) | 16 (59.3%) |
| Education, Arts & Media | 3 (100.0%) | 0 (0.0%) |
| Legal Services & Support | 0 (0.0%) | 0 (0.0%) |
| Education Instruction & Library | 8 (33.3%) | 16 (66.7%) |
| Arts, Media & Entertainment | 0 (0.0%) | 0 (0.0%) |
| Health Diagnosing & Treating | 7 (53.8%) | 6 (46.2%) |
| Health Technologists | 7 (70.0%) | 3 (30.0%) |
| Total (Category) | 22 (24.4%) | 68 (75.6%) |
| Total (Overall) | 259 (57.2%) | 194 (42.8%) |
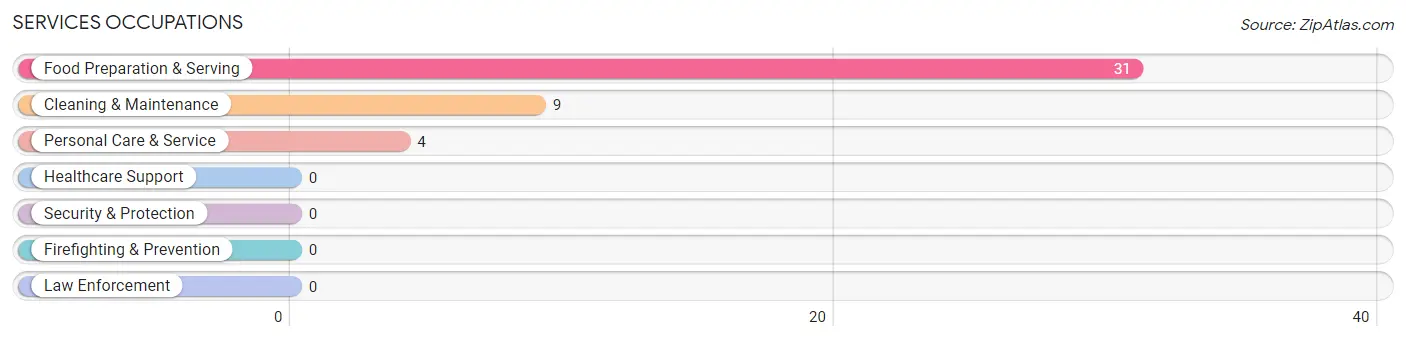
Services Occupations
The most common Services occupations in Hobson City are Food Preparation & Serving (31 | 6.8%), Cleaning & Maintenance (9 | 2.0%), and Personal Care & Service (4 | 0.9%).
Services Occupations by Sex
Within the Services occupations in Hobson City, the most male-oriented occupations are Cleaning & Maintenance (66.7%), and Food Preparation & Serving (25.8%), while the most female-oriented occupations are Personal Care & Service (100.0%), Food Preparation & Serving (74.2%), and Cleaning & Maintenance (33.3%).
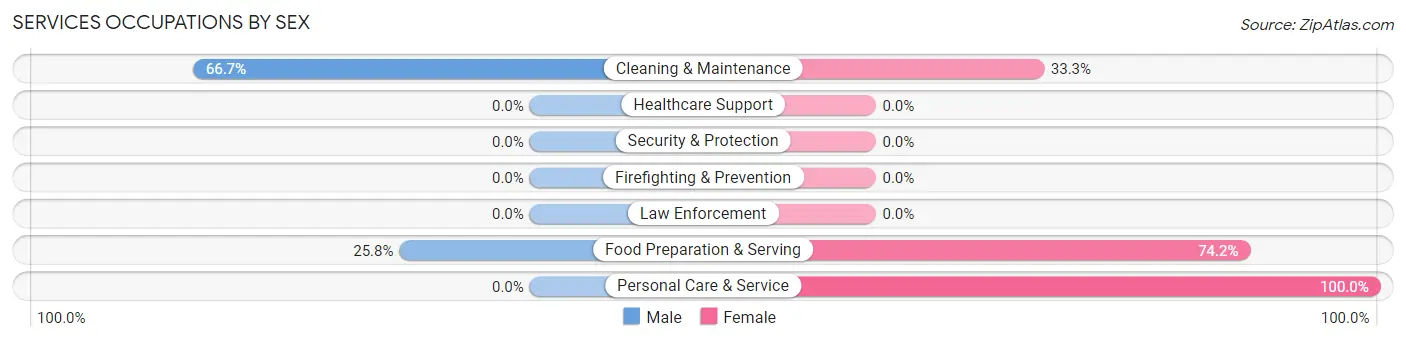
| Occupation | Male | Female |
| Healthcare Support | 0 (0.0%) | 0 (0.0%) |
| Security & Protection | 0 (0.0%) | 0 (0.0%) |
| Firefighting & Prevention | 0 (0.0%) | 0 (0.0%) |
| Law Enforcement | 0 (0.0%) | 0 (0.0%) |
| Food Preparation & Serving | 8 (25.8%) | 23 (74.2%) |
| Cleaning & Maintenance | 6 (66.7%) | 3 (33.3%) |
| Personal Care & Service | 0 (0.0%) | 4 (100.0%) |
| Total (Category) | 14 (31.8%) | 30 (68.2%) |
| Total (Overall) | 259 (57.2%) | 194 (42.8%) |
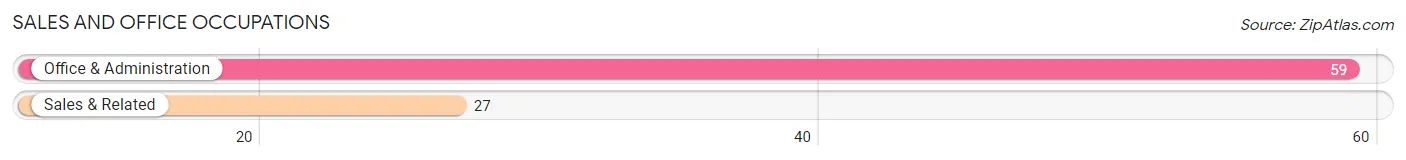
Sales and Office Occupations
The most common Sales and Office occupations in Hobson City are Office & Administration (59 | 13.0%), and Sales & Related (27 | 6.0%).
Sales and Office Occupations by Sex
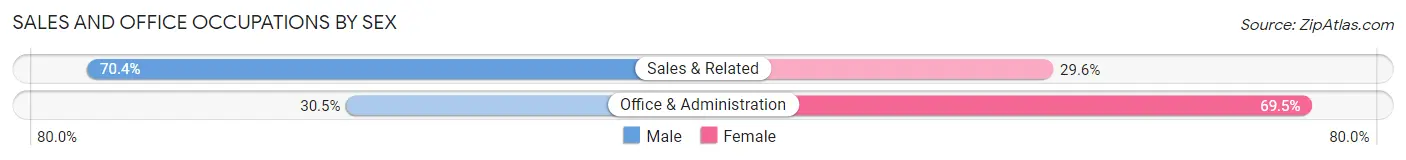
| Occupation | Male | Female |
| Sales & Related | 19 (70.4%) | 8 (29.6%) |
| Office & Administration | 18 (30.5%) | 41 (69.5%) |
| Total (Category) | 37 (43.0%) | 49 (57.0%) |
| Total (Overall) | 259 (57.2%) | 194 (42.8%) |
Natural Resources, Construction and Maintenance Occupations
The most common Natural Resources, Construction and Maintenance occupations in Hobson City are Construction & Extraction (62 | 13.7%), and Installation, Maintenance & Repair (58 | 12.8%).
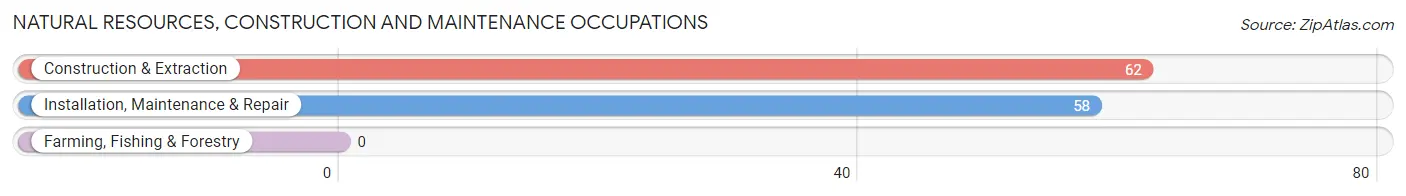
Natural Resources, Construction and Maintenance Occupations by Sex
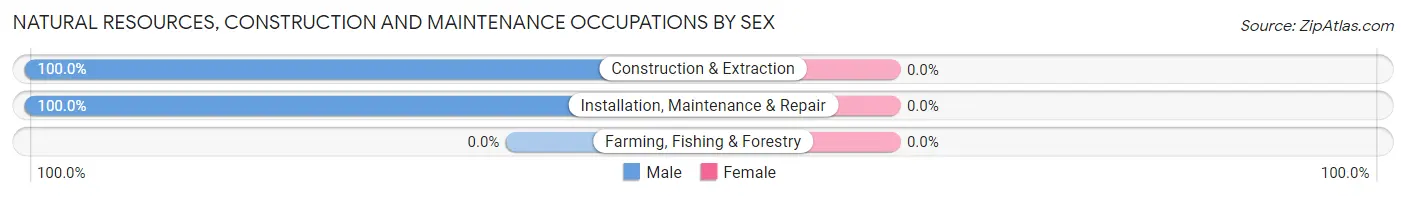
| Occupation | Male | Female |
| Farming, Fishing & Forestry | 0 (0.0%) | 0 (0.0%) |
| Construction & Extraction | 62 (100.0%) | 0 (0.0%) |
| Installation, Maintenance & Repair | 58 (100.0%) | 0 (0.0%) |
| Total (Category) | 120 (100.0%) | 0 (0.0%) |
| Total (Overall) | 259 (57.2%) | 194 (42.8%) |
Production, Transportation and Moving Occupations
The most common Production, Transportation and Moving occupations in Hobson City are Production (52 | 11.5%), Material Moving (40 | 8.8%), and Transportation (21 | 4.6%).
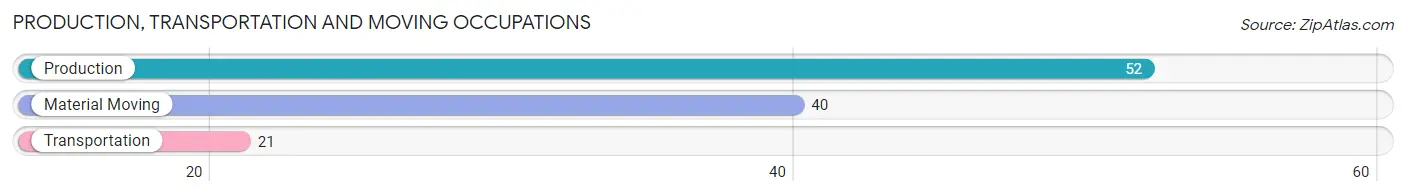
Production, Transportation and Moving Occupations by Sex
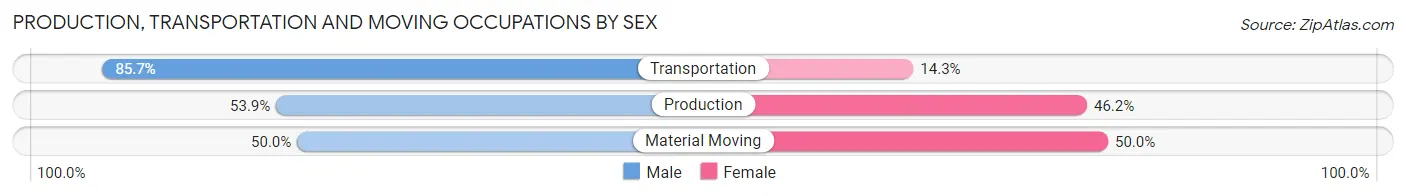
| Occupation | Male | Female |
| Production | 28 (53.8%) | 24 (46.2%) |
| Transportation | 18 (85.7%) | 3 (14.3%) |
| Material Moving | 20 (50.0%) | 20 (50.0%) |
| Total (Category) | 66 (58.4%) | 47 (41.6%) |
| Total (Overall) | 259 (57.2%) | 194 (42.8%) |
Employment Industries by Sex in Hobson City
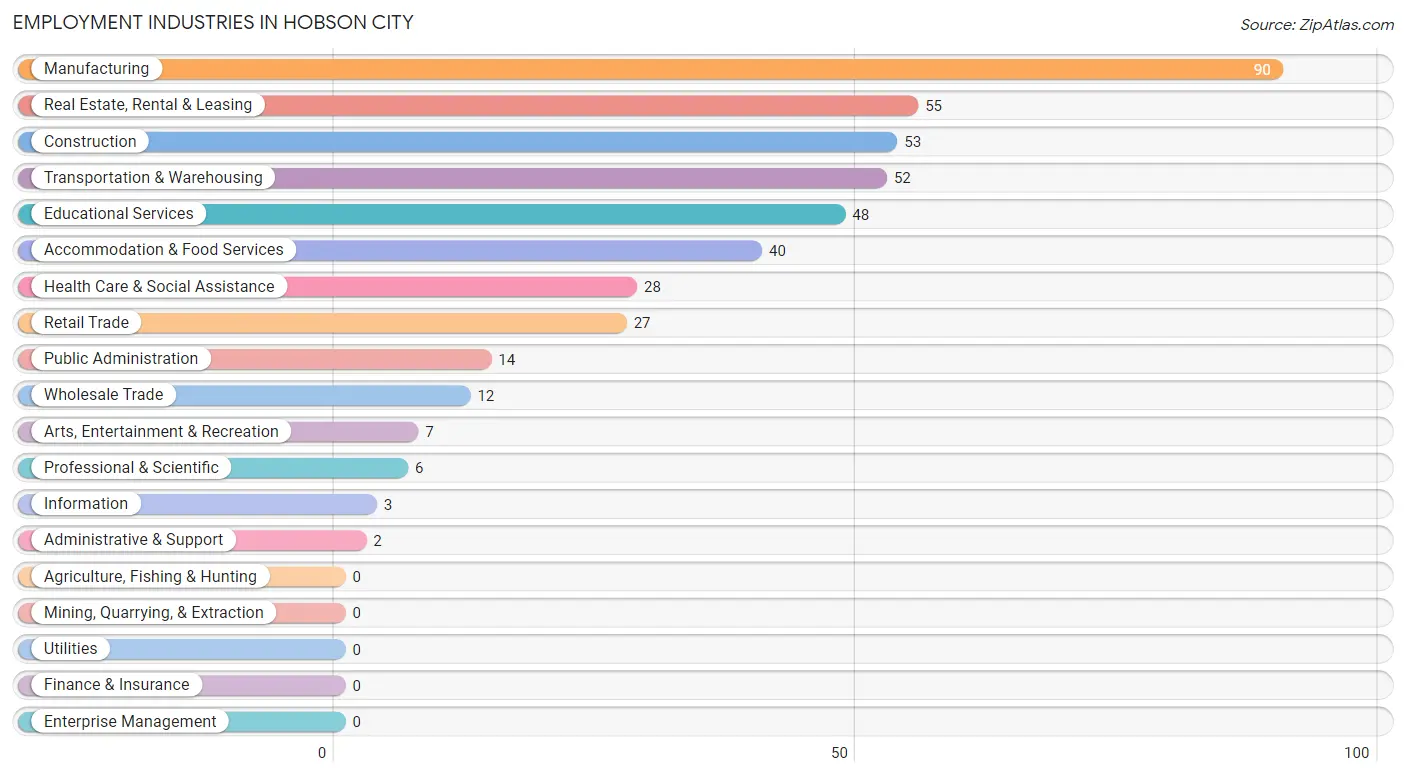
Employment Industries in Hobson City
The major employment industries in Hobson City include Manufacturing (90 | 19.9%), Real Estate, Rental & Leasing (55 | 12.1%), Construction (53 | 11.7%), Transportation & Warehousing (52 | 11.5%), and Educational Services (48 | 10.6%).
Employment Industries by Sex in Hobson City
The Hobson City industries that see more men than women are Construction (100.0%), Wholesale Trade (100.0%), and Administrative & Support (100.0%), whereas the industries that tend to have a higher number of women are Information (100.0%), Professional & Scientific (100.0%), and Arts, Entertainment & Recreation (100.0%).
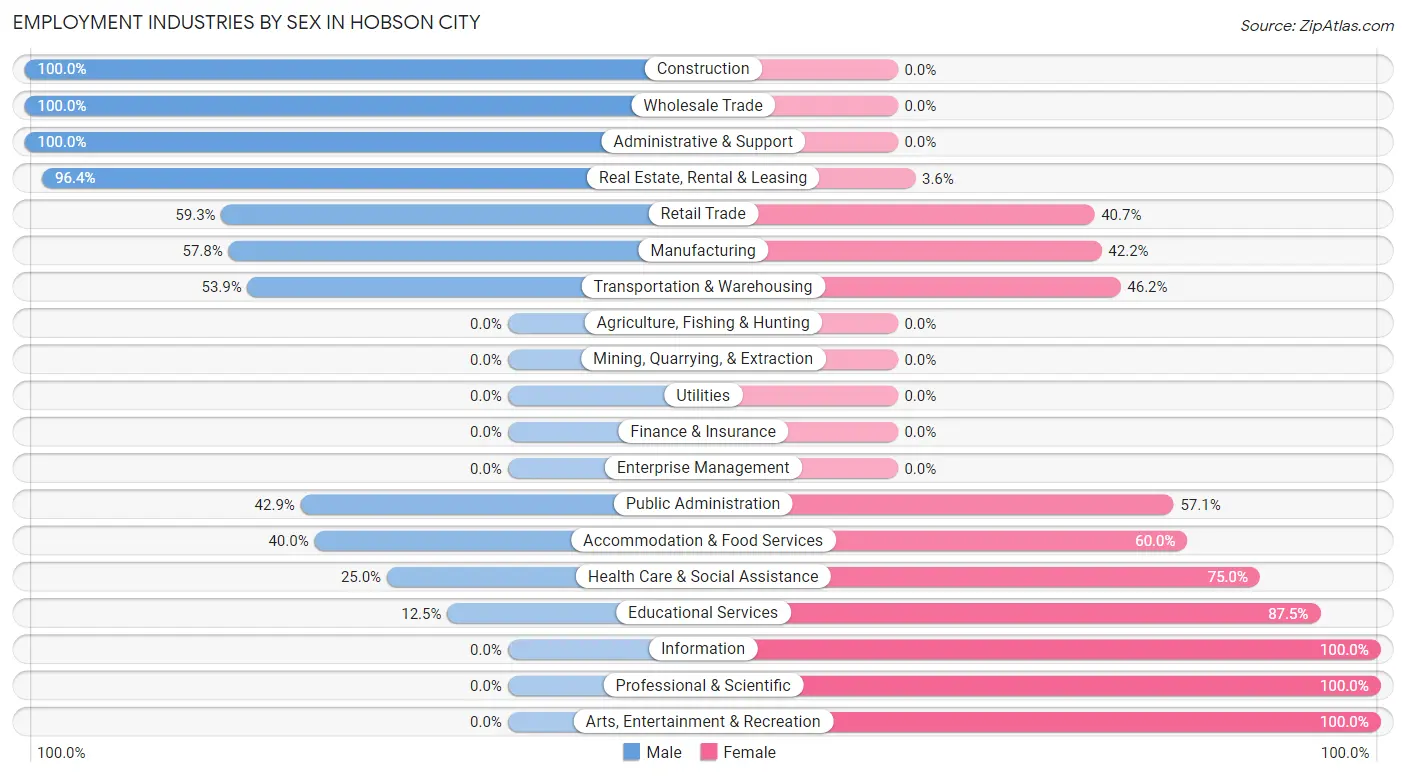
| Industry | Male | Female |
| Agriculture, Fishing & Hunting | 0 (0.0%) | 0 (0.0%) |
| Mining, Quarrying, & Extraction | 0 (0.0%) | 0 (0.0%) |
| Construction | 53 (100.0%) | 0 (0.0%) |
| Manufacturing | 52 (57.8%) | 38 (42.2%) |
| Wholesale Trade | 12 (100.0%) | 0 (0.0%) |
| Retail Trade | 16 (59.3%) | 11 (40.7%) |
| Transportation & Warehousing | 28 (53.8%) | 24 (46.2%) |
| Utilities | 0 (0.0%) | 0 (0.0%) |
| Information | 0 (0.0%) | 3 (100.0%) |
| Finance & Insurance | 0 (0.0%) | 0 (0.0%) |
| Real Estate, Rental & Leasing | 53 (96.4%) | 2 (3.6%) |
| Professional & Scientific | 0 (0.0%) | 6 (100.0%) |
| Enterprise Management | 0 (0.0%) | 0 (0.0%) |
| Administrative & Support | 2 (100.0%) | 0 (0.0%) |
| Educational Services | 6 (12.5%) | 42 (87.5%) |
| Health Care & Social Assistance | 7 (25.0%) | 21 (75.0%) |
| Arts, Entertainment & Recreation | 0 (0.0%) | 7 (100.0%) |
| Accommodation & Food Services | 16 (40.0%) | 24 (60.0%) |
| Public Administration | 6 (42.9%) | 8 (57.1%) |
| Total | 259 (57.2%) | 194 (42.8%) |
Education in Hobson City
School Enrollment in Hobson City
The most common levels of schooling among the 272 students in Hobson City are middle school (108 | 39.7%), elementary school (72 | 26.5%), and high school (53 | 19.5%).
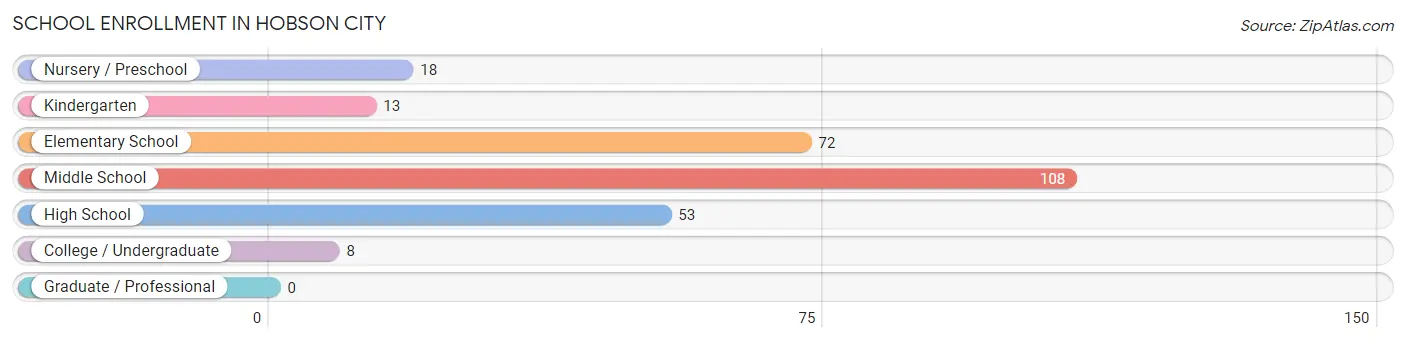
| School Level | # Students | % Students |
| Nursery / Preschool | 18 | 6.6% |
| Kindergarten | 13 | 4.8% |
| Elementary School | 72 | 26.5% |
| Middle School | 108 | 39.7% |
| High School | 53 | 19.5% |
| College / Undergraduate | 8 | 2.9% |
| Graduate / Professional | 0 | 0.0% |
| Total | 272 | 100.0% |
School Enrollment by Age by Funding Source in Hobson City
Out of a total of 272 students who are enrolled in schools in Hobson City, 15 (5.5%) attend a private institution, while the remaining 257 (94.5%) are enrolled in public schools. The age group of 15 to 17 year olds has the highest likelihood of being enrolled in private schools, with 4 (15.4% in the age bracket) enrolled. Conversely, the age group of 3 to 4 year olds has the lowest likelihood of being enrolled in a private school, with 28 (100.0% in the age bracket) attending a public institution.
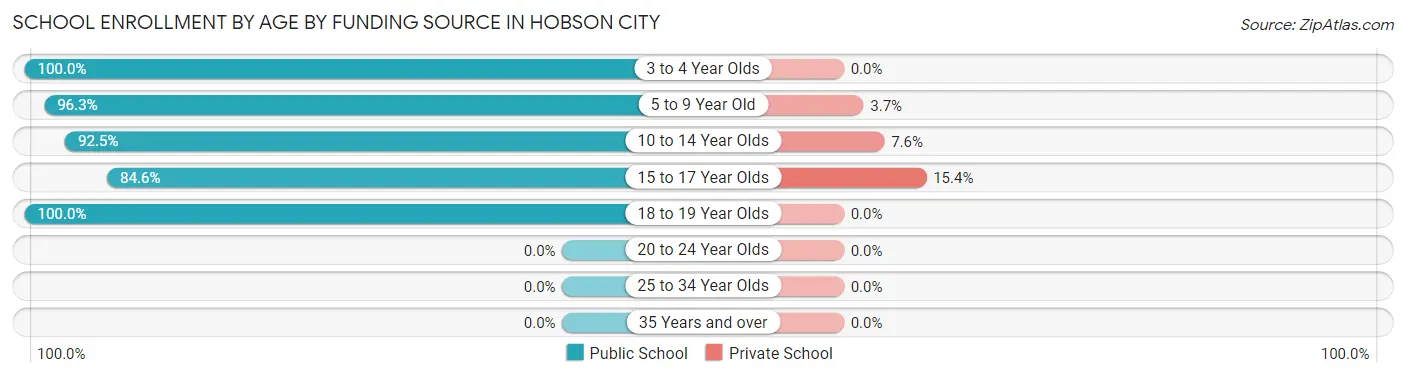
| Age Bracket | Public School | Private School |
| 3 to 4 Year Olds | 28 (100.0%) | 0 (0.0%) |
| 5 to 9 Year Old | 79 (96.3%) | 3 (3.7%) |
| 10 to 14 Year Olds | 98 (92.4%) | 8 (7.5%) |
| 15 to 17 Year Olds | 22 (84.6%) | 4 (15.4%) |
| 18 to 19 Year Olds | 30 (100.0%) | 0 (0.0%) |
| 20 to 24 Year Olds | 0 (0.0%) | 0 (0.0%) |
| 25 to 34 Year Olds | 0 (0.0%) | 0 (0.0%) |
| 35 Years and over | 0 (0.0%) | 0 (0.0%) |
| Total | 257 (94.5%) | 15 (5.5%) |
Educational Attainment by Field of Study in Hobson City
Arts & humanities (28 | 26.7%), science & technology (23 | 21.9%), business (18 | 17.1%), education (17 | 16.2%), and liberal arts & history (9 | 8.6%) are the most common fields of study among 105 individuals in Hobson City who have obtained a bachelor's degree or higher.
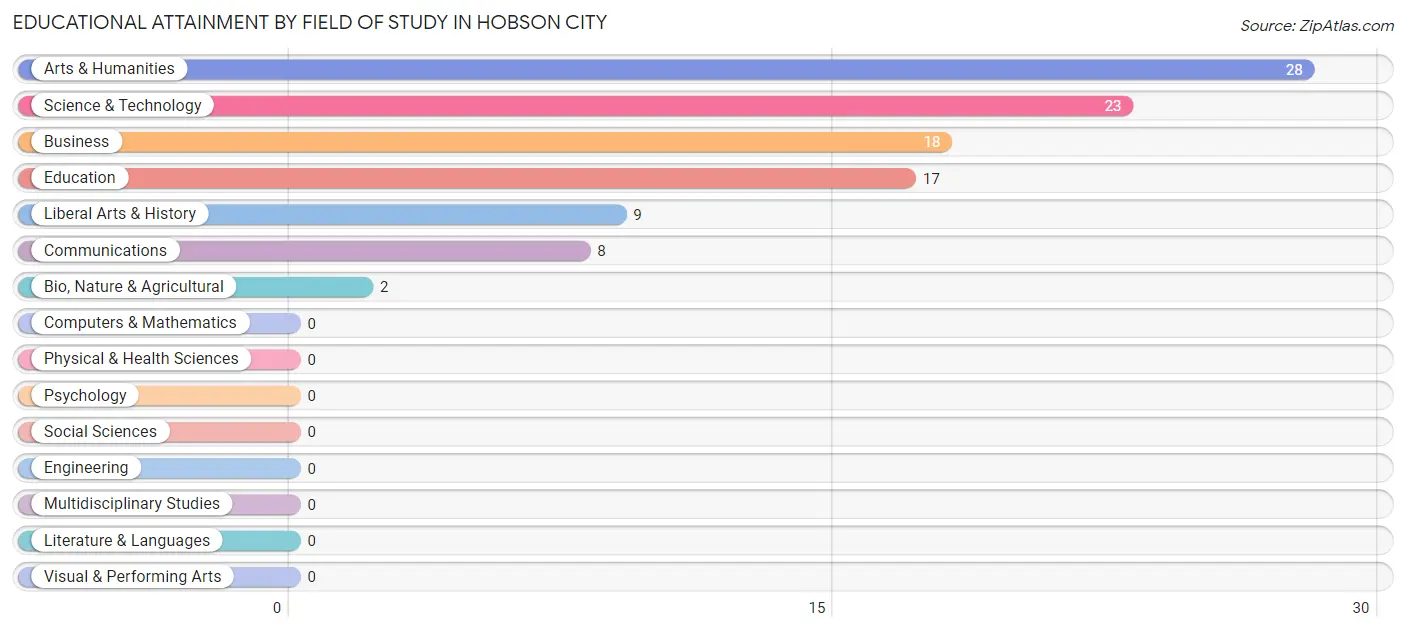
| Field of Study | # Graduates | % Graduates |
| Computers & Mathematics | 0 | 0.0% |
| Bio, Nature & Agricultural | 2 | 1.9% |
| Physical & Health Sciences | 0 | 0.0% |
| Psychology | 0 | 0.0% |
| Social Sciences | 0 | 0.0% |
| Engineering | 0 | 0.0% |
| Multidisciplinary Studies | 0 | 0.0% |
| Science & Technology | 23 | 21.9% |
| Business | 18 | 17.1% |
| Education | 17 | 16.2% |
| Literature & Languages | 0 | 0.0% |
| Liberal Arts & History | 9 | 8.6% |
| Visual & Performing Arts | 0 | 0.0% |
| Communications | 8 | 7.6% |
| Arts & Humanities | 28 | 26.7% |
| Total | 105 | 100.0% |
Transportation & Commute in Hobson City
Vehicle Availability by Sex in Hobson City
The most prevalent vehicle ownership categories in Hobson City are males with 2 vehicles (78, accounting for 30.1%) and females with 2 vehicles (86, making up 40.2%).
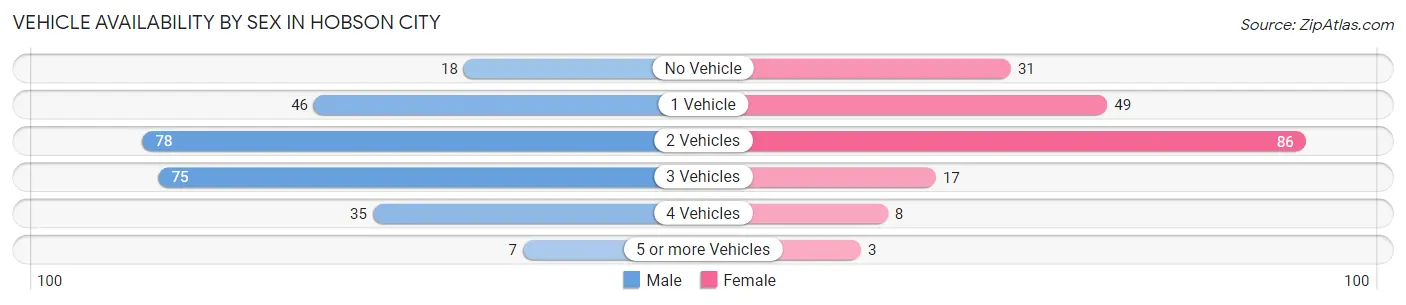
| Vehicles Available | Male | Female |
| No Vehicle | 18 (7.0%) | 31 (16.0%) |
| 1 Vehicle | 46 (17.8%) | 49 (25.3%) |
| 2 Vehicles | 78 (30.1%) | 86 (44.3%) |
| 3 Vehicles | 75 (29.0%) | 17 (8.8%) |
| 4 Vehicles | 35 (13.5%) | 8 (4.1%) |
| 5 or more Vehicles | 7 (2.7%) | 3 (1.5%) |
| Total | 259 (100.0%) | 194 (100.0%) |
Commute Time in Hobson City
The most frequently occuring commute durations in Hobson City are 15 to 19 minutes (129 commuters, 29.4%), 45 to 59 minutes (74 commuters, 16.9%), and 10 to 14 minutes (45 commuters, 10.3%).

| Commute Time | # Commuters | % Commuters |
| Less than 5 Minutes | 20 | 4.6% |
| 5 to 9 Minutes | 14 | 3.2% |
| 10 to 14 Minutes | 45 | 10.3% |
| 15 to 19 Minutes | 129 | 29.4% |
| 20 to 24 Minutes | 37 | 8.5% |
| 25 to 29 Minutes | 31 | 7.1% |
| 30 to 34 Minutes | 43 | 9.8% |
| 35 to 39 Minutes | 0 | 0.0% |
| 40 to 44 Minutes | 0 | 0.0% |
| 45 to 59 Minutes | 74 | 16.9% |
| 60 to 89 Minutes | 43 | 9.8% |
| 90 or more Minutes | 2 | 0.5% |
Commute Time by Sex in Hobson City
The most common commute times in Hobson City are 15 to 19 minutes (100 commuters, 41.0%) for males and 60 to 89 minutes (41 commuters, 21.1%) for females.
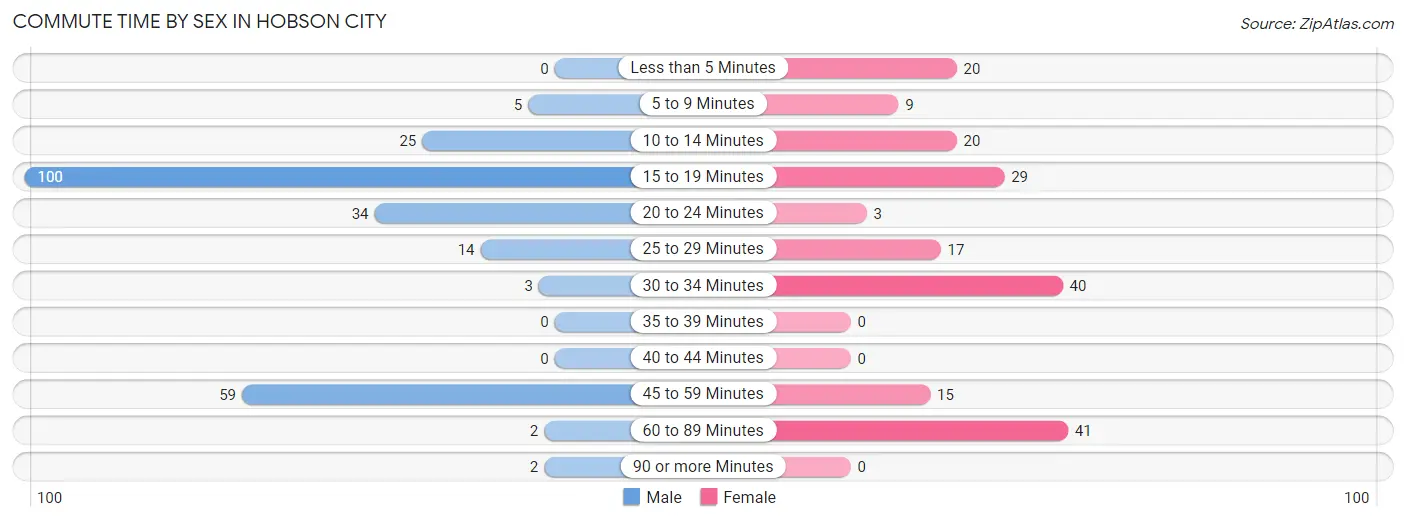
| Commute Time | Male | Female |
| Less than 5 Minutes | 0 (0.0%) | 20 (10.3%) |
| 5 to 9 Minutes | 5 (2.1%) | 9 (4.6%) |
| 10 to 14 Minutes | 25 (10.2%) | 20 (10.3%) |
| 15 to 19 Minutes | 100 (41.0%) | 29 (14.9%) |
| 20 to 24 Minutes | 34 (13.9%) | 3 (1.5%) |
| 25 to 29 Minutes | 14 (5.7%) | 17 (8.8%) |
| 30 to 34 Minutes | 3 (1.2%) | 40 (20.6%) |
| 35 to 39 Minutes | 0 (0.0%) | 0 (0.0%) |
| 40 to 44 Minutes | 0 (0.0%) | 0 (0.0%) |
| 45 to 59 Minutes | 59 (24.2%) | 15 (7.7%) |
| 60 to 89 Minutes | 2 (0.8%) | 41 (21.1%) |
| 90 or more Minutes | 2 (0.8%) | 0 (0.0%) |
Time of Departure to Work by Sex in Hobson City
The most frequent times of departure to work in Hobson City are 6:30 AM to 6:59 AM (75, 30.7%) for males and 6:00 AM to 6:29 AM (44, 22.7%) for females.
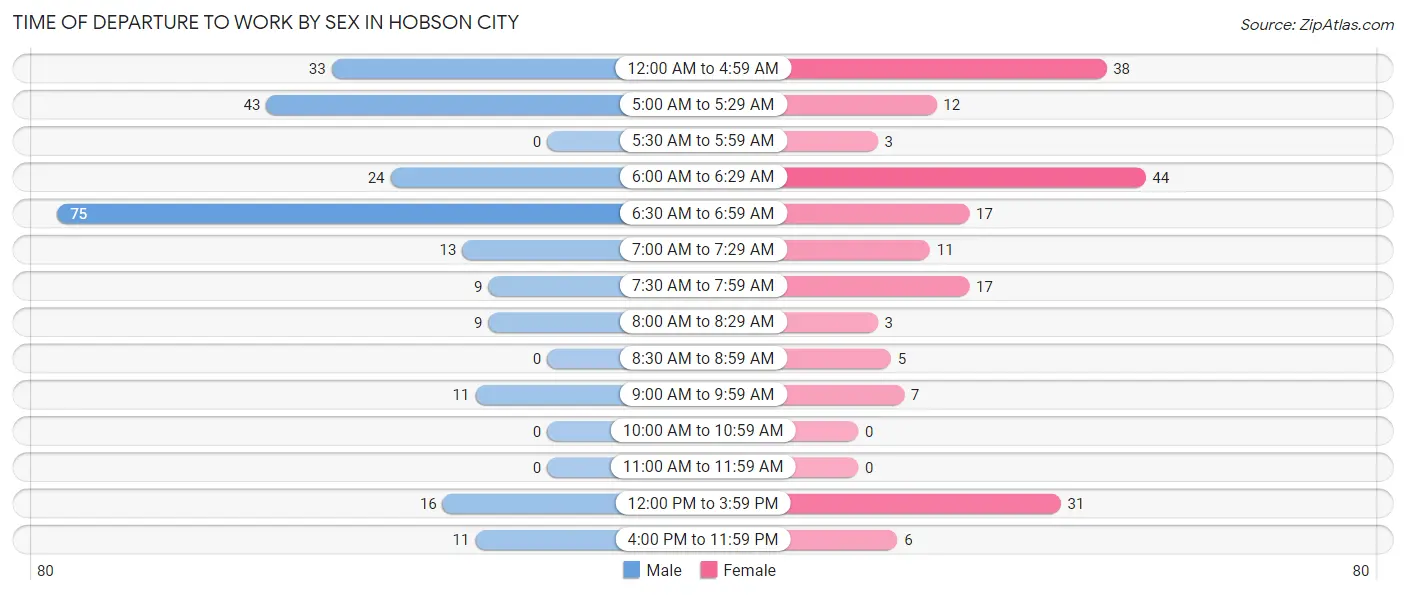
| Time of Departure | Male | Female |
| 12:00 AM to 4:59 AM | 33 (13.5%) | 38 (19.6%) |
| 5:00 AM to 5:29 AM | 43 (17.6%) | 12 (6.2%) |
| 5:30 AM to 5:59 AM | 0 (0.0%) | 3 (1.5%) |
| 6:00 AM to 6:29 AM | 24 (9.8%) | 44 (22.7%) |
| 6:30 AM to 6:59 AM | 75 (30.7%) | 17 (8.8%) |
| 7:00 AM to 7:29 AM | 13 (5.3%) | 11 (5.7%) |
| 7:30 AM to 7:59 AM | 9 (3.7%) | 17 (8.8%) |
| 8:00 AM to 8:29 AM | 9 (3.7%) | 3 (1.5%) |
| 8:30 AM to 8:59 AM | 0 (0.0%) | 5 (2.6%) |
| 9:00 AM to 9:59 AM | 11 (4.5%) | 7 (3.6%) |
| 10:00 AM to 10:59 AM | 0 (0.0%) | 0 (0.0%) |
| 11:00 AM to 11:59 AM | 0 (0.0%) | 0 (0.0%) |
| 12:00 PM to 3:59 PM | 16 (6.6%) | 31 (16.0%) |
| 4:00 PM to 11:59 PM | 11 (4.5%) | 6 (3.1%) |
| Total | 244 (100.0%) | 194 (100.0%) |
Housing Occupancy in Hobson City
Occupancy by Ownership in Hobson City
Of the total 326 dwellings in Hobson City, owner-occupied units account for 239 (73.3%), while renter-occupied units make up 87 (26.7%).
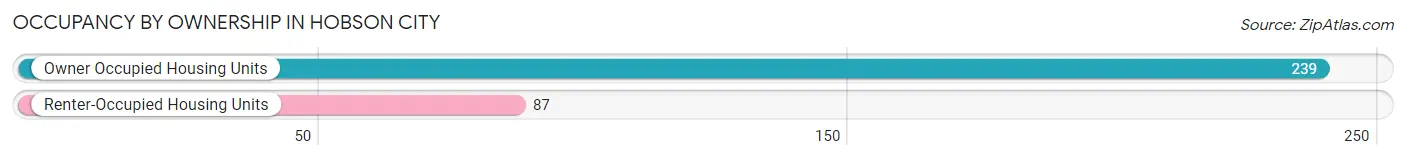
| Occupancy | # Housing Units | % Housing Units |
| Owner Occupied Housing Units | 239 | 73.3% |
| Renter-Occupied Housing Units | 87 | 26.7% |
| Total Occupied Housing Units | 326 | 100.0% |
Occupancy by Household Size in Hobson City
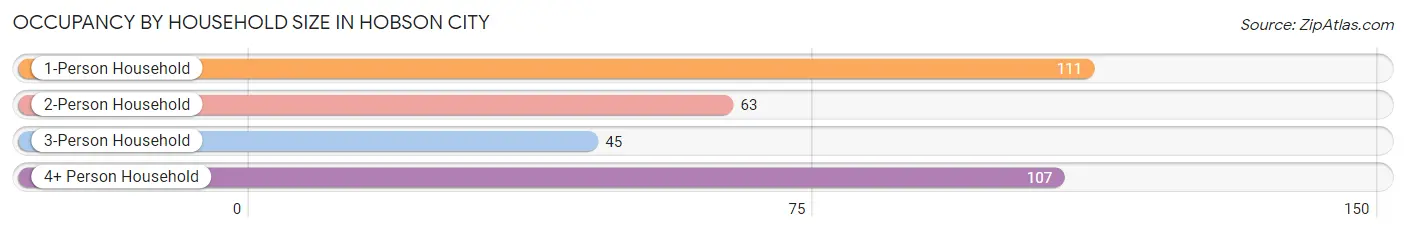
| Household Size | # Housing Units | % Housing Units |
| 1-Person Household | 111 | 34.1% |
| 2-Person Household | 63 | 19.3% |
| 3-Person Household | 45 | 13.8% |
| 4+ Person Household | 107 | 32.8% |
| Total Housing Units | 326 | 100.0% |
Occupancy by Ownership by Household Size in Hobson City
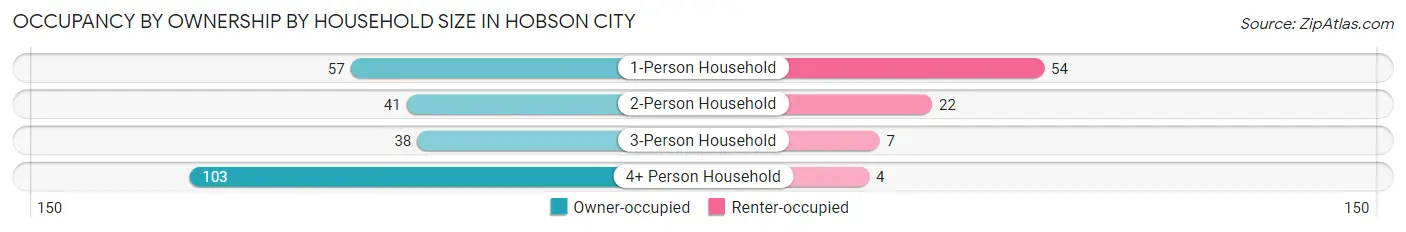
| Household Size | Owner-occupied | Renter-occupied |
| 1-Person Household | 57 (51.3%) | 54 (48.6%) |
| 2-Person Household | 41 (65.1%) | 22 (34.9%) |
| 3-Person Household | 38 (84.4%) | 7 (15.6%) |
| 4+ Person Household | 103 (96.3%) | 4 (3.7%) |
| Total Housing Units | 239 (73.3%) | 87 (26.7%) |
Occupancy by Educational Attainment in Hobson City
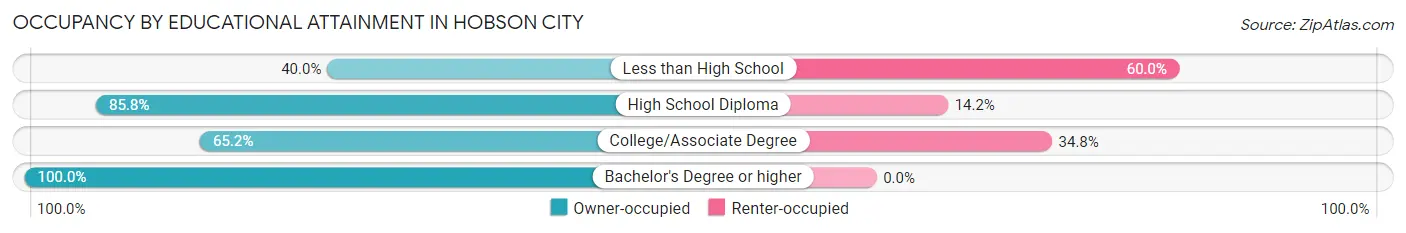
| Household Size | Owner-occupied | Renter-occupied |
| Less than High School | 24 (40.0%) | 36 (60.0%) |
| High School Diploma | 115 (85.8%) | 19 (14.2%) |
| College/Associate Degree | 60 (65.2%) | 32 (34.8%) |
| Bachelor's Degree or higher | 40 (100.0%) | 0 (0.0%) |
Occupancy by Age of Householder in Hobson City
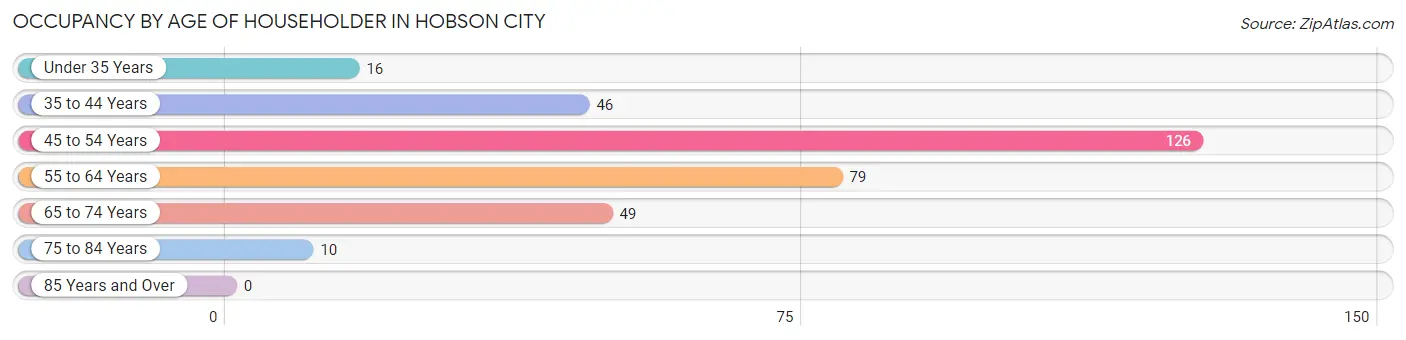
| Age Bracket | # Households | % Households |
| Under 35 Years | 16 | 4.9% |
| 35 to 44 Years | 46 | 14.1% |
| 45 to 54 Years | 126 | 38.7% |
| 55 to 64 Years | 79 | 24.2% |
| 65 to 74 Years | 49 | 15.0% |
| 75 to 84 Years | 10 | 3.1% |
| 85 Years and Over | 0 | 0.0% |
| Total | 326 | 100.0% |
Housing Finances in Hobson City
Median Income by Occupancy in Hobson City
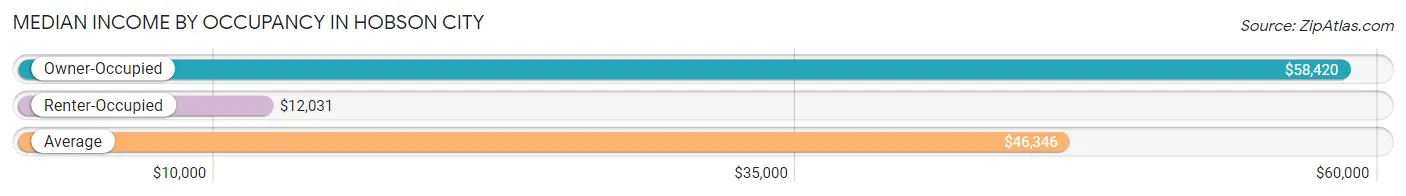
| Occupancy Type | # Households | Median Income |
| Owner-Occupied | 239 (73.3%) | $58,420 |
| Renter-Occupied | 87 (26.7%) | $12,031 |
| Average | 326 (100.0%) | $46,346 |
Occupancy by Householder Income Bracket in Hobson City
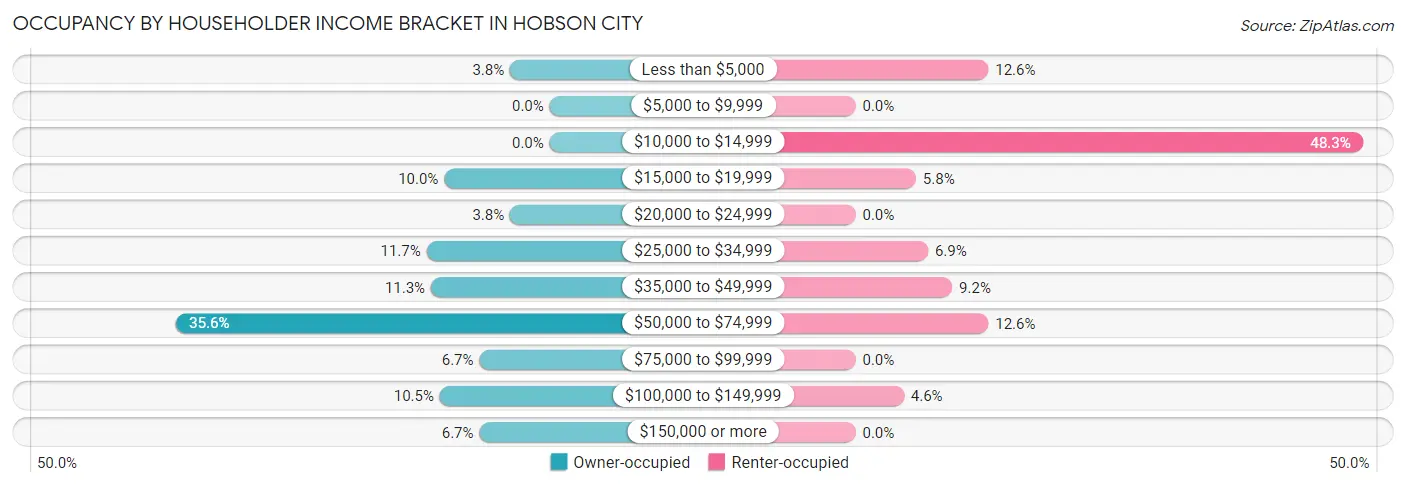
| Income Bracket | Owner-occupied | Renter-occupied |
| Less than $5,000 | 9 (3.8%) | 11 (12.6%) |
| $5,000 to $9,999 | 0 (0.0%) | 0 (0.0%) |
| $10,000 to $14,999 | 0 (0.0%) | 42 (48.3%) |
| $15,000 to $19,999 | 24 (10.0%) | 5 (5.8%) |
| $20,000 to $24,999 | 9 (3.8%) | 0 (0.0%) |
| $25,000 to $34,999 | 28 (11.7%) | 6 (6.9%) |
| $35,000 to $49,999 | 27 (11.3%) | 8 (9.2%) |
| $50,000 to $74,999 | 85 (35.6%) | 11 (12.6%) |
| $75,000 to $99,999 | 16 (6.7%) | 0 (0.0%) |
| $100,000 to $149,999 | 25 (10.5%) | 4 (4.6%) |
| $150,000 or more | 16 (6.7%) | 0 (0.0%) |
| Total | 239 (100.0%) | 87 (100.0%) |
Monthly Housing Cost Tiers in Hobson City
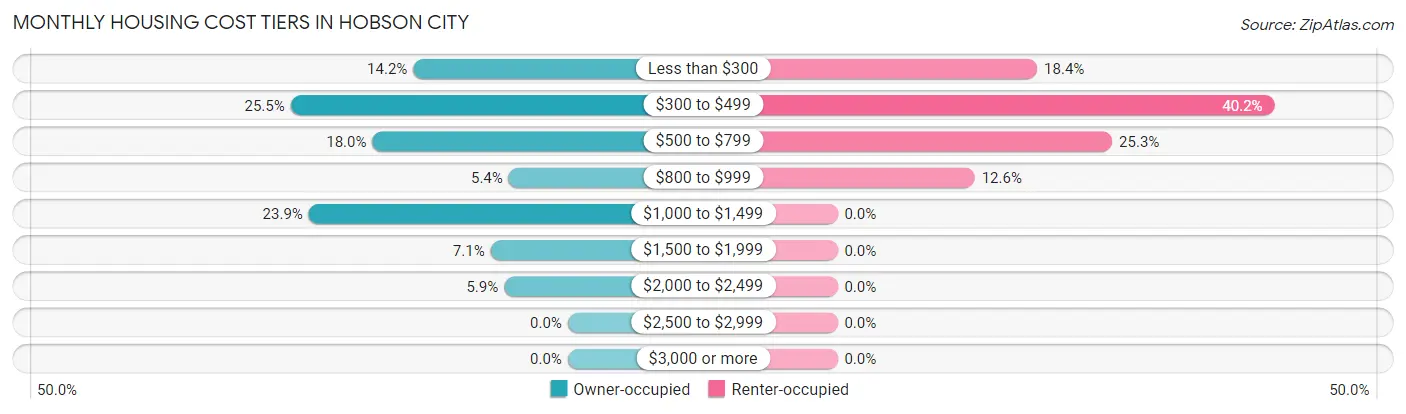
| Monthly Cost | Owner-occupied | Renter-occupied |
| Less than $300 | 34 (14.2%) | 16 (18.4%) |
| $300 to $499 | 61 (25.5%) | 35 (40.2%) |
| $500 to $799 | 43 (18.0%) | 22 (25.3%) |
| $800 to $999 | 13 (5.4%) | 11 (12.6%) |
| $1,000 to $1,499 | 57 (23.8%) | 0 (0.0%) |
| $1,500 to $1,999 | 17 (7.1%) | 0 (0.0%) |
| $2,000 to $2,499 | 14 (5.9%) | 0 (0.0%) |
| $2,500 to $2,999 | 0 (0.0%) | 0 (0.0%) |
| $3,000 or more | 0 (0.0%) | 0 (0.0%) |
| Total | 239 (100.0%) | 87 (100.0%) |
Physical Housing Characteristics in Hobson City
Housing Structures in Hobson City
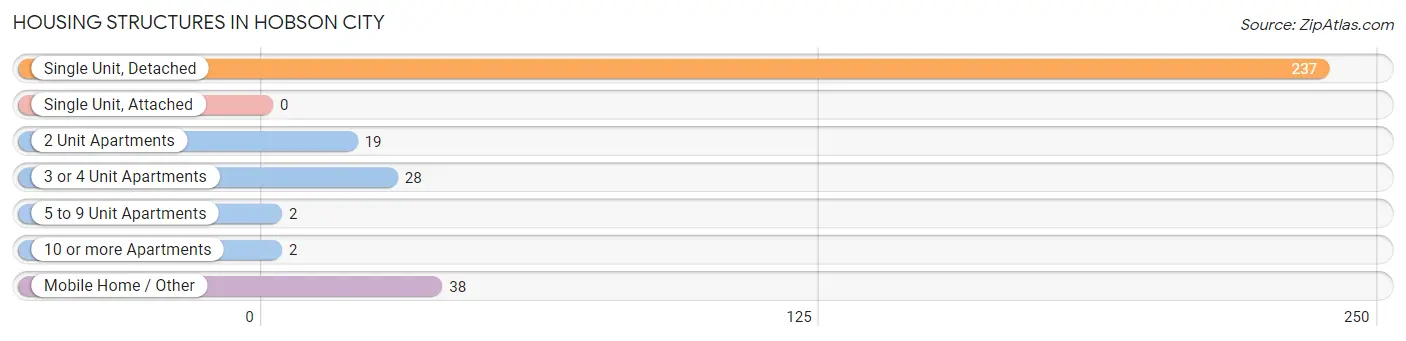
| Structure Type | # Housing Units | % Housing Units |
| Single Unit, Detached | 237 | 72.7% |
| Single Unit, Attached | 0 | 0.0% |
| 2 Unit Apartments | 19 | 5.8% |
| 3 or 4 Unit Apartments | 28 | 8.6% |
| 5 to 9 Unit Apartments | 2 | 0.6% |
| 10 or more Apartments | 2 | 0.6% |
| Mobile Home / Other | 38 | 11.7% |
| Total | 326 | 100.0% |
Housing Structures by Occupancy in Hobson City
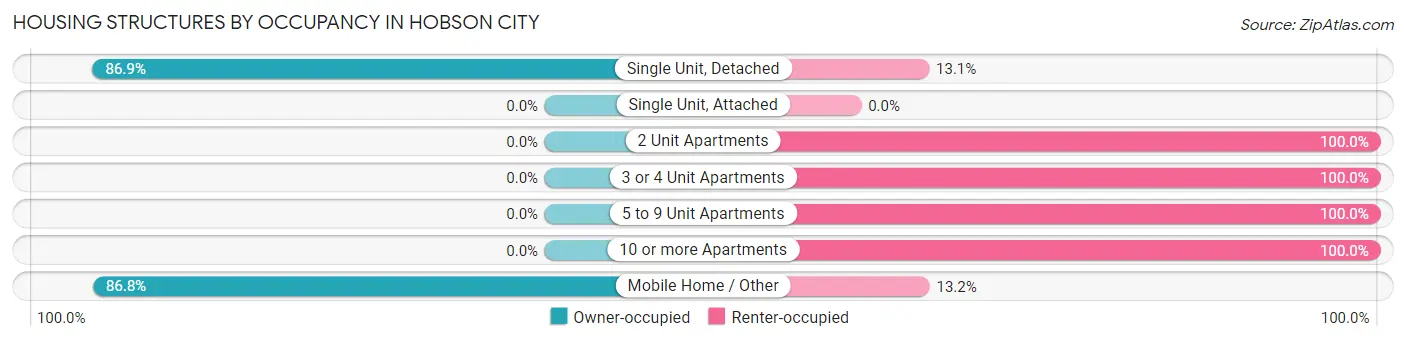
| Structure Type | Owner-occupied | Renter-occupied |
| Single Unit, Detached | 206 (86.9%) | 31 (13.1%) |
| Single Unit, Attached | 0 (0.0%) | 0 (0.0%) |
| 2 Unit Apartments | 0 (0.0%) | 19 (100.0%) |
| 3 or 4 Unit Apartments | 0 (0.0%) | 28 (100.0%) |
| 5 to 9 Unit Apartments | 0 (0.0%) | 2 (100.0%) |
| 10 or more Apartments | 0 (0.0%) | 2 (100.0%) |
| Mobile Home / Other | 33 (86.8%) | 5 (13.2%) |
| Total | 239 (73.3%) | 87 (26.7%) |
Housing Structures by Number of Rooms in Hobson City
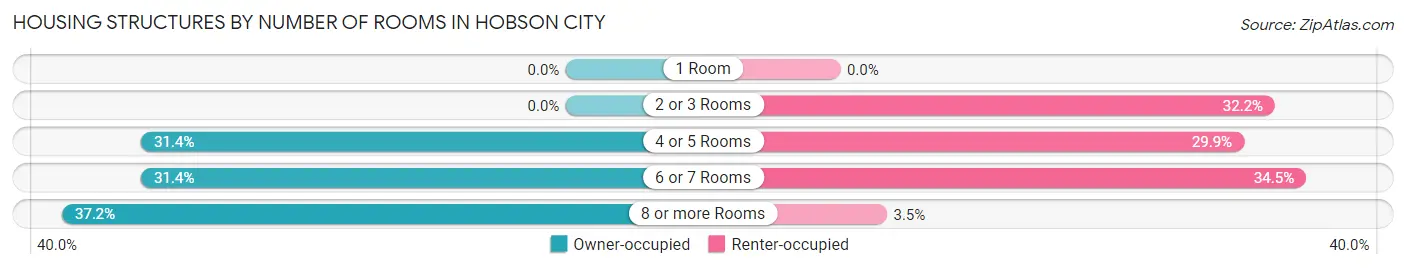
| Number of Rooms | Owner-occupied | Renter-occupied |
| 1 Room | 0 (0.0%) | 0 (0.0%) |
| 2 or 3 Rooms | 0 (0.0%) | 28 (32.2%) |
| 4 or 5 Rooms | 75 (31.4%) | 26 (29.9%) |
| 6 or 7 Rooms | 75 (31.4%) | 30 (34.5%) |
| 8 or more Rooms | 89 (37.2%) | 3 (3.5%) |
| Total | 239 (100.0%) | 87 (100.0%) |
Housing Structure by Heating Type in Hobson City
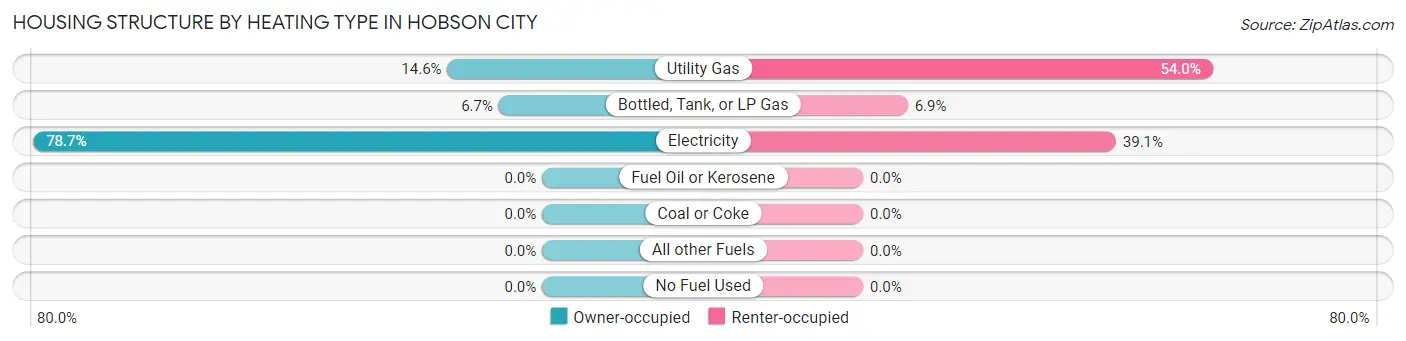
| Heating Type | Owner-occupied | Renter-occupied |
| Utility Gas | 35 (14.6%) | 47 (54.0%) |
| Bottled, Tank, or LP Gas | 16 (6.7%) | 6 (6.9%) |
| Electricity | 188 (78.7%) | 34 (39.1%) |
| Fuel Oil or Kerosene | 0 (0.0%) | 0 (0.0%) |
| Coal or Coke | 0 (0.0%) | 0 (0.0%) |
| All other Fuels | 0 (0.0%) | 0 (0.0%) |
| No Fuel Used | 0 (0.0%) | 0 (0.0%) |
| Total | 239 (100.0%) | 87 (100.0%) |
Household Vehicle Usage in Hobson City
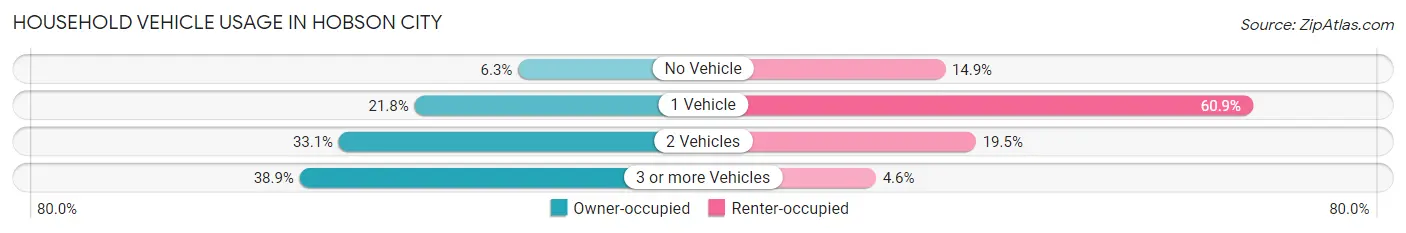
| Vehicles per Household | Owner-occupied | Renter-occupied |
| No Vehicle | 15 (6.3%) | 13 (14.9%) |
| 1 Vehicle | 52 (21.8%) | 53 (60.9%) |
| 2 Vehicles | 79 (33.1%) | 17 (19.5%) |
| 3 or more Vehicles | 93 (38.9%) | 4 (4.6%) |
| Total | 239 (100.0%) | 87 (100.0%) |
Real Estate & Mortgages in Hobson City
Real Estate and Mortgage Overview in Hobson City
| Characteristic | Without Mortgage | With Mortgage |
| Housing Units | 120 | 119 |
| Median Property Value | $99,200 | $0 |
| Median Household Income | $45,769 | $16 |
| Monthly Housing Costs | $420 | $0 |
| Real Estate Taxes | $478 | $13 |
Property Value by Mortgage Status in Hobson City
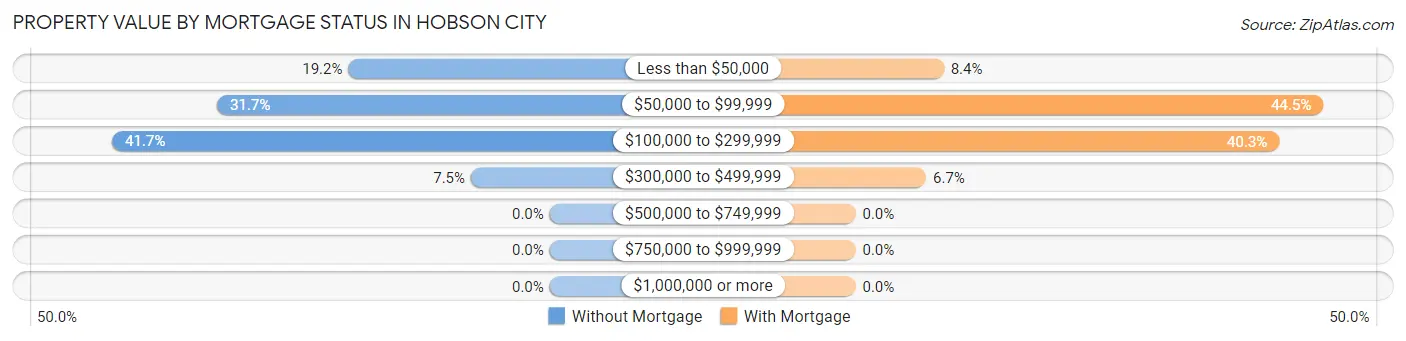
| Property Value | Without Mortgage | With Mortgage |
| Less than $50,000 | 23 (19.2%) | 10 (8.4%) |
| $50,000 to $99,999 | 38 (31.7%) | 53 (44.5%) |
| $100,000 to $299,999 | 50 (41.7%) | 48 (40.3%) |
| $300,000 to $499,999 | 9 (7.5%) | 8 (6.7%) |
| $500,000 to $749,999 | 0 (0.0%) | 0 (0.0%) |
| $750,000 to $999,999 | 0 (0.0%) | 0 (0.0%) |
| $1,000,000 or more | 0 (0.0%) | 0 (0.0%) |
| Total | 120 (100.0%) | 119 (100.0%) |
Household Income by Mortgage Status in Hobson City
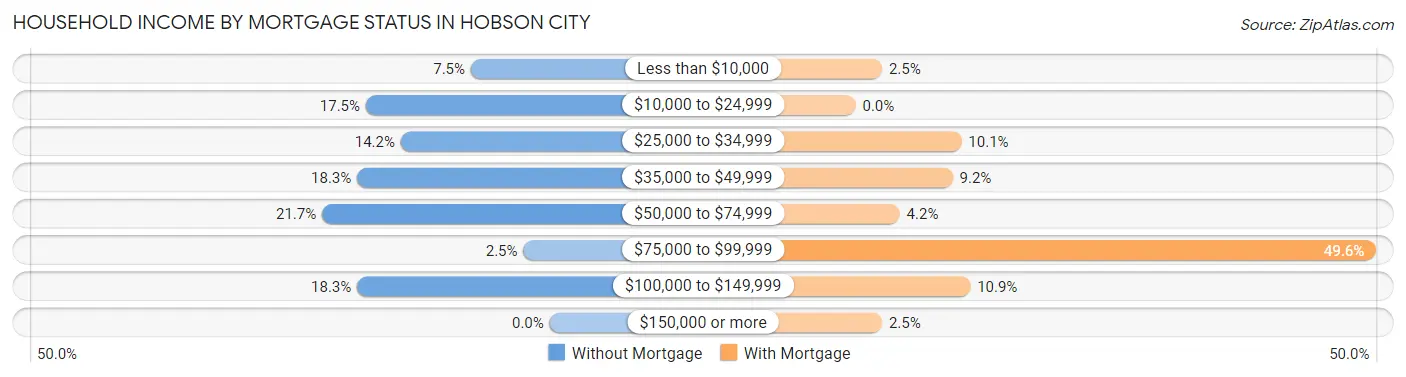
| Household Income | Without Mortgage | With Mortgage |
| Less than $10,000 | 9 (7.5%) | 3 (2.5%) |
| $10,000 to $24,999 | 21 (17.5%) | 0 (0.0%) |
| $25,000 to $34,999 | 17 (14.2%) | 12 (10.1%) |
| $35,000 to $49,999 | 22 (18.3%) | 11 (9.2%) |
| $50,000 to $74,999 | 26 (21.7%) | 5 (4.2%) |
| $75,000 to $99,999 | 3 (2.5%) | 59 (49.6%) |
| $100,000 to $149,999 | 22 (18.3%) | 13 (10.9%) |
| $150,000 or more | 0 (0.0%) | 3 (2.5%) |
| Total | 120 (100.0%) | 119 (100.0%) |
Property Value to Household Income Ratio in Hobson City
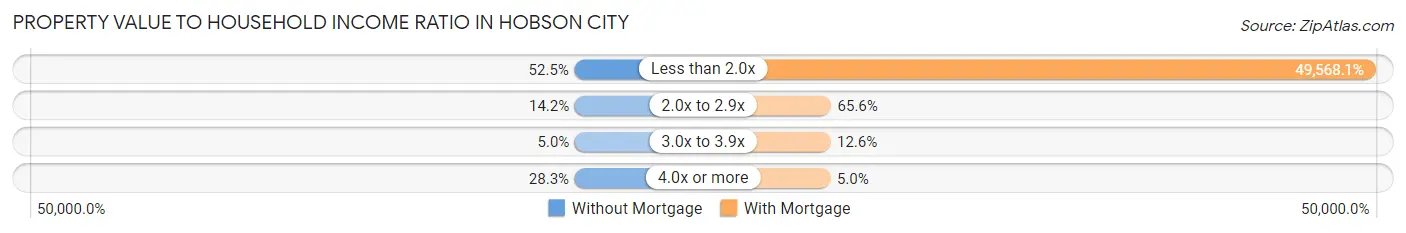
| Value-to-Income Ratio | Without Mortgage | With Mortgage |
| Less than 2.0x | 63 (52.5%) | 58,986 (49,568.1%) |
| 2.0x to 2.9x | 17 (14.2%) | 78 (65.5%) |
| 3.0x to 3.9x | 6 (5.0%) | 15 (12.6%) |
| 4.0x or more | 34 (28.3%) | 6 (5.0%) |
| Total | 120 (100.0%) | 119 (100.0%) |
Real Estate Taxes by Mortgage Status in Hobson City
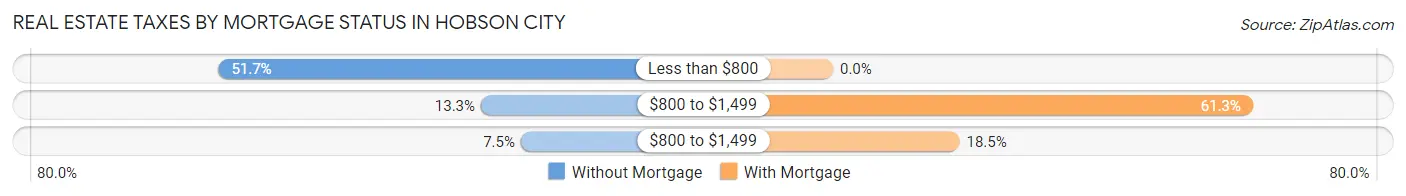
| Property Taxes | Without Mortgage | With Mortgage |
| Less than $800 | 62 (51.7%) | 0 (0.0%) |
| $800 to $1,499 | 16 (13.3%) | 73 (61.3%) |
| $800 to $1,499 | 9 (7.5%) | 22 (18.5%) |
| Total | 120 (100.0%) | 119 (100.0%) |
Health & Disability in Hobson City
Health Insurance Coverage by Age in Hobson City
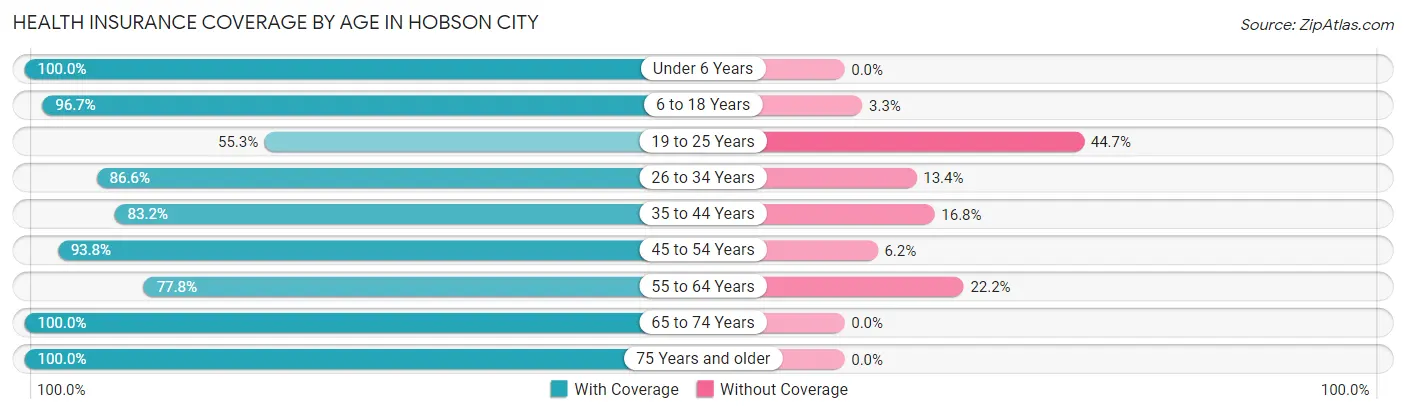
| Age Bracket | With Coverage | Without Coverage |
| Under 6 Years | 54 (100.0%) | 0 (0.0%) |
| 6 to 18 Years | 233 (96.7%) | 8 (3.3%) |
| 19 to 25 Years | 57 (55.3%) | 46 (44.7%) |
| 26 to 34 Years | 58 (86.6%) | 9 (13.4%) |
| 35 to 44 Years | 104 (83.2%) | 21 (16.8%) |
| 45 to 54 Years | 167 (93.8%) | 11 (6.2%) |
| 55 to 64 Years | 105 (77.8%) | 30 (22.2%) |
| 65 to 74 Years | 59 (100.0%) | 0 (0.0%) |
| 75 Years and older | 16 (100.0%) | 0 (0.0%) |
| Total | 853 (87.2%) | 125 (12.8%) |
Health Insurance Coverage by Citizenship Status in Hobson City
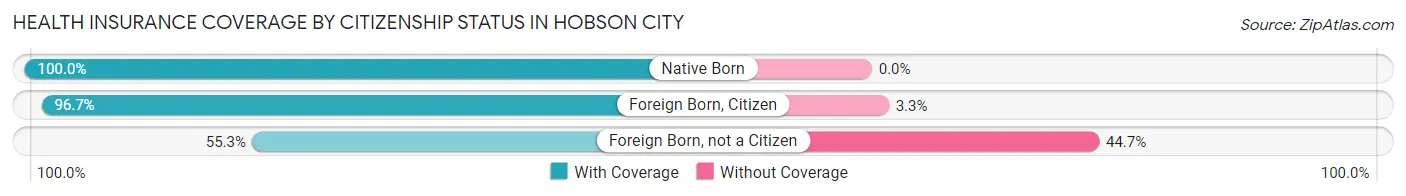
| Citizenship Status | With Coverage | Without Coverage |
| Native Born | 54 (100.0%) | 0 (0.0%) |
| Foreign Born, Citizen | 233 (96.7%) | 8 (3.3%) |
| Foreign Born, not a Citizen | 57 (55.3%) | 46 (44.7%) |
Health Insurance Coverage by Household Income in Hobson City
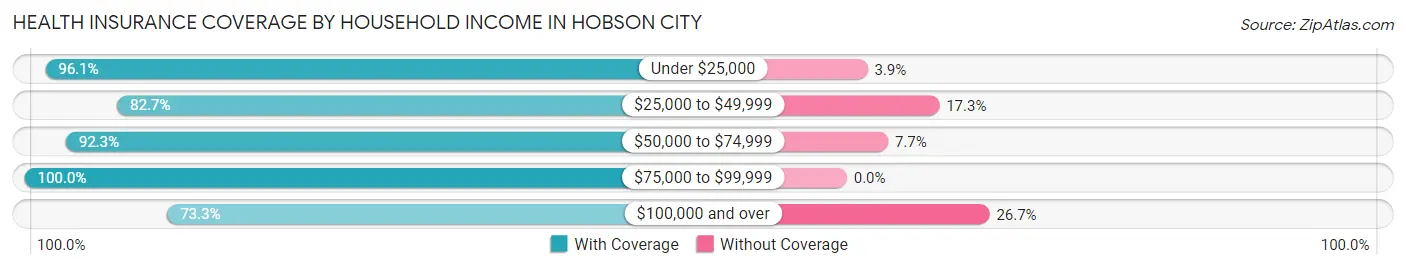
| Household Income | With Coverage | Without Coverage |
| Under $25,000 | 223 (96.1%) | 9 (3.9%) |
| $25,000 to $49,999 | 191 (82.7%) | 40 (17.3%) |
| $50,000 to $74,999 | 263 (92.3%) | 22 (7.7%) |
| $75,000 to $99,999 | 28 (100.0%) | 0 (0.0%) |
| $100,000 and over | 148 (73.3%) | 54 (26.7%) |
Public vs Private Health Insurance Coverage by Age in Hobson City
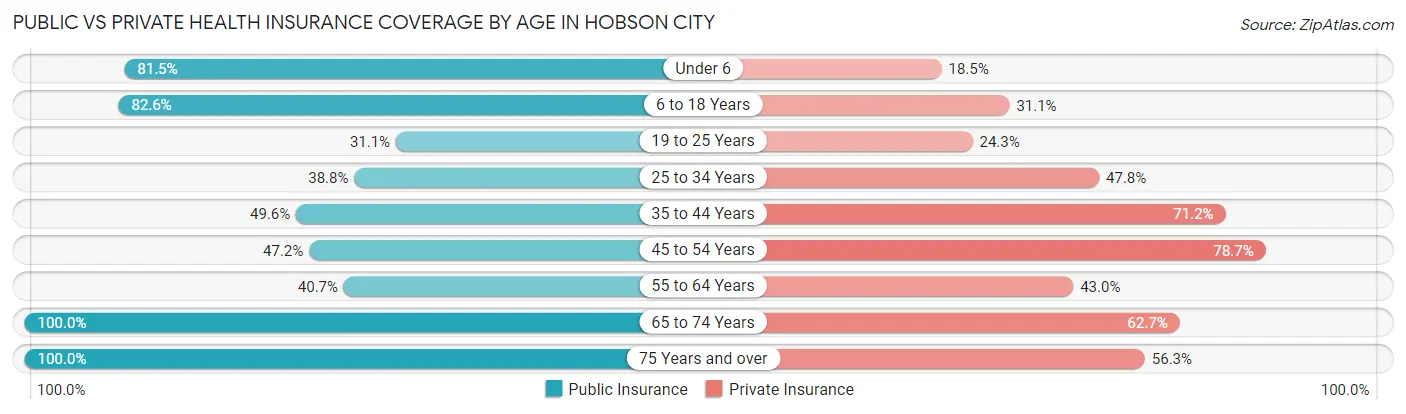
| Age Bracket | Public Insurance | Private Insurance |
| Under 6 | 44 (81.5%) | 10 (18.5%) |
| 6 to 18 Years | 199 (82.6%) | 75 (31.1%) |
| 19 to 25 Years | 32 (31.1%) | 25 (24.3%) |
| 25 to 34 Years | 26 (38.8%) | 32 (47.8%) |
| 35 to 44 Years | 62 (49.6%) | 89 (71.2%) |
| 45 to 54 Years | 84 (47.2%) | 140 (78.6%) |
| 55 to 64 Years | 55 (40.7%) | 58 (43.0%) |
| 65 to 74 Years | 59 (100.0%) | 37 (62.7%) |
| 75 Years and over | 16 (100.0%) | 9 (56.2%) |
| Total | 577 (59.0%) | 475 (48.6%) |
Disability Status by Sex by Age in Hobson City
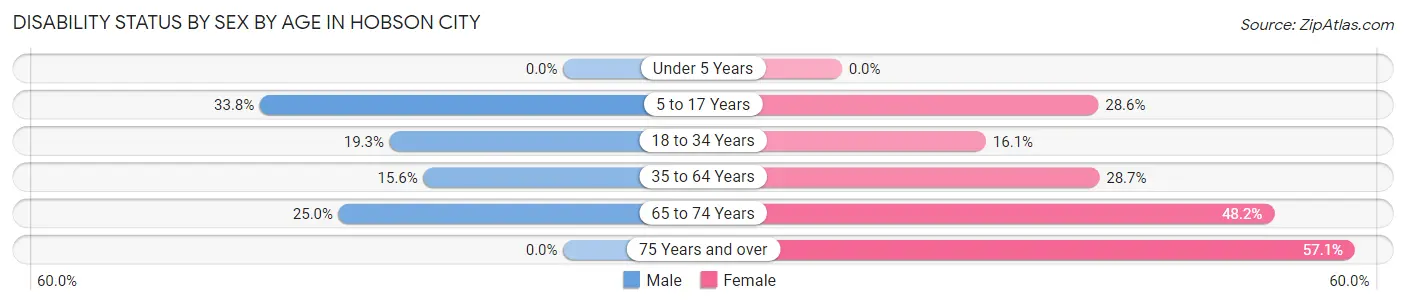
| Age Bracket | Male | Female |
| Under 5 Years | 0 (0.0%) | 0 (0.0%) |
| 5 to 17 Years | 51 (33.8%) | 18 (28.6%) |
| 18 to 34 Years | 23 (19.3%) | 13 (16.1%) |
| 35 to 64 Years | 28 (15.6%) | 74 (28.7%) |
| 65 to 74 Years | 8 (25.0%) | 13 (48.1%) |
| 75 Years and over | 0 (0.0%) | 8 (57.1%) |
Disability Class by Sex by Age in Hobson City
Disability Class: Hearing Difficulty
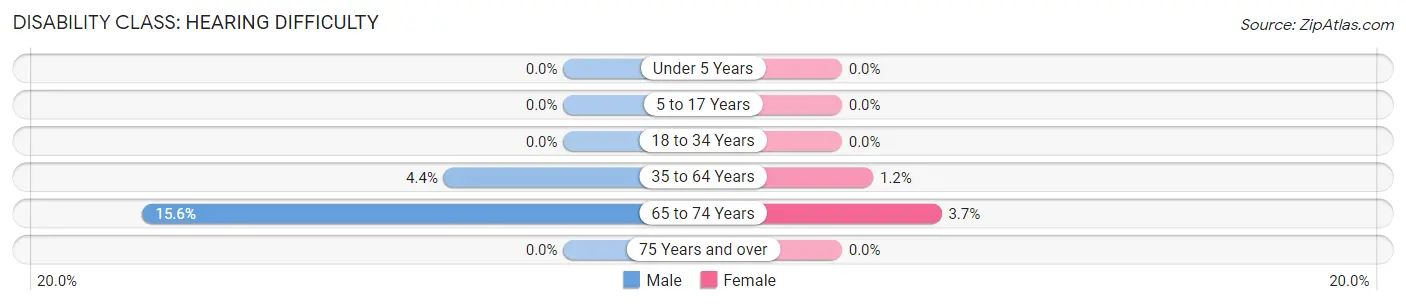
| Age Bracket | Male | Female |
| Under 5 Years | 0 (0.0%) | 0 (0.0%) |
| 5 to 17 Years | 0 (0.0%) | 0 (0.0%) |
| 18 to 34 Years | 0 (0.0%) | 0 (0.0%) |
| 35 to 64 Years | 8 (4.4%) | 3 (1.2%) |
| 65 to 74 Years | 5 (15.6%) | 1 (3.7%) |
| 75 Years and over | 0 (0.0%) | 0 (0.0%) |
Disability Class: Vision Difficulty
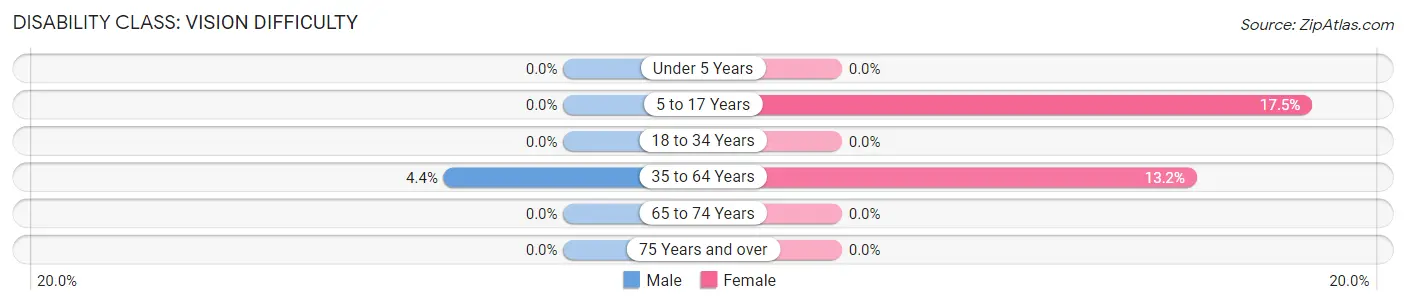
| Age Bracket | Male | Female |
| Under 5 Years | 0 (0.0%) | 0 (0.0%) |
| 5 to 17 Years | 0 (0.0%) | 11 (17.5%) |
| 18 to 34 Years | 0 (0.0%) | 0 (0.0%) |
| 35 to 64 Years | 8 (4.4%) | 34 (13.2%) |
| 65 to 74 Years | 0 (0.0%) | 0 (0.0%) |
| 75 Years and over | 0 (0.0%) | 0 (0.0%) |
Disability Class: Cognitive Difficulty
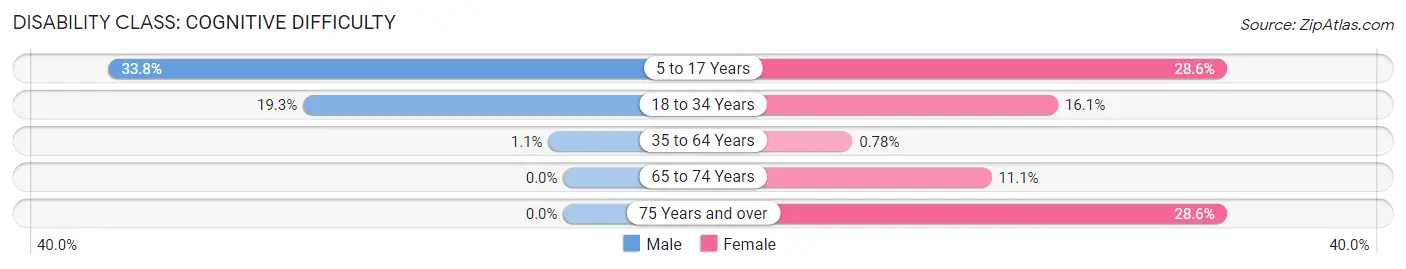
| Age Bracket | Male | Female |
| 5 to 17 Years | 51 (33.8%) | 18 (28.6%) |
| 18 to 34 Years | 23 (19.3%) | 13 (16.1%) |
| 35 to 64 Years | 2 (1.1%) | 2 (0.8%) |
| 65 to 74 Years | 0 (0.0%) | 3 (11.1%) |
| 75 Years and over | 0 (0.0%) | 4 (28.6%) |
Disability Class: Ambulatory Difficulty
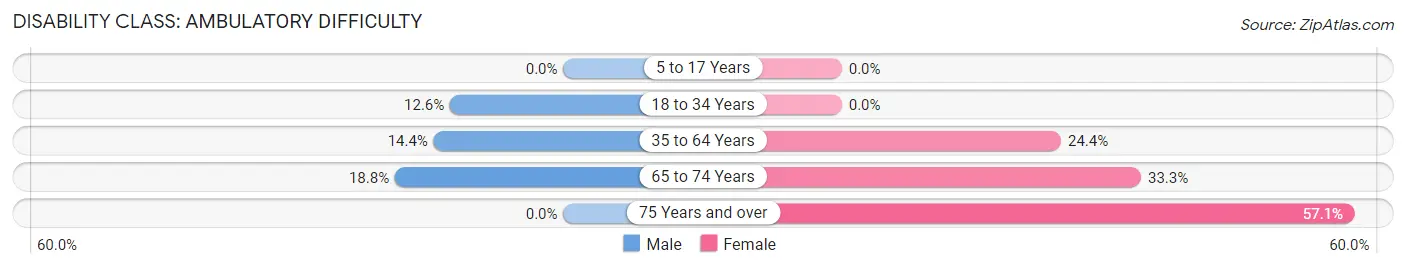
| Age Bracket | Male | Female |
| 5 to 17 Years | 0 (0.0%) | 0 (0.0%) |
| 18 to 34 Years | 15 (12.6%) | 0 (0.0%) |
| 35 to 64 Years | 26 (14.4%) | 63 (24.4%) |
| 65 to 74 Years | 6 (18.8%) | 9 (33.3%) |
| 75 Years and over | 0 (0.0%) | 8 (57.1%) |
Disability Class: Self-Care Difficulty
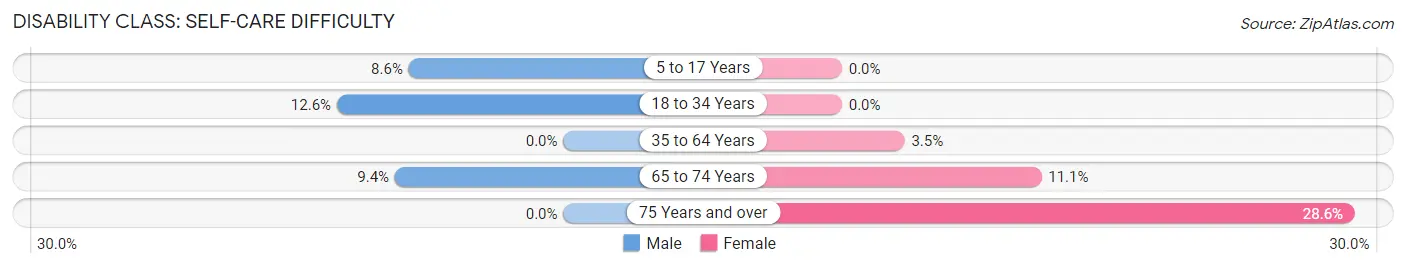
| Age Bracket | Male | Female |
| 5 to 17 Years | 13 (8.6%) | 0 (0.0%) |
| 18 to 34 Years | 15 (12.6%) | 0 (0.0%) |
| 35 to 64 Years | 0 (0.0%) | 9 (3.5%) |
| 65 to 74 Years | 3 (9.4%) | 3 (11.1%) |
| 75 Years and over | 0 (0.0%) | 4 (28.6%) |
Technology Access in Hobson City
Computing Device Access in Hobson City
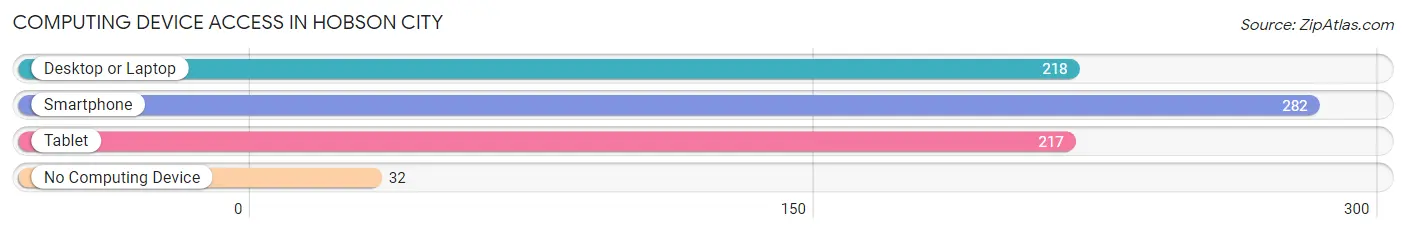
| Device Type | # Households | % Households |
| Desktop or Laptop | 218 | 66.9% |
| Smartphone | 282 | 86.5% |
| Tablet | 217 | 66.6% |
| No Computing Device | 32 | 9.8% |
| Total | 326 | 100.0% |
Internet Access in Hobson City
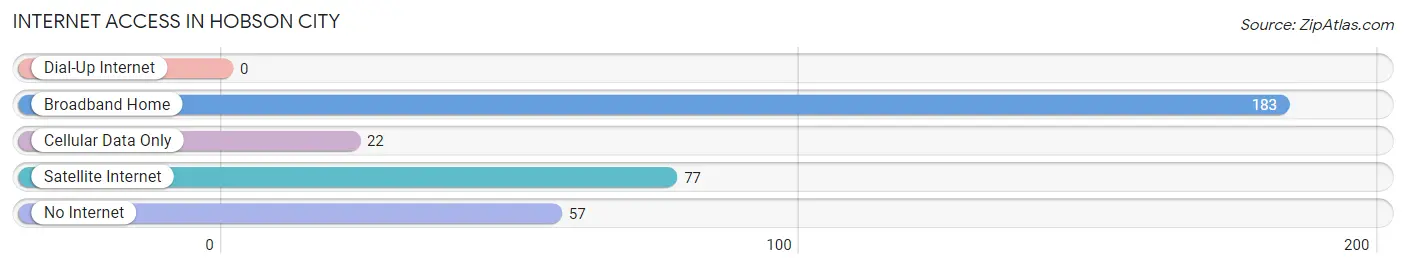
| Internet Type | # Households | % Households |
| Dial-Up Internet | 0 | 0.0% |
| Broadband Home | 183 | 56.1% |
| Cellular Data Only | 22 | 6.8% |
| Satellite Internet | 77 | 23.6% |
| No Internet | 57 | 17.5% |
| Total | 326 | 100.0% |
Hobson City Summary
Hobson City is a small town located in Calhoun County, Alabama. It is situated on the banks of the Coosa River, about 10 miles south of Anniston. The town was founded in 1887 by William Hobson, a former slave who had purchased the land from the federal government. The town was incorporated in 1895 and has a population of approximately 1,000 people.
Hobson City is located in the foothills of the Appalachian Mountains and is surrounded by rolling hills and forests. The town is situated at an elevation of 830 feet above sea level and has a humid subtropical climate. The average annual temperature is around 70 degrees Fahrenheit and the average annual precipitation is around 50 inches.
The economy of Hobson City is largely based on agriculture. The town is home to several farms, which produce a variety of crops, including corn, soybeans, cotton, and hay. The town also has a few small businesses, including a grocery store, a hardware store, and a few restaurants.
The demographics of Hobson City are largely made up of African Americans. According to the 2010 census, the population of the town was 97.7% African American, 0.7% White, 0.3% Native American, 0.2% Asian, and 0.1% from other races. The median household income in the town was $20,938, and the median age was 37.
Hobson City is a small town with a rich history and a unique culture. The town is home to several historic sites, including the Hobson City Historic District, which is listed on the National Register of Historic Places. The town is also home to several churches, including the First Baptist Church of Hobson City, which was founded in 1887.
Hobson City is a small town with a lot to offer. It is a great place to live, work, and raise a family. The town has a rich history and a unique culture, and it is a great place to explore and experience the beauty of the Appalachian Mountains.
Common Questions
What is Per Capita Income in Hobson City?
Per Capita income in Hobson City is $19,848.
What is the Median Family Income in Hobson City?
Median Family Income in Hobson City is $58,750.
What is the Median Household income in Hobson City?
Median Household Income in Hobson City is $46,346.
What is Income or Wage Gap in Hobson City?
Income or Wage Gap in Hobson City is 5.7%.
Women in Hobson City earn 94.3 cents for every dollar earned by a man.
What is Inequality or Gini Index in Hobson City?
Inequality or Gini Index in Hobson City is 0.43.
What is the Total Population of Hobson City?
Total Population of Hobson City is 978.
What is the Total Male Population of Hobson City?
Total Male Population of Hobson City is 514.
What is the Total Female Population of Hobson City?
Total Female Population of Hobson City is 464.
What is the Ratio of Males per 100 Females in Hobson City?
There are 110.78 Males per 100 Females in Hobson City.
What is the Ratio of Females per 100 Males in Hobson City?
There are 90.27 Females per 100 Males in Hobson City.
What is the Median Population Age in Hobson City?
Median Population Age in Hobson City is 37.4 Years.
What is the Average Family Size in Hobson City
Average Family Size in Hobson City is 3.9 People.
What is the Average Household Size in Hobson City
Average Household Size in Hobson City is 3.0 People.
How Large is the Labor Force in Hobson City?
There are 474 People in the Labor Forcein in Hobson City.
What is the Percentage of People in the Labor Force in Hobson City?
64.4% of People are in the Labor Force in Hobson City.
What is the Unemployment Rate in Hobson City?
Unemployment Rate in Hobson City is 4.4%.