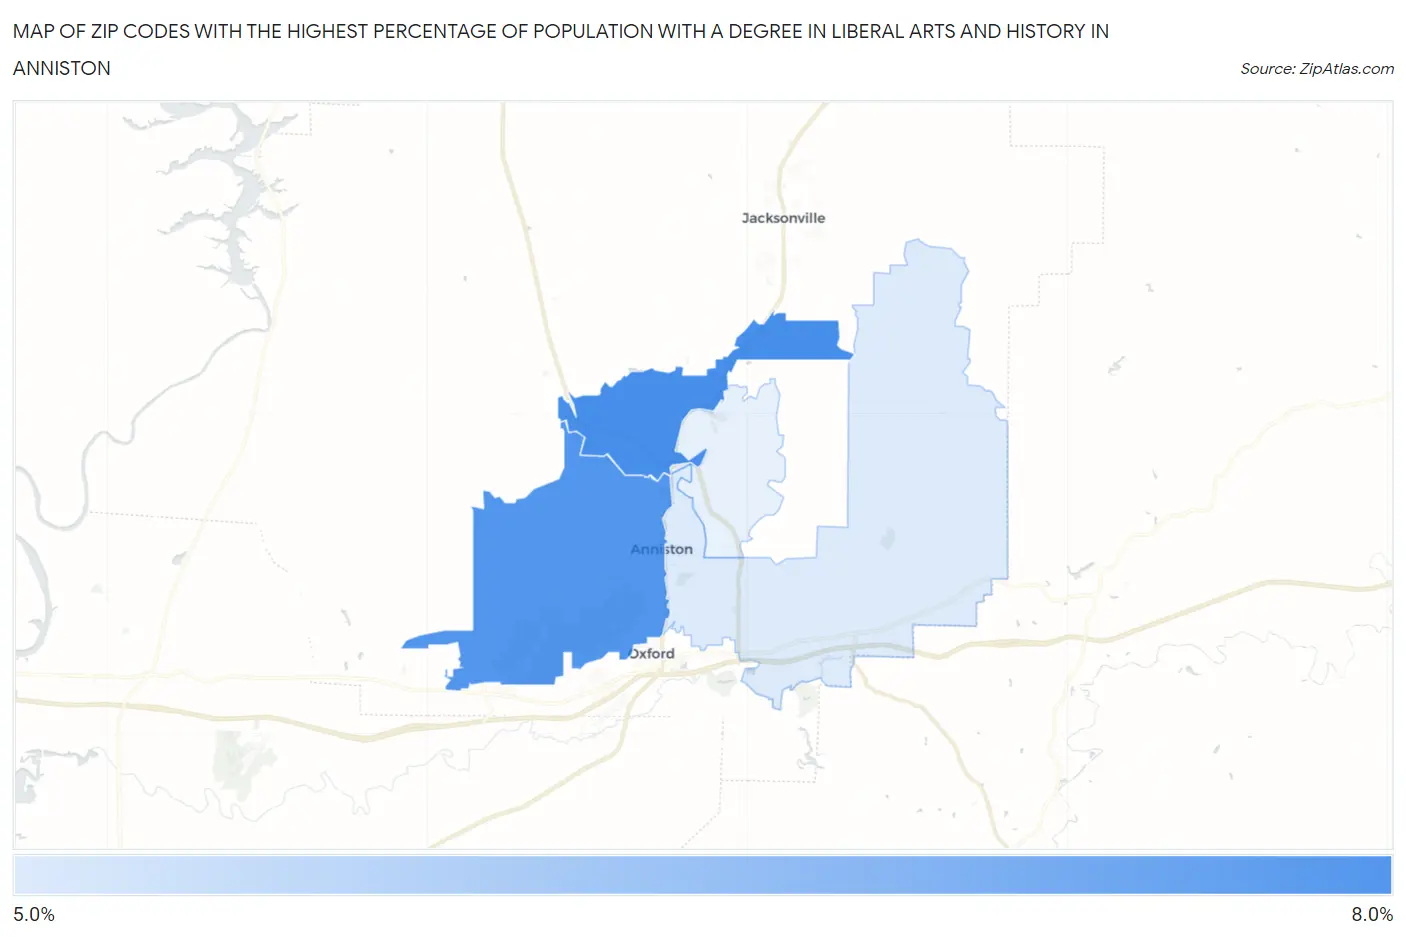
Zip Codes with the Highest Percentage of Population with a Degree in Liberal Arts and History in Anniston, AL
RELATED REPORTS & OPTIONS
Liberal Arts and History
Anniston
Compare Zip Codes
Map of Zip Codes with the Highest Percentage of Population with a Degree in Liberal Arts and History in Anniston
5.6%
6.4%
Zip Codes with the Highest Percentage of Population with a Degree in Liberal Arts and History in Anniston, AL
| Zip Code | % Graduates | vs State | vs National | |
| 1. | 36206 | 6.4% | 4.6%(+1.81)#147 | 4.9%(+1.48)#7,654 |
| 2. | 36201 | 6.3% | 4.6%(+1.75)#153 | 4.9%(+1.42)#7,801 |
| 3. | 36207 | 5.6% | 4.6%(+1.05)#184 | 4.9%(+0.732)#9,556 |
1
Common Questions
What are the Top 3 Zip Codes with the Highest Percentage of Population with a Degree in Liberal Arts and History in Anniston, AL?
Top 3 Zip Codes with the Highest Percentage of Population with a Degree in Liberal Arts and History in Anniston, AL are:
What zip code has the Highest Percentage of Population with a Degree in Liberal Arts and History in Anniston, AL?
36206 has the Highest Percentage of Population with a Degree in Liberal Arts and History in Anniston, AL with 6.4%.
What is the Percentage of Population with a Degree in Liberal Arts and History in Anniston, AL?
Percentage of Population with a Degree in Liberal Arts and History in Anniston is 6.7%.
What is the Percentage of Population with a Degree in Liberal Arts and History in Alabama?
Percentage of Population with a Degree in Liberal Arts and History in Alabama is 4.6%.
What is the Percentage of Population with a Degree in Liberal Arts and History in the United States?
Percentage of Population with a Degree in Liberal Arts and History in the United States is 4.9%.