Rehobeth, AL Map & Demographics
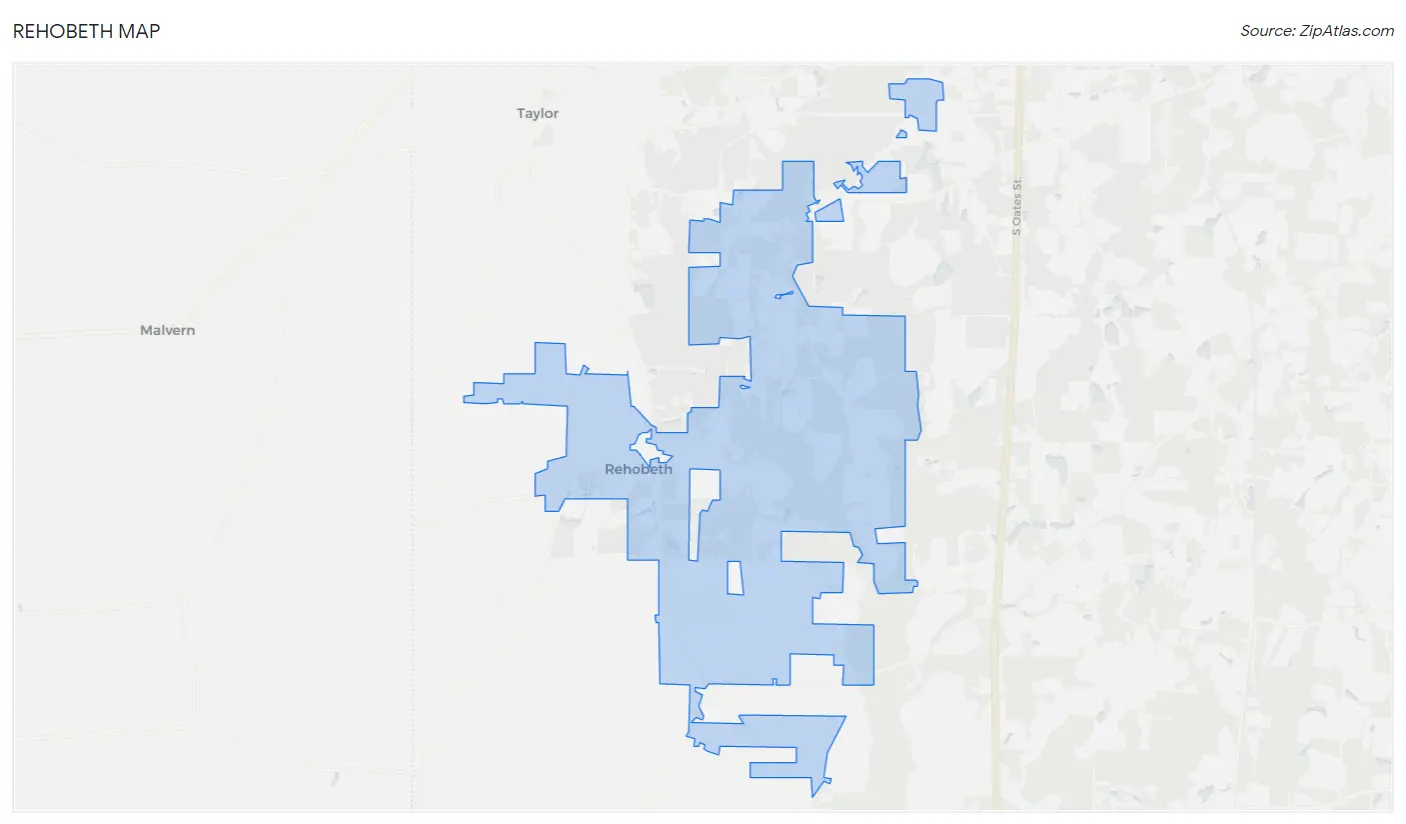
Rehobeth Map
Rehobeth Overview
$28,273
PER CAPITA INCOME
$78,125
AVG FAMILY INCOME
$68,958
AVG HOUSEHOLD INCOME
36.9%
WAGE / INCOME GAP [ % ]
63.1¢/ $1
WAGE / INCOME GAP [ $ ]
$10,351
FAMILY INCOME DEFICIT
0.40
INEQUALITY / GINI INDEX
1,896
TOTAL POPULATION
843
MALE POPULATION
1,053
FEMALE POPULATION
80.06
MALES / 100 FEMALES
124.91
FEMALES / 100 MALES
36.0
MEDIAN AGE
3.5
AVG FAMILY SIZE
3.1
AVG HOUSEHOLD SIZE
882
LABOR FORCE [ PEOPLE ]
67.5%
PERCENT IN LABOR FORCE
4.1%
UNEMPLOYMENT RATE
Rehobeth Area Codes
Income in Rehobeth
Income Overview in Rehobeth
Per Capita Income in Rehobeth is $28,273, while median incomes of families and households are $78,125 and $68,958 respectively.
| Characteristic | Number | Measure |
| Per Capita Income | 1,896 | $28,273 |
| Median Family Income | 490 | $78,125 |
| Mean Family Income | 490 | $94,404 |
| Median Household Income | 617 | $68,958 |
| Mean Household Income | 617 | $83,176 |
| Income Deficit | 490 | $10,351 |
| Wage / Income Gap (%) | 1,896 | 36.86% |
| Wage / Income Gap ($) | 1,896 | 63.14¢ per $1 |
| Gini / Inequality Index | 1,896 | 0.40 |
Earnings by Sex in Rehobeth
Average Earnings in Rehobeth are $43,036, $53,125 for men and $33,542 for women, a difference of 36.9%.
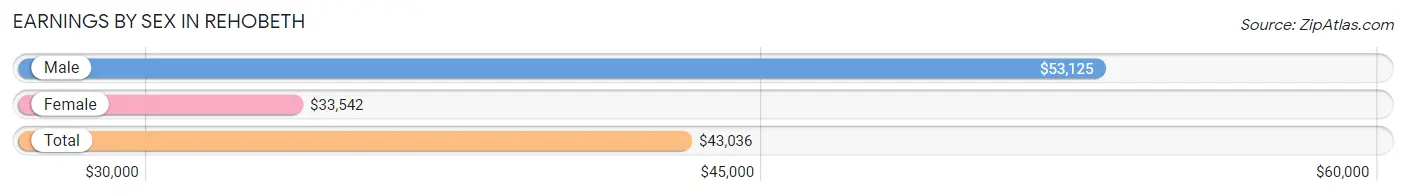
| Sex | Number | Average Earnings |
| Male | 433 (49.1%) | $53,125 |
| Female | 448 (50.8%) | $33,542 |
| Total | 881 (100.0%) | $43,036 |
Earnings by Sex by Income Bracket in Rehobeth
The most common earnings brackets in Rehobeth are $45,000 to $49,999 for men (73 | 16.9%) and $35,000 to $39,999 for women (64 | 14.3%).
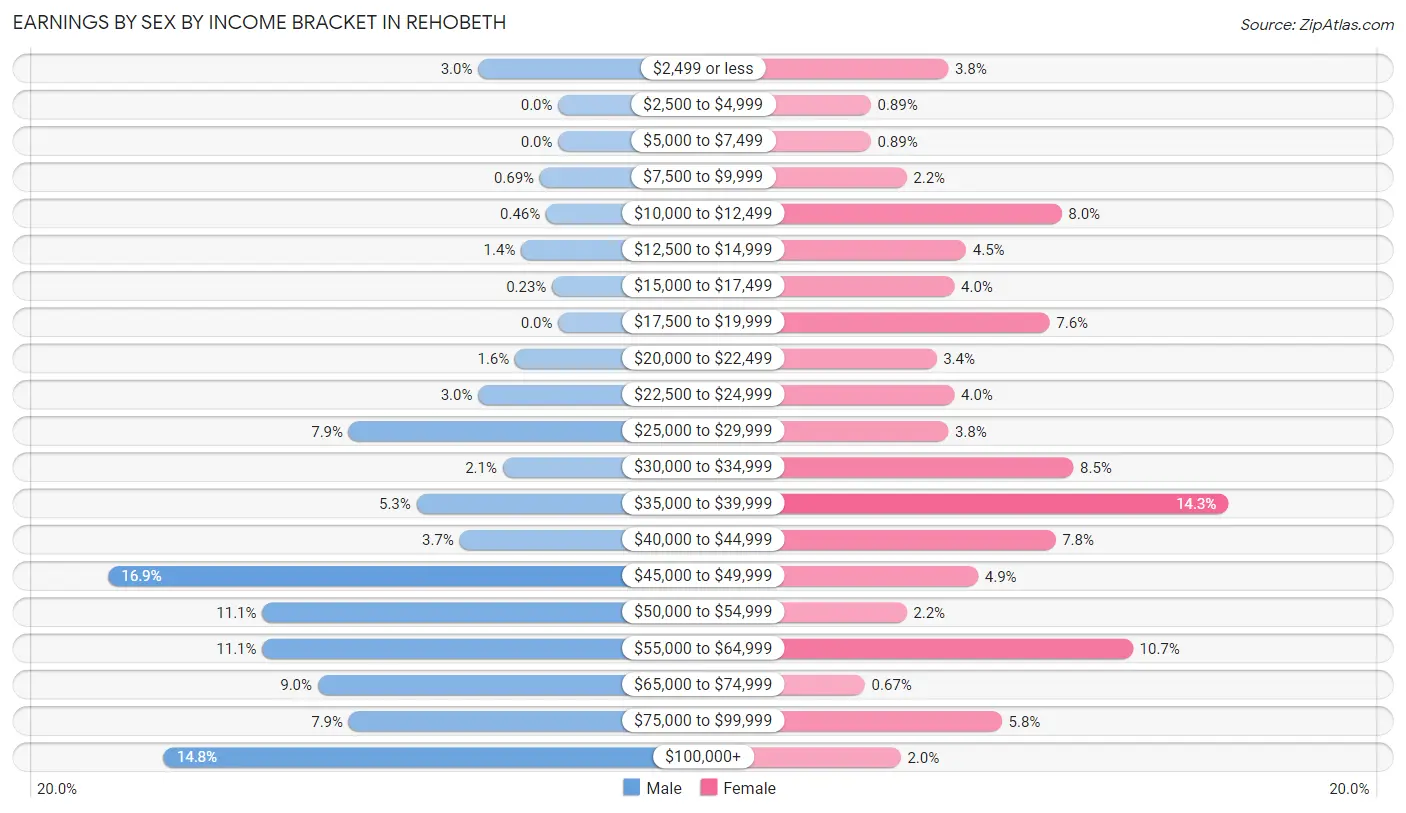
| Income | Male | Female |
| $2,499 or less | 13 (3.0%) | 17 (3.8%) |
| $2,500 to $4,999 | 0 (0.0%) | 4 (0.9%) |
| $5,000 to $7,499 | 0 (0.0%) | 4 (0.9%) |
| $7,500 to $9,999 | 3 (0.7%) | 10 (2.2%) |
| $10,000 to $12,499 | 2 (0.5%) | 36 (8.0%) |
| $12,500 to $14,999 | 6 (1.4%) | 20 (4.5%) |
| $15,000 to $17,499 | 1 (0.2%) | 18 (4.0%) |
| $17,500 to $19,999 | 0 (0.0%) | 34 (7.6%) |
| $20,000 to $22,499 | 7 (1.6%) | 15 (3.4%) |
| $22,500 to $24,999 | 13 (3.0%) | 18 (4.0%) |
| $25,000 to $29,999 | 34 (7.9%) | 17 (3.8%) |
| $30,000 to $34,999 | 9 (2.1%) | 38 (8.5%) |
| $35,000 to $39,999 | 23 (5.3%) | 64 (14.3%) |
| $40,000 to $44,999 | 16 (3.7%) | 35 (7.8%) |
| $45,000 to $49,999 | 73 (16.9%) | 22 (4.9%) |
| $50,000 to $54,999 | 48 (11.1%) | 10 (2.2%) |
| $55,000 to $64,999 | 48 (11.1%) | 48 (10.7%) |
| $65,000 to $74,999 | 39 (9.0%) | 3 (0.7%) |
| $75,000 to $99,999 | 34 (7.9%) | 26 (5.8%) |
| $100,000+ | 64 (14.8%) | 9 (2.0%) |
| Total | 433 (100.0%) | 448 (100.0%) |
Earnings by Sex by Educational Attainment in Rehobeth
Average earnings in Rehobeth are $54,018 for men and $36,133 for women, a difference of 33.1%. Men with an educational attainment of graduate degree enjoy the highest average annual earnings of $107,500, while those with high school diploma education earn the least with $46,250. Women with an educational attainment of graduate degree earn the most with the average annual earnings of $58,594, while those with high school diploma education have the smallest earnings of $24,659.
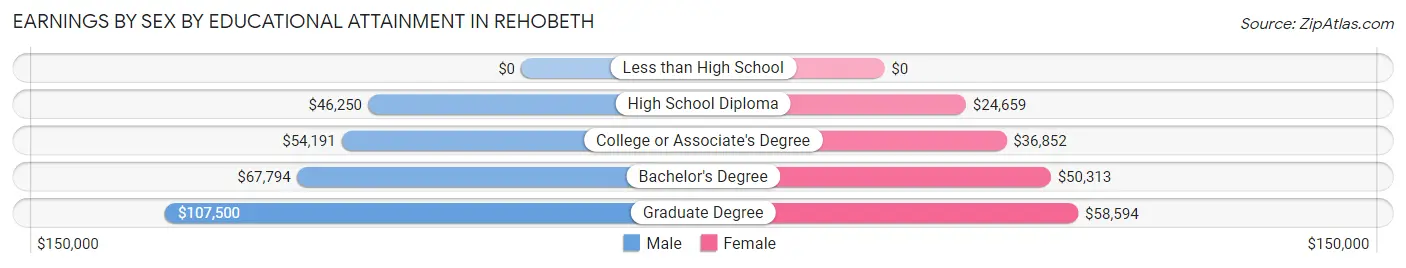
| Educational Attainment | Male Income | Female Income |
| Less than High School | - | - |
| High School Diploma | $46,250 | $24,659 |
| College or Associate's Degree | $54,191 | $36,852 |
| Bachelor's Degree | $67,794 | $50,313 |
| Graduate Degree | $107,500 | $58,594 |
| Total | $54,018 | $36,133 |
Family Income in Rehobeth
Family Income Brackets in Rehobeth
According to the Rehobeth family income data, there are 113 families falling into the $100,000 to $149,999 income range, which is the most common income bracket and makes up 23.1% of all families. Conversely, the less than $10,000 income bracket is the least frequent group with only 10 families (2.0%) belonging to this category.
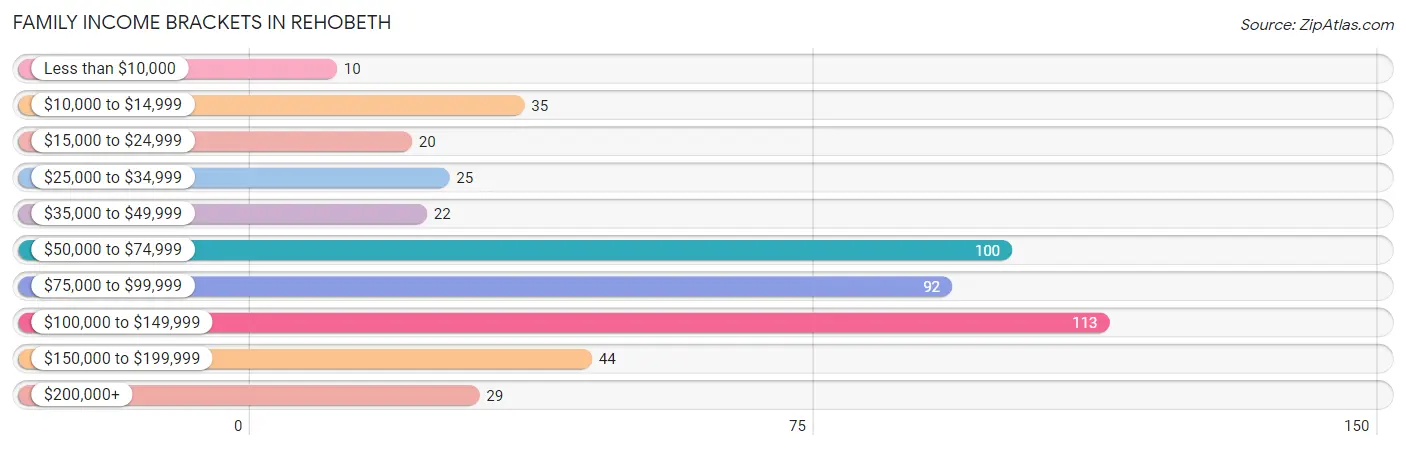
| Income Bracket | # Families | % Families |
| Less than $10,000 | 10 | 2.0% |
| $10,000 to $14,999 | 35 | 7.1% |
| $15,000 to $24,999 | 20 | 4.1% |
| $25,000 to $34,999 | 25 | 5.1% |
| $35,000 to $49,999 | 22 | 4.5% |
| $50,000 to $74,999 | 100 | 20.4% |
| $75,000 to $99,999 | 92 | 18.8% |
| $100,000 to $149,999 | 113 | 23.1% |
| $150,000 to $199,999 | 44 | 9.0% |
| $200,000+ | 29 | 5.9% |
Family Income by Famaliy Size in Rehobeth
5-person families (33 | 6.7%) account for the highest median family income in Rehobeth with $163,250 per family, while 2-person families (177 | 36.1%) have the highest median income of $34,271 per family member.
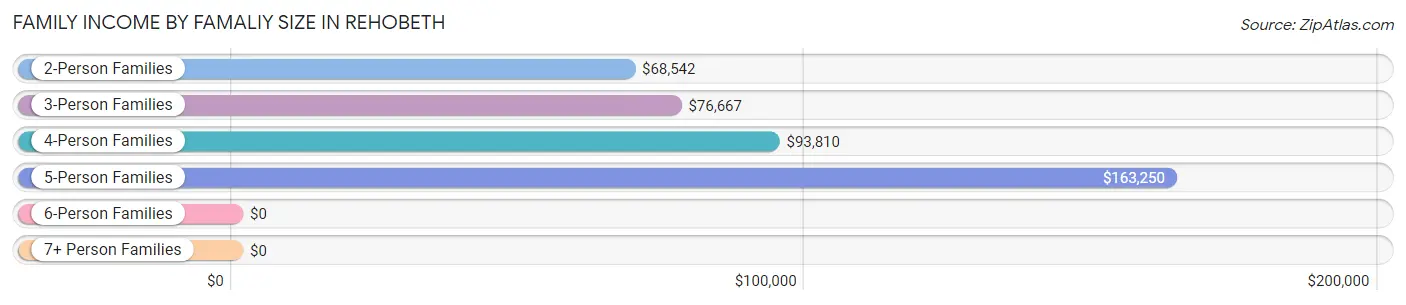
| Income Bracket | # Families | Median Income |
| 2-Person Families | 177 (36.1%) | $68,542 |
| 3-Person Families | 98 (20.0%) | $76,667 |
| 4-Person Families | 158 (32.2%) | $93,810 |
| 5-Person Families | 33 (6.7%) | $163,250 |
| 6-Person Families | 24 (4.9%) | $0 |
| 7+ Person Families | 0 (0.0%) | $0 |
| Total | 490 (100.0%) | $78,125 |
Family Income by Number of Earners in Rehobeth
The median family income in Rehobeth is $78,125, with families comprising 3+ earners (63) having the highest median family income of $134,688, while families with no earners (59) have the lowest median family income of $18,897, accounting for 12.9% and 12.0% of families, respectively.
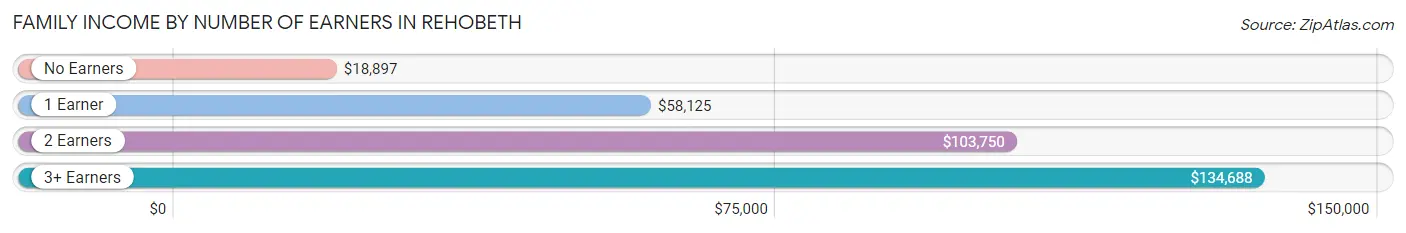
| Number of Earners | # Families | Median Income |
| No Earners | 59 (12.0%) | $18,897 |
| 1 Earner | 171 (34.9%) | $58,125 |
| 2 Earners | 197 (40.2%) | $103,750 |
| 3+ Earners | 63 (12.9%) | $134,688 |
| Total | 490 (100.0%) | $78,125 |
Household Income in Rehobeth
Household Income Brackets in Rehobeth
With 134 households falling in the category, the $50,000 to $74,999 income range is the most frequent in Rehobeth, accounting for 21.7% of all households. In contrast, only 12 households (1.9%) fall into the less than $10,000 income bracket, making it the least populous group.
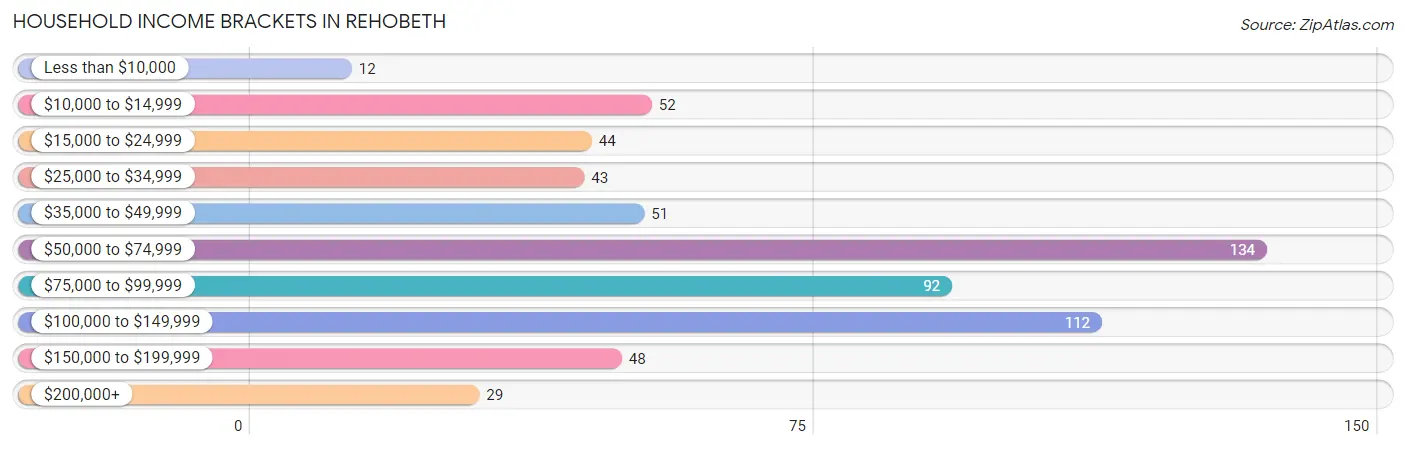
| Income Bracket | # Households | % Households |
| Less than $10,000 | 12 | 1.9% |
| $10,000 to $14,999 | 52 | 8.4% |
| $15,000 to $24,999 | 44 | 7.1% |
| $25,000 to $34,999 | 43 | 7.0% |
| $35,000 to $49,999 | 51 | 8.3% |
| $50,000 to $74,999 | 134 | 21.7% |
| $75,000 to $99,999 | 92 | 14.9% |
| $100,000 to $149,999 | 112 | 18.2% |
| $150,000 to $199,999 | 48 | 7.8% |
| $200,000+ | 29 | 4.7% |
Household Income by Householder Age in Rehobeth
The median household income in Rehobeth is $68,958, with the highest median household income of $76,250 found in the 45 to 64 years age bracket for the primary householder. A total of 182 households (29.5%) fall into this category. Meanwhile, the 65+ years age bracket for the primary householder has the lowest median household income of $46,667, with 148 households (24.0%) in this group.
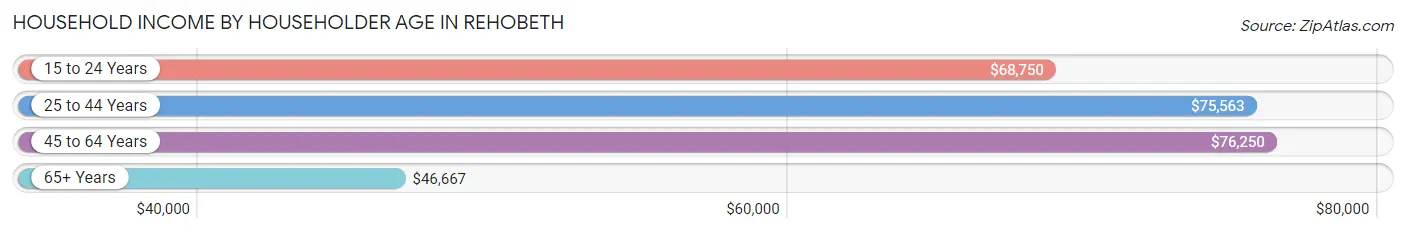
| Income Bracket | # Households | Median Income |
| 15 to 24 Years | 10 (1.6%) | $68,750 |
| 25 to 44 Years | 277 (44.9%) | $75,563 |
| 45 to 64 Years | 182 (29.5%) | $76,250 |
| 65+ Years | 148 (24.0%) | $46,667 |
| Total | 617 (100.0%) | $68,958 |
Poverty in Rehobeth
Income Below Poverty by Sex and Age in Rehobeth
With 11.3% poverty level for males and 16.7% for females among the residents of Rehobeth, 12 to 14 year old males and 5 year old females are the most vulnerable to poverty, with 13 males (40.6%) and 4 females (100.0%) in their respective age groups living below the poverty level.
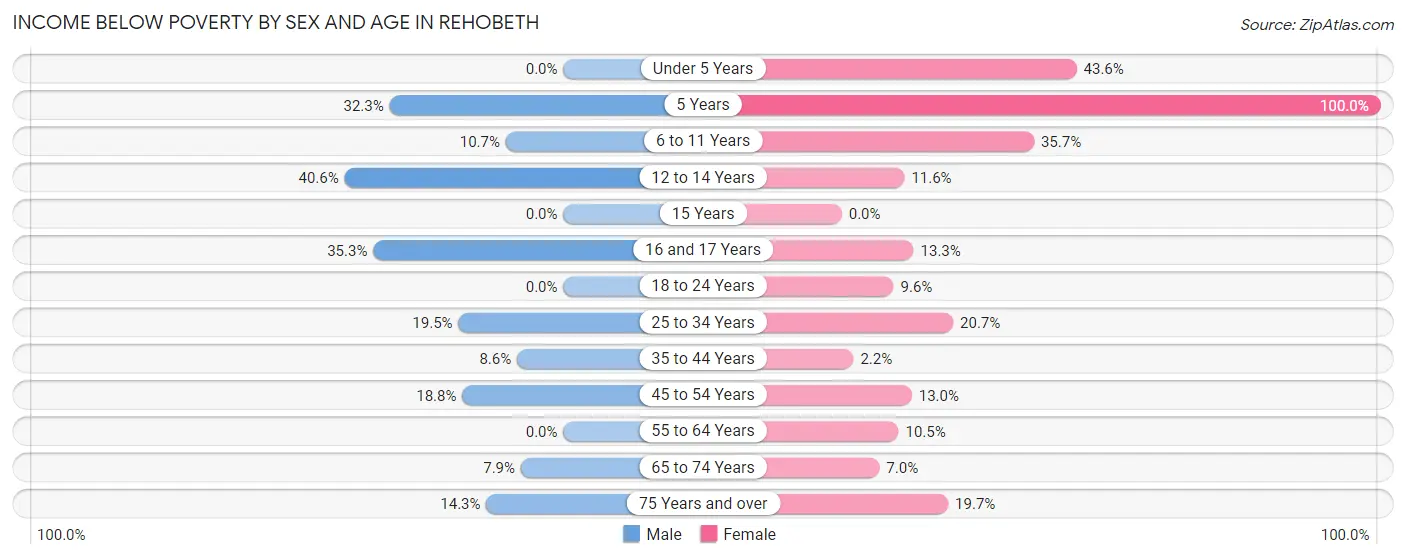
| Age Bracket | Male | Female |
| Under 5 Years | 0 (0.0%) | 17 (43.6%) |
| 5 Years | 10 (32.3%) | 4 (100.0%) |
| 6 to 11 Years | 14 (10.7%) | 61 (35.7%) |
| 12 to 14 Years | 13 (40.6%) | 10 (11.6%) |
| 15 Years | 0 (0.0%) | 0 (0.0%) |
| 16 and 17 Years | 6 (35.3%) | 4 (13.3%) |
| 18 to 24 Years | 0 (0.0%) | 5 (9.6%) |
| 25 to 34 Years | 15 (19.5%) | 25 (20.7%) |
| 35 to 44 Years | 17 (8.6%) | 3 (2.2%) |
| 45 to 54 Years | 12 (18.8%) | 13 (13.0%) |
| 55 to 64 Years | 0 (0.0%) | 12 (10.5%) |
| 65 to 74 Years | 6 (7.9%) | 6 (7.0%) |
| 75 Years and over | 2 (14.3%) | 15 (19.7%) |
| Total | 95 (11.3%) | 175 (16.7%) |
Income Above Poverty by Sex and Age in Rehobeth
According to the poverty statistics in Rehobeth, males aged under 5 years and females aged 15 years are the age groups that are most secure financially, with 100.0% of males and 100.0% of females in these age groups living above the poverty line.
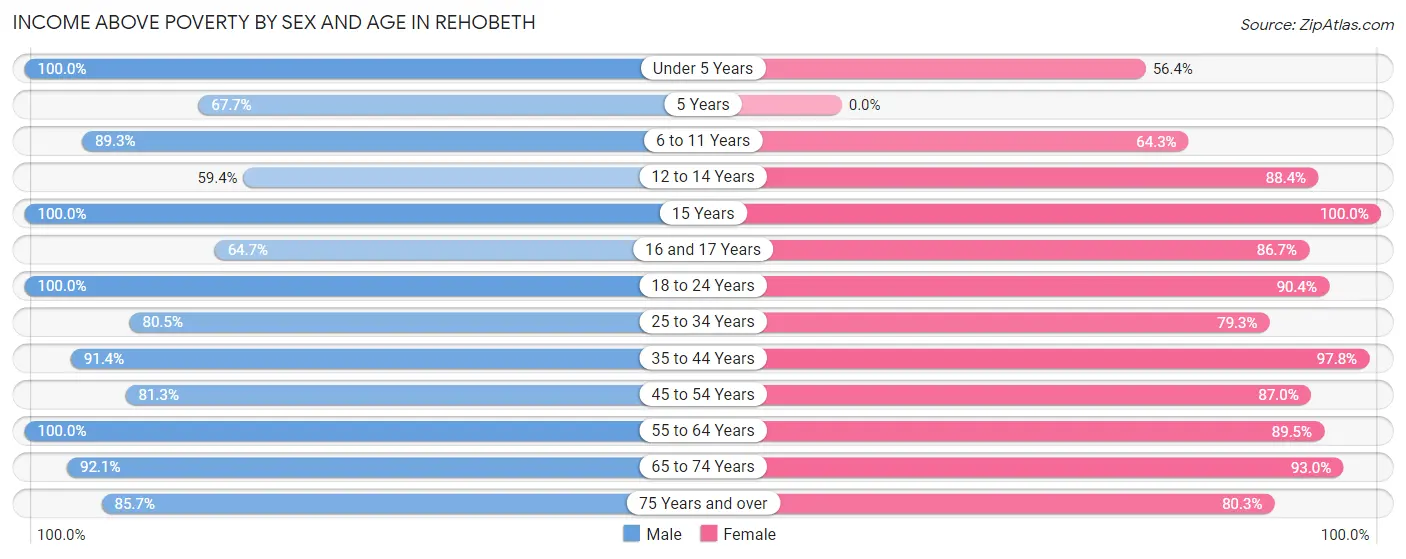
| Age Bracket | Male | Female |
| Under 5 Years | 25 (100.0%) | 22 (56.4%) |
| 5 Years | 21 (67.7%) | 0 (0.0%) |
| 6 to 11 Years | 117 (89.3%) | 110 (64.3%) |
| 12 to 14 Years | 19 (59.4%) | 76 (88.4%) |
| 15 Years | 30 (100.0%) | 32 (100.0%) |
| 16 and 17 Years | 11 (64.7%) | 26 (86.7%) |
| 18 to 24 Years | 41 (100.0%) | 47 (90.4%) |
| 25 to 34 Years | 62 (80.5%) | 96 (79.3%) |
| 35 to 44 Years | 181 (91.4%) | 135 (97.8%) |
| 45 to 54 Years | 52 (81.2%) | 87 (87.0%) |
| 55 to 64 Years | 102 (100.0%) | 102 (89.5%) |
| 65 to 74 Years | 70 (92.1%) | 80 (93.0%) |
| 75 Years and over | 12 (85.7%) | 61 (80.3%) |
| Total | 743 (88.7%) | 874 (83.3%) |
Income Below Poverty Among Married-Couple Families in Rehobeth
The poverty statistics for married-couple families in Rehobeth show that 5.1% or 19 of the total 374 families live below the poverty line. Families with no children have the highest poverty rate of 8.5%, comprising of 14 families. On the other hand, families with 3 or 4 children have the lowest poverty rate of 0.0%, which includes 0 families.
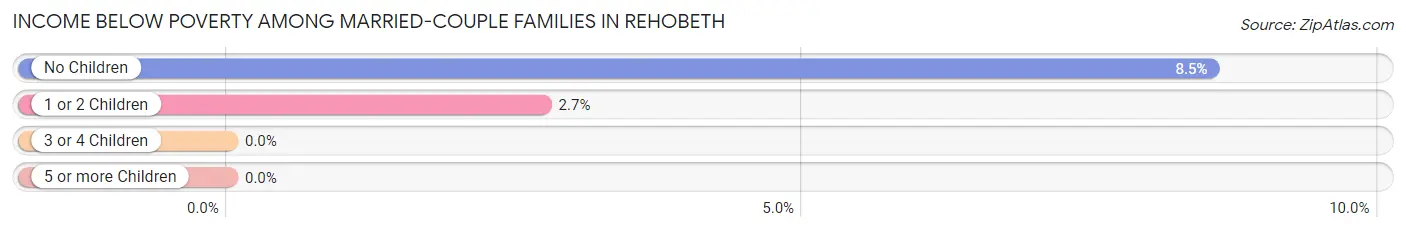
| Children | Above Poverty | Below Poverty |
| No Children | 150 (91.5%) | 14 (8.5%) |
| 1 or 2 Children | 178 (97.3%) | 5 (2.7%) |
| 3 or 4 Children | 27 (100.0%) | 0 (0.0%) |
| 5 or more Children | 0 (0.0%) | 0 (0.0%) |
| Total | 355 (94.9%) | 19 (5.1%) |
Income Below Poverty Among Single-Parent Households in Rehobeth
According to the poverty data in Rehobeth, 35.0% or 21 single-father households and 55.4% or 31 single-mother households are living below the poverty line. Among single-father households, those with no children have the highest poverty rate, with 2 households (100.0%) experiencing poverty. Likewise, among single-mother households, those with 3 or 4 children have the highest poverty rate, with 16 households (100.0%) falling below the poverty line.
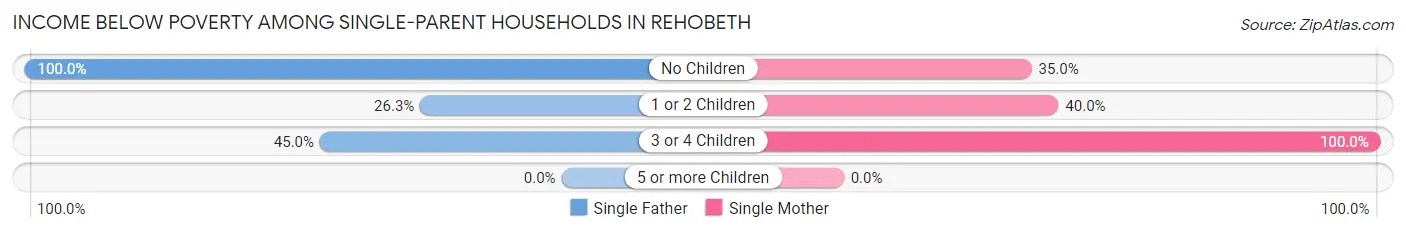
| Children | Single Father | Single Mother |
| No Children | 2 (100.0%) | 7 (35.0%) |
| 1 or 2 Children | 10 (26.3%) | 8 (40.0%) |
| 3 or 4 Children | 9 (45.0%) | 16 (100.0%) |
| 5 or more Children | 0 (0.0%) | 0 (0.0%) |
| Total | 21 (35.0%) | 31 (55.4%) |
Income Below Poverty Among Married-Couple vs Single-Parent Households in Rehobeth
The poverty data for Rehobeth shows that 19 of the married-couple family households (5.1%) and 52 of the single-parent households (44.8%) are living below the poverty level. Within the married-couple family households, those with no children have the highest poverty rate, with 14 households (8.5%) falling below the poverty line. Among the single-parent households, those with 3 or 4 children have the highest poverty rate, with 25 household (69.4%) living below poverty.
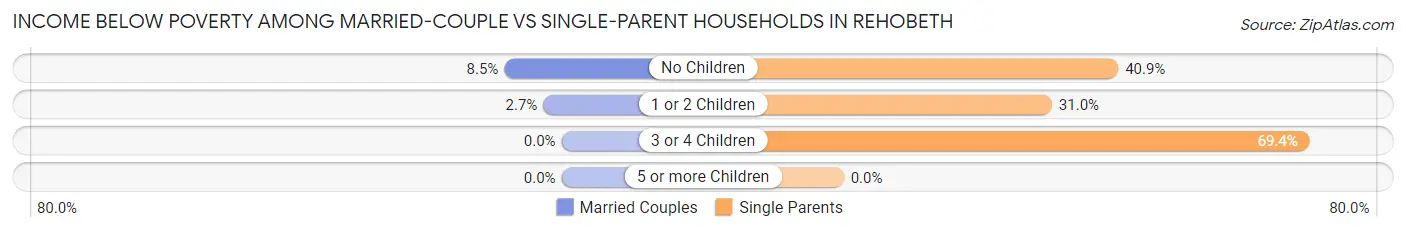
| Children | Married-Couple Families | Single-Parent Households |
| No Children | 14 (8.5%) | 9 (40.9%) |
| 1 or 2 Children | 5 (2.7%) | 18 (31.0%) |
| 3 or 4 Children | 0 (0.0%) | 25 (69.4%) |
| 5 or more Children | 0 (0.0%) | 0 (0.0%) |
| Total | 19 (5.1%) | 52 (44.8%) |
Race in Rehobeth
The most populous races in Rehobeth are White / Caucasian (1,719 | 90.7%), Black / African American (103 | 5.4%), and Hispanic or Latino (93 | 4.9%).
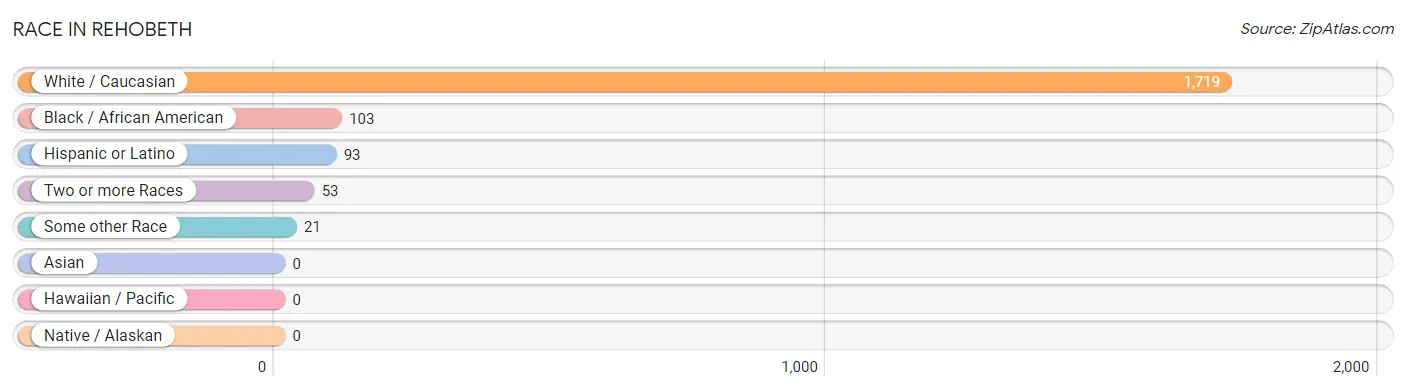
| Race | # Population | % Population |
| Asian | 0 | 0.0% |
| Black / African American | 103 | 5.4% |
| Hawaiian / Pacific | 0 | 0.0% |
| Hispanic or Latino | 93 | 4.9% |
| Native / Alaskan | 0 | 0.0% |
| White / Caucasian | 1,719 | 90.7% |
| Two or more Races | 53 | 2.8% |
| Some other Race | 21 | 1.1% |
| Total | 1,896 | 100.0% |
Ancestry in Rehobeth
The most populous ancestries reported in Rehobeth are American (370 | 19.5%), English (232 | 12.2%), Irish (136 | 7.2%), German (86 | 4.5%), and Mexican (53 | 2.8%), together accounting for 46.3% of all Rehobeth residents.
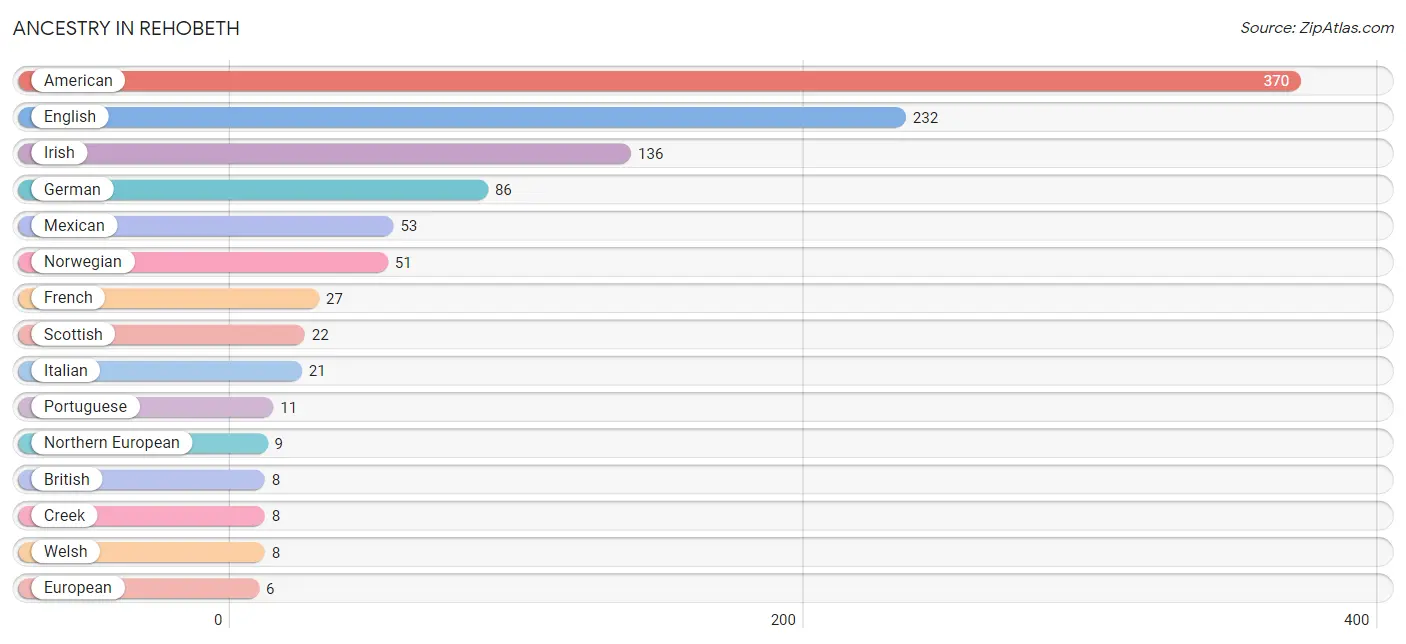
| Ancestry | # Population | % Population |
| American | 370 | 19.5% |
| British | 8 | 0.4% |
| Central American | 3 | 0.2% |
| Cherokee | 5 | 0.3% |
| Creek | 8 | 0.4% |
| English | 232 | 12.2% |
| European | 6 | 0.3% |
| French | 27 | 1.4% |
| French Canadian | 6 | 0.3% |
| German | 86 | 4.5% |
| Guatemalan | 3 | 0.2% |
| Irish | 136 | 7.2% |
| Italian | 21 | 1.1% |
| Mexican | 53 | 2.8% |
| Northern European | 9 | 0.5% |
| Norwegian | 51 | 2.7% |
| Portuguese | 11 | 0.6% |
| Scotch-Irish | 2 | 0.1% |
| Scottish | 22 | 1.2% |
| Welsh | 8 | 0.4% | View All 20 Rows |
Immigrants in Rehobeth
The most numerous immigrant groups reported in Rehobeth came from Central America (15 | 0.8%), Latin America (15 | 0.8%), Mexico (15 | 0.8%), Canada (3 | 0.2%), and Europe (3 | 0.2%), together accounting for 2.7% of all Rehobeth residents.
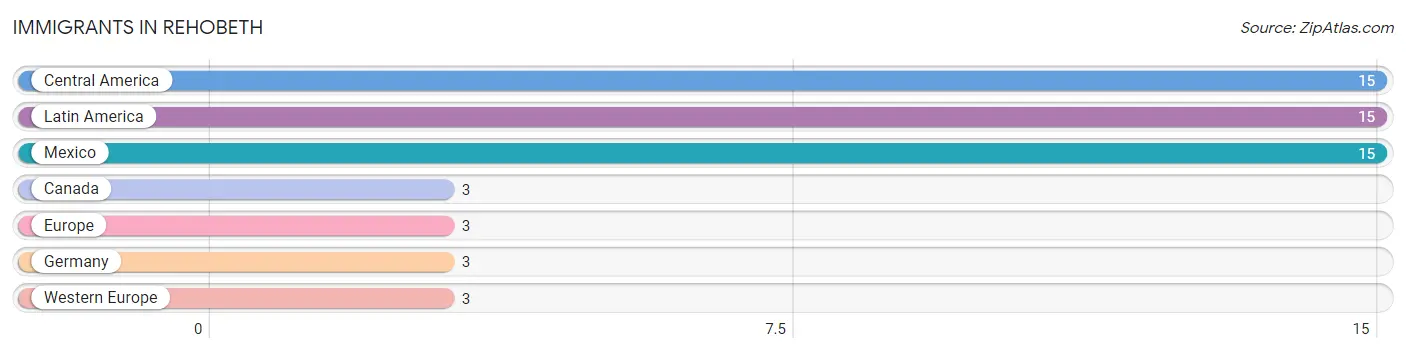
| Immigration Origin | # Population | % Population |
| Canada | 3 | 0.2% |
| Central America | 15 | 0.8% |
| Europe | 3 | 0.2% |
| Germany | 3 | 0.2% |
| Latin America | 15 | 0.8% |
| Mexico | 15 | 0.8% |
| Western Europe | 3 | 0.2% | View All 7 Rows |
Sex and Age in Rehobeth
Sex and Age in Rehobeth
The most populous age groups in Rehobeth are 35 to 39 Years (103 | 12.2%) for men and 10 to 14 Years (143 | 13.6%) for women.
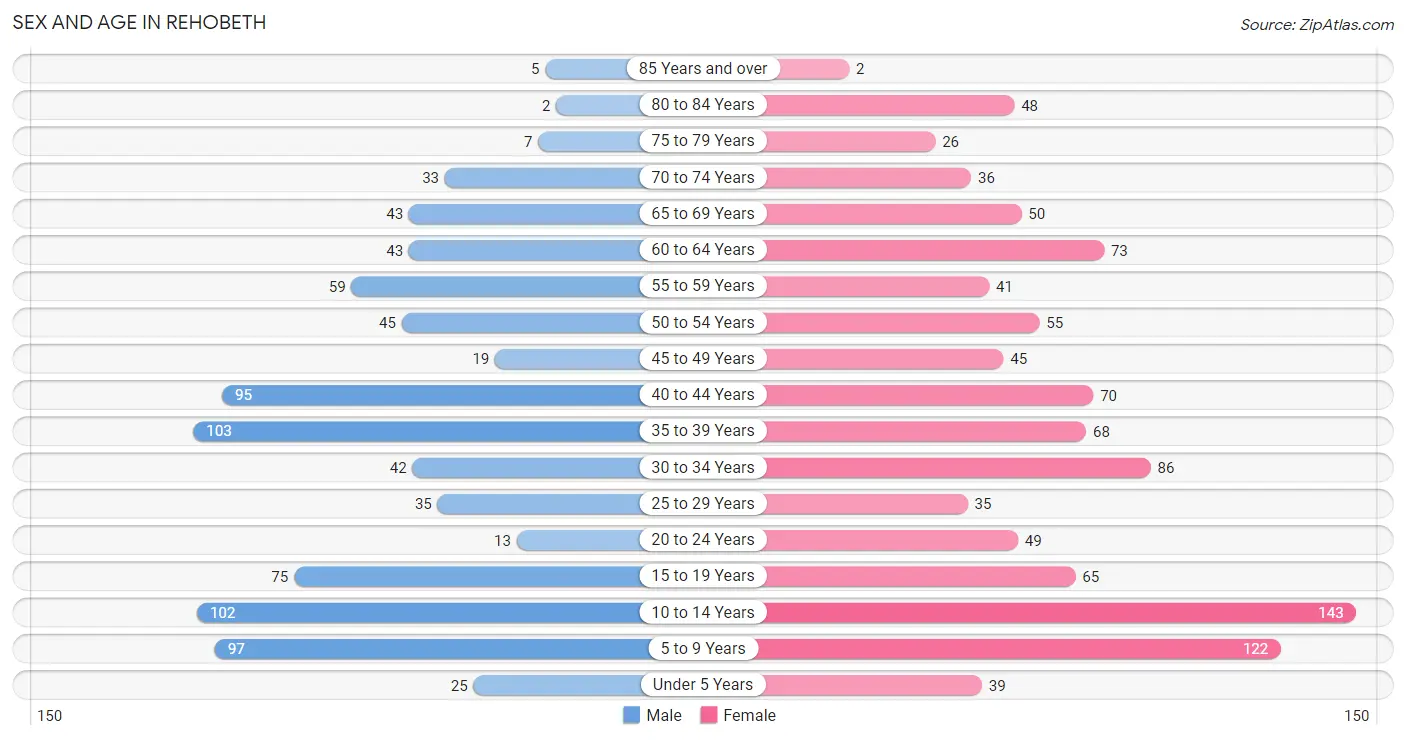
| Age Bracket | Male | Female |
| Under 5 Years | 25 (3.0%) | 39 (3.7%) |
| 5 to 9 Years | 97 (11.5%) | 122 (11.6%) |
| 10 to 14 Years | 102 (12.1%) | 143 (13.6%) |
| 15 to 19 Years | 75 (8.9%) | 65 (6.2%) |
| 20 to 24 Years | 13 (1.5%) | 49 (4.6%) |
| 25 to 29 Years | 35 (4.2%) | 35 (3.3%) |
| 30 to 34 Years | 42 (5.0%) | 86 (8.2%) |
| 35 to 39 Years | 103 (12.2%) | 68 (6.5%) |
| 40 to 44 Years | 95 (11.3%) | 70 (6.7%) |
| 45 to 49 Years | 19 (2.2%) | 45 (4.3%) |
| 50 to 54 Years | 45 (5.3%) | 55 (5.2%) |
| 55 to 59 Years | 59 (7.0%) | 41 (3.9%) |
| 60 to 64 Years | 43 (5.1%) | 73 (6.9%) |
| 65 to 69 Years | 43 (5.1%) | 50 (4.8%) |
| 70 to 74 Years | 33 (3.9%) | 36 (3.4%) |
| 75 to 79 Years | 7 (0.8%) | 26 (2.5%) |
| 80 to 84 Years | 2 (0.2%) | 48 (4.6%) |
| 85 Years and over | 5 (0.6%) | 2 (0.2%) |
| Total | 843 (100.0%) | 1,053 (100.0%) |
Families and Households in Rehobeth
Median Family Size in Rehobeth
The median family size in Rehobeth is 3.50 persons per family, with single female/mother families (56 | 11.4%) accounting for the largest median family size of 3.77 persons per family. On the other hand, married-couple families (374 | 76.3%) represent the smallest median family size with 3.42 persons per family.
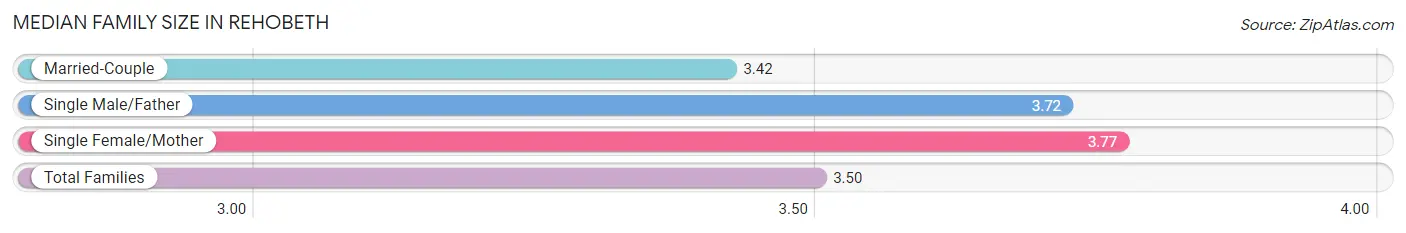
| Family Type | # Families | Family Size |
| Married-Couple | 374 (76.3%) | 3.42 |
| Single Male/Father | 60 (12.2%) | 3.72 |
| Single Female/Mother | 56 (11.4%) | 3.77 |
| Total Families | 490 (100.0%) | 3.50 |
Median Household Size in Rehobeth
The median household size in Rehobeth is 3.07 persons per household, with single male/father households (60 | 9.7%) accounting for the largest median household size of 4.32 persons per household. non-family households (127 | 20.6%) represent the smallest median household size with 1.02 persons per household.
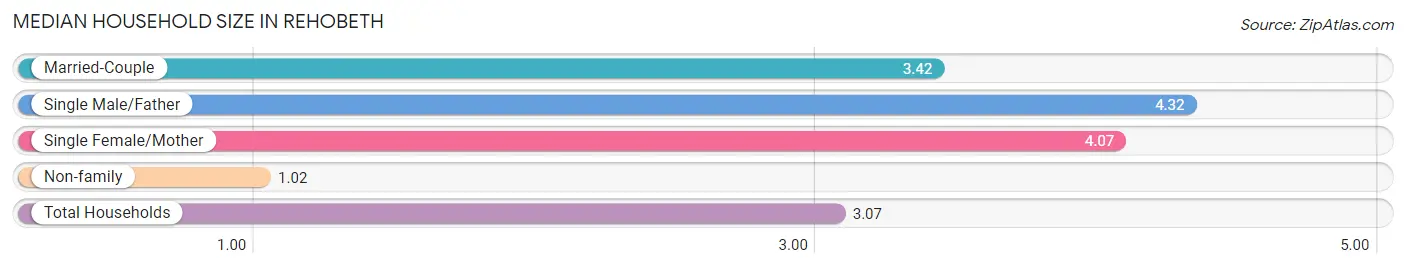
| Household Type | # Households | Household Size |
| Married-Couple | 374 (60.6%) | 3.42 |
| Single Male/Father | 60 (9.7%) | 4.32 |
| Single Female/Mother | 56 (9.1%) | 4.07 |
| Non-family | 127 (20.6%) | 1.02 |
| Total Households | 617 (100.0%) | 3.07 |
Household Size by Marriage Status in Rehobeth
Out of a total of 617 households in Rehobeth, 490 (79.4%) are family households, while 127 (20.6%) are nonfamily households. The most numerous type of family households are 2-person households, comprising 164, and the most common type of nonfamily households are 1-person households, comprising 124.
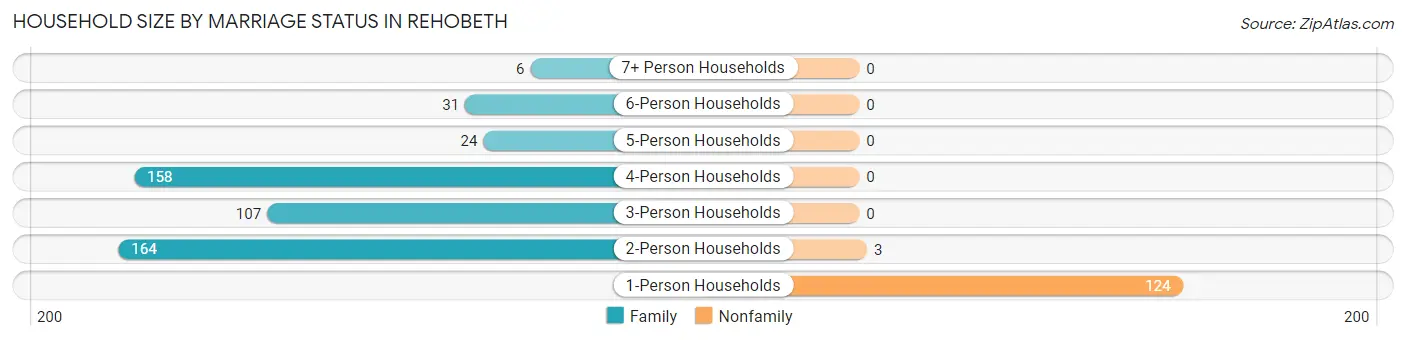
| Household Size | Family Households | Nonfamily Households |
| 1-Person Households | - | 124 (20.1%) |
| 2-Person Households | 164 (26.6%) | 3 (0.5%) |
| 3-Person Households | 107 (17.3%) | 0 (0.0%) |
| 4-Person Households | 158 (25.6%) | 0 (0.0%) |
| 5-Person Households | 24 (3.9%) | 0 (0.0%) |
| 6-Person Households | 31 (5.0%) | 0 (0.0%) |
| 7+ Person Households | 6 (1.0%) | 0 (0.0%) |
| Total | 490 (79.4%) | 127 (20.6%) |
Female Fertility in Rehobeth
Fertility by Age in Rehobeth
Average fertility rate in Rehobeth is 9.0 births per 1,000 women. Women in the age bracket of 20 to 34 years have the highest fertility rate with 24.0 births per 1,000 women. Women in the age bracket of 20 to 34 years acount for 100.0% of all women with births.
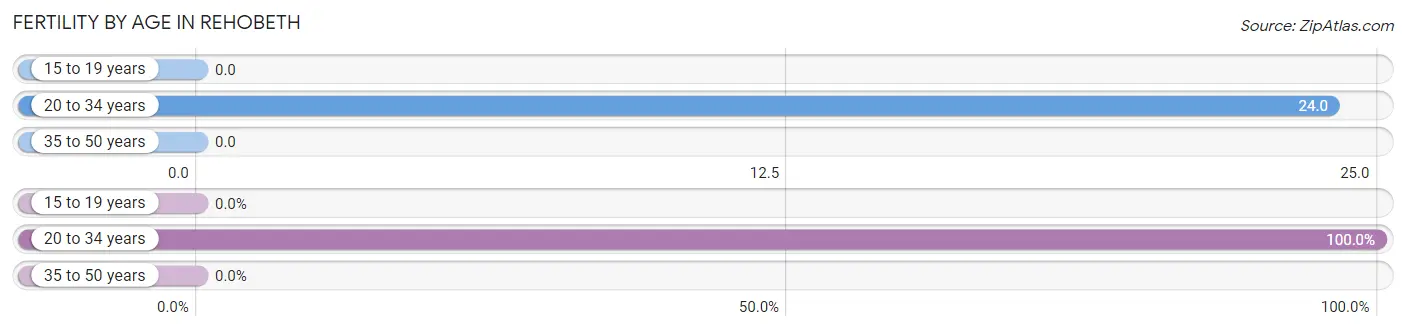
| Age Bracket | Women with Births | Births / 1,000 Women |
| 15 to 19 years | 0 (0.0%) | 0.0 |
| 20 to 34 years | 4 (100.0%) | 24.0 |
| 35 to 50 years | 0 (0.0%) | 0.0 |
| Total | 4 (100.0%) | 9.0 |
Fertility by Age by Marriage Status in Rehobeth
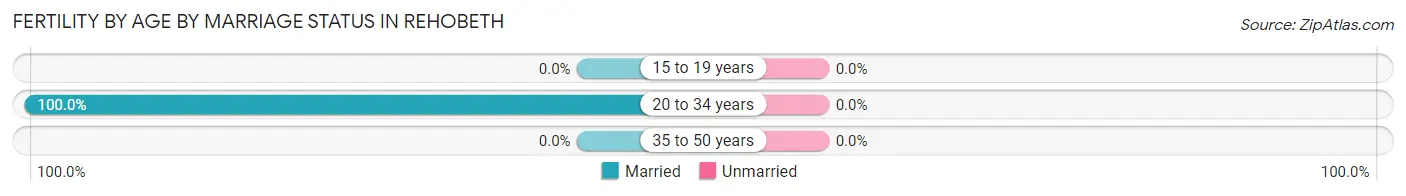
| Age Bracket | Married | Unmarried |
| 15 to 19 years | 0 (0.0%) | 0 (0.0%) |
| 20 to 34 years | 4 (100.0%) | 0 (0.0%) |
| 35 to 50 years | 0 (0.0%) | 0 (0.0%) |
| Total | 4 (100.0%) | 0 (0.0%) |
Fertility by Education in Rehobeth
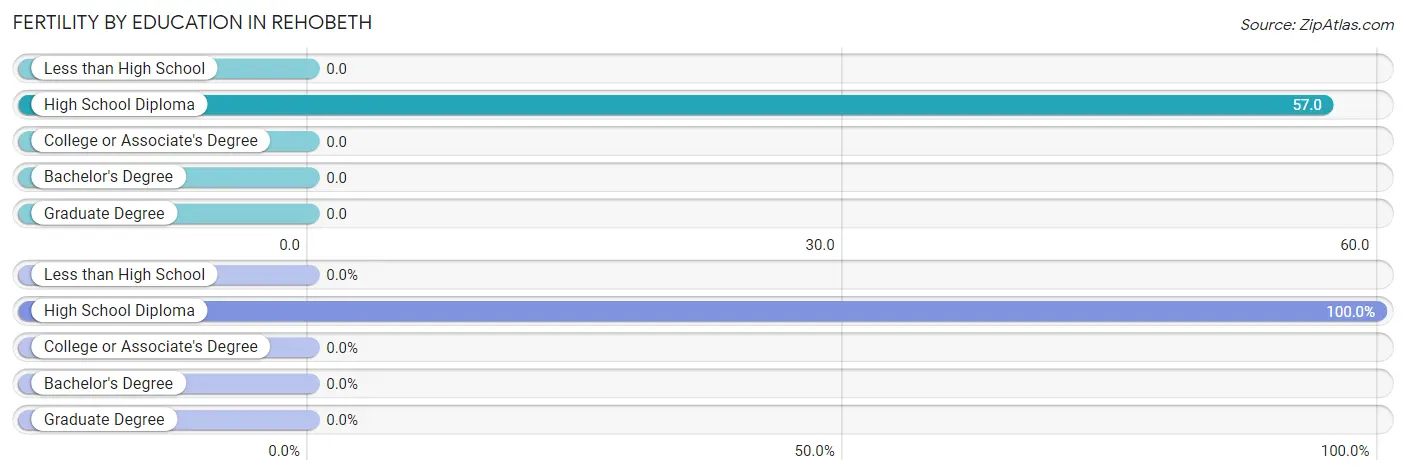
| Educational Attainment | Women with Births | Births / 1,000 Women |
| Less than High School | 0 (0.0%) | 0.0 |
| High School Diploma | 4 (100.0%) | 57.0 |
| College or Associate's Degree | 0 (0.0%) | 0.0 |
| Bachelor's Degree | 0 (0.0%) | 0.0 |
| Graduate Degree | 0 (0.0%) | 0.0 |
| Total | 4 (100.0%) | 9.0 |
Fertility by Education by Marriage Status in Rehobeth
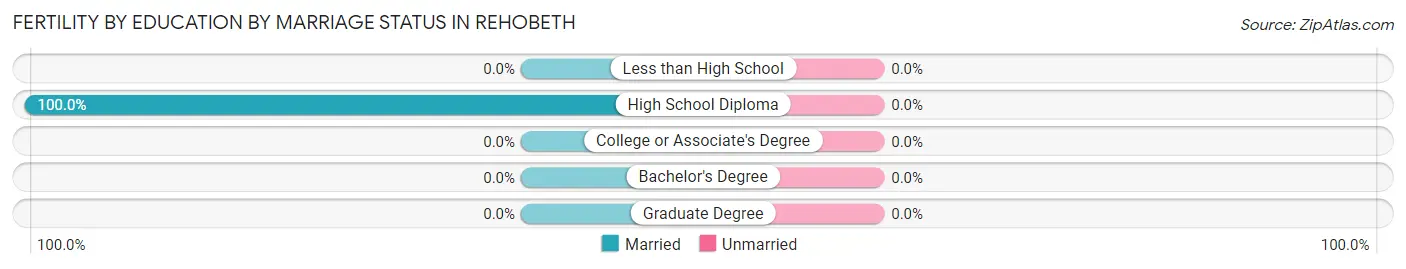
| Educational Attainment | Married | Unmarried |
| Less than High School | 0 (0.0%) | 0 (0.0%) |
| High School Diploma | 4 (100.0%) | 0 (0.0%) |
| College or Associate's Degree | 0 (0.0%) | 0 (0.0%) |
| Bachelor's Degree | 0 (0.0%) | 0 (0.0%) |
| Graduate Degree | 0 (0.0%) | 0 (0.0%) |
| Total | 4 (100.0%) | 0 (0.0%) |
Employment Characteristics in Rehobeth
Employment by Class of Employer in Rehobeth
Among the 839 employed individuals in Rehobeth, private company employees (532 | 63.4%), local government employees (102 | 12.2%), and self-employed (not incorporated) (63 | 7.5%) make up the most common classes of employment.
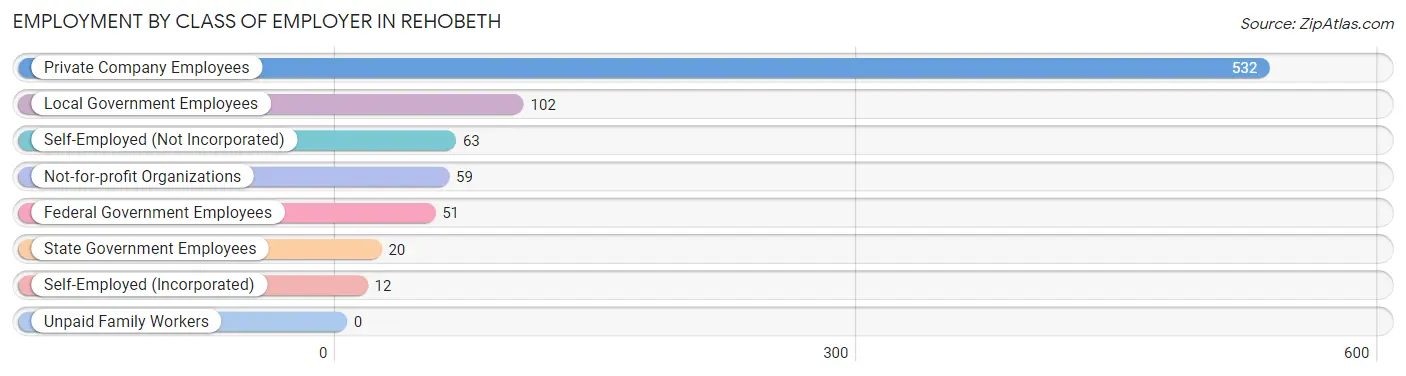
| Employer Class | # Employees | % Employees |
| Private Company Employees | 532 | 63.4% |
| Self-Employed (Incorporated) | 12 | 1.4% |
| Self-Employed (Not Incorporated) | 63 | 7.5% |
| Not-for-profit Organizations | 59 | 7.0% |
| Local Government Employees | 102 | 12.2% |
| State Government Employees | 20 | 2.4% |
| Federal Government Employees | 51 | 6.1% |
| Unpaid Family Workers | 0 | 0.0% |
| Total | 839 | 100.0% |
Employment Status by Age in Rehobeth
According to the labor force statistics for Rehobeth, out of the total population over 16 years of age (1,306), 67.5% or 882 individuals are in the labor force, with 4.1% or 36 of them unemployed. The age group with the highest labor force participation rate is 30 to 34 years, with 93.8% or 120 individuals in the labor force. Within the labor force, the 25 to 29 years age range has the highest percentage of unemployed individuals, with 21.9% or 14 of them being unemployed.
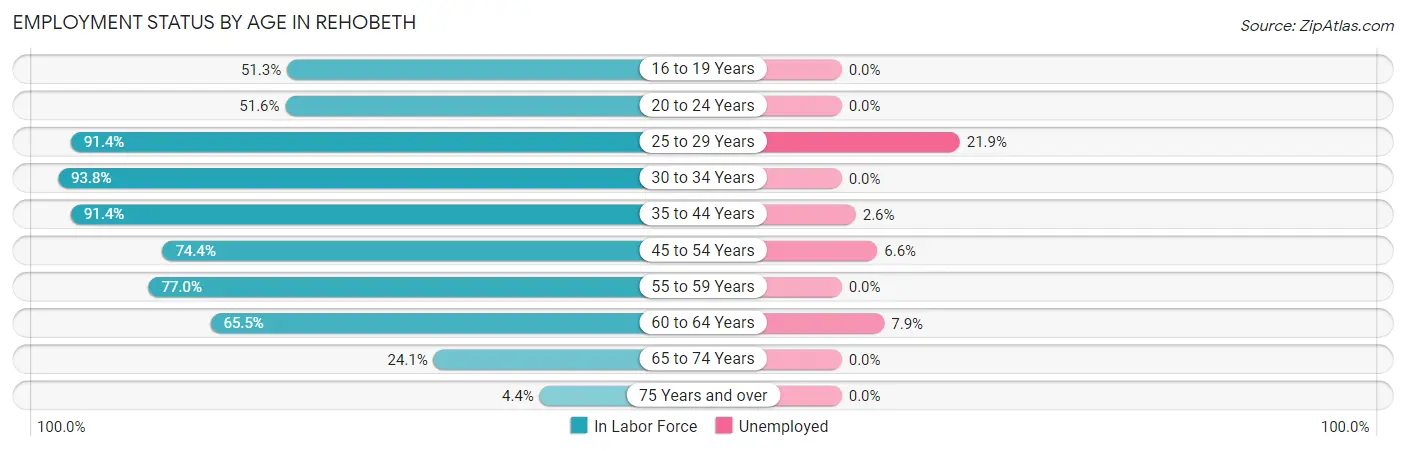
| Age Bracket | In Labor Force | Unemployed |
| 16 to 19 Years | 40 (51.3%) | 0 (0.0%) |
| 20 to 24 Years | 32 (51.6%) | 0 (0.0%) |
| 25 to 29 Years | 64 (91.4%) | 14 (21.9%) |
| 30 to 34 Years | 120 (93.8%) | 0 (0.0%) |
| 35 to 44 Years | 307 (91.4%) | 8 (2.6%) |
| 45 to 54 Years | 122 (74.4%) | 8 (6.6%) |
| 55 to 59 Years | 77 (77.0%) | 0 (0.0%) |
| 60 to 64 Years | 76 (65.5%) | 6 (7.9%) |
| 65 to 74 Years | 39 (24.1%) | 0 (0.0%) |
| 75 Years and over | 4 (4.4%) | 0 (0.0%) |
| Total | 882 (67.5%) | 36 (4.1%) |
Employment Status by Educational Attainment in Rehobeth
According to labor force statistics for Rehobeth, 83.8% of individuals (766) out of the total population between 25 and 64 years of age (914) are in the labor force, with 4.8% or 37 of them being unemployed. The group with the highest labor force participation rate are those with the educational attainment of bachelor's degree or higher, with 93.1% or 163 individuals in the labor force. Within the labor force, individuals with less than high school education have the highest percentage of unemployment, with 36.7% or 18 of them being unemployed.
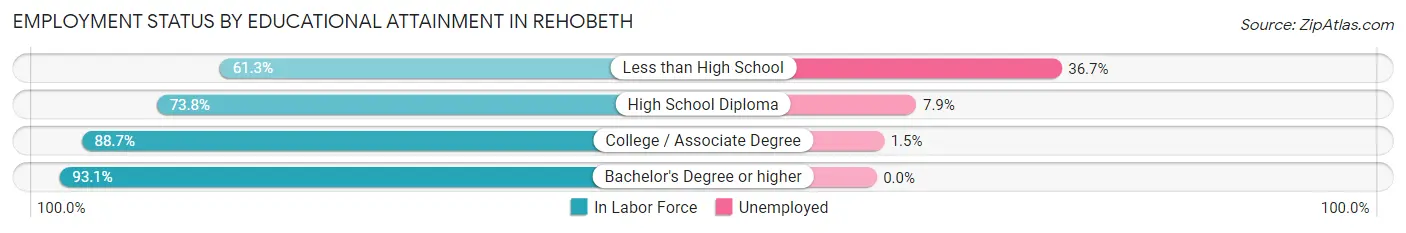
| Educational Attainment | In Labor Force | Unemployed |
| Less than High School | 49 (61.3%) | 29 (36.7%) |
| High School Diploma | 152 (73.8%) | 16 (7.9%) |
| College / Associate Degree | 402 (88.7%) | 7 (1.5%) |
| Bachelor's Degree or higher | 163 (93.1%) | 0 (0.0%) |
| Total | 766 (83.8%) | 44 (4.8%) |
Employment Occupations by Sex in Rehobeth
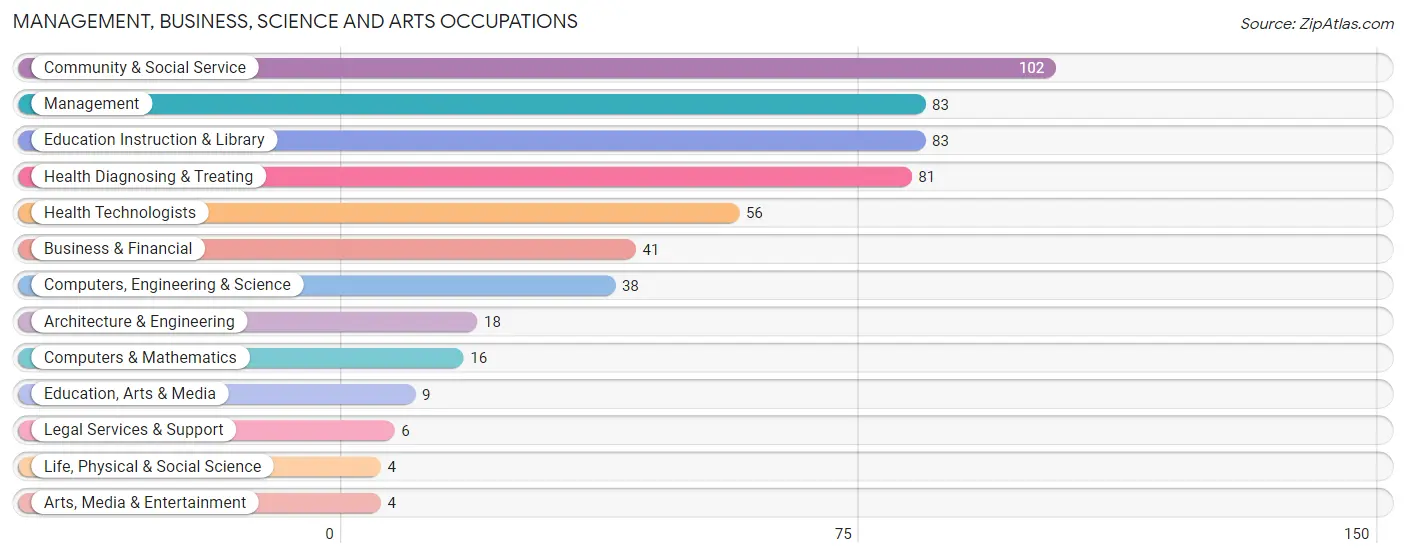
Management, Business, Science and Arts Occupations
The most common Management, Business, Science and Arts occupations in Rehobeth are Community & Social Service (102 | 12.2%), Management (83 | 10.0%), Education Instruction & Library (83 | 10.0%), Health Diagnosing & Treating (81 | 9.7%), and Health Technologists (56 | 6.7%).
Management, Business, Science and Arts Occupations by Sex
Within the Management, Business, Science and Arts occupations in Rehobeth, the most male-oriented occupations are Computers, Engineering & Science (100.0%), Computers & Mathematics (100.0%), and Architecture & Engineering (100.0%), while the most female-oriented occupations are Education, Arts & Media (100.0%), Arts, Media & Entertainment (100.0%), and Health Technologists (91.1%).
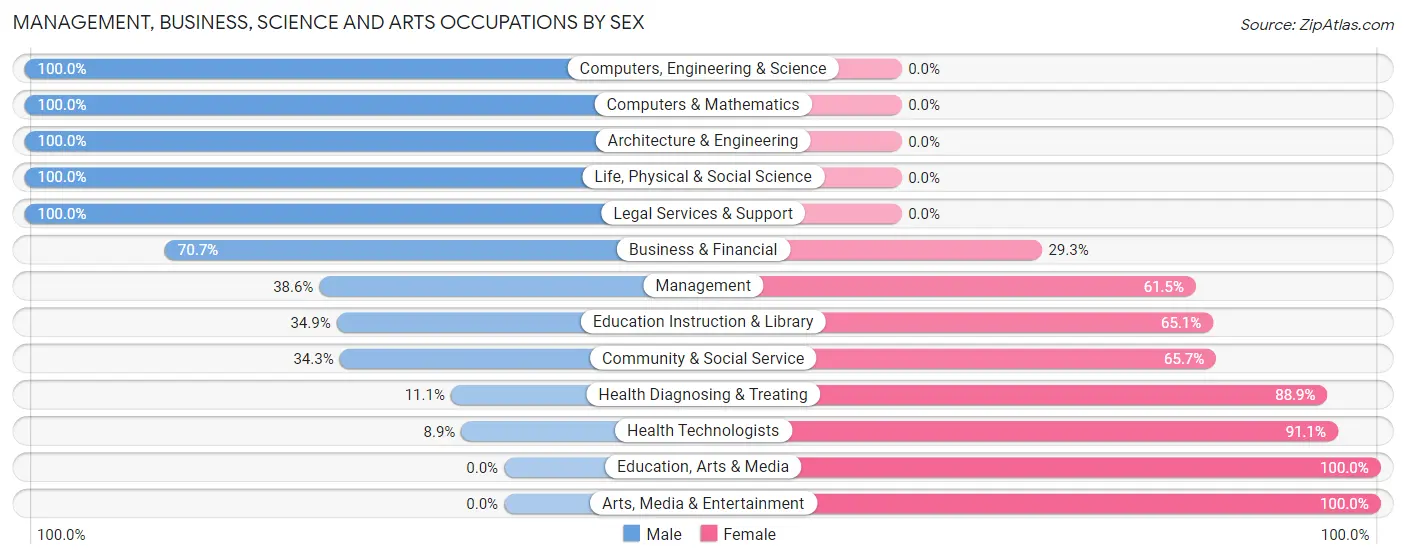
| Occupation | Male | Female |
| Management | 32 (38.6%) | 51 (61.5%) |
| Business & Financial | 29 (70.7%) | 12 (29.3%) |
| Computers, Engineering & Science | 38 (100.0%) | 0 (0.0%) |
| Computers & Mathematics | 16 (100.0%) | 0 (0.0%) |
| Architecture & Engineering | 18 (100.0%) | 0 (0.0%) |
| Life, Physical & Social Science | 4 (100.0%) | 0 (0.0%) |
| Community & Social Service | 35 (34.3%) | 67 (65.7%) |
| Education, Arts & Media | 0 (0.0%) | 9 (100.0%) |
| Legal Services & Support | 6 (100.0%) | 0 (0.0%) |
| Education Instruction & Library | 29 (34.9%) | 54 (65.1%) |
| Arts, Media & Entertainment | 0 (0.0%) | 4 (100.0%) |
| Health Diagnosing & Treating | 9 (11.1%) | 72 (88.9%) |
| Health Technologists | 5 (8.9%) | 51 (91.1%) |
| Total (Category) | 143 (41.4%) | 202 (58.6%) |
| Total (Overall) | 409 (49.0%) | 425 (51.0%) |
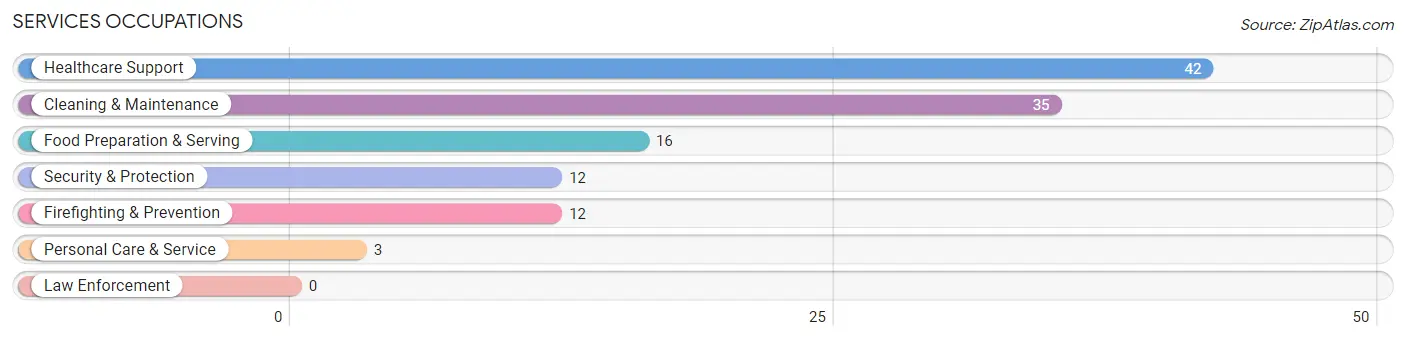
Services Occupations
The most common Services occupations in Rehobeth are Healthcare Support (42 | 5.0%), Cleaning & Maintenance (35 | 4.2%), Food Preparation & Serving (16 | 1.9%), Security & Protection (12 | 1.4%), and Firefighting & Prevention (12 | 1.4%).
Services Occupations by Sex
Within the Services occupations in Rehobeth, the most male-oriented occupations are Security & Protection (100.0%), Firefighting & Prevention (100.0%), and Cleaning & Maintenance (51.4%), while the most female-oriented occupations are Food Preparation & Serving (100.0%), Personal Care & Service (100.0%), and Healthcare Support (76.2%).
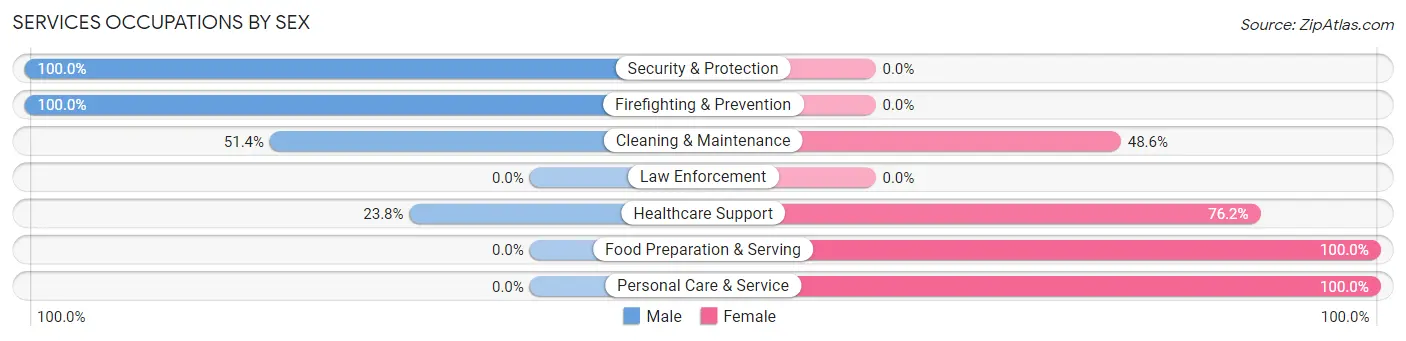
| Occupation | Male | Female |
| Healthcare Support | 10 (23.8%) | 32 (76.2%) |
| Security & Protection | 12 (100.0%) | 0 (0.0%) |
| Firefighting & Prevention | 12 (100.0%) | 0 (0.0%) |
| Law Enforcement | 0 (0.0%) | 0 (0.0%) |
| Food Preparation & Serving | 0 (0.0%) | 16 (100.0%) |
| Cleaning & Maintenance | 18 (51.4%) | 17 (48.6%) |
| Personal Care & Service | 0 (0.0%) | 3 (100.0%) |
| Total (Category) | 40 (37.0%) | 68 (63.0%) |
| Total (Overall) | 409 (49.0%) | 425 (51.0%) |
Sales and Office Occupations
The most common Sales and Office occupations in Rehobeth are Sales & Related (96 | 11.5%), and Office & Administration (77 | 9.2%).
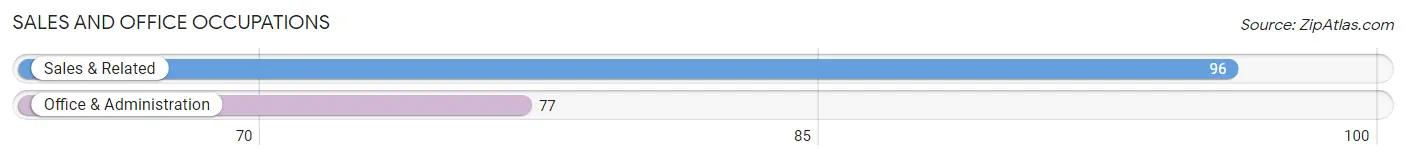
Sales and Office Occupations by Sex
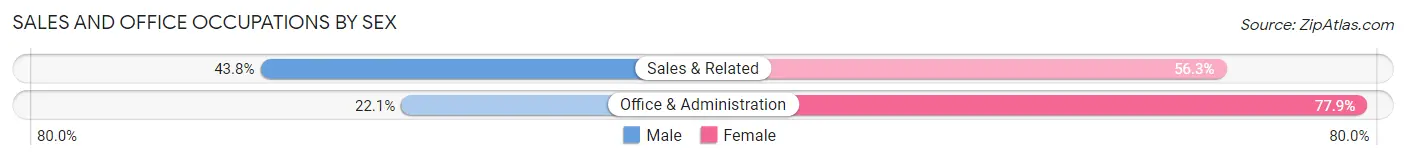
| Occupation | Male | Female |
| Sales & Related | 42 (43.8%) | 54 (56.2%) |
| Office & Administration | 17 (22.1%) | 60 (77.9%) |
| Total (Category) | 59 (34.1%) | 114 (65.9%) |
| Total (Overall) | 409 (49.0%) | 425 (51.0%) |
Natural Resources, Construction and Maintenance Occupations
The most common Natural Resources, Construction and Maintenance occupations in Rehobeth are Installation, Maintenance & Repair (66 | 7.9%), and Construction & Extraction (51 | 6.1%).

Natural Resources, Construction and Maintenance Occupations by Sex
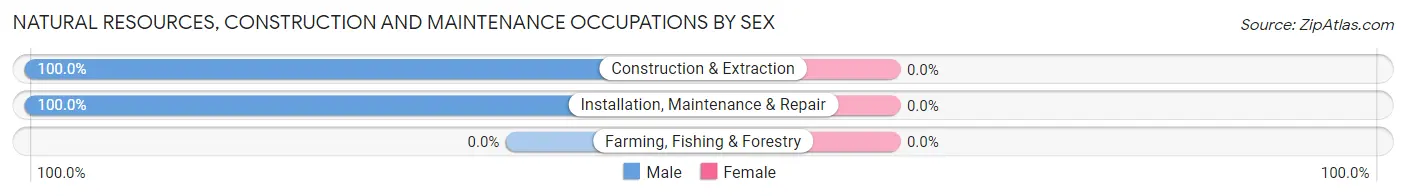
| Occupation | Male | Female |
| Farming, Fishing & Forestry | 0 (0.0%) | 0 (0.0%) |
| Construction & Extraction | 51 (100.0%) | 0 (0.0%) |
| Installation, Maintenance & Repair | 66 (100.0%) | 0 (0.0%) |
| Total (Category) | 117 (100.0%) | 0 (0.0%) |
| Total (Overall) | 409 (49.0%) | 425 (51.0%) |
Production, Transportation and Moving Occupations
The most common Production, Transportation and Moving occupations in Rehobeth are Production (59 | 7.1%), Transportation (27 | 3.2%), and Material Moving (5 | 0.6%).
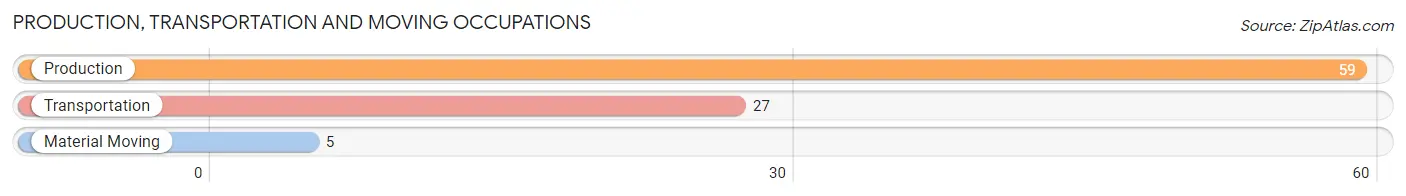
Production, Transportation and Moving Occupations by Sex
| Occupation | Male | Female |
| Production | 21 (35.6%) | 38 (64.4%) |
| Transportation | 24 (88.9%) | 3 (11.1%) |
| Material Moving | 5 (100.0%) | 0 (0.0%) |
| Total (Category) | 50 (54.9%) | 41 (45.1%) |
| Total (Overall) | 409 (49.0%) | 425 (51.0%) |
Employment Industries by Sex in Rehobeth
Employment Industries in Rehobeth
The major employment industries in Rehobeth include Health Care & Social Assistance (153 | 18.3%), Retail Trade (112 | 13.4%), Construction (88 | 10.5%), Manufacturing (88 | 10.5%), and Educational Services (84 | 10.1%).
Employment Industries by Sex in Rehobeth
The Rehobeth industries that see more men than women are Manufacturing (95.5%), Utilities (93.1%), and Construction (83.0%), whereas the industries that tend to have a higher number of women are Mining, Quarrying, & Extraction (100.0%), Real Estate, Rental & Leasing (100.0%), and Health Care & Social Assistance (85.0%).
| Industry | Male | Female |
| Agriculture, Fishing & Hunting | 0 (0.0%) | 0 (0.0%) |
| Mining, Quarrying, & Extraction | 0 (0.0%) | 6 (100.0%) |
| Construction | 73 (83.0%) | 15 (17.1%) |
| Manufacturing | 84 (95.5%) | 4 (4.5%) |
| Wholesale Trade | 10 (40.0%) | 15 (60.0%) |
| Retail Trade | 35 (31.2%) | 77 (68.8%) |
| Transportation & Warehousing | 16 (69.6%) | 7 (30.4%) |
| Utilities | 27 (93.1%) | 2 (6.9%) |
| Information | 1 (33.3%) | 2 (66.7%) |
| Finance & Insurance | 3 (20.0%) | 12 (80.0%) |
| Real Estate, Rental & Leasing | 0 (0.0%) | 2 (100.0%) |
| Professional & Scientific | 28 (51.8%) | 26 (48.1%) |
| Enterprise Management | 0 (0.0%) | 0 (0.0%) |
| Administrative & Support | 20 (47.6%) | 22 (52.4%) |
| Educational Services | 30 (35.7%) | 54 (64.3%) |
| Health Care & Social Assistance | 23 (15.0%) | 130 (85.0%) |
| Arts, Entertainment & Recreation | 11 (40.7%) | 16 (59.3%) |
| Accommodation & Food Services | 11 (37.9%) | 18 (62.1%) |
| Public Administration | 20 (74.1%) | 7 (25.9%) |
| Total | 409 (49.0%) | 425 (51.0%) |
Education in Rehobeth
School Enrollment in Rehobeth
The most common levels of schooling among the 687 students in Rehobeth are elementary school (197 | 28.7%), middle school (188 | 27.4%), and high school (110 | 16.0%).
| School Level | # Students | % Students |
| Nursery / Preschool | 36 | 5.2% |
| Kindergarten | 77 | 11.2% |
| Elementary School | 197 | 28.7% |
| Middle School | 188 | 27.4% |
| High School | 110 | 16.0% |
| College / Undergraduate | 64 | 9.3% |
| Graduate / Professional | 15 | 2.2% |
| Total | 687 | 100.0% |
School Enrollment by Age by Funding Source in Rehobeth
Out of a total of 687 students who are enrolled in schools in Rehobeth, 61 (8.9%) attend a private institution, while the remaining 626 (91.1%) are enrolled in public schools. The age group of 18 to 19 year olds has the highest likelihood of being enrolled in private schools, with 3 (50.0% in the age bracket) enrolled. Conversely, the age group of 25 to 34 year olds has the lowest likelihood of being enrolled in a private school, with 17 (100.0% in the age bracket) attending a public institution.
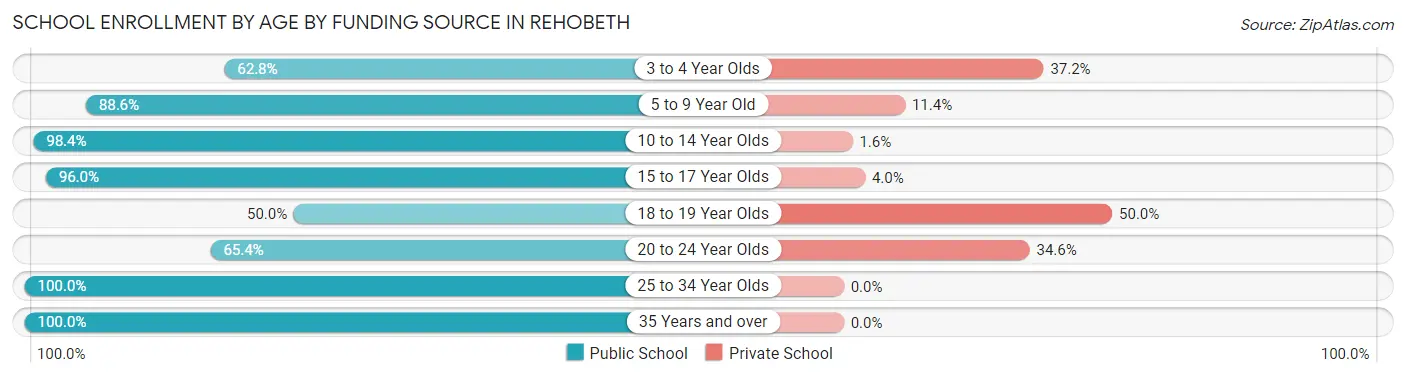
| Age Bracket | Public School | Private School |
| 3 to 4 Year Olds | 27 (62.8%) | 16 (37.2%) |
| 5 to 9 Year Old | 194 (88.6%) | 25 (11.4%) |
| 10 to 14 Year Olds | 241 (98.4%) | 4 (1.6%) |
| 15 to 17 Year Olds | 97 (96.0%) | 4 (4.0%) |
| 18 to 19 Year Olds | 3 (50.0%) | 3 (50.0%) |
| 20 to 24 Year Olds | 17 (65.4%) | 9 (34.6%) |
| 25 to 34 Year Olds | 17 (100.0%) | 0 (0.0%) |
| 35 Years and over | 30 (100.0%) | 0 (0.0%) |
| Total | 626 (91.1%) | 61 (8.9%) |
Educational Attainment by Field of Study in Rehobeth
Bio, nature & agricultural (45 | 18.8%), business (36 | 15.0%), education (29 | 12.1%), liberal arts & history (28 | 11.7%), and science & technology (22 | 9.2%) are the most common fields of study among 240 individuals in Rehobeth who have obtained a bachelor's degree or higher.
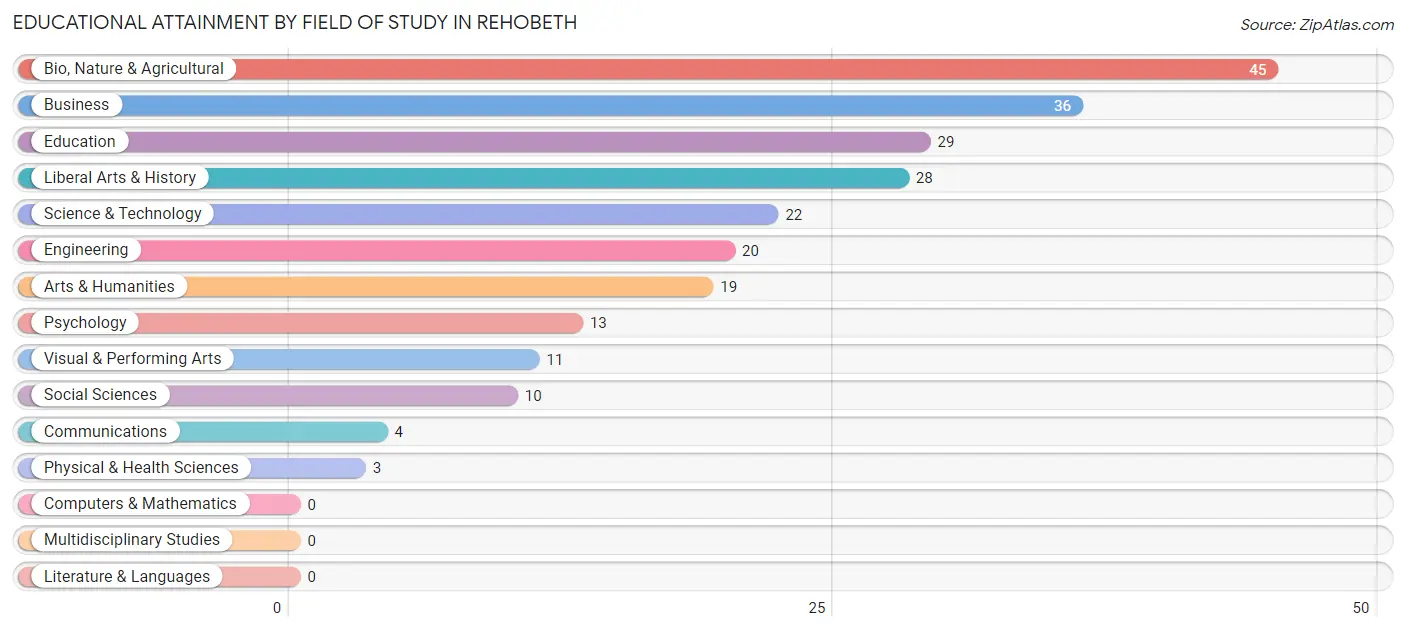
| Field of Study | # Graduates | % Graduates |
| Computers & Mathematics | 0 | 0.0% |
| Bio, Nature & Agricultural | 45 | 18.8% |
| Physical & Health Sciences | 3 | 1.3% |
| Psychology | 13 | 5.4% |
| Social Sciences | 10 | 4.2% |
| Engineering | 20 | 8.3% |
| Multidisciplinary Studies | 0 | 0.0% |
| Science & Technology | 22 | 9.2% |
| Business | 36 | 15.0% |
| Education | 29 | 12.1% |
| Literature & Languages | 0 | 0.0% |
| Liberal Arts & History | 28 | 11.7% |
| Visual & Performing Arts | 11 | 4.6% |
| Communications | 4 | 1.7% |
| Arts & Humanities | 19 | 7.9% |
| Total | 240 | 100.0% |
Transportation & Commute in Rehobeth
Vehicle Availability by Sex in Rehobeth
The most prevalent vehicle ownership categories in Rehobeth are males with 2 vehicles (173, accounting for 41.4%) and females with 2 vehicles (169, making up 41.1%).
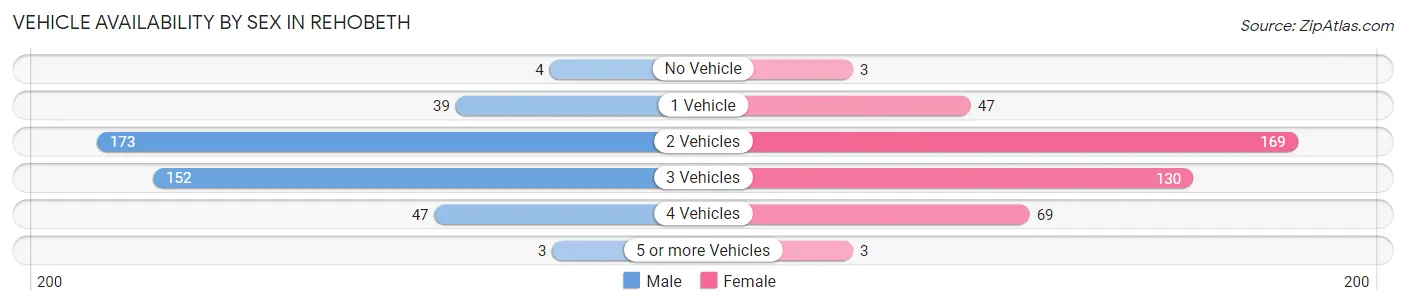
| Vehicles Available | Male | Female |
| No Vehicle | 4 (1.0%) | 3 (0.7%) |
| 1 Vehicle | 39 (9.3%) | 47 (11.2%) |
| 2 Vehicles | 173 (41.4%) | 169 (40.1%) |
| 3 Vehicles | 152 (36.4%) | 130 (30.9%) |
| 4 Vehicles | 47 (11.2%) | 69 (16.4%) |
| 5 or more Vehicles | 3 (0.7%) | 3 (0.7%) |
| Total | 418 (100.0%) | 421 (100.0%) |
Commute Time in Rehobeth
The most frequently occuring commute durations in Rehobeth are 20 to 24 minutes (235 commuters, 29.4%), 15 to 19 minutes (145 commuters, 18.2%), and 30 to 34 minutes (137 commuters, 17.2%).
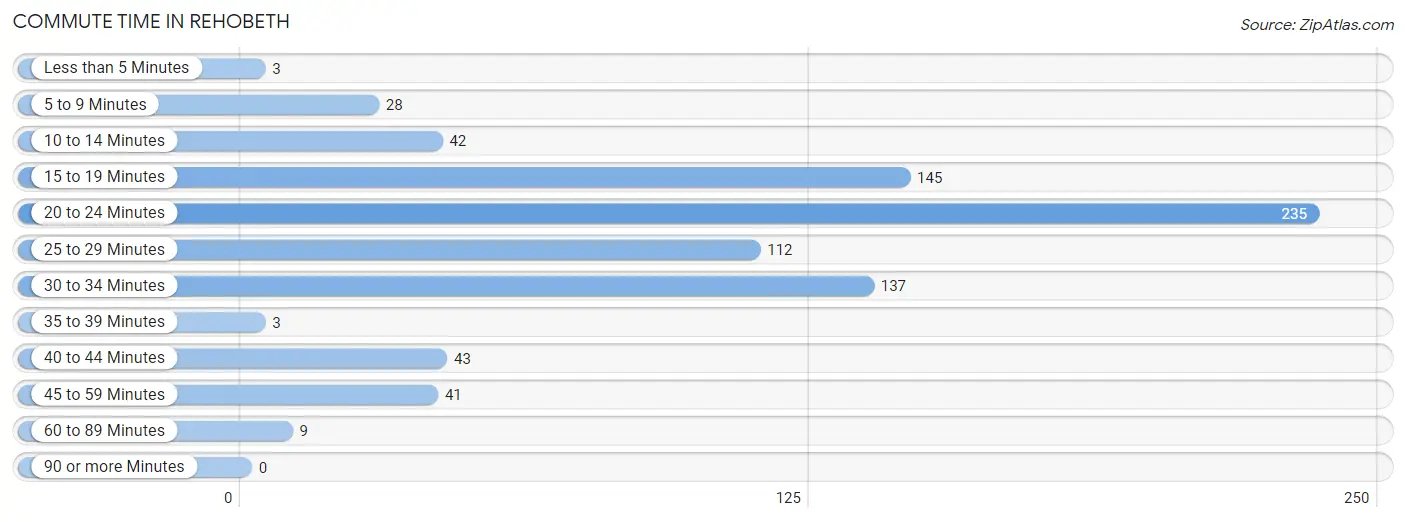
| Commute Time | # Commuters | % Commuters |
| Less than 5 Minutes | 3 | 0.4% |
| 5 to 9 Minutes | 28 | 3.5% |
| 10 to 14 Minutes | 42 | 5.3% |
| 15 to 19 Minutes | 145 | 18.2% |
| 20 to 24 Minutes | 235 | 29.4% |
| 25 to 29 Minutes | 112 | 14.0% |
| 30 to 34 Minutes | 137 | 17.2% |
| 35 to 39 Minutes | 3 | 0.4% |
| 40 to 44 Minutes | 43 | 5.4% |
| 45 to 59 Minutes | 41 | 5.1% |
| 60 to 89 Minutes | 9 | 1.1% |
| 90 or more Minutes | 0 | 0.0% |
Commute Time by Sex in Rehobeth
The most common commute times in Rehobeth are 20 to 24 minutes (107 commuters, 26.6%) for males and 20 to 24 minutes (128 commuters, 32.3%) for females.
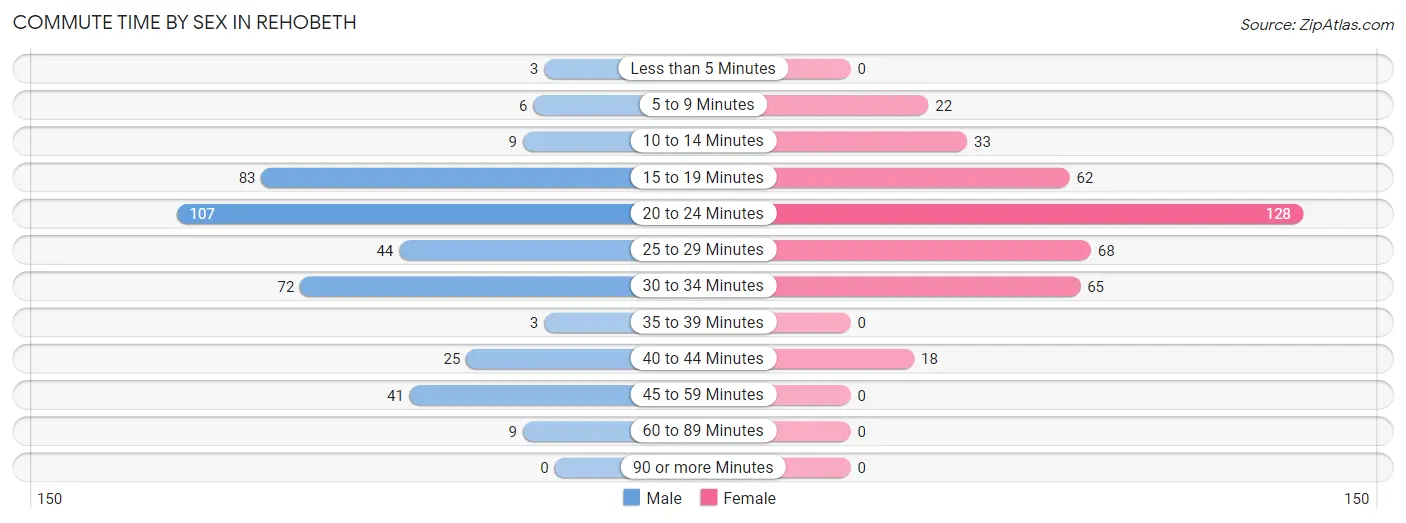
| Commute Time | Male | Female |
| Less than 5 Minutes | 3 (0.7%) | 0 (0.0%) |
| 5 to 9 Minutes | 6 (1.5%) | 22 (5.6%) |
| 10 to 14 Minutes | 9 (2.2%) | 33 (8.3%) |
| 15 to 19 Minutes | 83 (20.6%) | 62 (15.7%) |
| 20 to 24 Minutes | 107 (26.6%) | 128 (32.3%) |
| 25 to 29 Minutes | 44 (11.0%) | 68 (17.2%) |
| 30 to 34 Minutes | 72 (17.9%) | 65 (16.4%) |
| 35 to 39 Minutes | 3 (0.7%) | 0 (0.0%) |
| 40 to 44 Minutes | 25 (6.2%) | 18 (4.5%) |
| 45 to 59 Minutes | 41 (10.2%) | 0 (0.0%) |
| 60 to 89 Minutes | 9 (2.2%) | 0 (0.0%) |
| 90 or more Minutes | 0 (0.0%) | 0 (0.0%) |
Time of Departure to Work by Sex in Rehobeth
The most frequent times of departure to work in Rehobeth are 7:00 AM to 7:29 AM (82, 20.4%) for males and 7:00 AM to 7:29 AM (73, 18.4%) for females.
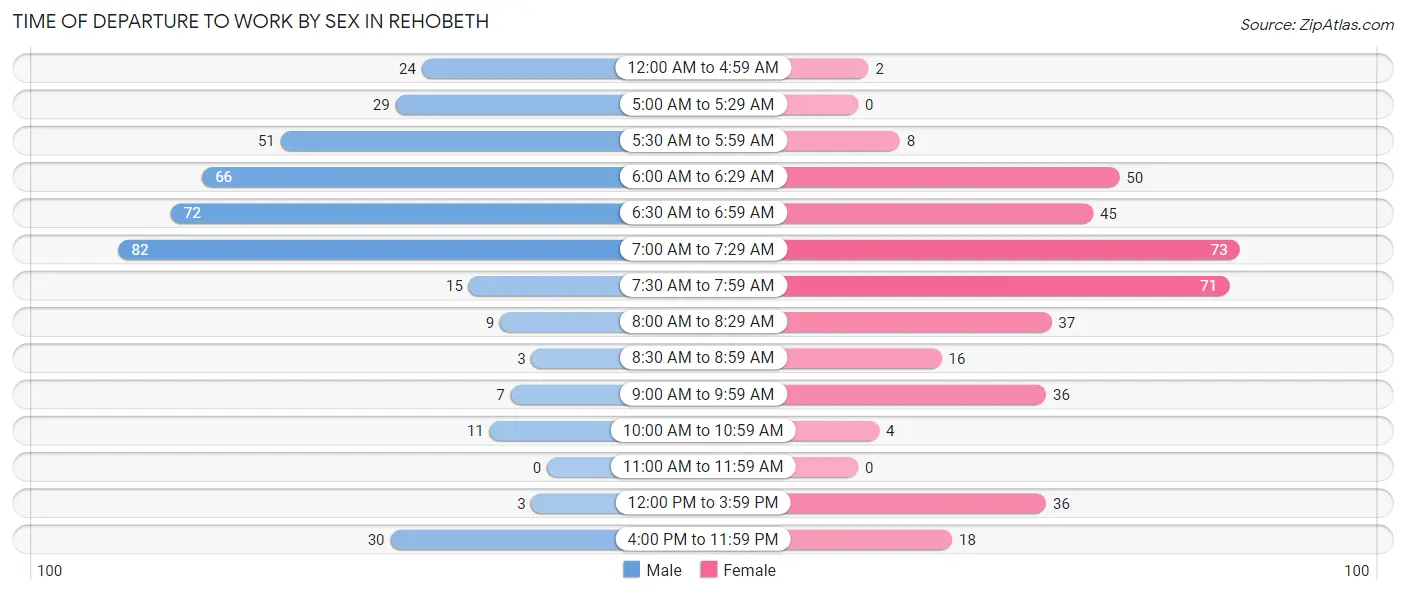
| Time of Departure | Male | Female |
| 12:00 AM to 4:59 AM | 24 (6.0%) | 2 (0.5%) |
| 5:00 AM to 5:29 AM | 29 (7.2%) | 0 (0.0%) |
| 5:30 AM to 5:59 AM | 51 (12.7%) | 8 (2.0%) |
| 6:00 AM to 6:29 AM | 66 (16.4%) | 50 (12.6%) |
| 6:30 AM to 6:59 AM | 72 (17.9%) | 45 (11.4%) |
| 7:00 AM to 7:29 AM | 82 (20.4%) | 73 (18.4%) |
| 7:30 AM to 7:59 AM | 15 (3.7%) | 71 (17.9%) |
| 8:00 AM to 8:29 AM | 9 (2.2%) | 37 (9.3%) |
| 8:30 AM to 8:59 AM | 3 (0.7%) | 16 (4.0%) |
| 9:00 AM to 9:59 AM | 7 (1.7%) | 36 (9.1%) |
| 10:00 AM to 10:59 AM | 11 (2.7%) | 4 (1.0%) |
| 11:00 AM to 11:59 AM | 0 (0.0%) | 0 (0.0%) |
| 12:00 PM to 3:59 PM | 3 (0.7%) | 36 (9.1%) |
| 4:00 PM to 11:59 PM | 30 (7.5%) | 18 (4.5%) |
| Total | 402 (100.0%) | 396 (100.0%) |
Housing Occupancy in Rehobeth
Occupancy by Ownership in Rehobeth
Of the total 617 dwellings in Rehobeth, owner-occupied units account for 528 (85.6%), while renter-occupied units make up 89 (14.4%).
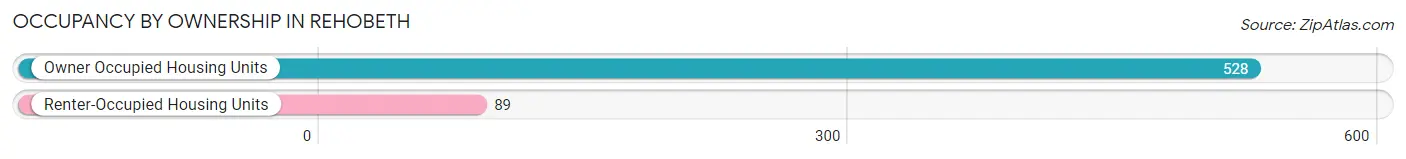
| Occupancy | # Housing Units | % Housing Units |
| Owner Occupied Housing Units | 528 | 85.6% |
| Renter-Occupied Housing Units | 89 | 14.4% |
| Total Occupied Housing Units | 617 | 100.0% |
Occupancy by Household Size in Rehobeth
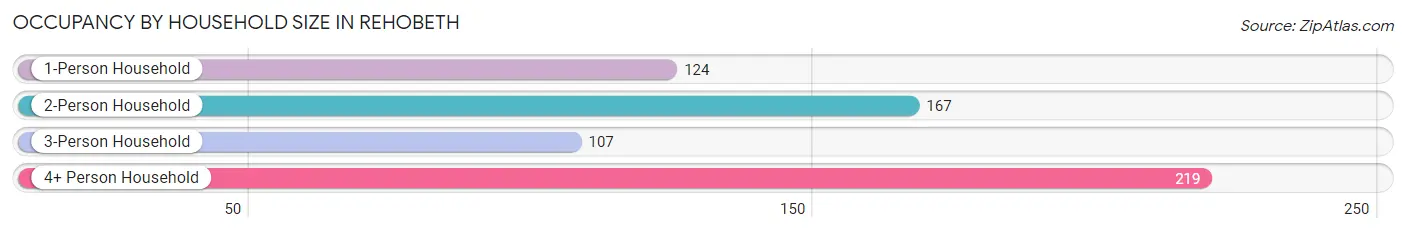
| Household Size | # Housing Units | % Housing Units |
| 1-Person Household | 124 | 20.1% |
| 2-Person Household | 167 | 27.1% |
| 3-Person Household | 107 | 17.3% |
| 4+ Person Household | 219 | 35.5% |
| Total Housing Units | 617 | 100.0% |
Occupancy by Ownership by Household Size in Rehobeth
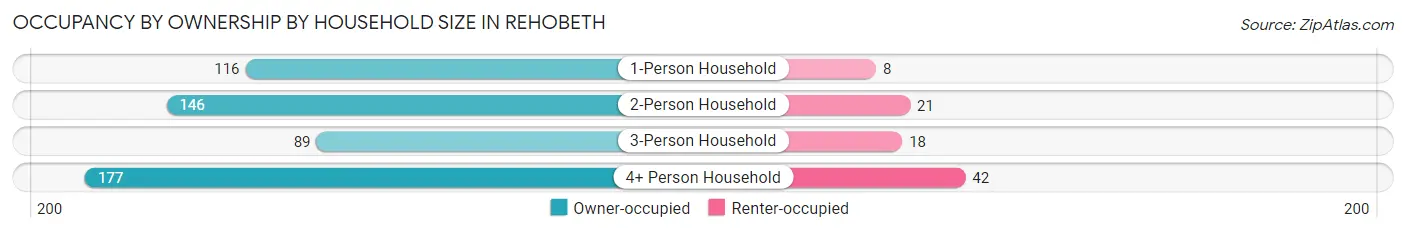
| Household Size | Owner-occupied | Renter-occupied |
| 1-Person Household | 116 (93.5%) | 8 (6.5%) |
| 2-Person Household | 146 (87.4%) | 21 (12.6%) |
| 3-Person Household | 89 (83.2%) | 18 (16.8%) |
| 4+ Person Household | 177 (80.8%) | 42 (19.2%) |
| Total Housing Units | 528 (85.6%) | 89 (14.4%) |
Occupancy by Educational Attainment in Rehobeth
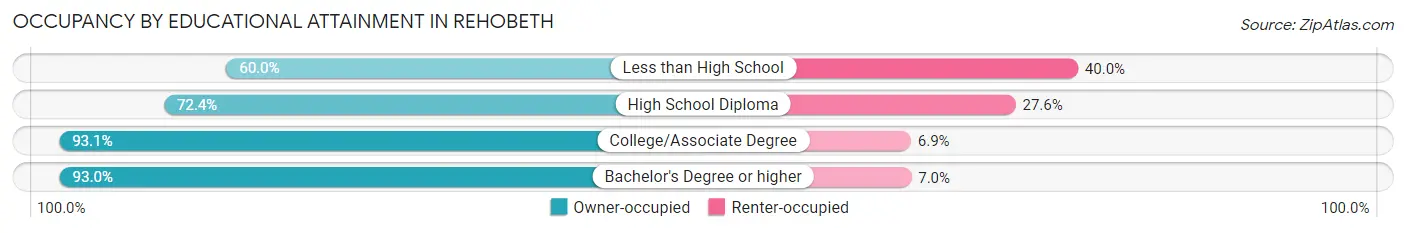
| Household Size | Owner-occupied | Renter-occupied |
| Less than High School | 27 (60.0%) | 18 (40.0%) |
| High School Diploma | 110 (72.4%) | 42 (27.6%) |
| College/Associate Degree | 244 (93.1%) | 18 (6.9%) |
| Bachelor's Degree or higher | 147 (93.0%) | 11 (7.0%) |
Occupancy by Age of Householder in Rehobeth
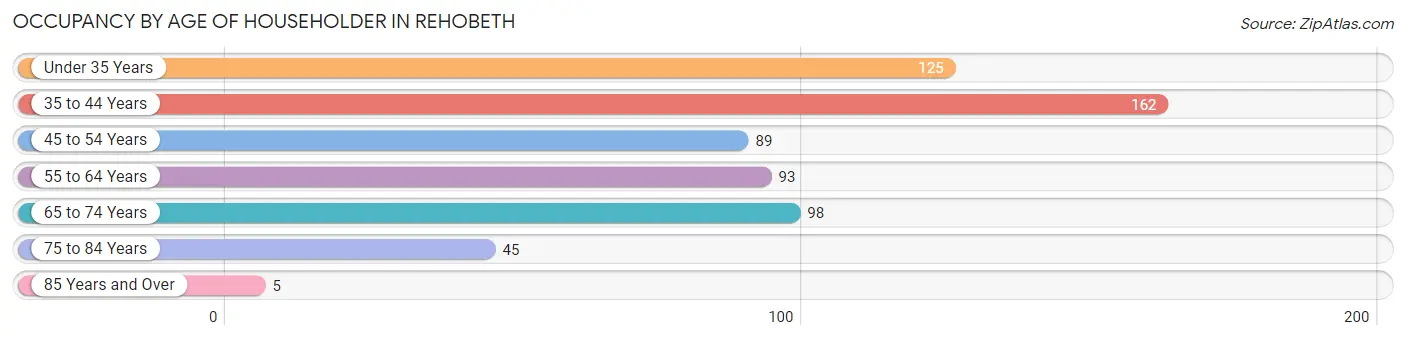
| Age Bracket | # Households | % Households |
| Under 35 Years | 125 | 20.3% |
| 35 to 44 Years | 162 | 26.3% |
| 45 to 54 Years | 89 | 14.4% |
| 55 to 64 Years | 93 | 15.1% |
| 65 to 74 Years | 98 | 15.9% |
| 75 to 84 Years | 45 | 7.3% |
| 85 Years and Over | 5 | 0.8% |
| Total | 617 | 100.0% |
Housing Finances in Rehobeth
Median Income by Occupancy in Rehobeth
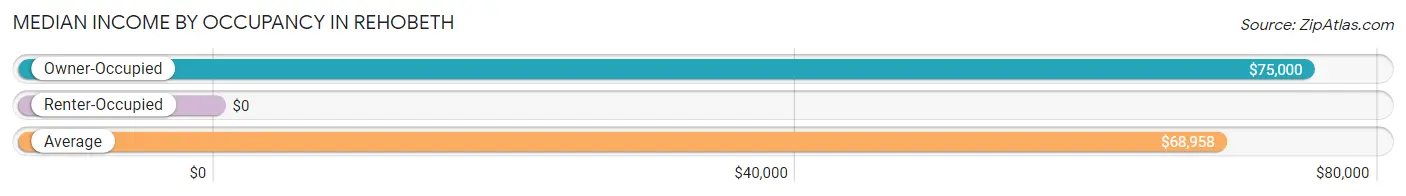
| Occupancy Type | # Households | Median Income |
| Owner-Occupied | 528 (85.6%) | $75,000 |
| Renter-Occupied | 89 (14.4%) | $0 |
| Average | 617 (100.0%) | $68,958 |
Occupancy by Householder Income Bracket in Rehobeth
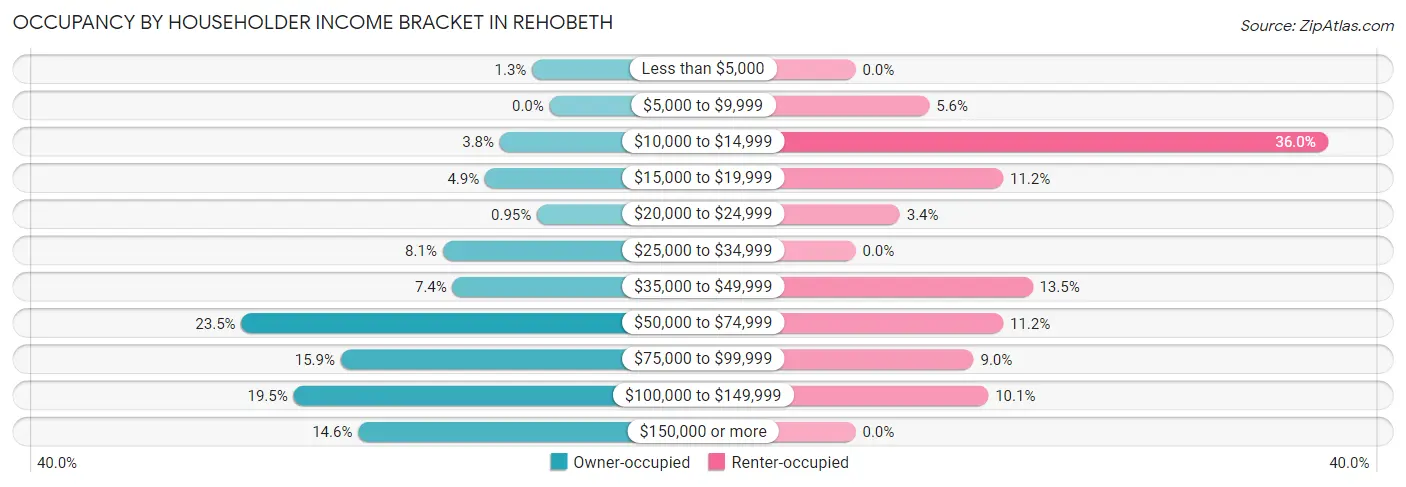
| Income Bracket | Owner-occupied | Renter-occupied |
| Less than $5,000 | 7 (1.3%) | 0 (0.0%) |
| $5,000 to $9,999 | 0 (0.0%) | 5 (5.6%) |
| $10,000 to $14,999 | 20 (3.8%) | 32 (36.0%) |
| $15,000 to $19,999 | 26 (4.9%) | 10 (11.2%) |
| $20,000 to $24,999 | 5 (0.9%) | 3 (3.4%) |
| $25,000 to $34,999 | 43 (8.1%) | 0 (0.0%) |
| $35,000 to $49,999 | 39 (7.4%) | 12 (13.5%) |
| $50,000 to $74,999 | 124 (23.5%) | 10 (11.2%) |
| $75,000 to $99,999 | 84 (15.9%) | 8 (9.0%) |
| $100,000 to $149,999 | 103 (19.5%) | 9 (10.1%) |
| $150,000 or more | 77 (14.6%) | 0 (0.0%) |
| Total | 528 (100.0%) | 89 (100.0%) |
Monthly Housing Cost Tiers in Rehobeth
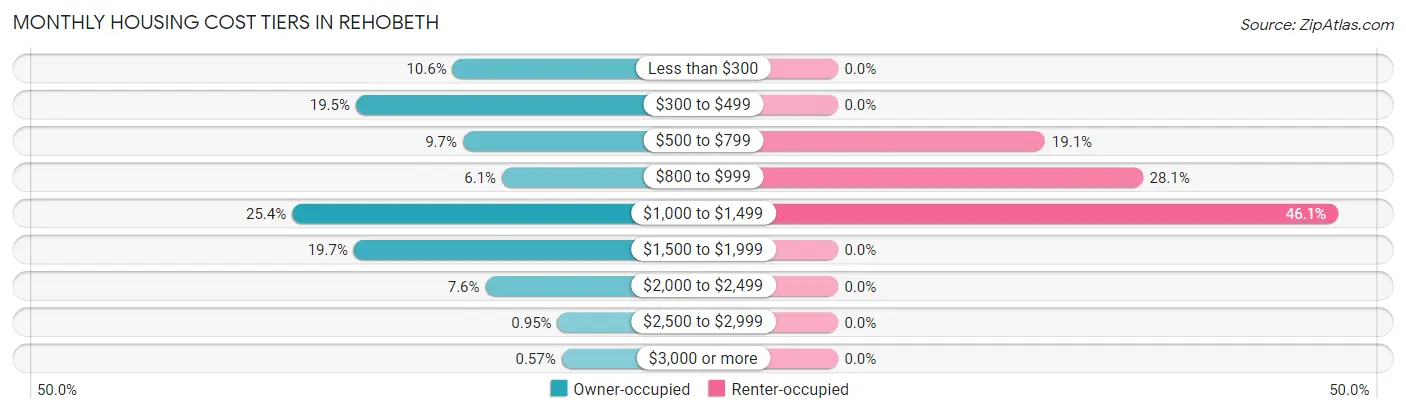
| Monthly Cost | Owner-occupied | Renter-occupied |
| Less than $300 | 56 (10.6%) | 0 (0.0%) |
| $300 to $499 | 103 (19.5%) | 0 (0.0%) |
| $500 to $799 | 51 (9.7%) | 17 (19.1%) |
| $800 to $999 | 32 (6.1%) | 25 (28.1%) |
| $1,000 to $1,499 | 134 (25.4%) | 41 (46.1%) |
| $1,500 to $1,999 | 104 (19.7%) | 0 (0.0%) |
| $2,000 to $2,499 | 40 (7.6%) | 0 (0.0%) |
| $2,500 to $2,999 | 5 (0.9%) | 0 (0.0%) |
| $3,000 or more | 3 (0.6%) | 0 (0.0%) |
| Total | 528 (100.0%) | 89 (100.0%) |
Physical Housing Characteristics in Rehobeth
Housing Structures in Rehobeth
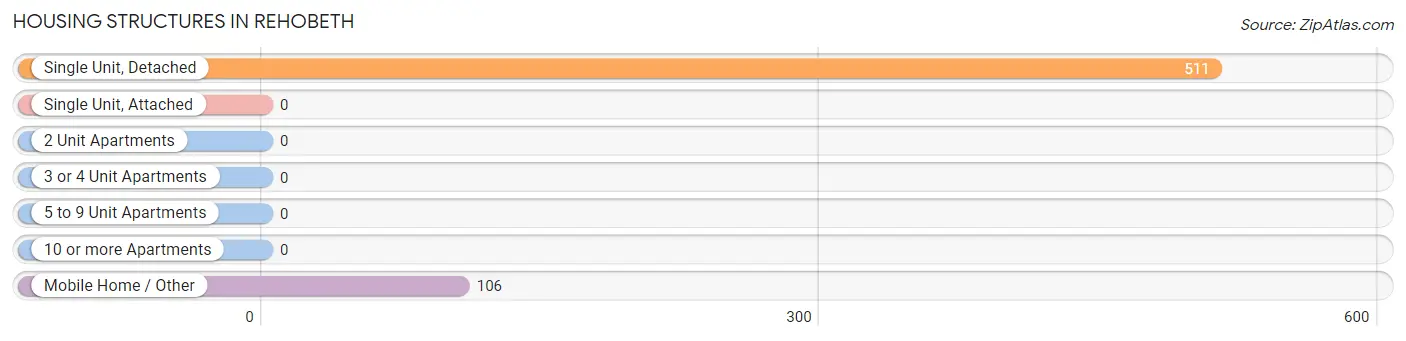
| Structure Type | # Housing Units | % Housing Units |
| Single Unit, Detached | 511 | 82.8% |
| Single Unit, Attached | 0 | 0.0% |
| 2 Unit Apartments | 0 | 0.0% |
| 3 or 4 Unit Apartments | 0 | 0.0% |
| 5 to 9 Unit Apartments | 0 | 0.0% |
| 10 or more Apartments | 0 | 0.0% |
| Mobile Home / Other | 106 | 17.2% |
| Total | 617 | 100.0% |
Housing Structures by Occupancy in Rehobeth
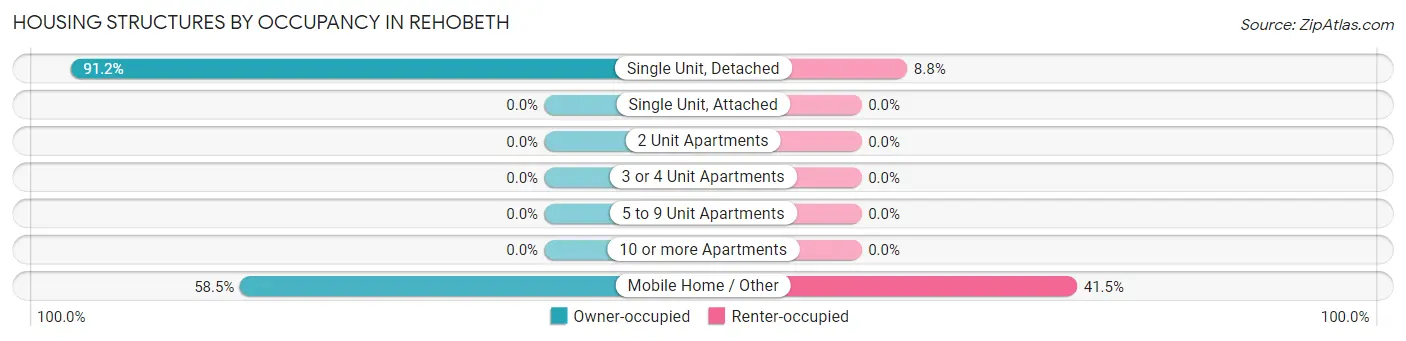
| Structure Type | Owner-occupied | Renter-occupied |
| Single Unit, Detached | 466 (91.2%) | 45 (8.8%) |
| Single Unit, Attached | 0 (0.0%) | 0 (0.0%) |
| 2 Unit Apartments | 0 (0.0%) | 0 (0.0%) |
| 3 or 4 Unit Apartments | 0 (0.0%) | 0 (0.0%) |
| 5 to 9 Unit Apartments | 0 (0.0%) | 0 (0.0%) |
| 10 or more Apartments | 0 (0.0%) | 0 (0.0%) |
| Mobile Home / Other | 62 (58.5%) | 44 (41.5%) |
| Total | 528 (85.6%) | 89 (14.4%) |
Housing Structures by Number of Rooms in Rehobeth
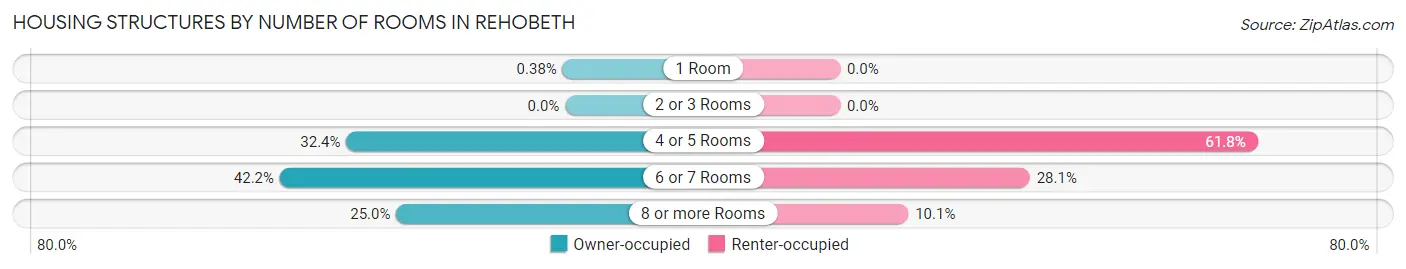
| Number of Rooms | Owner-occupied | Renter-occupied |
| 1 Room | 2 (0.4%) | 0 (0.0%) |
| 2 or 3 Rooms | 0 (0.0%) | 0 (0.0%) |
| 4 or 5 Rooms | 171 (32.4%) | 55 (61.8%) |
| 6 or 7 Rooms | 223 (42.2%) | 25 (28.1%) |
| 8 or more Rooms | 132 (25.0%) | 9 (10.1%) |
| Total | 528 (100.0%) | 89 (100.0%) |
Housing Structure by Heating Type in Rehobeth
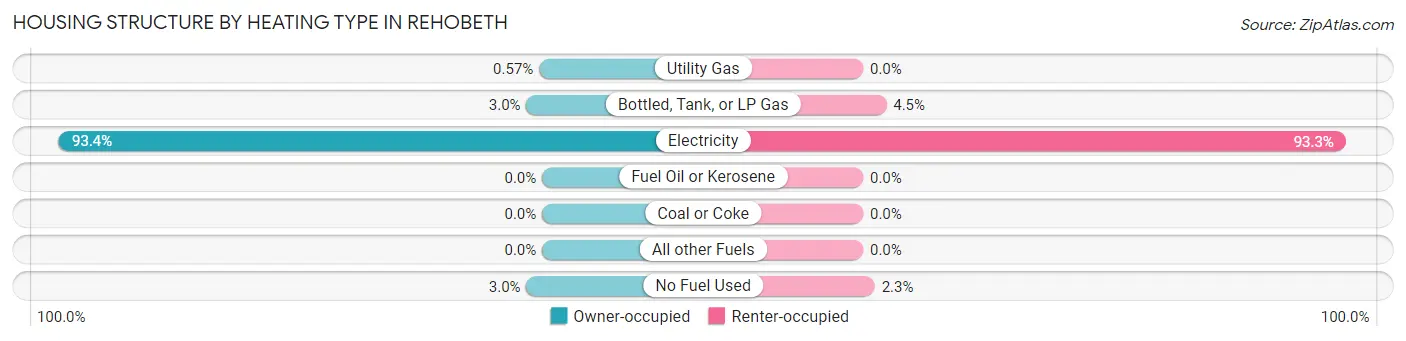
| Heating Type | Owner-occupied | Renter-occupied |
| Utility Gas | 3 (0.6%) | 0 (0.0%) |
| Bottled, Tank, or LP Gas | 16 (3.0%) | 4 (4.5%) |
| Electricity | 493 (93.4%) | 83 (93.3%) |
| Fuel Oil or Kerosene | 0 (0.0%) | 0 (0.0%) |
| Coal or Coke | 0 (0.0%) | 0 (0.0%) |
| All other Fuels | 0 (0.0%) | 0 (0.0%) |
| No Fuel Used | 16 (3.0%) | 2 (2.2%) |
| Total | 528 (100.0%) | 89 (100.0%) |
Household Vehicle Usage in Rehobeth
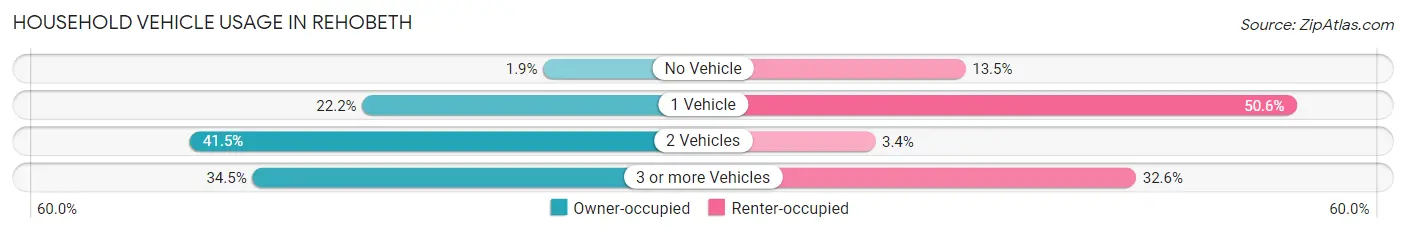
| Vehicles per Household | Owner-occupied | Renter-occupied |
| No Vehicle | 10 (1.9%) | 12 (13.5%) |
| 1 Vehicle | 117 (22.2%) | 45 (50.6%) |
| 2 Vehicles | 219 (41.5%) | 3 (3.4%) |
| 3 or more Vehicles | 182 (34.5%) | 29 (32.6%) |
| Total | 528 (100.0%) | 89 (100.0%) |
Real Estate & Mortgages in Rehobeth
Real Estate and Mortgage Overview in Rehobeth
| Characteristic | Without Mortgage | With Mortgage |
| Housing Units | 150 | 378 |
| Median Property Value | $121,200 | $214,400 |
| Median Household Income | $51,944 | $60 |
| Monthly Housing Costs | $348 | $3 |
| Real Estate Taxes | $446 | $43 |
Property Value by Mortgage Status in Rehobeth
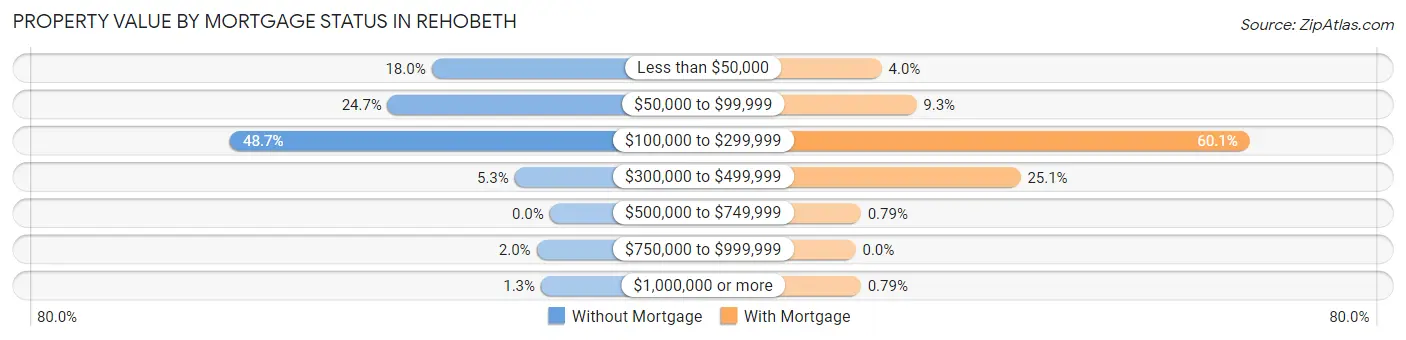
| Property Value | Without Mortgage | With Mortgage |
| Less than $50,000 | 27 (18.0%) | 15 (4.0%) |
| $50,000 to $99,999 | 37 (24.7%) | 35 (9.3%) |
| $100,000 to $299,999 | 73 (48.7%) | 227 (60.1%) |
| $300,000 to $499,999 | 8 (5.3%) | 95 (25.1%) |
| $500,000 to $749,999 | 0 (0.0%) | 3 (0.8%) |
| $750,000 to $999,999 | 3 (2.0%) | 0 (0.0%) |
| $1,000,000 or more | 2 (1.3%) | 3 (0.8%) |
| Total | 150 (100.0%) | 378 (100.0%) |
Household Income by Mortgage Status in Rehobeth
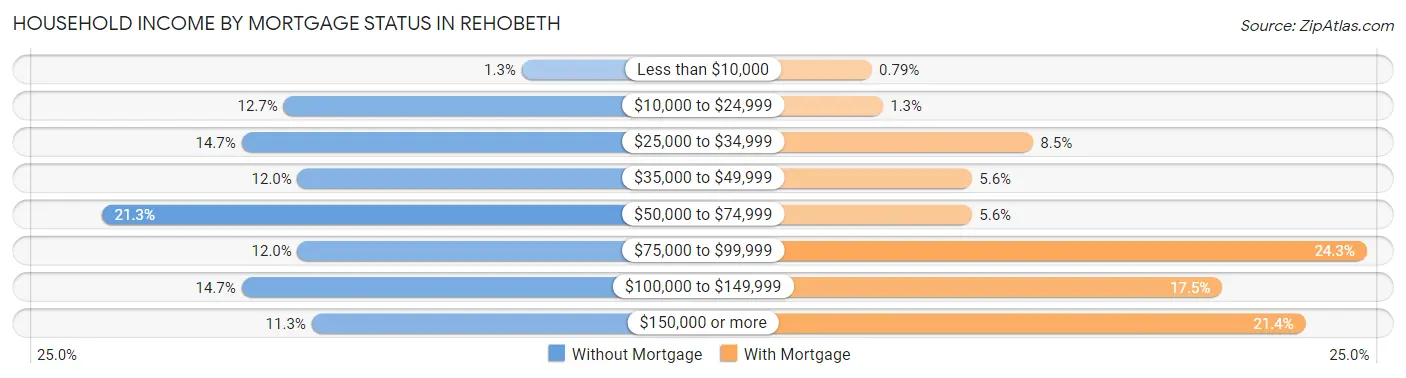
| Household Income | Without Mortgage | With Mortgage |
| Less than $10,000 | 2 (1.3%) | 3 (0.8%) |
| $10,000 to $24,999 | 19 (12.7%) | 5 (1.3%) |
| $25,000 to $34,999 | 22 (14.7%) | 32 (8.5%) |
| $35,000 to $49,999 | 18 (12.0%) | 21 (5.6%) |
| $50,000 to $74,999 | 32 (21.3%) | 21 (5.6%) |
| $75,000 to $99,999 | 18 (12.0%) | 92 (24.3%) |
| $100,000 to $149,999 | 22 (14.7%) | 66 (17.5%) |
| $150,000 or more | 17 (11.3%) | 81 (21.4%) |
| Total | 150 (100.0%) | 378 (100.0%) |
Property Value to Household Income Ratio in Rehobeth
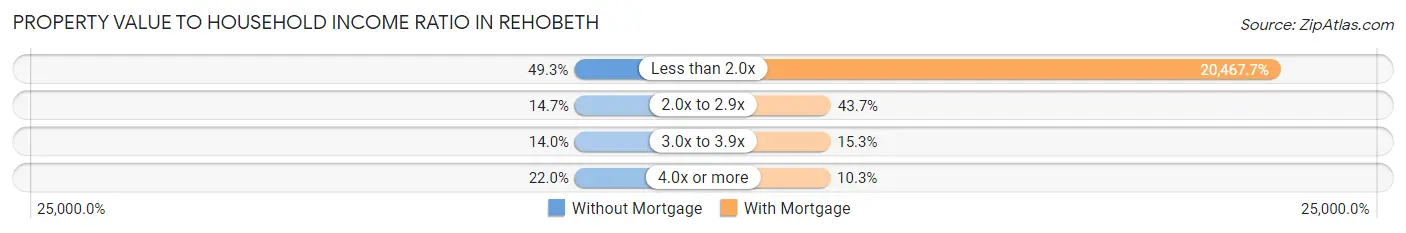
| Value-to-Income Ratio | Without Mortgage | With Mortgage |
| Less than 2.0x | 74 (49.3%) | 77,368 (20,467.7%) |
| 2.0x to 2.9x | 22 (14.7%) | 165 (43.6%) |
| 3.0x to 3.9x | 21 (14.0%) | 58 (15.3%) |
| 4.0x or more | 33 (22.0%) | 39 (10.3%) |
| Total | 150 (100.0%) | 378 (100.0%) |
Real Estate Taxes by Mortgage Status in Rehobeth
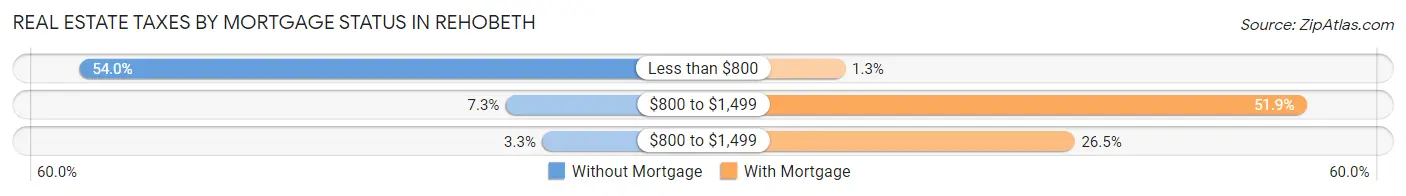
| Property Taxes | Without Mortgage | With Mortgage |
| Less than $800 | 81 (54.0%) | 5 (1.3%) |
| $800 to $1,499 | 11 (7.3%) | 196 (51.8%) |
| $800 to $1,499 | 5 (3.3%) | 100 (26.5%) |
| Total | 150 (100.0%) | 378 (100.0%) |
Health & Disability in Rehobeth
Health Insurance Coverage by Age in Rehobeth
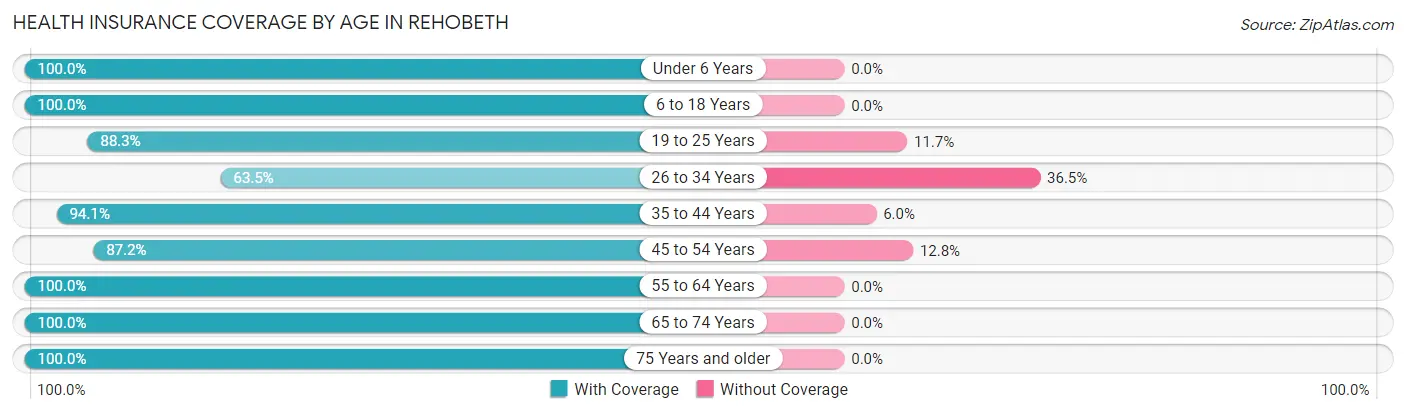
| Age Bracket | With Coverage | Without Coverage |
| Under 6 Years | 99 (100.0%) | 0 (0.0%) |
| 6 to 18 Years | 546 (100.0%) | 0 (0.0%) |
| 19 to 25 Years | 83 (88.3%) | 11 (11.7%) |
| 26 to 34 Years | 113 (63.5%) | 65 (36.5%) |
| 35 to 44 Years | 316 (94.1%) | 20 (5.9%) |
| 45 to 54 Years | 143 (87.2%) | 21 (12.8%) |
| 55 to 64 Years | 216 (100.0%) | 0 (0.0%) |
| 65 to 74 Years | 162 (100.0%) | 0 (0.0%) |
| 75 Years and older | 90 (100.0%) | 0 (0.0%) |
| Total | 1,768 (93.8%) | 117 (6.2%) |
Health Insurance Coverage by Citizenship Status in Rehobeth
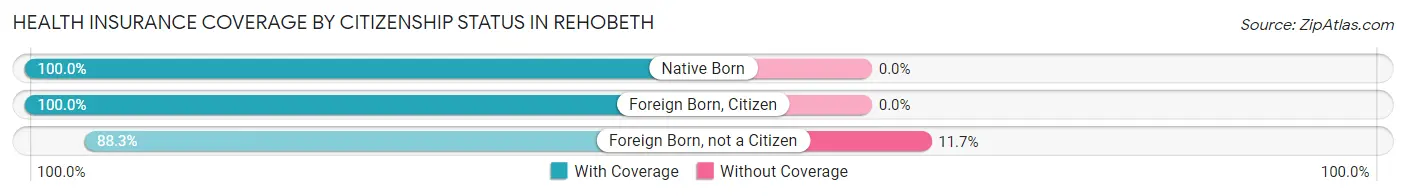
| Citizenship Status | With Coverage | Without Coverage |
| Native Born | 99 (100.0%) | 0 (0.0%) |
| Foreign Born, Citizen | 546 (100.0%) | 0 (0.0%) |
| Foreign Born, not a Citizen | 83 (88.3%) | 11 (11.7%) |
Health Insurance Coverage by Household Income in Rehobeth
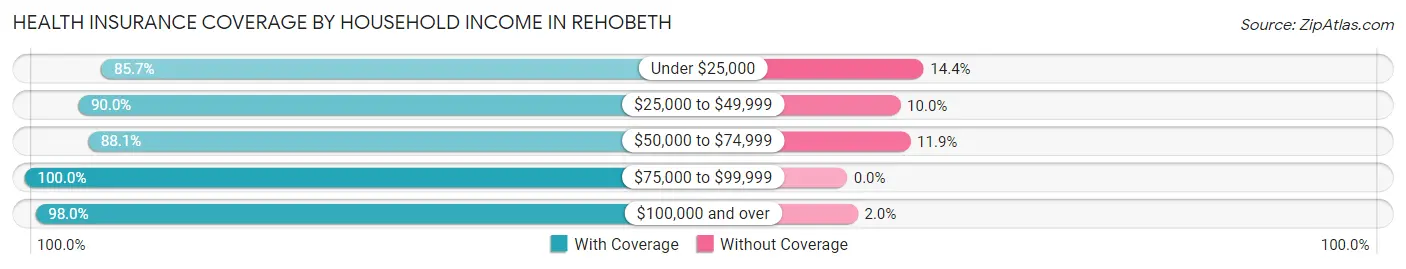
| Household Income | With Coverage | Without Coverage |
| Under $25,000 | 203 (85.7%) | 34 (14.3%) |
| $25,000 to $49,999 | 198 (90.0%) | 22 (10.0%) |
| $50,000 to $74,999 | 349 (88.1%) | 47 (11.9%) |
| $75,000 to $99,999 | 337 (100.0%) | 0 (0.0%) |
| $100,000 and over | 681 (98.0%) | 14 (2.0%) |
Public vs Private Health Insurance Coverage by Age in Rehobeth
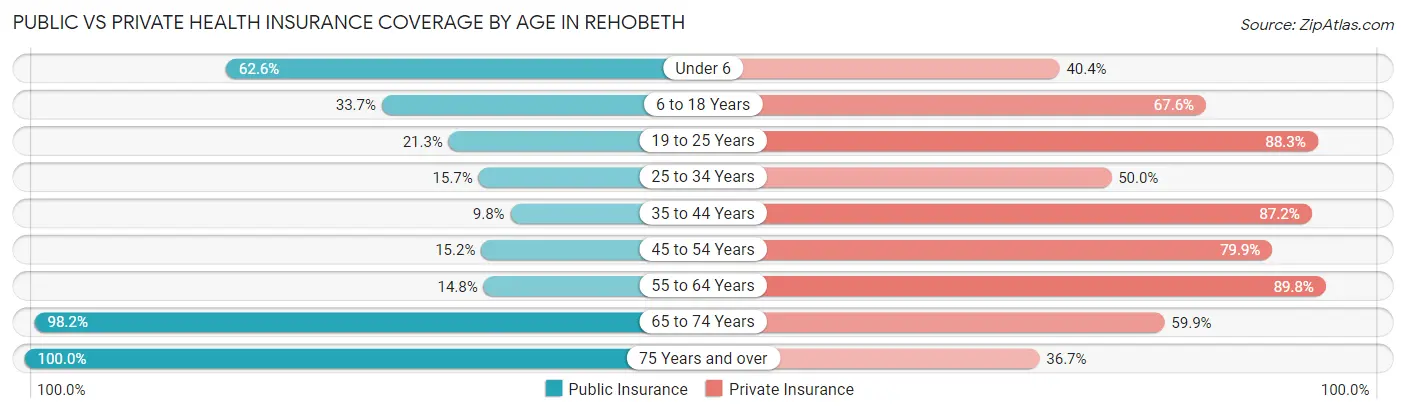
| Age Bracket | Public Insurance | Private Insurance |
| Under 6 | 62 (62.6%) | 40 (40.4%) |
| 6 to 18 Years | 184 (33.7%) | 369 (67.6%) |
| 19 to 25 Years | 20 (21.3%) | 83 (88.3%) |
| 25 to 34 Years | 28 (15.7%) | 89 (50.0%) |
| 35 to 44 Years | 33 (9.8%) | 293 (87.2%) |
| 45 to 54 Years | 25 (15.2%) | 131 (79.9%) |
| 55 to 64 Years | 32 (14.8%) | 194 (89.8%) |
| 65 to 74 Years | 159 (98.2%) | 97 (59.9%) |
| 75 Years and over | 90 (100.0%) | 33 (36.7%) |
| Total | 633 (33.6%) | 1,329 (70.5%) |
Disability Status by Sex by Age in Rehobeth
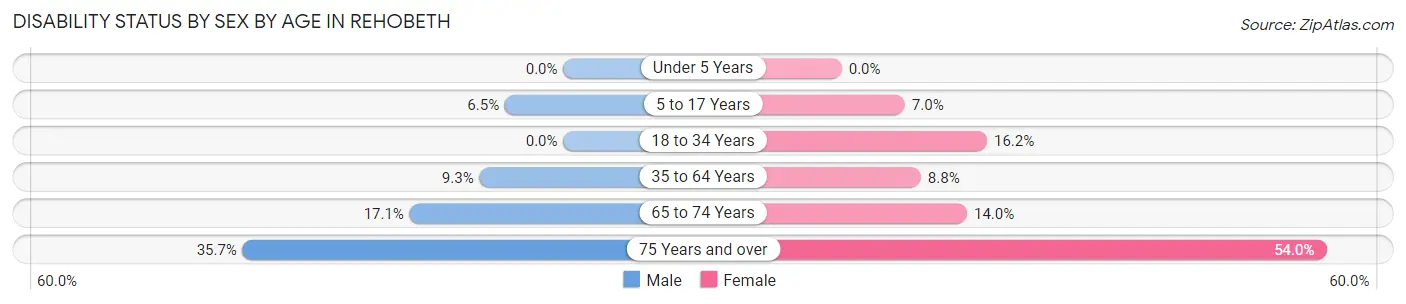
| Age Bracket | Male | Female |
| Under 5 Years | 0 (0.0%) | 0 (0.0%) |
| 5 to 17 Years | 16 (6.5%) | 23 (7.0%) |
| 18 to 34 Years | 0 (0.0%) | 28 (16.2%) |
| 35 to 64 Years | 34 (9.3%) | 31 (8.8%) |
| 65 to 74 Years | 13 (17.1%) | 12 (14.0%) |
| 75 Years and over | 5 (35.7%) | 41 (53.9%) |
Disability Class by Sex by Age in Rehobeth
Disability Class: Hearing Difficulty
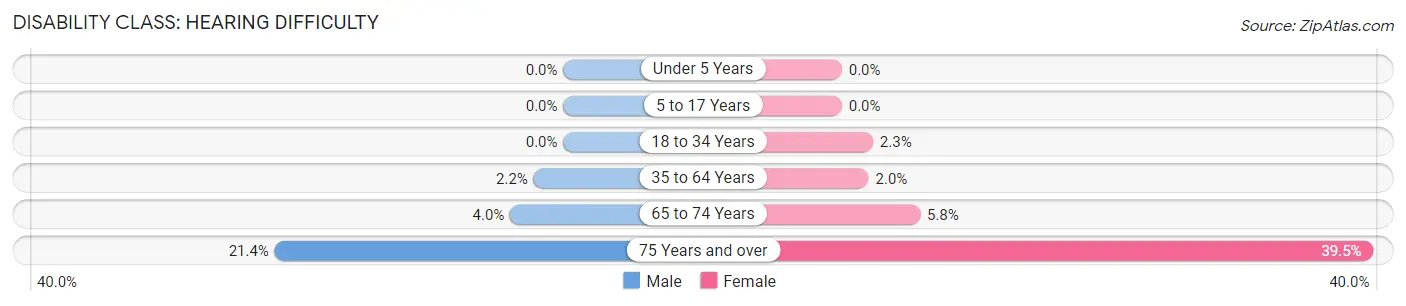
| Age Bracket | Male | Female |
| Under 5 Years | 0 (0.0%) | 0 (0.0%) |
| 5 to 17 Years | 0 (0.0%) | 0 (0.0%) |
| 18 to 34 Years | 0 (0.0%) | 4 (2.3%) |
| 35 to 64 Years | 8 (2.2%) | 7 (2.0%) |
| 65 to 74 Years | 3 (4.0%) | 5 (5.8%) |
| 75 Years and over | 3 (21.4%) | 30 (39.5%) |
Disability Class: Vision Difficulty
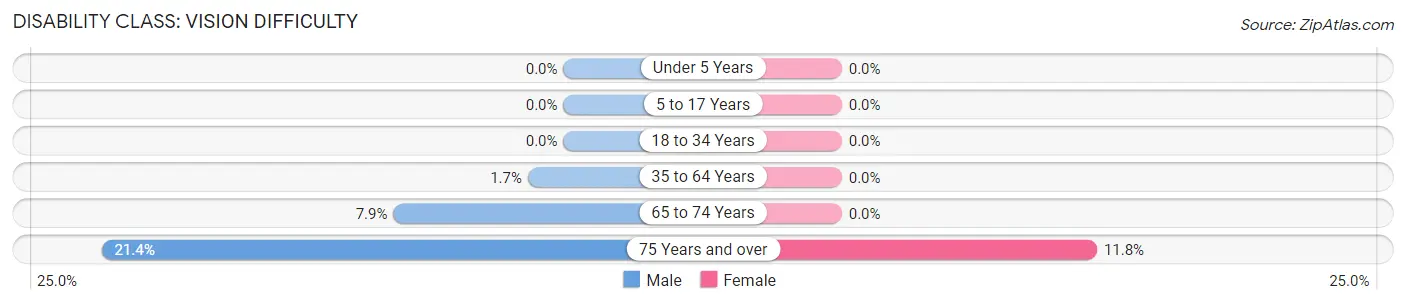
| Age Bracket | Male | Female |
| Under 5 Years | 0 (0.0%) | 0 (0.0%) |
| 5 to 17 Years | 0 (0.0%) | 0 (0.0%) |
| 18 to 34 Years | 0 (0.0%) | 0 (0.0%) |
| 35 to 64 Years | 6 (1.7%) | 0 (0.0%) |
| 65 to 74 Years | 6 (7.9%) | 0 (0.0%) |
| 75 Years and over | 3 (21.4%) | 9 (11.8%) |
Disability Class: Cognitive Difficulty
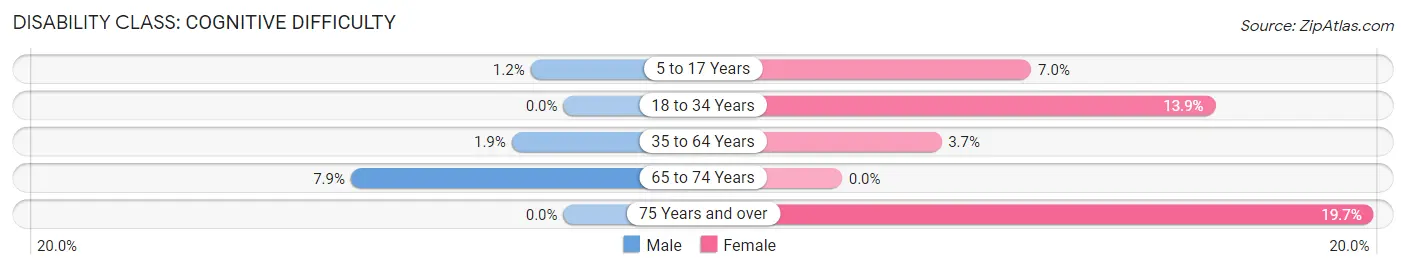
| Age Bracket | Male | Female |
| 5 to 17 Years | 3 (1.2%) | 23 (7.0%) |
| 18 to 34 Years | 0 (0.0%) | 24 (13.9%) |
| 35 to 64 Years | 7 (1.9%) | 13 (3.7%) |
| 65 to 74 Years | 6 (7.9%) | 0 (0.0%) |
| 75 Years and over | 0 (0.0%) | 15 (19.7%) |
Disability Class: Ambulatory Difficulty
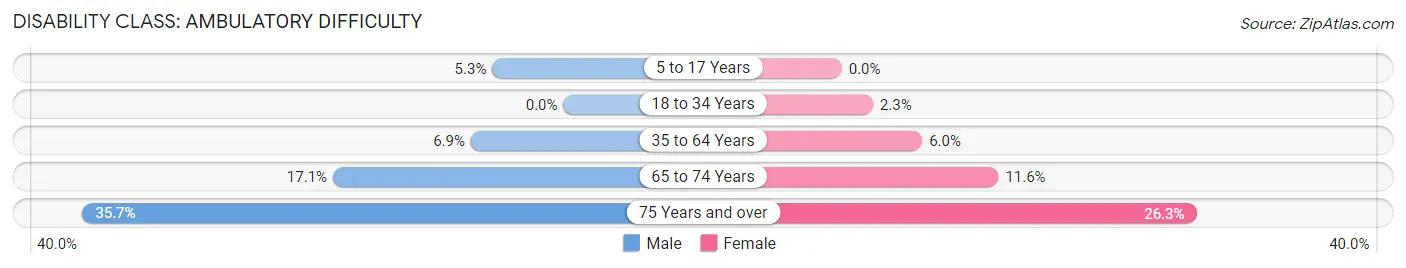
| Age Bracket | Male | Female |
| 5 to 17 Years | 13 (5.3%) | 0 (0.0%) |
| 18 to 34 Years | 0 (0.0%) | 4 (2.3%) |
| 35 to 64 Years | 25 (6.9%) | 21 (6.0%) |
| 65 to 74 Years | 13 (17.1%) | 10 (11.6%) |
| 75 Years and over | 5 (35.7%) | 20 (26.3%) |
Disability Class: Self-Care Difficulty
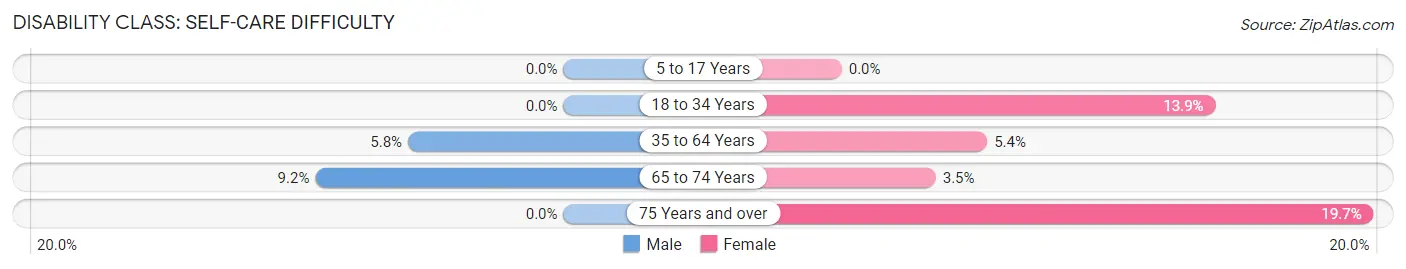
| Age Bracket | Male | Female |
| 5 to 17 Years | 0 (0.0%) | 0 (0.0%) |
| 18 to 34 Years | 0 (0.0%) | 24 (13.9%) |
| 35 to 64 Years | 21 (5.8%) | 19 (5.4%) |
| 65 to 74 Years | 7 (9.2%) | 3 (3.5%) |
| 75 Years and over | 0 (0.0%) | 15 (19.7%) |
Technology Access in Rehobeth
Computing Device Access in Rehobeth
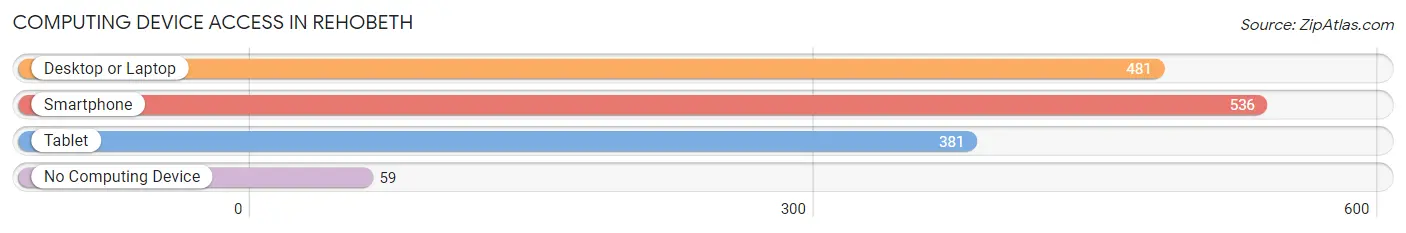
| Device Type | # Households | % Households |
| Desktop or Laptop | 481 | 78.0% |
| Smartphone | 536 | 86.9% |
| Tablet | 381 | 61.8% |
| No Computing Device | 59 | 9.6% |
| Total | 617 | 100.0% |
Internet Access in Rehobeth
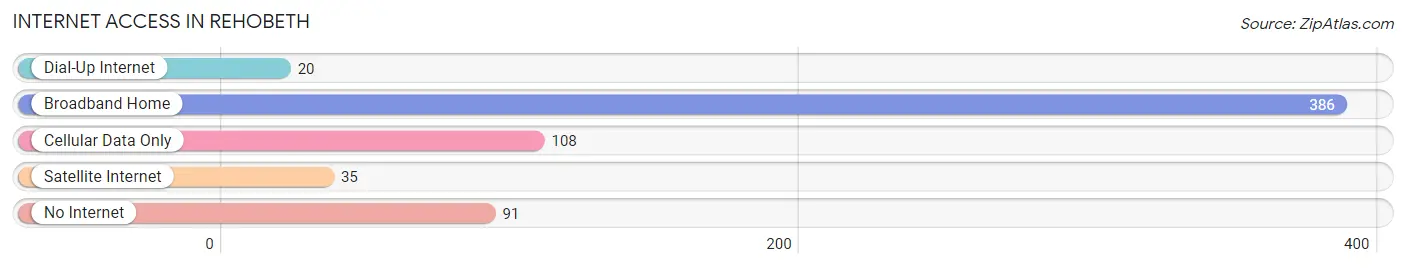
| Internet Type | # Households | % Households |
| Dial-Up Internet | 20 | 3.2% |
| Broadband Home | 386 | 62.6% |
| Cellular Data Only | 108 | 17.5% |
| Satellite Internet | 35 | 5.7% |
| No Internet | 91 | 14.7% |
| Total | 617 | 100.0% |
Rehobeth Summary
Rehobeth, Alabama is a small town located in Houston County, Alabama. It is situated on the banks of the Choctawhatchee River, and is part of the Dothan Metropolitan Statistical Area. The town has a population of approximately 1,000 people, and is known for its rural charm and friendly atmosphere.
History
Rehobeth was founded in 1837 by a group of settlers from Georgia. The town was named after the biblical city of Rehoboth, which is mentioned in the book of Genesis. The settlers were attracted to the area due to its fertile soil and abundant natural resources. The town quickly grew and became a thriving agricultural center.
In the late 19th century, Rehobeth was a major stop on the railroad line that ran from Mobile to Montgomery. This allowed the town to become a major shipping center for cotton, timber, and other goods. The town also became a popular destination for tourists, who were drawn to the area’s natural beauty and recreational opportunities.
Geography
Rehobeth is located in the southeastern corner of Houston County, Alabama. It is situated on the banks of the Choctawhatchee River, and is part of the Dothan Metropolitan Statistical Area. The town is located approximately 20 miles from the state capital of Montgomery.
The town is situated in a region of rolling hills and wooded areas. The climate is mild and humid, with average temperatures ranging from the mid-50s in the winter to the mid-80s in the summer.
Economy
Rehobeth’s economy is largely based on agriculture. The town is home to several farms, which produce a variety of crops, including cotton, corn, soybeans, and peanuts. The town is also home to several small businesses, including restaurants, retail stores, and service providers.
The town is also home to several manufacturing companies, which produce a variety of products, including furniture, clothing, and automotive parts. The town is also home to several government offices, including the Houston County Courthouse and the Houston County Sheriff’s Office.
Demographics
As of the 2010 census, Rehobeth had a population of 1,000 people. The racial makeup of the town was 79.2% White, 17.2% African American, 0.7% Native American, 0.3% Asian, and 2.6% from other races. The median household income was $31,250, and the median family income was $37,500.
Rehobeth is a small, rural town with a friendly atmosphere and a strong sense of community. The town is home to several churches, and is known for its strong religious values. The town is also home to several parks and recreational areas, which provide residents with a variety of outdoor activities.
Common Questions
What is Per Capita Income in Rehobeth?
Per Capita income in Rehobeth is $28,273.
What is the Median Family Income in Rehobeth?
Median Family Income in Rehobeth is $78,125.
What is the Median Household income in Rehobeth?
Median Household Income in Rehobeth is $68,958.
What is Income or Wage Gap in Rehobeth?
Income or Wage Gap in Rehobeth is 36.9%.
Women in Rehobeth earn 63.1 cents for every dollar earned by a man.
What is Family Income Deficit in Rehobeth?
Family Income Deficit in Rehobeth is $10,351.
Families that are below poverty line in Rehobeth earn $10,351 less on average than the poverty threshold level.
What is Inequality or Gini Index in Rehobeth?
Inequality or Gini Index in Rehobeth is 0.40.
What is the Total Population of Rehobeth?
Total Population of Rehobeth is 1,896.
What is the Total Male Population of Rehobeth?
Total Male Population of Rehobeth is 843.
What is the Total Female Population of Rehobeth?
Total Female Population of Rehobeth is 1,053.
What is the Ratio of Males per 100 Females in Rehobeth?
There are 80.06 Males per 100 Females in Rehobeth.
What is the Ratio of Females per 100 Males in Rehobeth?
There are 124.91 Females per 100 Males in Rehobeth.
What is the Median Population Age in Rehobeth?
Median Population Age in Rehobeth is 36.0 Years.
What is the Average Family Size in Rehobeth
Average Family Size in Rehobeth is 3.5 People.
What is the Average Household Size in Rehobeth
Average Household Size in Rehobeth is 3.1 People.
How Large is the Labor Force in Rehobeth?
There are 882 People in the Labor Forcein in Rehobeth.
What is the Percentage of People in the Labor Force in Rehobeth?
67.5% of People are in the Labor Force in Rehobeth.
What is the Unemployment Rate in Rehobeth?
Unemployment Rate in Rehobeth is 4.1%.