Minor, AL Map & Demographics
Minor Map
Minor Overview
$18,678
PER CAPITA INCOME
$38,929
AVG FAMILY INCOME
$29,851
AVG HOUSEHOLD INCOME
19.8%
WAGE / INCOME GAP [ % ]
80.2¢/ $1
WAGE / INCOME GAP [ $ ]
0.39
INEQUALITY / GINI INDEX
965
TOTAL POPULATION
437
MALE POPULATION
528
FEMALE POPULATION
82.77
MALES / 100 FEMALES
120.82
FEMALES / 100 MALES
31.0
MEDIAN AGE
3.1
AVG FAMILY SIZE
2.8
AVG HOUSEHOLD SIZE
408
LABOR FORCE [ PEOPLE ]
64.4%
PERCENT IN LABOR FORCE
12.0%
UNEMPLOYMENT RATE
Income in Minor
Income Overview in Minor
Per Capita Income in Minor is $18,678, while median incomes of families and households are $38,929 and $29,851 respectively.
| Characteristic | Number | Measure |
| Per Capita Income | 965 | $18,678 |
| Median Family Income | 280 | $38,929 |
| Mean Family Income | 280 | $48,998 |
| Median Household Income | 347 | $29,851 |
| Mean Household Income | 347 | $49,070 |
| Income Deficit | 280 | $0 |
| Wage / Income Gap (%) | 965 | 19.76% |
| Wage / Income Gap ($) | 965 | 80.24¢ per $1 |
| Gini / Inequality Index | 965 | 0.39 |
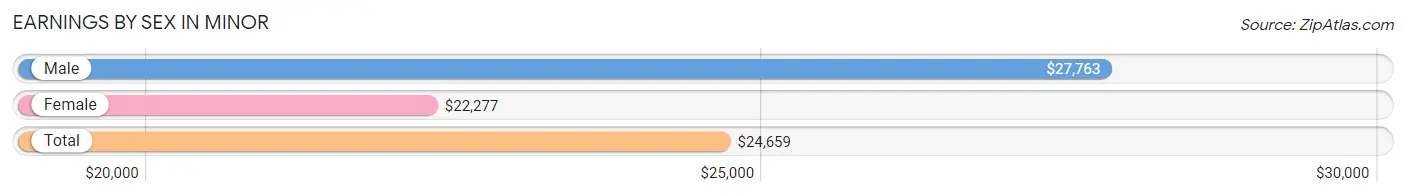
Earnings by Sex in Minor
Average Earnings in Minor are $24,659, $27,763 for men and $22,277 for women, a difference of 19.8%.
| Sex | Number | Average Earnings |
| Male | 202 (52.5%) | $27,763 |
| Female | 183 (47.5%) | $22,277 |
| Total | 385 (100.0%) | $24,659 |
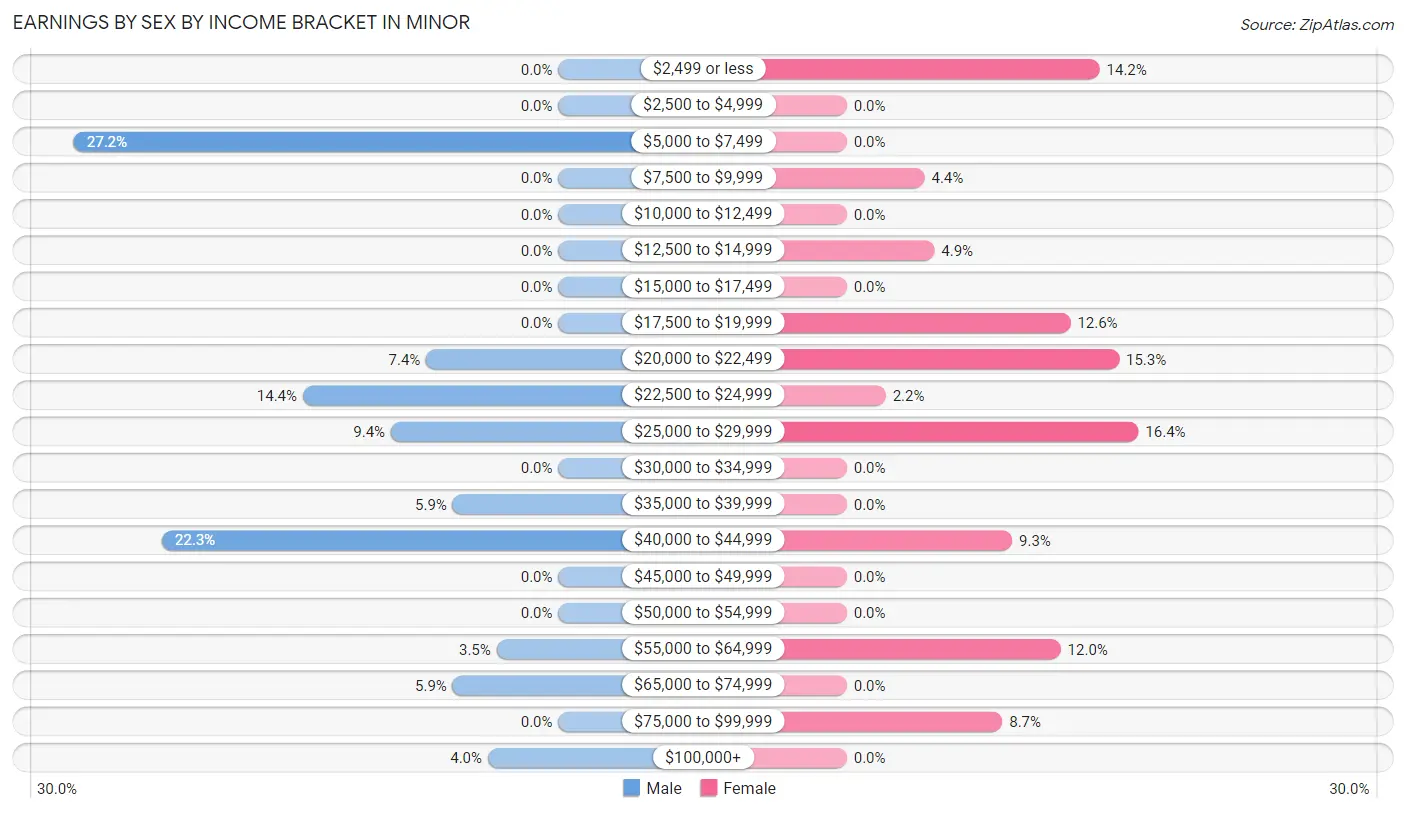
Earnings by Sex by Income Bracket in Minor
The most common earnings brackets in Minor are $5,000 to $7,499 for men (55 | 27.2%) and $25,000 to $29,999 for women (30 | 16.4%).
| Income | Male | Female |
| $2,499 or less | 0 (0.0%) | 26 (14.2%) |
| $2,500 to $4,999 | 0 (0.0%) | 0 (0.0%) |
| $5,000 to $7,499 | 55 (27.2%) | 0 (0.0%) |
| $7,500 to $9,999 | 0 (0.0%) | 8 (4.4%) |
| $10,000 to $12,499 | 0 (0.0%) | 0 (0.0%) |
| $12,500 to $14,999 | 0 (0.0%) | 9 (4.9%) |
| $15,000 to $17,499 | 0 (0.0%) | 0 (0.0%) |
| $17,500 to $19,999 | 0 (0.0%) | 23 (12.6%) |
| $20,000 to $22,499 | 15 (7.4%) | 28 (15.3%) |
| $22,500 to $24,999 | 29 (14.4%) | 4 (2.2%) |
| $25,000 to $29,999 | 19 (9.4%) | 30 (16.4%) |
| $30,000 to $34,999 | 0 (0.0%) | 0 (0.0%) |
| $35,000 to $39,999 | 12 (5.9%) | 0 (0.0%) |
| $40,000 to $44,999 | 45 (22.3%) | 17 (9.3%) |
| $45,000 to $49,999 | 0 (0.0%) | 0 (0.0%) |
| $50,000 to $54,999 | 0 (0.0%) | 0 (0.0%) |
| $55,000 to $64,999 | 7 (3.5%) | 22 (12.0%) |
| $65,000 to $74,999 | 12 (5.9%) | 0 (0.0%) |
| $75,000 to $99,999 | 0 (0.0%) | 16 (8.7%) |
| $100,000+ | 8 (4.0%) | 0 (0.0%) |
| Total | 202 (100.0%) | 183 (100.0%) |
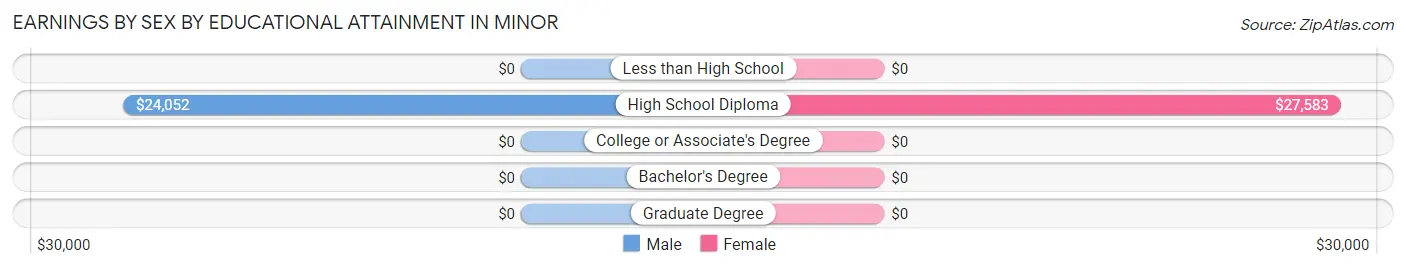
Earnings by Sex by Educational Attainment in Minor
Average earnings in Minor are $23,621 for men and $22,400 for women, a difference of 5.2%. Men with an educational attainment of high school diploma enjoy the highest average annual earnings of $24,052, while those with high school diploma education earn the least with $24,052. Women with an educational attainment of high school diploma earn the most with the average annual earnings of $27,583, while those with high school diploma education have the smallest earnings of $27,583.
| Educational Attainment | Male Income | Female Income |
| Less than High School | - | - |
| High School Diploma | $24,052 | $27,583 |
| College or Associate's Degree | - | - |
| Bachelor's Degree | - | - |
| Graduate Degree | - | - |
| Total | $23,621 | $22,400 |
Family Income in Minor
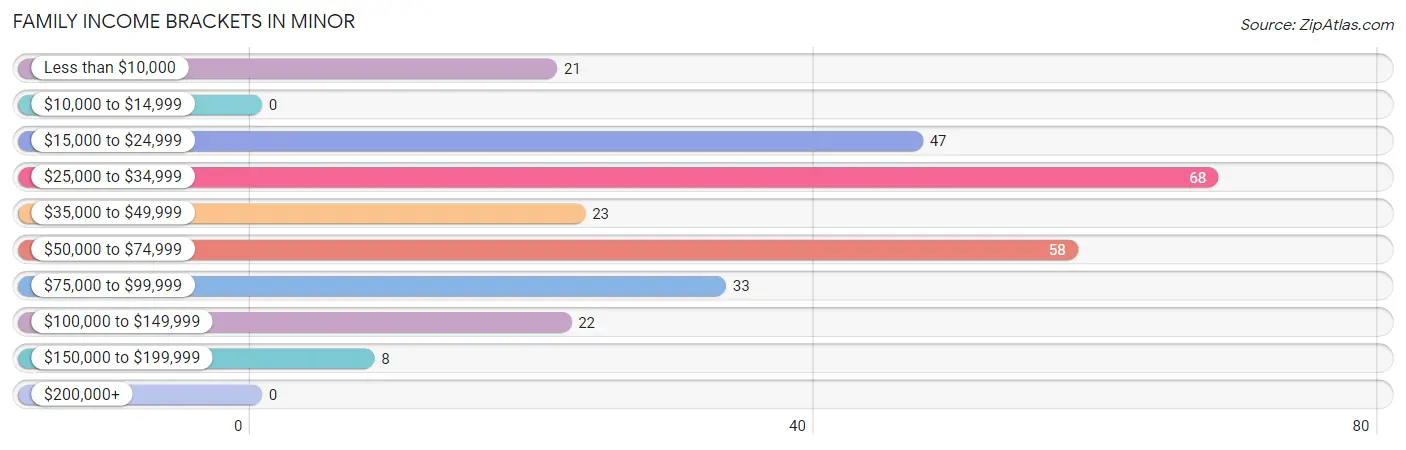
Family Income Brackets in Minor
According to the Minor family income data, there are 68 families falling into the $25,000 to $34,999 income range, which is the most common income bracket and makes up 24.3% of all families.
| Income Bracket | # Families | % Families |
| Less than $10,000 | 21 | 7.5% |
| $10,000 to $14,999 | 0 | 0.0% |
| $15,000 to $24,999 | 47 | 16.8% |
| $25,000 to $34,999 | 68 | 24.3% |
| $35,000 to $49,999 | 23 | 8.2% |
| $50,000 to $74,999 | 58 | 20.7% |
| $75,000 to $99,999 | 33 | 11.8% |
| $100,000 to $149,999 | 22 | 7.9% |
| $150,000 to $199,999 | 8 | 2.9% |
| $200,000+ | 0 | 0.0% |
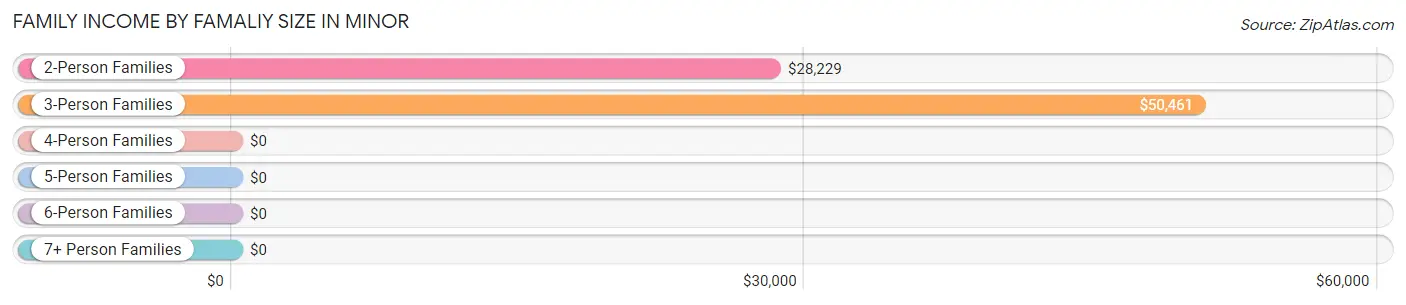
Family Income by Famaliy Size in Minor
3-person families (92 | 32.9%) account for the highest median family income in Minor with $50,461 per family, while 3-person families (92 | 32.9%) have the highest median income of $16,820 per family member.
| Income Bracket | # Families | Median Income |
| 2-Person Families | 108 (38.6%) | $28,229 |
| 3-Person Families | 92 (32.9%) | $50,461 |
| 4-Person Families | 65 (23.2%) | $0 |
| 5-Person Families | 15 (5.4%) | $0 |
| 6-Person Families | 0 (0.0%) | $0 |
| 7+ Person Families | 0 (0.0%) | $0 |
| Total | 280 (100.0%) | $38,929 |
Family Income by Number of Earners in Minor
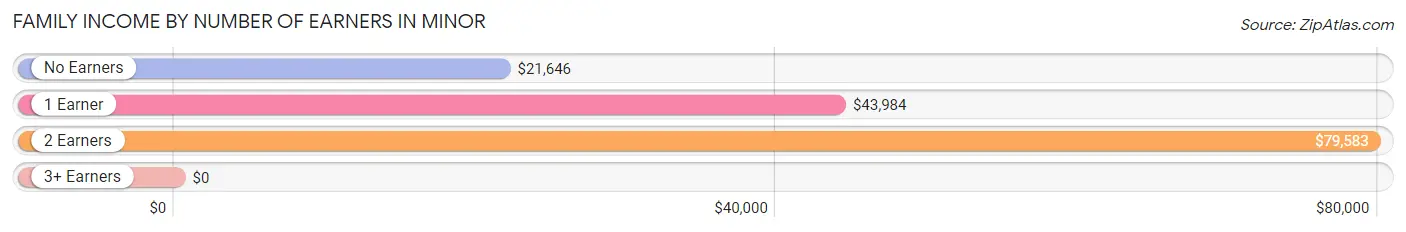
| Number of Earners | # Families | Median Income |
| No Earners | 54 (19.3%) | $21,646 |
| 1 Earner | 145 (51.8%) | $43,984 |
| 2 Earners | 75 (26.8%) | $79,583 |
| 3+ Earners | 6 (2.1%) | $0 |
| Total | 280 (100.0%) | $38,929 |
Household Income in Minor
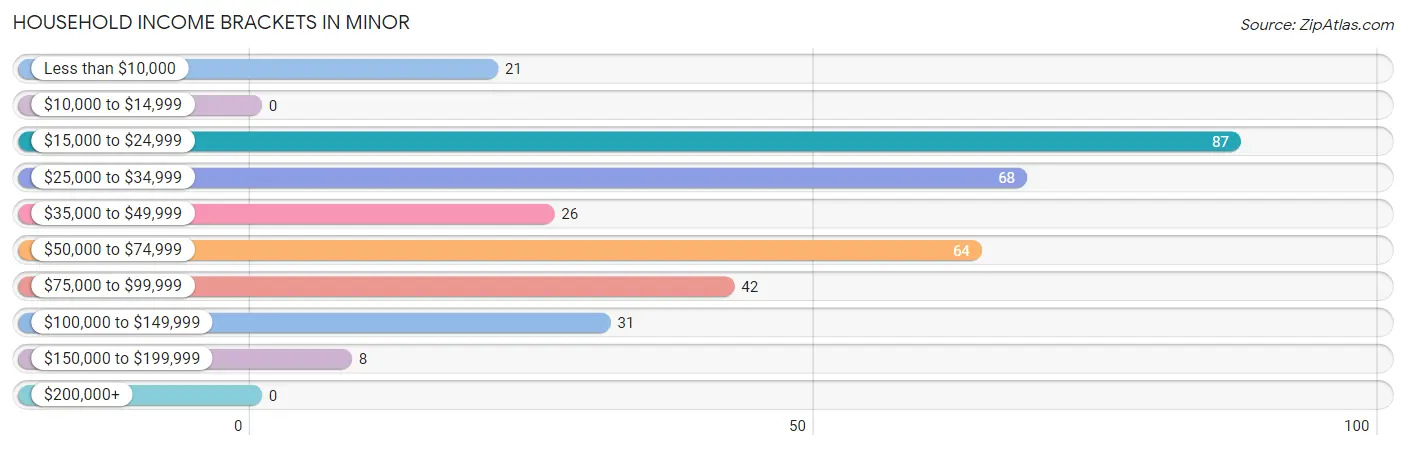
Household Income Brackets in Minor
With 87 households falling in the category, the $15,000 to $24,999 income range is the most frequent in Minor, accounting for 25.1% of all households.
| Income Bracket | # Households | % Households |
| Less than $10,000 | 21 | 6.1% |
| $10,000 to $14,999 | 0 | 0.0% |
| $15,000 to $24,999 | 87 | 25.1% |
| $25,000 to $34,999 | 68 | 19.6% |
| $35,000 to $49,999 | 26 | 7.5% |
| $50,000 to $74,999 | 64 | 18.4% |
| $75,000 to $99,999 | 42 | 12.1% |
| $100,000 to $149,999 | 31 | 8.9% |
| $150,000 to $199,999 | 8 | 2.3% |
| $200,000+ | 0 | 0.0% |
Household Income by Householder Age in Minor
The median household income in Minor is $29,851, with the highest median household income of $62,308 found in the 45 to 64 years age bracket for the primary householder. A total of 66 households (19.0%) fall into this category. Meanwhile, the 15 to 24 years age bracket for the primary householder has the lowest median household income of $0, with 16 households (4.6%) in this group.
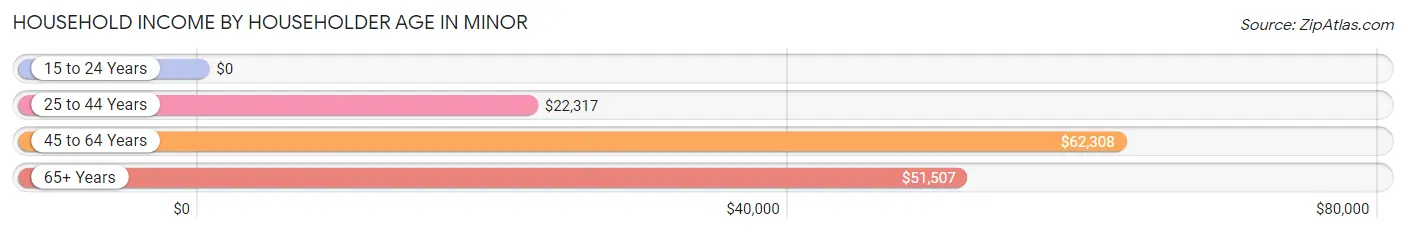
| Income Bracket | # Households | Median Income |
| 15 to 24 Years | 16 (4.6%) | $0 |
| 25 to 44 Years | 164 (47.3%) | $22,317 |
| 45 to 64 Years | 66 (19.0%) | $62,308 |
| 65+ Years | 101 (29.1%) | $51,507 |
| Total | 347 (100.0%) | $29,851 |
Poverty in Minor
Income Below Poverty by Sex and Age in Minor
With 16.7% poverty level for males and 17.8% for females among the residents of Minor, 35 to 44 year old males and 16 and 17 year old females are the most vulnerable to poverty, with 46 males (100.0%) and 21 females (87.5%) in their respective age groups living below the poverty level.
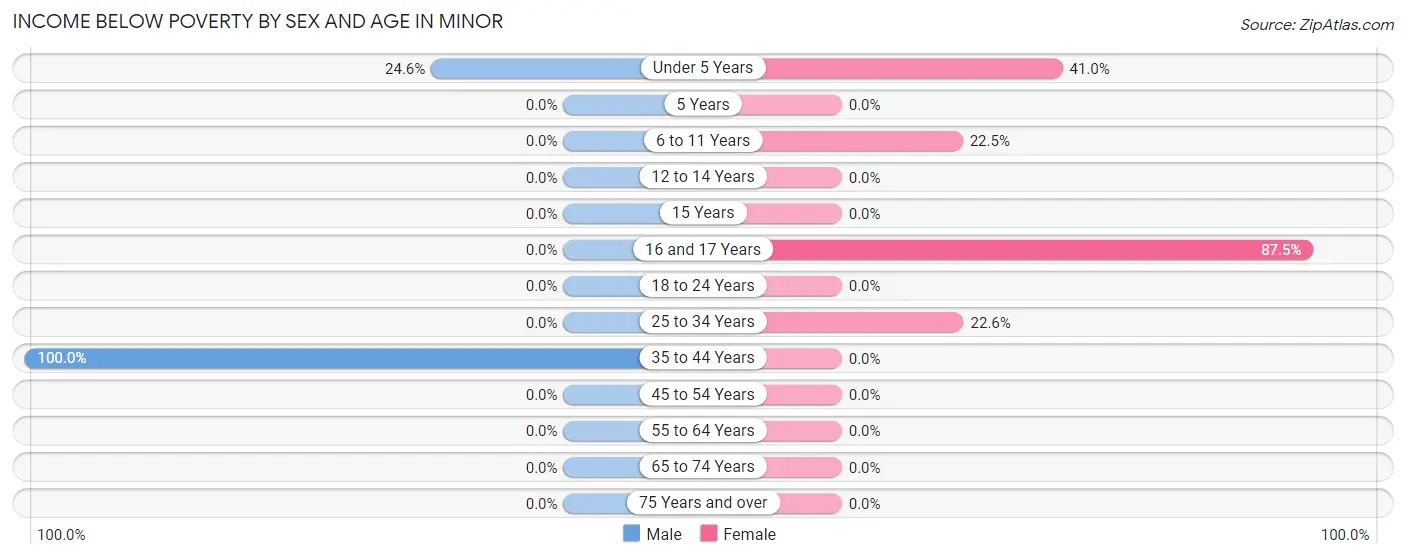
| Age Bracket | Male | Female |
| Under 5 Years | 27 (24.5%) | 25 (41.0%) |
| 5 Years | 0 (0.0%) | 0 (0.0%) |
| 6 to 11 Years | 0 (0.0%) | 22 (22.5%) |
| 12 to 14 Years | 0 (0.0%) | 0 (0.0%) |
| 15 Years | 0 (0.0%) | 0 (0.0%) |
| 16 and 17 Years | 0 (0.0%) | 21 (87.5%) |
| 18 to 24 Years | 0 (0.0%) | 0 (0.0%) |
| 25 to 34 Years | 0 (0.0%) | 26 (22.6%) |
| 35 to 44 Years | 46 (100.0%) | 0 (0.0%) |
| 45 to 54 Years | 0 (0.0%) | 0 (0.0%) |
| 55 to 64 Years | 0 (0.0%) | 0 (0.0%) |
| 65 to 74 Years | 0 (0.0%) | 0 (0.0%) |
| 75 Years and over | 0 (0.0%) | 0 (0.0%) |
| Total | 73 (16.7%) | 94 (17.8%) |
Income Above Poverty by Sex and Age in Minor
According to the poverty statistics in Minor, males aged 5 years and females aged 5 years are the age groups that are most secure financially, with 100.0% of males and 100.0% of females in these age groups living above the poverty line.
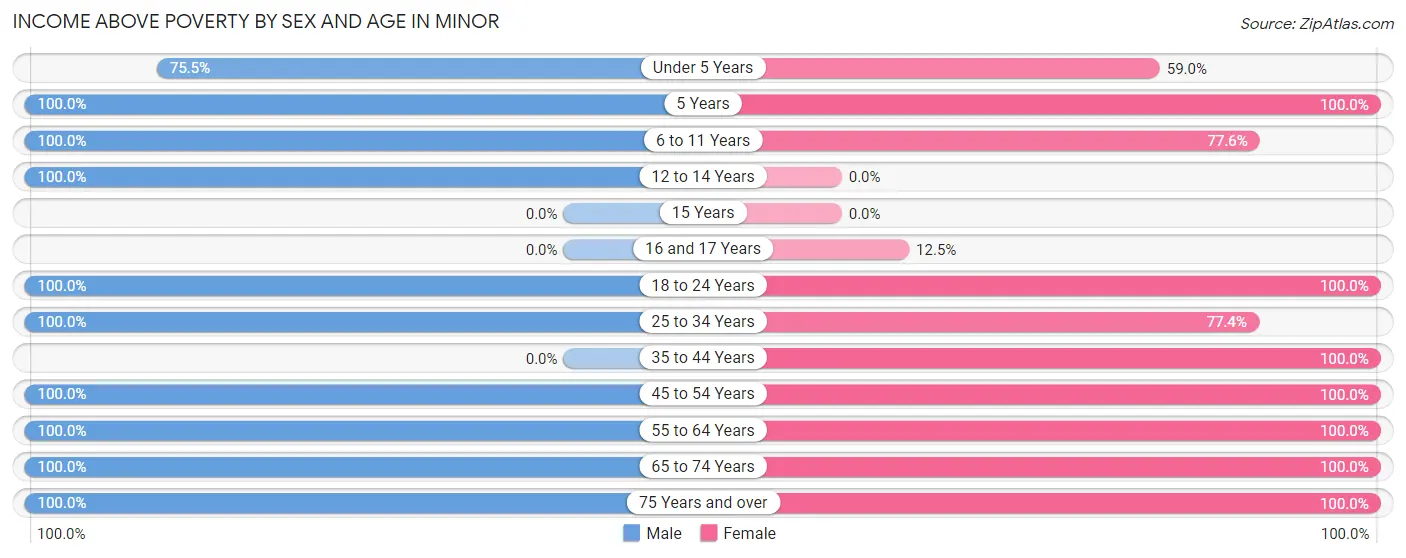
| Age Bracket | Male | Female |
| Under 5 Years | 83 (75.4%) | 36 (59.0%) |
| 5 Years | 36 (100.0%) | 9 (100.0%) |
| 6 to 11 Years | 9 (100.0%) | 76 (77.5%) |
| 12 to 14 Years | 8 (100.0%) | 0 (0.0%) |
| 15 Years | 0 (0.0%) | 0 (0.0%) |
| 16 and 17 Years | 0 (0.0%) | 3 (12.5%) |
| 18 to 24 Years | 36 (100.0%) | 32 (100.0%) |
| 25 to 34 Years | 49 (100.0%) | 89 (77.4%) |
| 35 to 44 Years | 0 (0.0%) | 70 (100.0%) |
| 45 to 54 Years | 49 (100.0%) | 32 (100.0%) |
| 55 to 64 Years | 30 (100.0%) | 43 (100.0%) |
| 65 to 74 Years | 57 (100.0%) | 9 (100.0%) |
| 75 Years and over | 7 (100.0%) | 35 (100.0%) |
| Total | 364 (83.3%) | 434 (82.2%) |
Income Below Poverty Among Married-Couple Families in Minor
The poverty statistics for married-couple families in Minor show that 19.1% or 26 of the total 136 families live below the poverty line. Families with 1 or 2 children have the highest poverty rate of 29.5%, comprising of 26 families. On the other hand, families with no children have the lowest poverty rate of 0.0%, which includes 0 families.
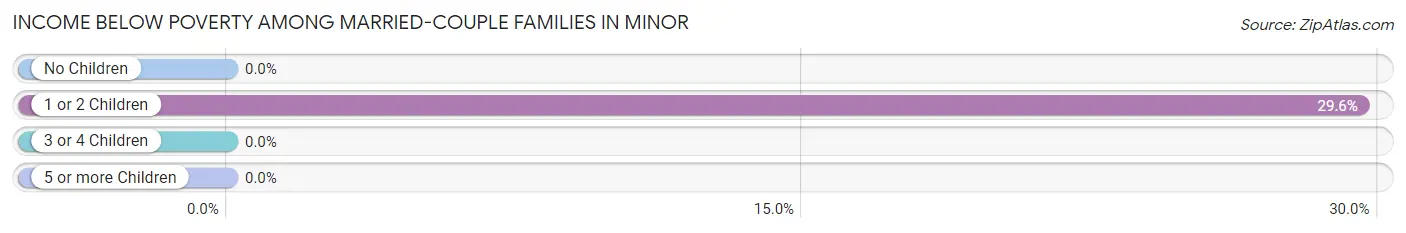
| Children | Above Poverty | Below Poverty |
| No Children | 39 (100.0%) | 0 (0.0%) |
| 1 or 2 Children | 62 (70.5%) | 26 (29.5%) |
| 3 or 4 Children | 9 (100.0%) | 0 (0.0%) |
| 5 or more Children | 0 (0.0%) | 0 (0.0%) |
| Total | 110 (80.9%) | 26 (19.1%) |
Income Below Poverty Among Single-Parent Households in Minor
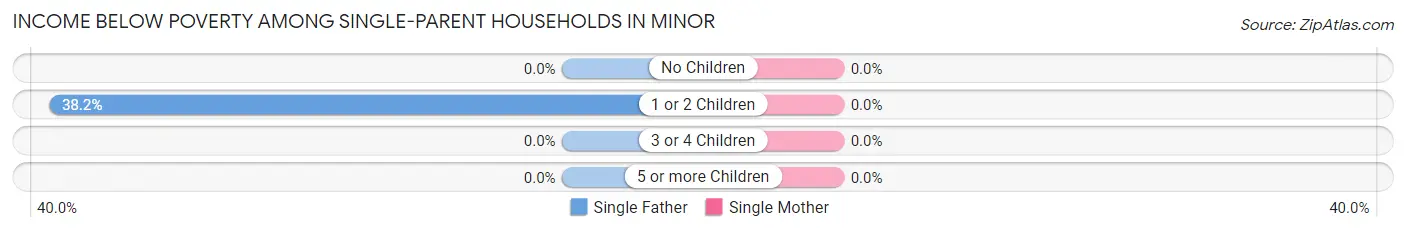
| Children | Single Father | Single Mother |
| No Children | 0 (0.0%) | 0 (0.0%) |
| 1 or 2 Children | 21 (38.2%) | 0 (0.0%) |
| 3 or 4 Children | 0 (0.0%) | 0 (0.0%) |
| 5 or more Children | 0 (0.0%) | 0 (0.0%) |
| Total | 21 (38.2%) | 0 (0.0%) |
Income Below Poverty Among Married-Couple vs Single-Parent Households in Minor
The poverty data for Minor shows that 26 of the married-couple family households (19.1%) and 21 of the single-parent households (14.6%) are living below the poverty level. Within the married-couple family households, those with 1 or 2 children have the highest poverty rate, with 26 households (29.5%) falling below the poverty line. Among the single-parent households, those with 1 or 2 children have the highest poverty rate, with 21 household (17.5%) living below poverty.
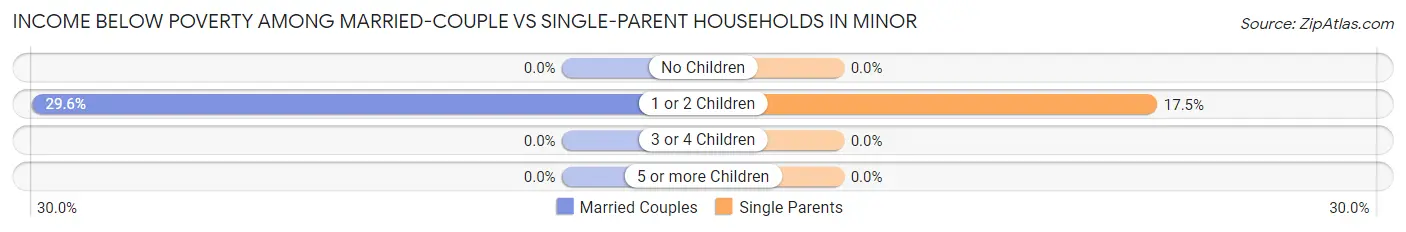
| Children | Married-Couple Families | Single-Parent Households |
| No Children | 0 (0.0%) | 0 (0.0%) |
| 1 or 2 Children | 26 (29.5%) | 21 (17.5%) |
| 3 or 4 Children | 0 (0.0%) | 0 (0.0%) |
| 5 or more Children | 0 (0.0%) | 0 (0.0%) |
| Total | 26 (19.1%) | 21 (14.6%) |
Race in Minor
The most populous races in Minor are White / Caucasian (622 | 64.5%), Black / African American (234 | 24.2%), and Two or more Races (62 | 6.4%).
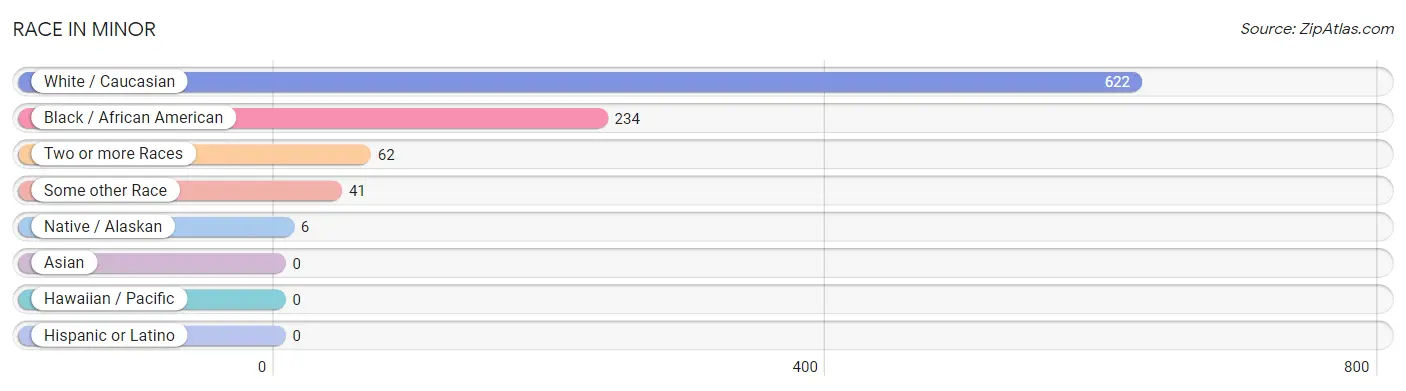
| Race | # Population | % Population |
| Asian | 0 | 0.0% |
| Black / African American | 234 | 24.2% |
| Hawaiian / Pacific | 0 | 0.0% |
| Hispanic or Latino | 0 | 0.0% |
| Native / Alaskan | 6 | 0.6% |
| White / Caucasian | 622 | 64.5% |
| Two or more Races | 62 | 6.4% |
| Some other Race | 41 | 4.3% |
| Total | 965 | 100.0% |
Ancestry in Minor
The most populous ancestries reported in Minor are American (268 | 27.8%), German (74 | 7.7%), English (46 | 4.8%), Irish (36 | 3.7%), and Scottish (11 | 1.1%), together accounting for 45.1% of all Minor residents.
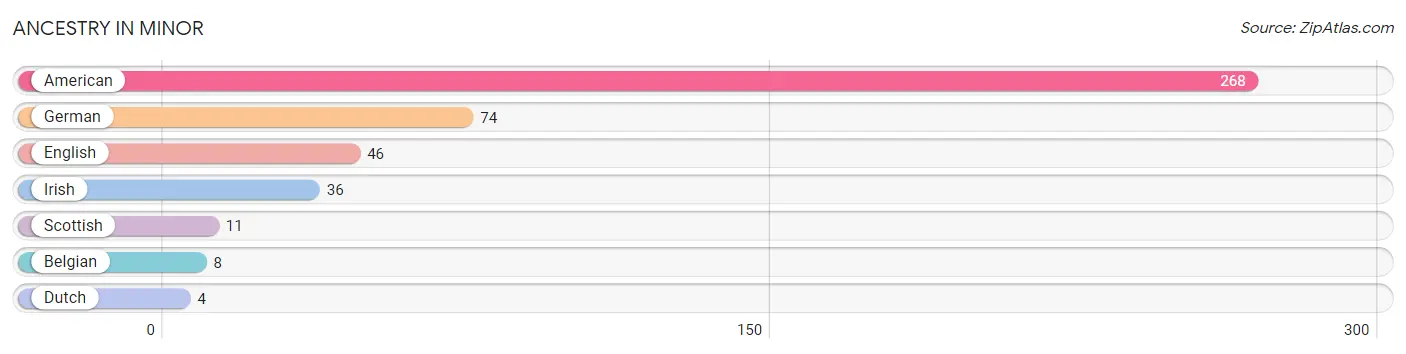
| Ancestry | # Population | % Population |
| American | 268 | 27.8% |
| Belgian | 8 | 0.8% |
| Dutch | 4 | 0.4% |
| English | 46 | 4.8% |
| German | 74 | 7.7% |
| Irish | 36 | 3.7% |
| Scottish | 11 | 1.1% | View All 7 Rows |
Immigrants in Minor

| Immigration Origin | # Population | % Population | View All 0 Rows |
Sex and Age in Minor
Sex and Age in Minor
The most populous age groups in Minor are Under 5 Years (110 | 25.2%) for men and 5 to 9 Years (107 | 20.3%) for women.
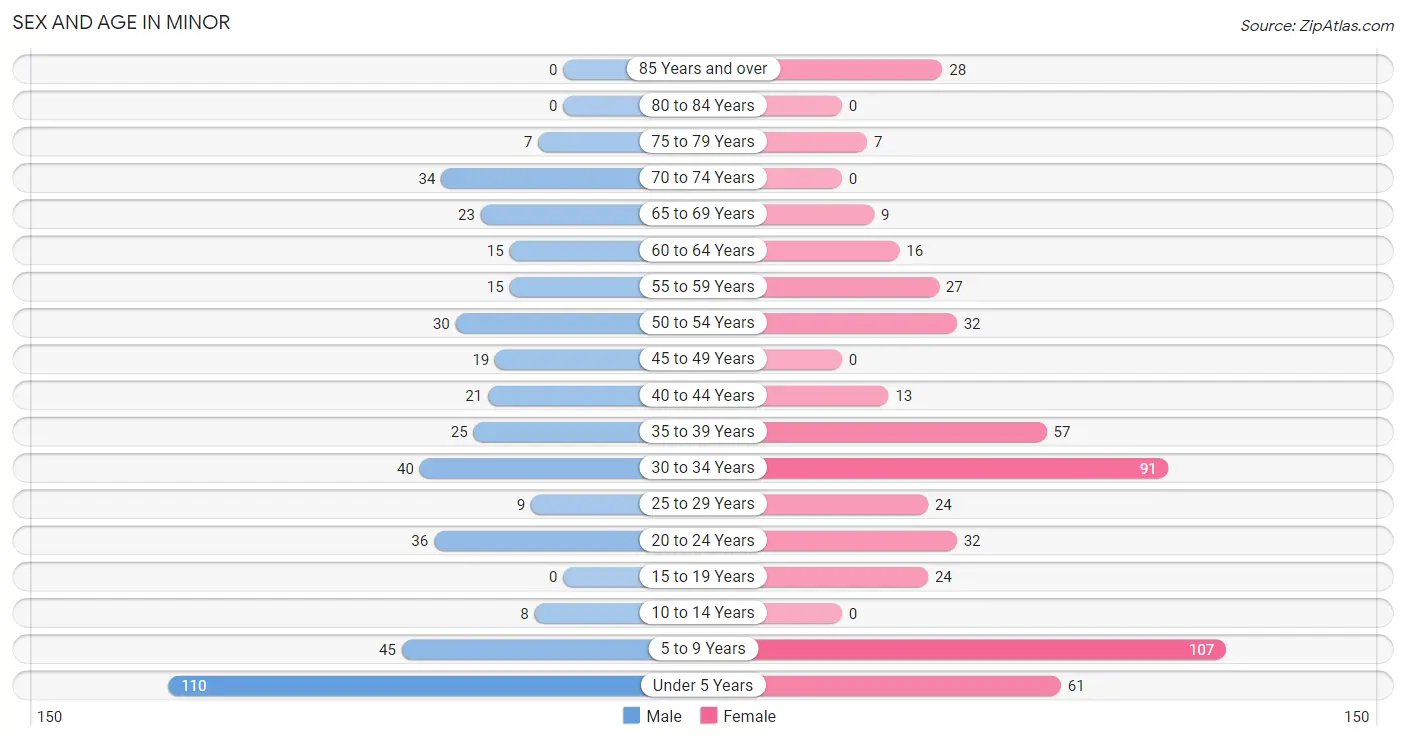
| Age Bracket | Male | Female |
| Under 5 Years | 110 (25.2%) | 61 (11.6%) |
| 5 to 9 Years | 45 (10.3%) | 107 (20.3%) |
| 10 to 14 Years | 8 (1.8%) | 0 (0.0%) |
| 15 to 19 Years | 0 (0.0%) | 24 (4.5%) |
| 20 to 24 Years | 36 (8.2%) | 32 (6.1%) |
| 25 to 29 Years | 9 (2.1%) | 24 (4.5%) |
| 30 to 34 Years | 40 (9.1%) | 91 (17.2%) |
| 35 to 39 Years | 25 (5.7%) | 57 (10.8%) |
| 40 to 44 Years | 21 (4.8%) | 13 (2.5%) |
| 45 to 49 Years | 19 (4.3%) | 0 (0.0%) |
| 50 to 54 Years | 30 (6.9%) | 32 (6.1%) |
| 55 to 59 Years | 15 (3.4%) | 27 (5.1%) |
| 60 to 64 Years | 15 (3.4%) | 16 (3.0%) |
| 65 to 69 Years | 23 (5.3%) | 9 (1.7%) |
| 70 to 74 Years | 34 (7.8%) | 0 (0.0%) |
| 75 to 79 Years | 7 (1.6%) | 7 (1.3%) |
| 80 to 84 Years | 0 (0.0%) | 0 (0.0%) |
| 85 Years and over | 0 (0.0%) | 28 (5.3%) |
| Total | 437 (100.0%) | 528 (100.0%) |
Families and Households in Minor
Median Family Size in Minor
The median family size in Minor is 3.14 persons per family, with married-couple families (136 | 48.6%) accounting for the largest median family size of 3.58 persons per family. On the other hand, single female/mother families (89 | 31.8%) represent the smallest median family size with 2.48 persons per family.
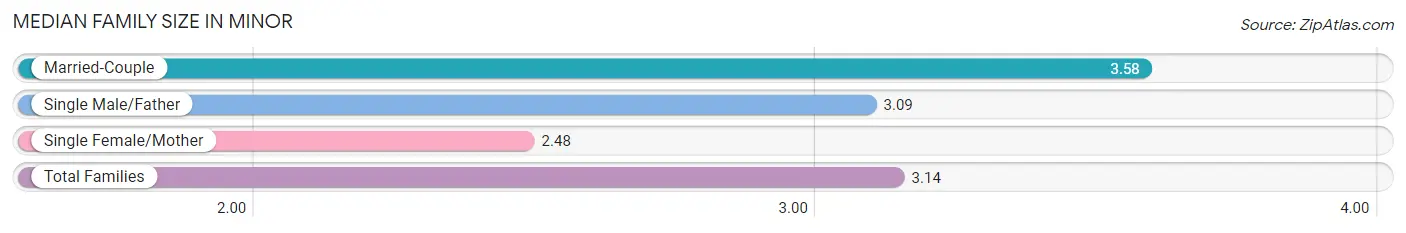
| Family Type | # Families | Family Size |
| Married-Couple | 136 (48.6%) | 3.58 |
| Single Male/Father | 55 (19.6%) | 3.09 |
| Single Female/Mother | 89 (31.8%) | 2.48 |
| Total Families | 280 (100.0%) | 3.14 |
Median Household Size in Minor
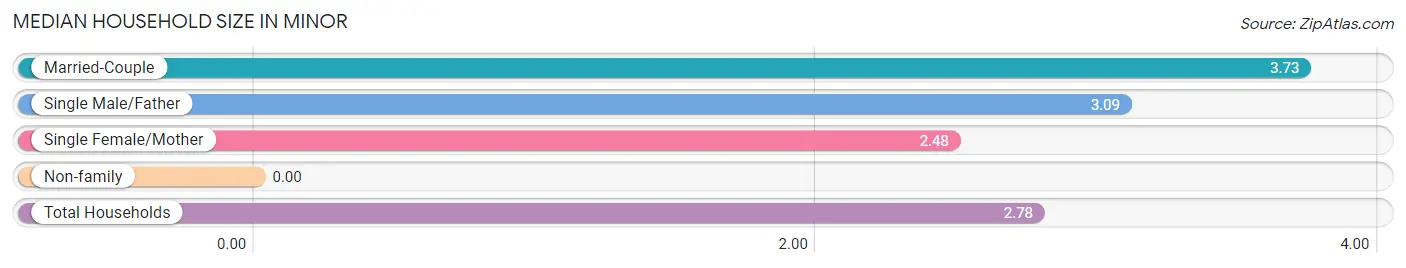
| Household Type | # Households | Household Size |
| Married-Couple | 136 (39.2%) | 3.73 |
| Single Male/Father | 55 (15.9%) | 3.09 |
| Single Female/Mother | 89 (25.7%) | 2.48 |
| Non-family | 67 (19.3%) | - |
| Total Households | 347 (100.0%) | 2.78 |
Household Size by Marriage Status in Minor
Out of a total of 347 households in Minor, 280 (80.7%) are family households, while 67 (19.3%) are nonfamily households. The most numerous type of family households are 2-person households, comprising 102, and the most common type of nonfamily households are 1-person households, comprising 67.
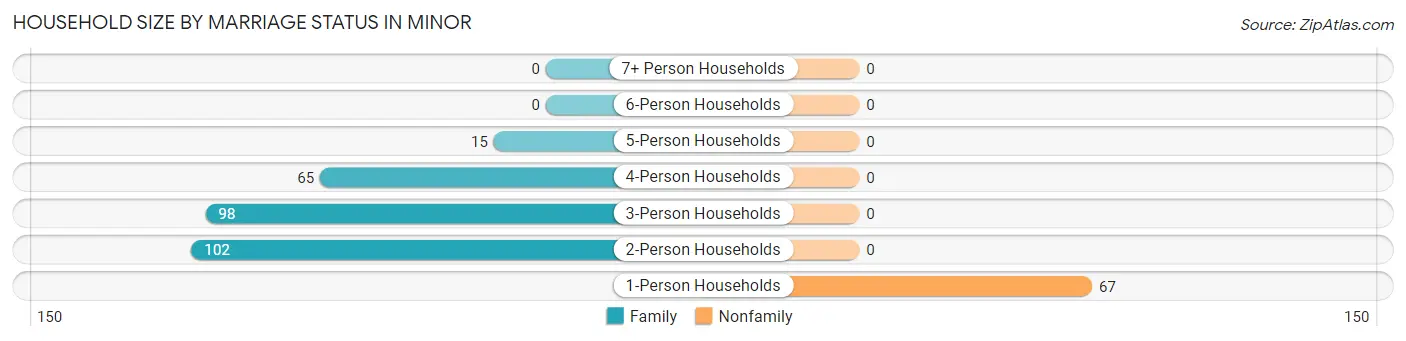
| Household Size | Family Households | Nonfamily Households |
| 1-Person Households | - | 67 (19.3%) |
| 2-Person Households | 102 (29.4%) | 0 (0.0%) |
| 3-Person Households | 98 (28.2%) | 0 (0.0%) |
| 4-Person Households | 65 (18.7%) | 0 (0.0%) |
| 5-Person Households | 15 (4.3%) | 0 (0.0%) |
| 6-Person Households | 0 (0.0%) | 0 (0.0%) |
| 7+ Person Households | 0 (0.0%) | 0 (0.0%) |
| Total | 280 (80.7%) | 67 (19.3%) |
Female Fertility in Minor
Fertility by Age in Minor
Average fertility rate in Minor is 199.0 births per 1,000 women. Women in the age bracket of 20 to 34 years have the highest fertility rate with 327.0 births per 1,000 women. Women in the age bracket of 20 to 34 years acount for 100.0% of all women with births.
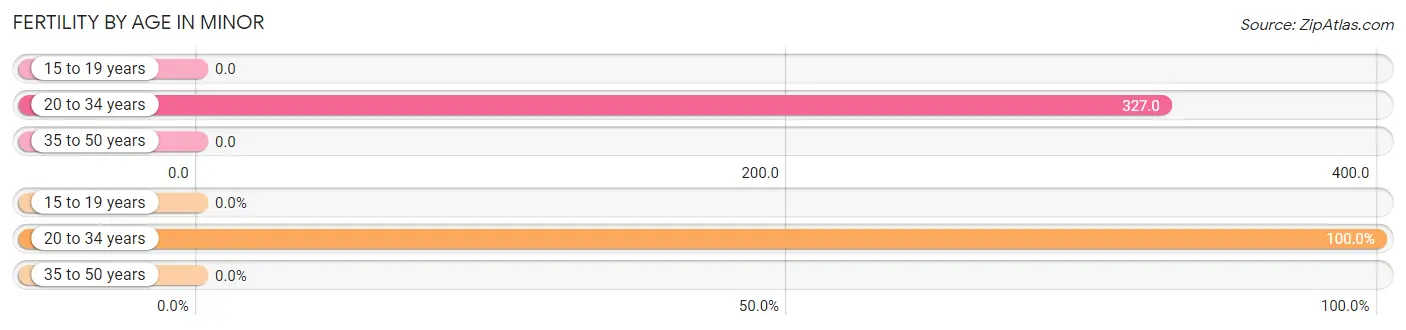
| Age Bracket | Women with Births | Births / 1,000 Women |
| 15 to 19 years | 0 (0.0%) | 0.0 |
| 20 to 34 years | 48 (100.0%) | 327.0 |
| 35 to 50 years | 0 (0.0%) | 0.0 |
| Total | 48 (100.0%) | 199.0 |
Fertility by Age by Marriage Status in Minor
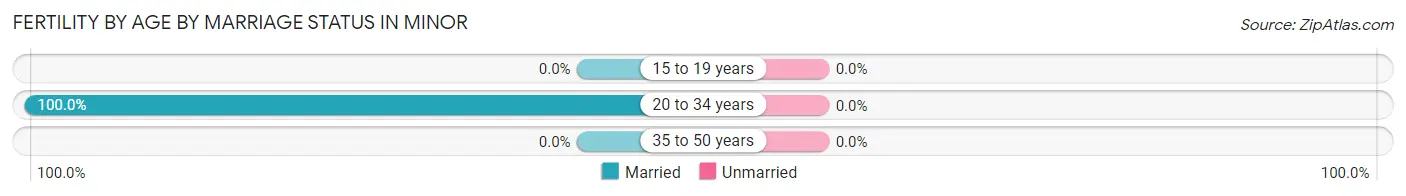
| Age Bracket | Married | Unmarried |
| 15 to 19 years | 0 (0.0%) | 0 (0.0%) |
| 20 to 34 years | 48 (100.0%) | 0 (0.0%) |
| 35 to 50 years | 0 (0.0%) | 0 (0.0%) |
| Total | 48 (100.0%) | 0 (0.0%) |
Fertility by Education in Minor
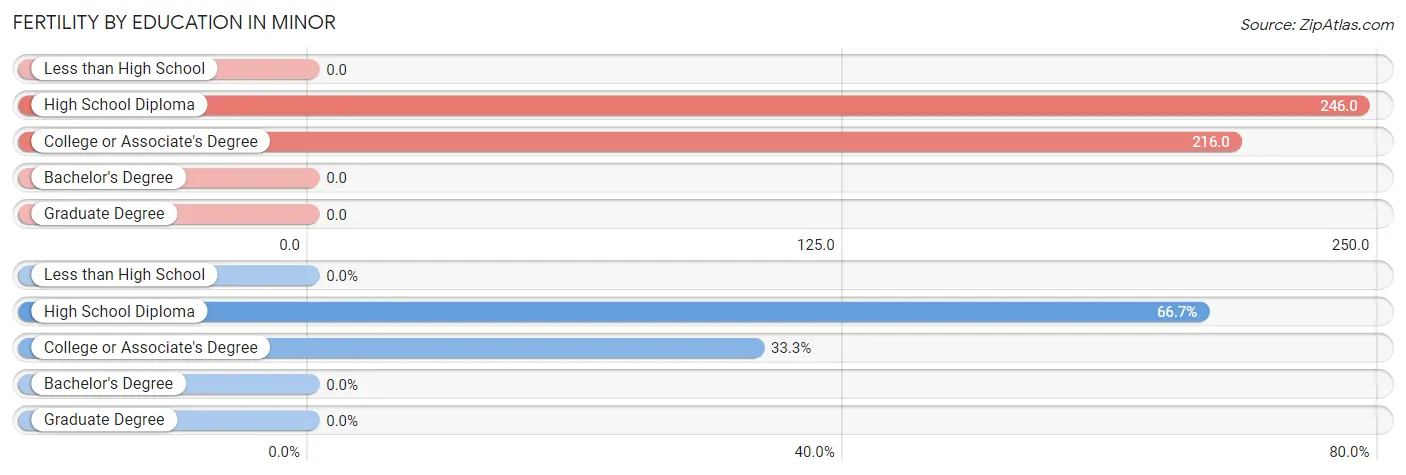
| Educational Attainment | Women with Births | Births / 1,000 Women |
| Less than High School | 0 (0.0%) | 0.0 |
| High School Diploma | 32 (66.7%) | 246.0 |
| College or Associate's Degree | 16 (33.3%) | 216.0 |
| Bachelor's Degree | 0 (0.0%) | 0.0 |
| Graduate Degree | 0 (0.0%) | 0.0 |
| Total | 48 (100.0%) | 199.0 |
Fertility by Education by Marriage Status in Minor
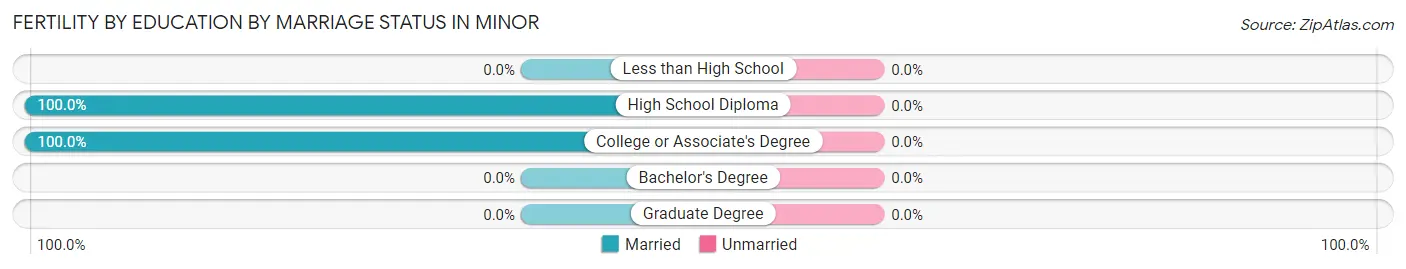
| Educational Attainment | Married | Unmarried |
| Less than High School | 0 (0.0%) | 0 (0.0%) |
| High School Diploma | 32 (100.0%) | 0 (0.0%) |
| College or Associate's Degree | 16 (100.0%) | 0 (0.0%) |
| Bachelor's Degree | 0 (0.0%) | 0 (0.0%) |
| Graduate Degree | 0 (0.0%) | 0 (0.0%) |
| Total | 48 (100.0%) | 0 (0.0%) |
Employment Characteristics in Minor
Employment by Class of Employer in Minor
Among the 351 employed individuals in Minor, private company employees (260 | 74.1%), not-for-profit organizations (57 | 16.2%), and state government employees (16 | 4.6%) make up the most common classes of employment.
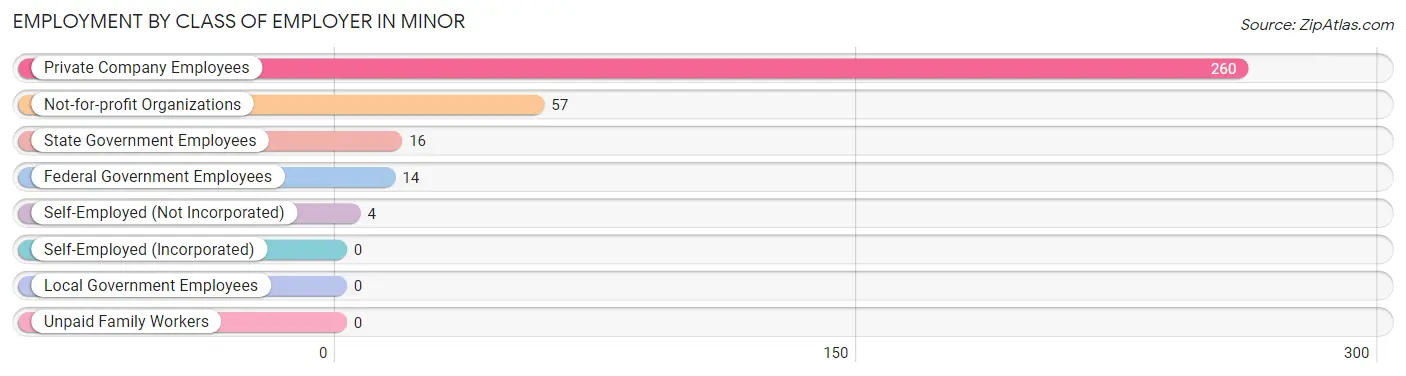
| Employer Class | # Employees | % Employees |
| Private Company Employees | 260 | 74.1% |
| Self-Employed (Incorporated) | 0 | 0.0% |
| Self-Employed (Not Incorporated) | 4 | 1.1% |
| Not-for-profit Organizations | 57 | 16.2% |
| Local Government Employees | 0 | 0.0% |
| State Government Employees | 16 | 4.6% |
| Federal Government Employees | 14 | 4.0% |
| Unpaid Family Workers | 0 | 0.0% |
| Total | 351 | 100.0% |
Employment Status by Age in Minor
According to the labor force statistics for Minor, out of the total population over 16 years of age (634), 64.4% or 408 individuals are in the labor force, with 12.0% or 49 of them unemployed. The age group with the highest labor force participation rate is 25 to 29 years, with 100.0% or 33 individuals in the labor force. Within the labor force, the 45 to 54 years age range has the highest percentage of unemployed individuals, with 51.6% or 33 of them being unemployed.
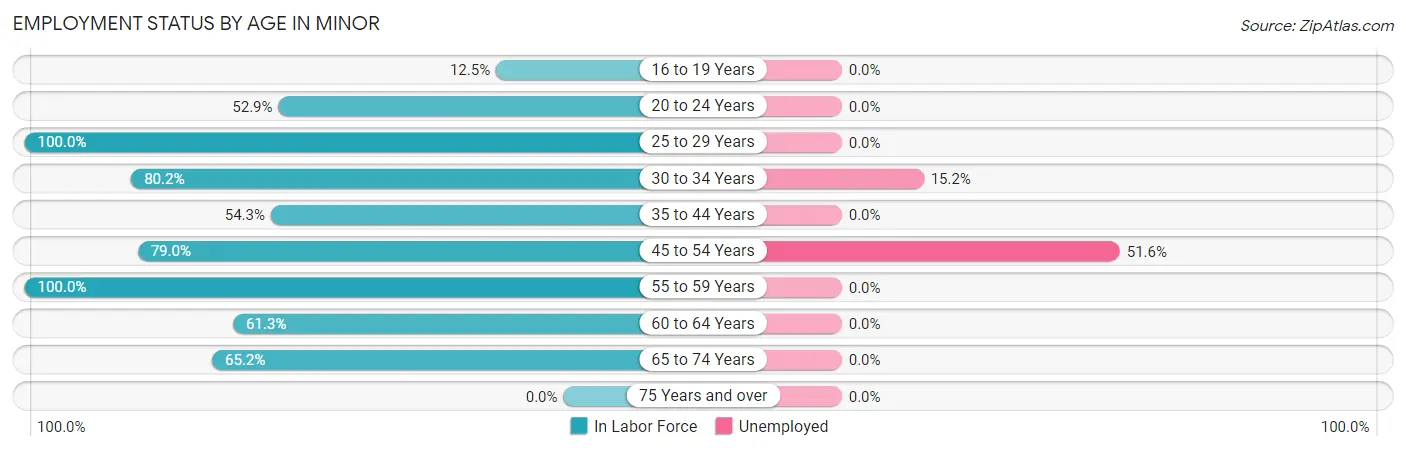
| Age Bracket | In Labor Force | Unemployed |
| 16 to 19 Years | 3 (12.5%) | 0 (0.0%) |
| 20 to 24 Years | 36 (52.9%) | 0 (0.0%) |
| 25 to 29 Years | 33 (100.0%) | 0 (0.0%) |
| 30 to 34 Years | 105 (80.2%) | 16 (15.2%) |
| 35 to 44 Years | 63 (54.3%) | 0 (0.0%) |
| 45 to 54 Years | 64 (79.0%) | 33 (51.6%) |
| 55 to 59 Years | 42 (100.0%) | 0 (0.0%) |
| 60 to 64 Years | 19 (61.3%) | 0 (0.0%) |
| 65 to 74 Years | 43 (65.2%) | 0 (0.0%) |
| 75 Years and over | 0 (0.0%) | 0 (0.0%) |
| Total | 408 (64.4%) | 49 (12.0%) |
Employment Status by Educational Attainment in Minor
According to labor force statistics for Minor, 75.1% of individuals (326) out of the total population between 25 and 64 years of age (434) are in the labor force, with 15.0% or 49 of them being unemployed. The group with the highest labor force participation rate are those with the educational attainment of college / associate degree, with 86.5% or 167 individuals in the labor force. Within the labor force, individuals with college / associate degree education have the highest percentage of unemployment, with 29.3% or 49 of them being unemployed.
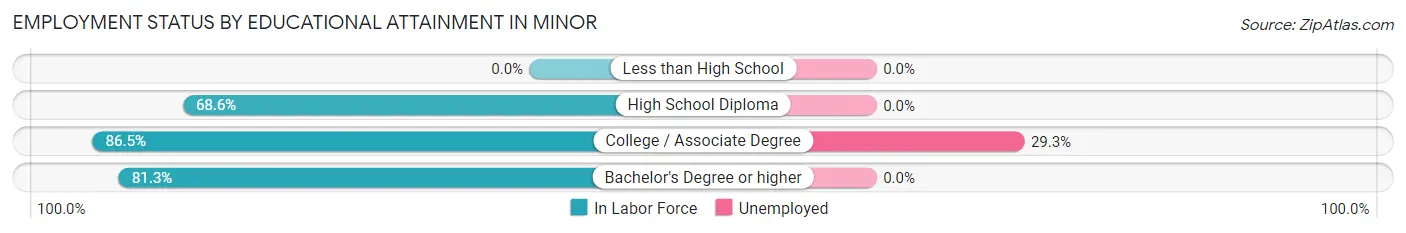
| Educational Attainment | In Labor Force | Unemployed |
| Less than High School | 0 (0.0%) | 0 (0.0%) |
| High School Diploma | 133 (68.6%) | 0 (0.0%) |
| College / Associate Degree | 167 (86.5%) | 57 (29.3%) |
| Bachelor's Degree or higher | 26 (81.3%) | 0 (0.0%) |
| Total | 326 (75.1%) | 65 (15.0%) |
Employment Occupations by Sex in Minor
Management, Business, Science and Arts Occupations
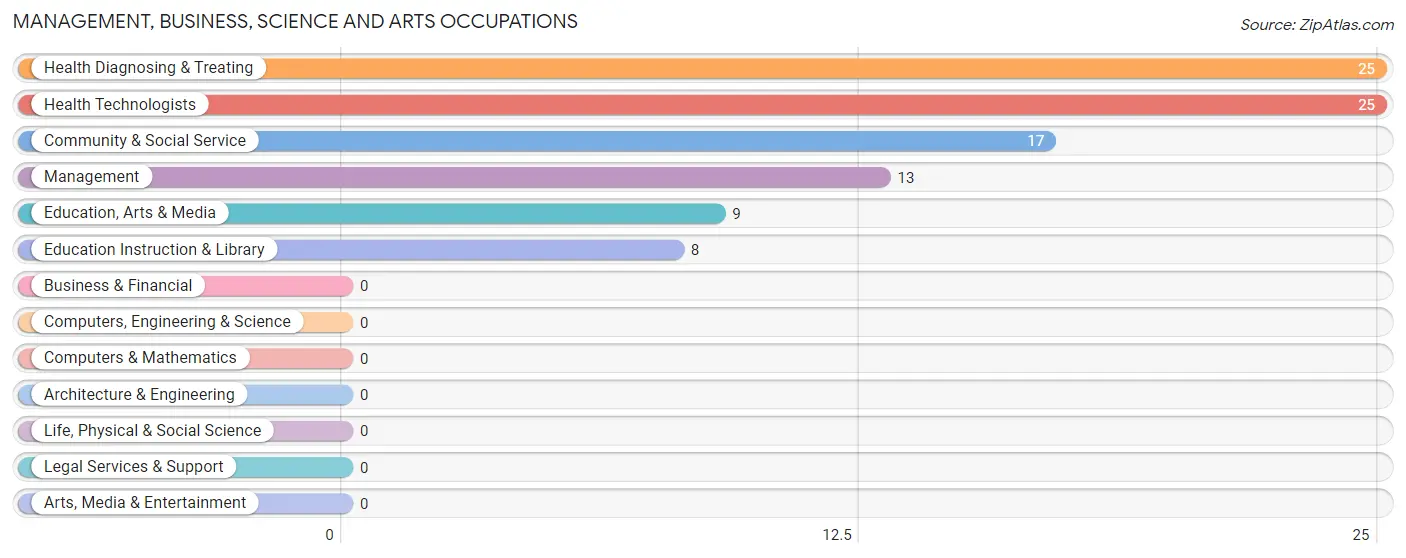
The most common Management, Business, Science and Arts occupations in Minor are Health Diagnosing & Treating (25 | 7.0%), Health Technologists (25 | 7.0%), Community & Social Service (17 | 4.7%), Management (13 | 3.6%), and Education, Arts & Media (9 | 2.5%).
Management, Business, Science and Arts Occupations by Sex
Within the Management, Business, Science and Arts occupations in Minor, the most male-oriented occupations are Community & Social Service (100.0%), Education, Arts & Media (100.0%), and Education Instruction & Library (100.0%), while the most female-oriented occupations are Management (100.0%), Health Diagnosing & Treating (100.0%), and Health Technologists (100.0%).
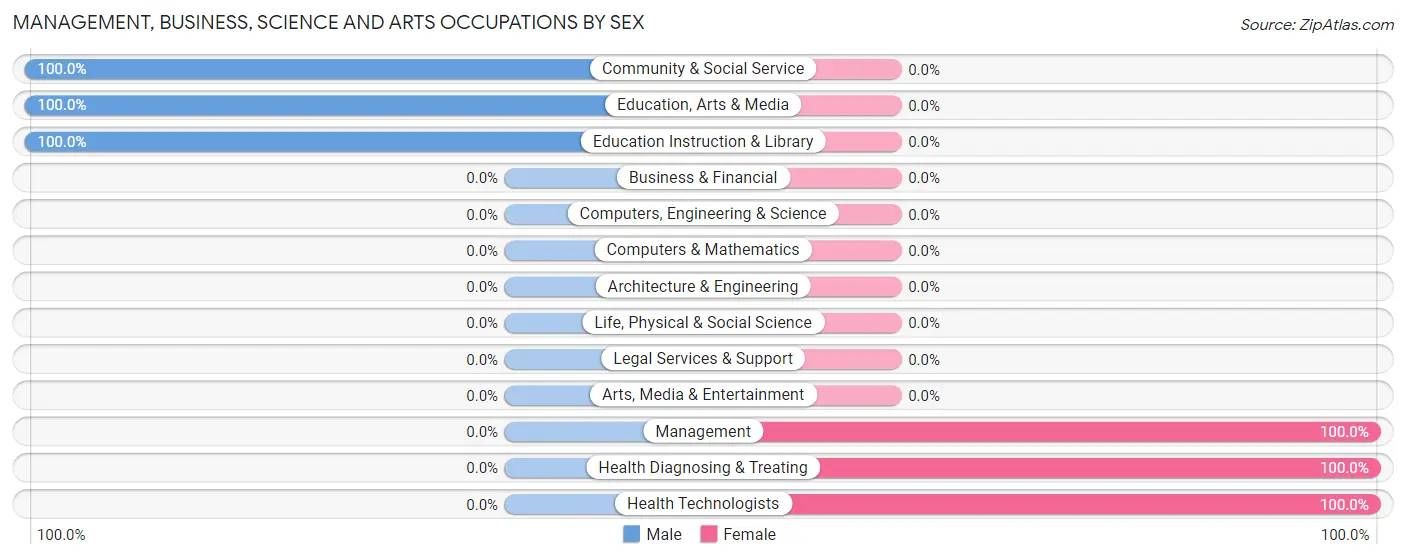
| Occupation | Male | Female |
| Management | 0 (0.0%) | 13 (100.0%) |
| Business & Financial | 0 (0.0%) | 0 (0.0%) |
| Computers, Engineering & Science | 0 (0.0%) | 0 (0.0%) |
| Computers & Mathematics | 0 (0.0%) | 0 (0.0%) |
| Architecture & Engineering | 0 (0.0%) | 0 (0.0%) |
| Life, Physical & Social Science | 0 (0.0%) | 0 (0.0%) |
| Community & Social Service | 17 (100.0%) | 0 (0.0%) |
| Education, Arts & Media | 9 (100.0%) | 0 (0.0%) |
| Legal Services & Support | 0 (0.0%) | 0 (0.0%) |
| Education Instruction & Library | 8 (100.0%) | 0 (0.0%) |
| Arts, Media & Entertainment | 0 (0.0%) | 0 (0.0%) |
| Health Diagnosing & Treating | 0 (0.0%) | 25 (100.0%) |
| Health Technologists | 0 (0.0%) | 25 (100.0%) |
| Total (Category) | 17 (30.9%) | 38 (69.1%) |
| Total (Overall) | 202 (56.3%) | 157 (43.7%) |
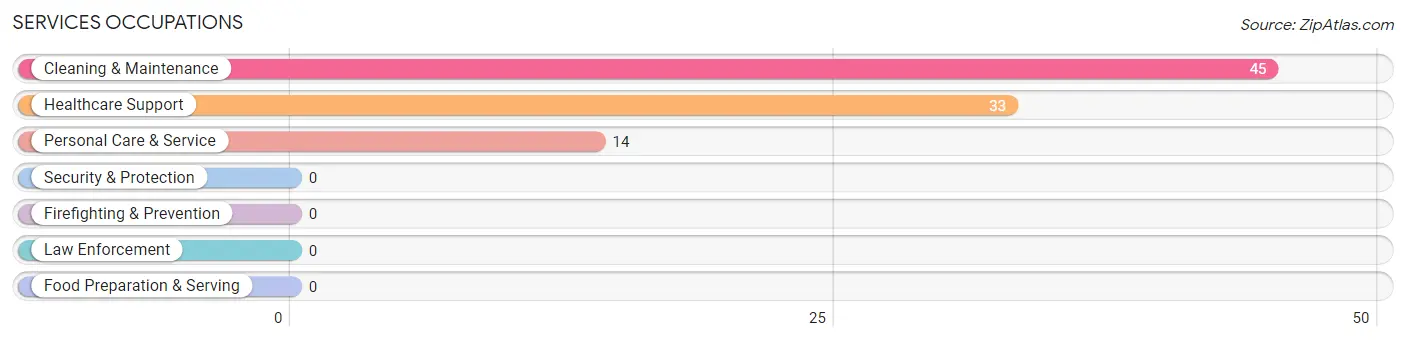
Services Occupations
The most common Services occupations in Minor are Cleaning & Maintenance (45 | 12.5%), Healthcare Support (33 | 9.2%), and Personal Care & Service (14 | 3.9%).
Services Occupations by Sex
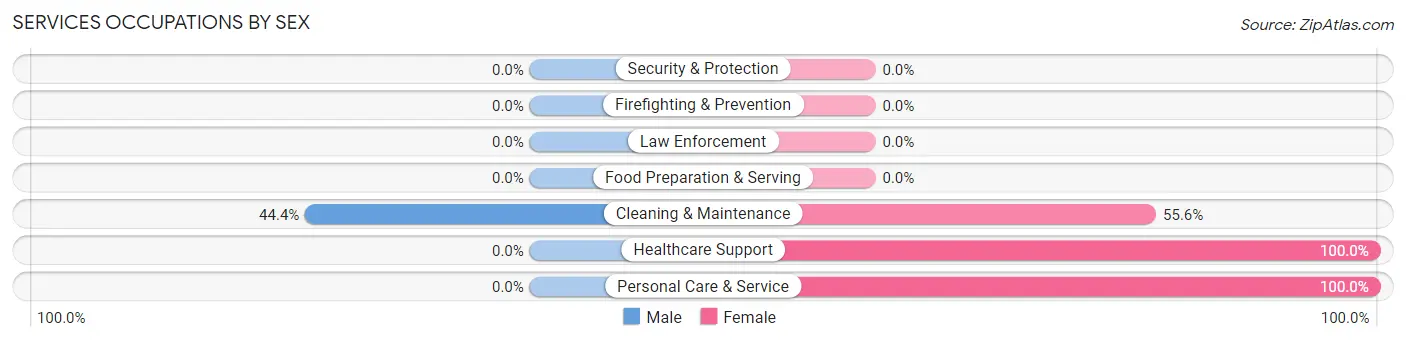
| Occupation | Male | Female |
| Healthcare Support | 0 (0.0%) | 33 (100.0%) |
| Security & Protection | 0 (0.0%) | 0 (0.0%) |
| Firefighting & Prevention | 0 (0.0%) | 0 (0.0%) |
| Law Enforcement | 0 (0.0%) | 0 (0.0%) |
| Food Preparation & Serving | 0 (0.0%) | 0 (0.0%) |
| Cleaning & Maintenance | 20 (44.4%) | 25 (55.6%) |
| Personal Care & Service | 0 (0.0%) | 14 (100.0%) |
| Total (Category) | 20 (21.7%) | 72 (78.3%) |
| Total (Overall) | 202 (56.3%) | 157 (43.7%) |
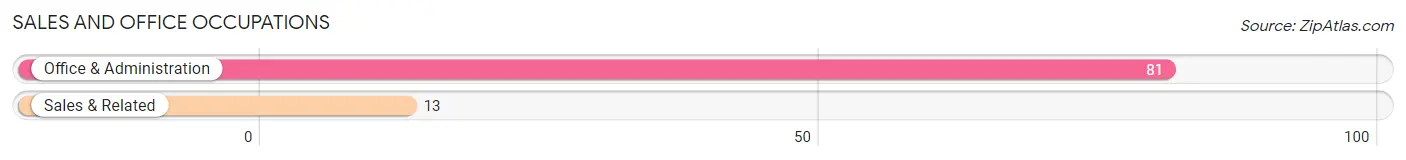
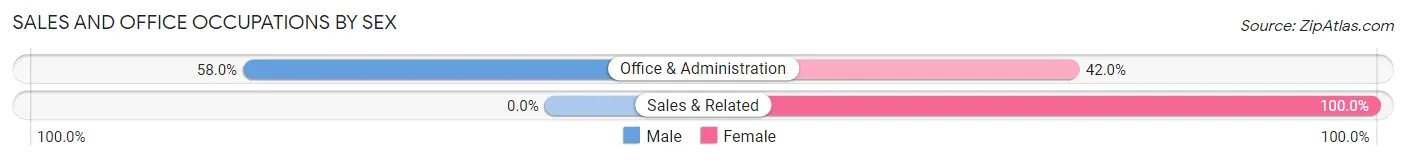
Sales and Office Occupations
The most common Sales and Office occupations in Minor are Office & Administration (81 | 22.6%), and Sales & Related (13 | 3.6%).
Sales and Office Occupations by Sex
| Occupation | Male | Female |
| Sales & Related | 0 (0.0%) | 13 (100.0%) |
| Office & Administration | 47 (58.0%) | 34 (42.0%) |
| Total (Category) | 47 (50.0%) | 47 (50.0%) |
| Total (Overall) | 202 (56.3%) | 157 (43.7%) |
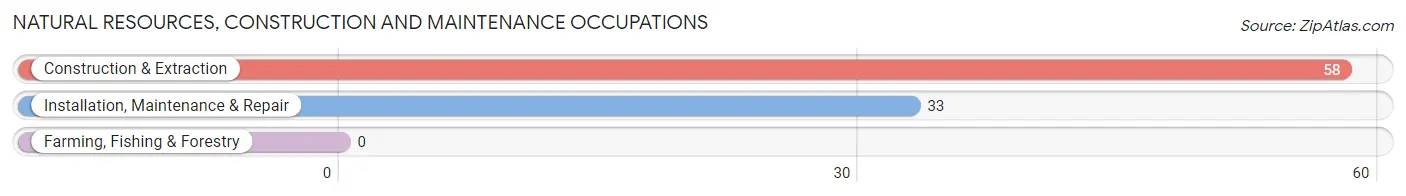
Natural Resources, Construction and Maintenance Occupations
The most common Natural Resources, Construction and Maintenance occupations in Minor are Construction & Extraction (58 | 16.2%), and Installation, Maintenance & Repair (33 | 9.2%).
Natural Resources, Construction and Maintenance Occupations by Sex
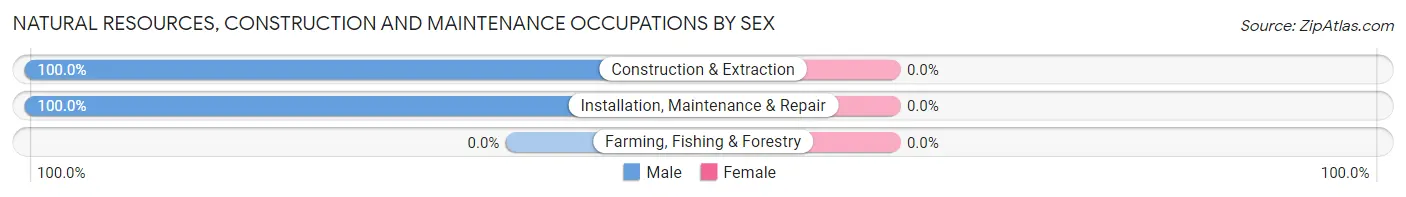
| Occupation | Male | Female |
| Farming, Fishing & Forestry | 0 (0.0%) | 0 (0.0%) |
| Construction & Extraction | 58 (100.0%) | 0 (0.0%) |
| Installation, Maintenance & Repair | 33 (100.0%) | 0 (0.0%) |
| Total (Category) | 91 (100.0%) | 0 (0.0%) |
| Total (Overall) | 202 (56.3%) | 157 (43.7%) |
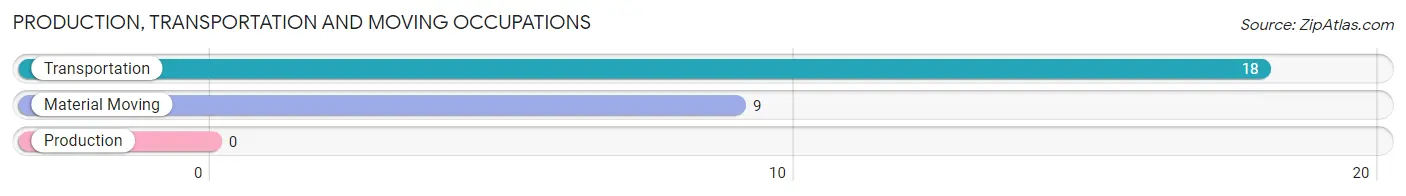
Production, Transportation and Moving Occupations
The most common Production, Transportation and Moving occupations in Minor are Transportation (18 | 5.0%), and Material Moving (9 | 2.5%).
Production, Transportation and Moving Occupations by Sex
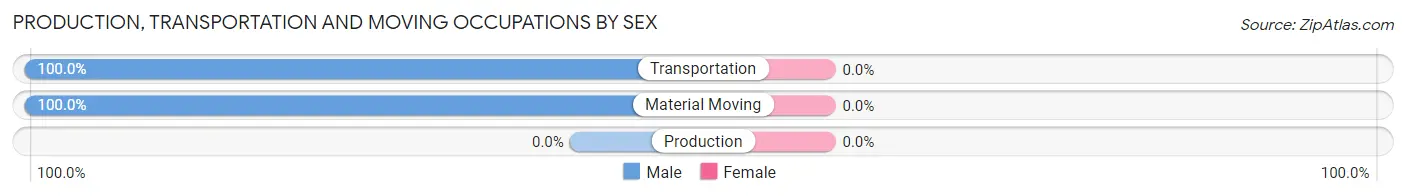
| Occupation | Male | Female |
| Production | 0 (0.0%) | 0 (0.0%) |
| Transportation | 18 (100.0%) | 0 (0.0%) |
| Material Moving | 9 (100.0%) | 0 (0.0%) |
| Total (Category) | 27 (100.0%) | 0 (0.0%) |
| Total (Overall) | 202 (56.3%) | 157 (43.7%) |
Employment Industries by Sex in Minor
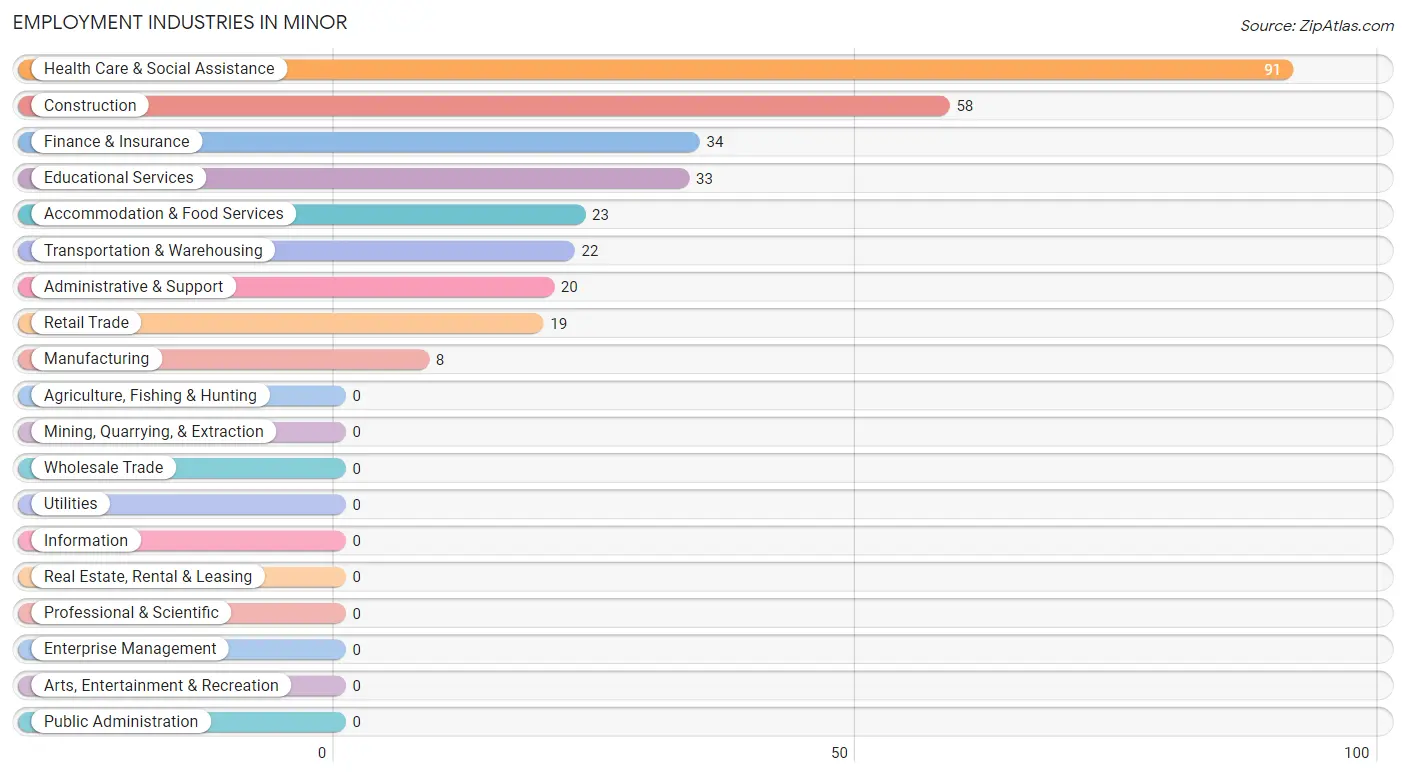
Employment Industries in Minor
The major employment industries in Minor include Health Care & Social Assistance (91 | 25.4%), Construction (58 | 16.2%), Finance & Insurance (34 | 9.5%), Educational Services (33 | 9.2%), and Accommodation & Food Services (23 | 6.4%).
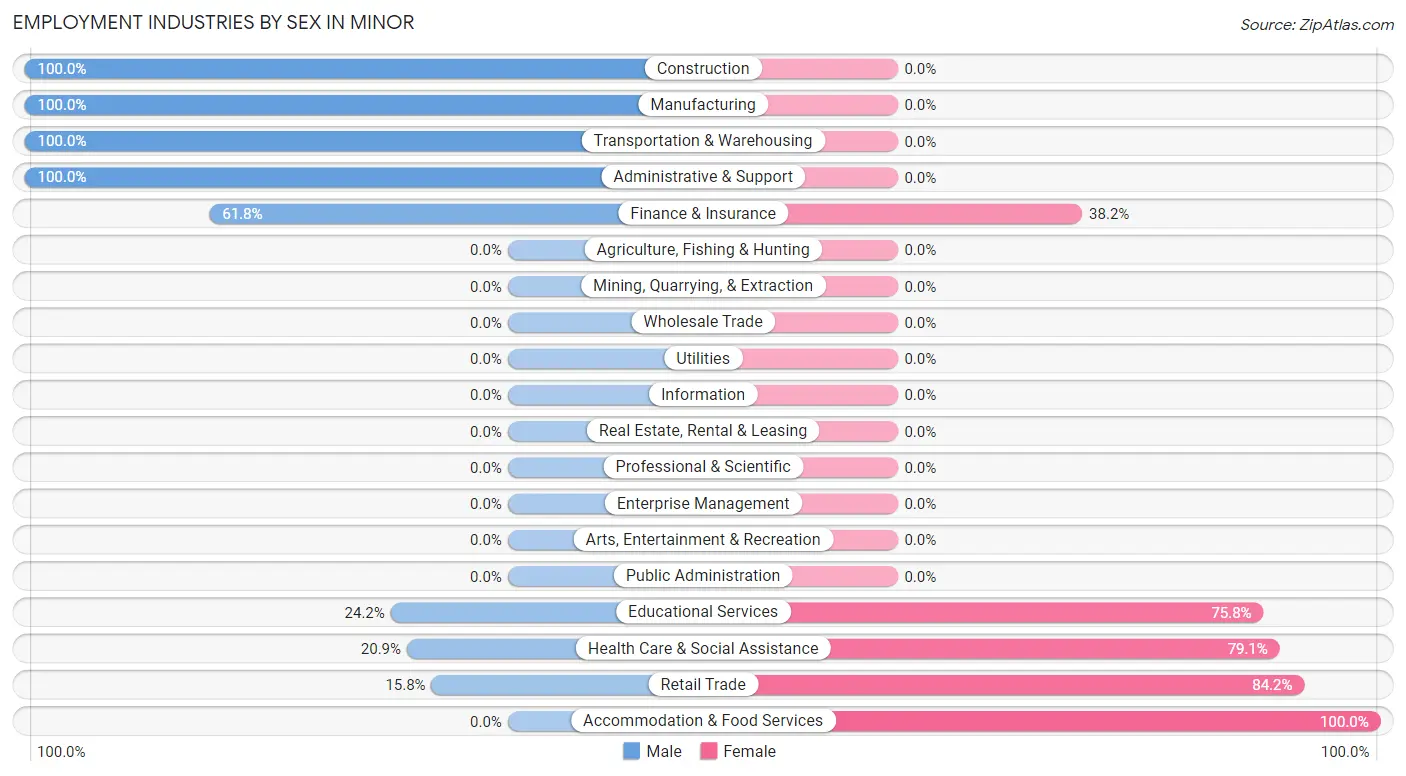
Employment Industries by Sex in Minor
The Minor industries that see more men than women are Construction (100.0%), Manufacturing (100.0%), and Transportation & Warehousing (100.0%), whereas the industries that tend to have a higher number of women are Accommodation & Food Services (100.0%), Retail Trade (84.2%), and Health Care & Social Assistance (79.1%).
| Industry | Male | Female |
| Agriculture, Fishing & Hunting | 0 (0.0%) | 0 (0.0%) |
| Mining, Quarrying, & Extraction | 0 (0.0%) | 0 (0.0%) |
| Construction | 58 (100.0%) | 0 (0.0%) |
| Manufacturing | 8 (100.0%) | 0 (0.0%) |
| Wholesale Trade | 0 (0.0%) | 0 (0.0%) |
| Retail Trade | 3 (15.8%) | 16 (84.2%) |
| Transportation & Warehousing | 22 (100.0%) | 0 (0.0%) |
| Utilities | 0 (0.0%) | 0 (0.0%) |
| Information | 0 (0.0%) | 0 (0.0%) |
| Finance & Insurance | 21 (61.8%) | 13 (38.2%) |
| Real Estate, Rental & Leasing | 0 (0.0%) | 0 (0.0%) |
| Professional & Scientific | 0 (0.0%) | 0 (0.0%) |
| Enterprise Management | 0 (0.0%) | 0 (0.0%) |
| Administrative & Support | 20 (100.0%) | 0 (0.0%) |
| Educational Services | 8 (24.2%) | 25 (75.8%) |
| Health Care & Social Assistance | 19 (20.9%) | 72 (79.1%) |
| Arts, Entertainment & Recreation | 0 (0.0%) | 0 (0.0%) |
| Accommodation & Food Services | 0 (0.0%) | 23 (100.0%) |
| Public Administration | 0 (0.0%) | 0 (0.0%) |
| Total | 202 (56.3%) | 157 (43.7%) |
Education in Minor
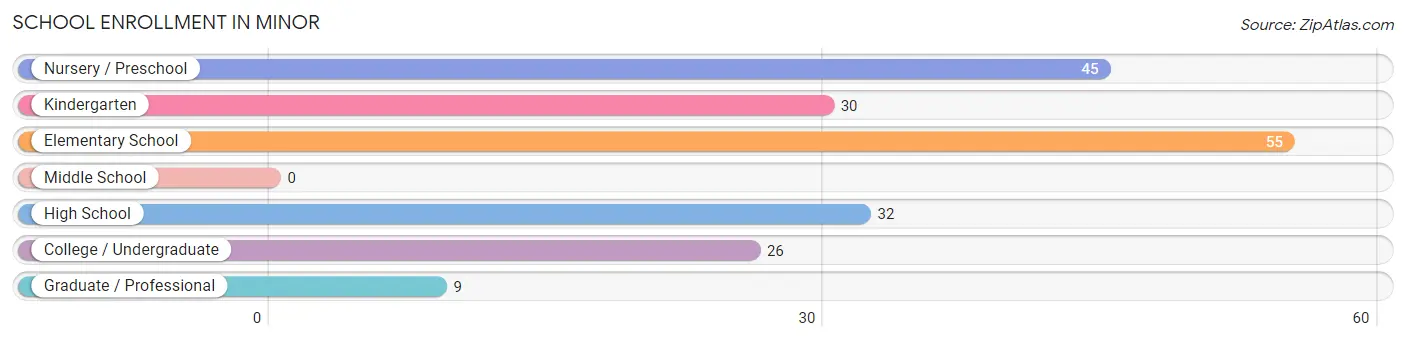
School Enrollment in Minor
The most common levels of schooling among the 197 students in Minor are elementary school (55 | 27.9%), nursery / preschool (45 | 22.8%), and high school (32 | 16.2%).
| School Level | # Students | % Students |
| Nursery / Preschool | 45 | 22.8% |
| Kindergarten | 30 | 15.2% |
| Elementary School | 55 | 27.9% |
| Middle School | 0 | 0.0% |
| High School | 32 | 16.2% |
| College / Undergraduate | 26 | 13.2% |
| Graduate / Professional | 9 | 4.6% |
| Total | 197 | 100.0% |
School Enrollment by Age by Funding Source in Minor
Out of a total of 197 students who are enrolled in schools in Minor, 27 (13.7%) attend a private institution, while the remaining 170 (86.3%) are enrolled in public schools. The age group of 25 to 34 year olds has the highest likelihood of being enrolled in private schools, with 9 (25.7% in the age bracket) enrolled. Conversely, the age group of 10 to 14 year olds has the lowest likelihood of being enrolled in a private school, with 8 (100.0% in the age bracket) attending a public institution.
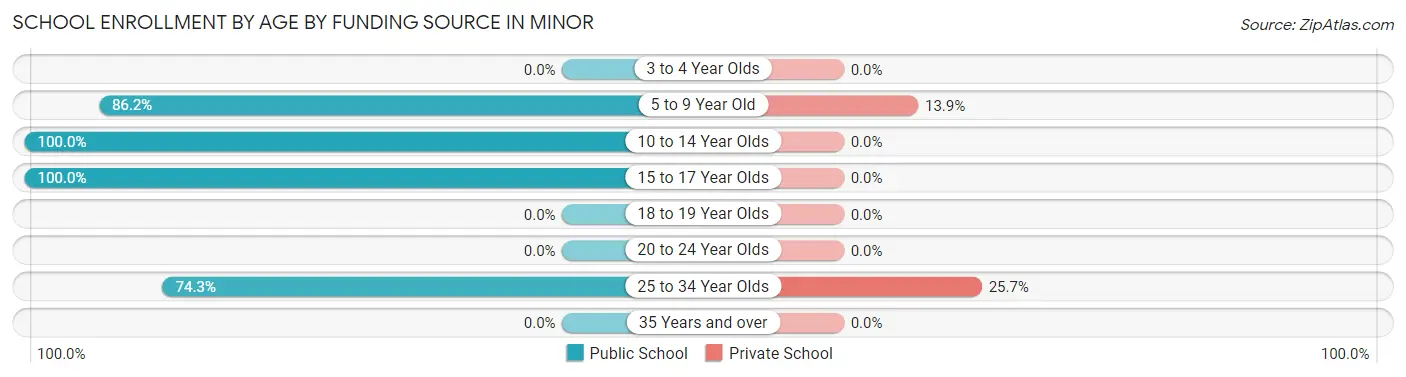
| Age Bracket | Public School | Private School |
| 3 to 4 Year Olds | 0 (0.0%) | 0 (0.0%) |
| 5 to 9 Year Old | 112 (86.2%) | 18 (13.9%) |
| 10 to 14 Year Olds | 8 (100.0%) | 0 (0.0%) |
| 15 to 17 Year Olds | 24 (100.0%) | 0 (0.0%) |
| 18 to 19 Year Olds | 0 (0.0%) | 0 (0.0%) |
| 20 to 24 Year Olds | 0 (0.0%) | 0 (0.0%) |
| 25 to 34 Year Olds | 26 (74.3%) | 9 (25.7%) |
| 35 Years and over | 0 (0.0%) | 0 (0.0%) |
| Total | 170 (86.3%) | 27 (13.7%) |
Educational Attainment by Field of Study in Minor
Engineering (9 | 22.0%), science & technology (9 | 22.0%), liberal arts & history (9 | 22.0%), physical & health sciences (8 | 19.5%), and business (6 | 14.6%) are the most common fields of study among 41 individuals in Minor who have obtained a bachelor's degree or higher.
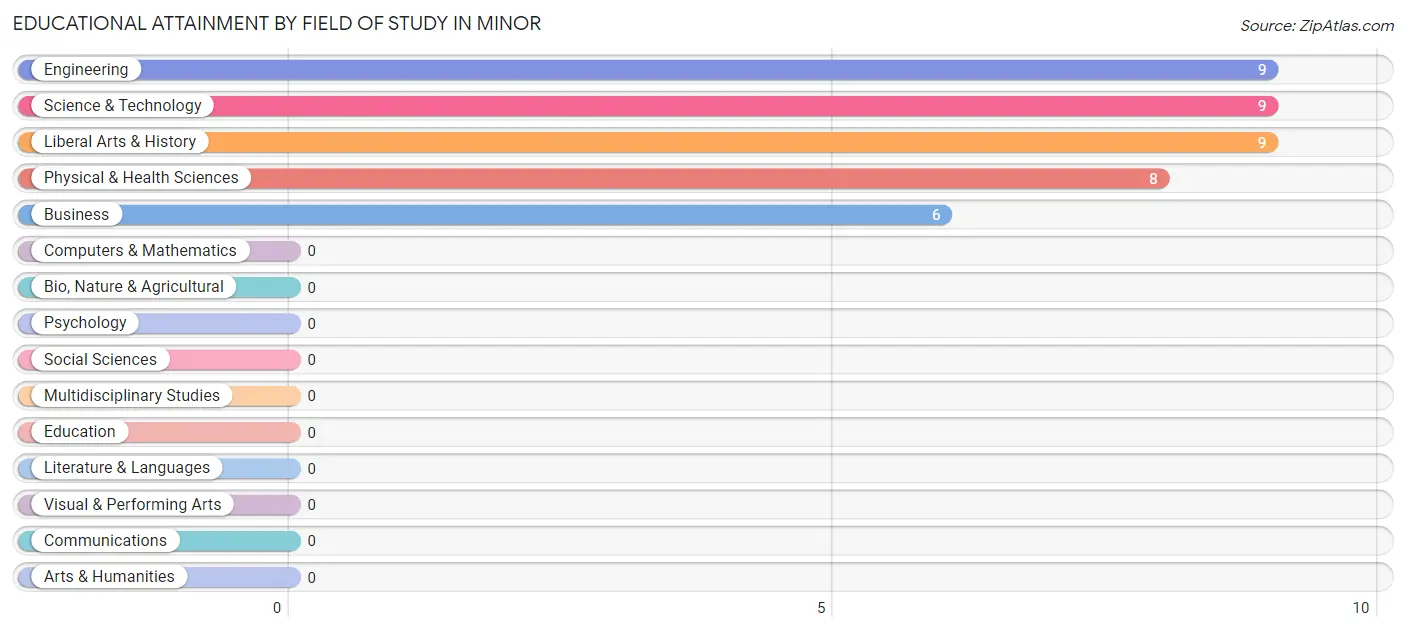
| Field of Study | # Graduates | % Graduates |
| Computers & Mathematics | 0 | 0.0% |
| Bio, Nature & Agricultural | 0 | 0.0% |
| Physical & Health Sciences | 8 | 19.5% |
| Psychology | 0 | 0.0% |
| Social Sciences | 0 | 0.0% |
| Engineering | 9 | 22.0% |
| Multidisciplinary Studies | 0 | 0.0% |
| Science & Technology | 9 | 22.0% |
| Business | 6 | 14.6% |
| Education | 0 | 0.0% |
| Literature & Languages | 0 | 0.0% |
| Liberal Arts & History | 9 | 22.0% |
| Visual & Performing Arts | 0 | 0.0% |
| Communications | 0 | 0.0% |
| Arts & Humanities | 0 | 0.0% |
| Total | 41 | 100.0% |
Transportation & Commute in Minor
Vehicle Availability by Sex in Minor
The most prevalent vehicle ownership categories in Minor are males with 2 vehicles (102, accounting for 50.5%) and females with 2 vehicles (33, making up 68.5%).
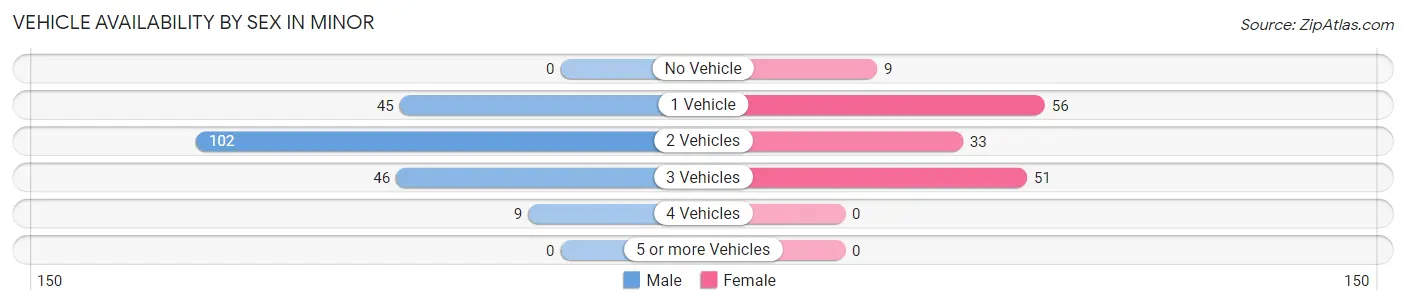
| Vehicles Available | Male | Female |
| No Vehicle | 0 (0.0%) | 9 (6.0%) |
| 1 Vehicle | 45 (22.3%) | 56 (37.6%) |
| 2 Vehicles | 102 (50.5%) | 33 (22.2%) |
| 3 Vehicles | 46 (22.8%) | 51 (34.2%) |
| 4 Vehicles | 9 (4.5%) | 0 (0.0%) |
| 5 or more Vehicles | 0 (0.0%) | 0 (0.0%) |
| Total | 202 (100.0%) | 149 (100.0%) |
Commute Time in Minor
The most frequently occuring commute durations in Minor are 20 to 24 minutes (73 commuters, 20.8%), 25 to 29 minutes (66 commuters, 18.8%), and 60 to 89 minutes (54 commuters, 15.4%).
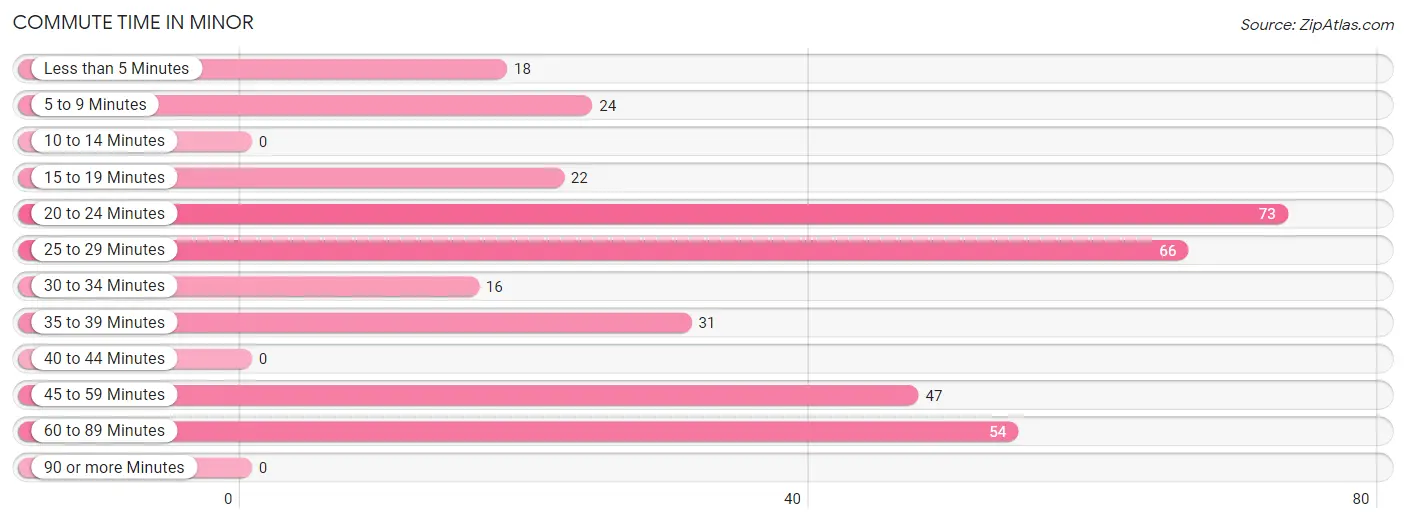
| Commute Time | # Commuters | % Commuters |
| Less than 5 Minutes | 18 | 5.1% |
| 5 to 9 Minutes | 24 | 6.8% |
| 10 to 14 Minutes | 0 | 0.0% |
| 15 to 19 Minutes | 22 | 6.3% |
| 20 to 24 Minutes | 73 | 20.8% |
| 25 to 29 Minutes | 66 | 18.8% |
| 30 to 34 Minutes | 16 | 4.6% |
| 35 to 39 Minutes | 31 | 8.8% |
| 40 to 44 Minutes | 0 | 0.0% |
| 45 to 59 Minutes | 47 | 13.4% |
| 60 to 89 Minutes | 54 | 15.4% |
| 90 or more Minutes | 0 | 0.0% |
Commute Time by Sex in Minor
The most common commute times in Minor are 45 to 59 minutes (47 commuters, 23.3%) for males and 20 to 24 minutes (46 commuters, 30.9%) for females.
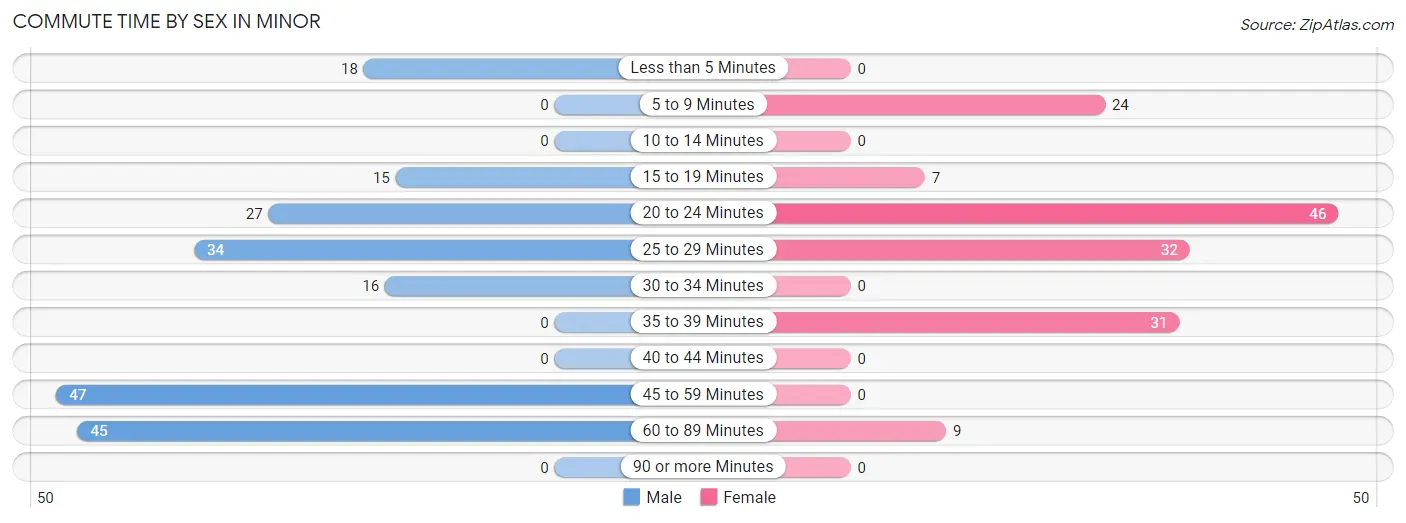
| Commute Time | Male | Female |
| Less than 5 Minutes | 18 (8.9%) | 0 (0.0%) |
| 5 to 9 Minutes | 0 (0.0%) | 24 (16.1%) |
| 10 to 14 Minutes | 0 (0.0%) | 0 (0.0%) |
| 15 to 19 Minutes | 15 (7.4%) | 7 (4.7%) |
| 20 to 24 Minutes | 27 (13.4%) | 46 (30.9%) |
| 25 to 29 Minutes | 34 (16.8%) | 32 (21.5%) |
| 30 to 34 Minutes | 16 (7.9%) | 0 (0.0%) |
| 35 to 39 Minutes | 0 (0.0%) | 31 (20.8%) |
| 40 to 44 Minutes | 0 (0.0%) | 0 (0.0%) |
| 45 to 59 Minutes | 47 (23.3%) | 0 (0.0%) |
| 60 to 89 Minutes | 45 (22.3%) | 9 (6.0%) |
| 90 or more Minutes | 0 (0.0%) | 0 (0.0%) |
Time of Departure to Work by Sex in Minor
The most frequent times of departure to work in Minor are 7:30 AM to 7:59 AM (45, 22.3%) for males and 4:00 PM to 11:59 PM (64, 42.9%) for females.
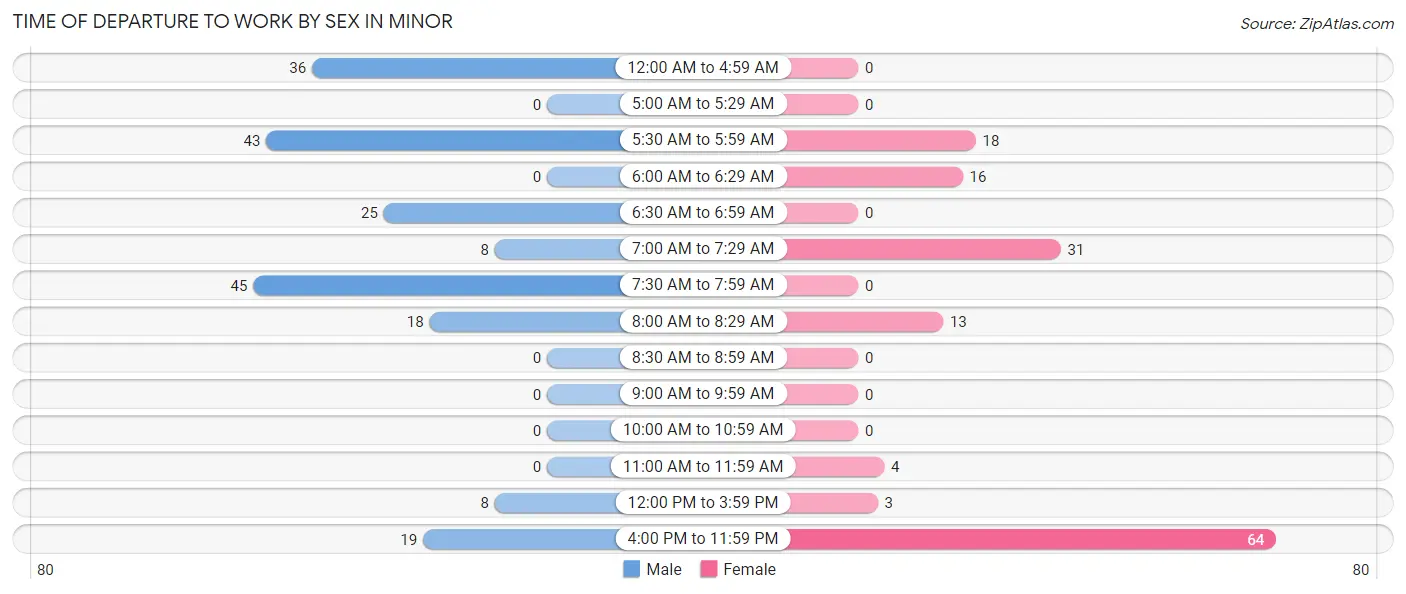
| Time of Departure | Male | Female |
| 12:00 AM to 4:59 AM | 36 (17.8%) | 0 (0.0%) |
| 5:00 AM to 5:29 AM | 0 (0.0%) | 0 (0.0%) |
| 5:30 AM to 5:59 AM | 43 (21.3%) | 18 (12.1%) |
| 6:00 AM to 6:29 AM | 0 (0.0%) | 16 (10.7%) |
| 6:30 AM to 6:59 AM | 25 (12.4%) | 0 (0.0%) |
| 7:00 AM to 7:29 AM | 8 (4.0%) | 31 (20.8%) |
| 7:30 AM to 7:59 AM | 45 (22.3%) | 0 (0.0%) |
| 8:00 AM to 8:29 AM | 18 (8.9%) | 13 (8.7%) |
| 8:30 AM to 8:59 AM | 0 (0.0%) | 0 (0.0%) |
| 9:00 AM to 9:59 AM | 0 (0.0%) | 0 (0.0%) |
| 10:00 AM to 10:59 AM | 0 (0.0%) | 0 (0.0%) |
| 11:00 AM to 11:59 AM | 0 (0.0%) | 4 (2.7%) |
| 12:00 PM to 3:59 PM | 8 (4.0%) | 3 (2.0%) |
| 4:00 PM to 11:59 PM | 19 (9.4%) | 64 (42.9%) |
| Total | 202 (100.0%) | 149 (100.0%) |
Housing Occupancy in Minor
Occupancy by Ownership in Minor
Of the total 347 dwellings in Minor, owner-occupied units account for 230 (66.3%), while renter-occupied units make up 117 (33.7%).
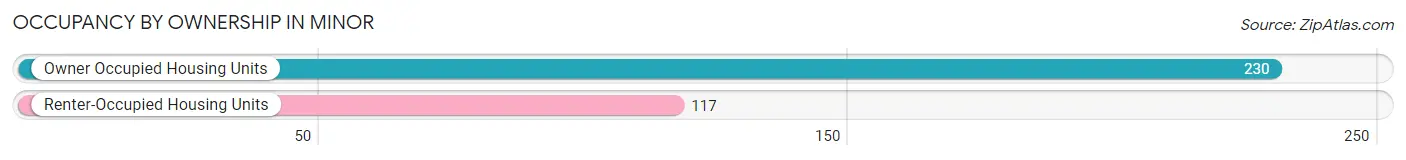
| Occupancy | # Housing Units | % Housing Units |
| Owner Occupied Housing Units | 230 | 66.3% |
| Renter-Occupied Housing Units | 117 | 33.7% |
| Total Occupied Housing Units | 347 | 100.0% |
Occupancy by Household Size in Minor
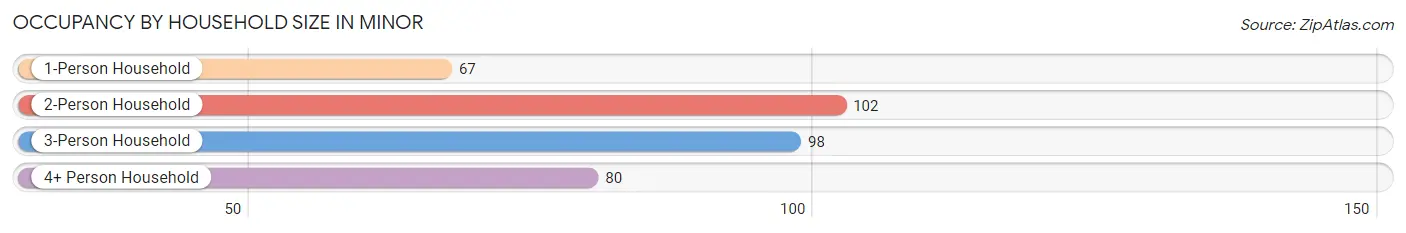
| Household Size | # Housing Units | % Housing Units |
| 1-Person Household | 67 | 19.3% |
| 2-Person Household | 102 | 29.4% |
| 3-Person Household | 98 | 28.2% |
| 4+ Person Household | 80 | 23.1% |
| Total Housing Units | 347 | 100.0% |
Occupancy by Ownership by Household Size in Minor
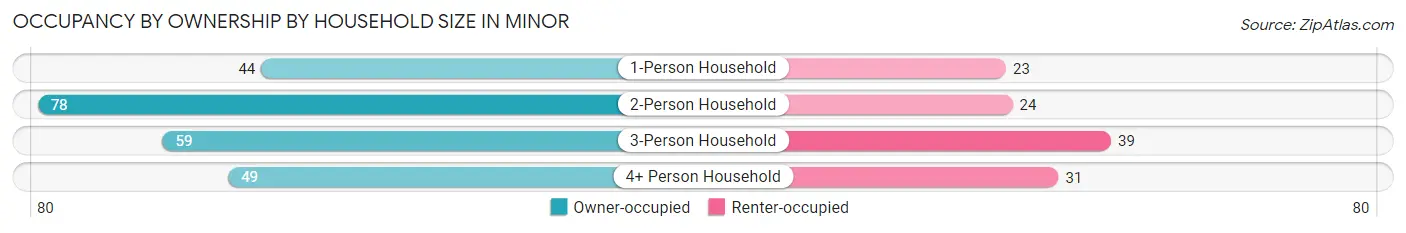
| Household Size | Owner-occupied | Renter-occupied |
| 1-Person Household | 44 (65.7%) | 23 (34.3%) |
| 2-Person Household | 78 (76.5%) | 24 (23.5%) |
| 3-Person Household | 59 (60.2%) | 39 (39.8%) |
| 4+ Person Household | 49 (61.3%) | 31 (38.8%) |
| Total Housing Units | 230 (66.3%) | 117 (33.7%) |
Occupancy by Educational Attainment in Minor
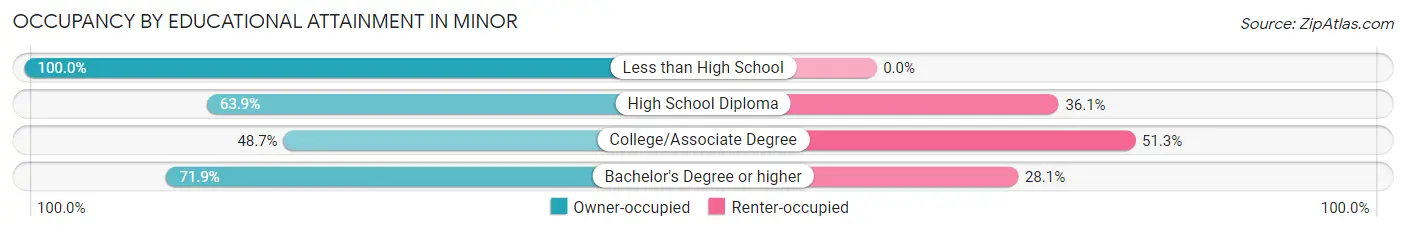
| Household Size | Owner-occupied | Renter-occupied |
| Less than High School | 80 (100.0%) | 0 (0.0%) |
| High School Diploma | 53 (63.9%) | 30 (36.1%) |
| College/Associate Degree | 74 (48.7%) | 78 (51.3%) |
| Bachelor's Degree or higher | 23 (71.9%) | 9 (28.1%) |
Occupancy by Age of Householder in Minor
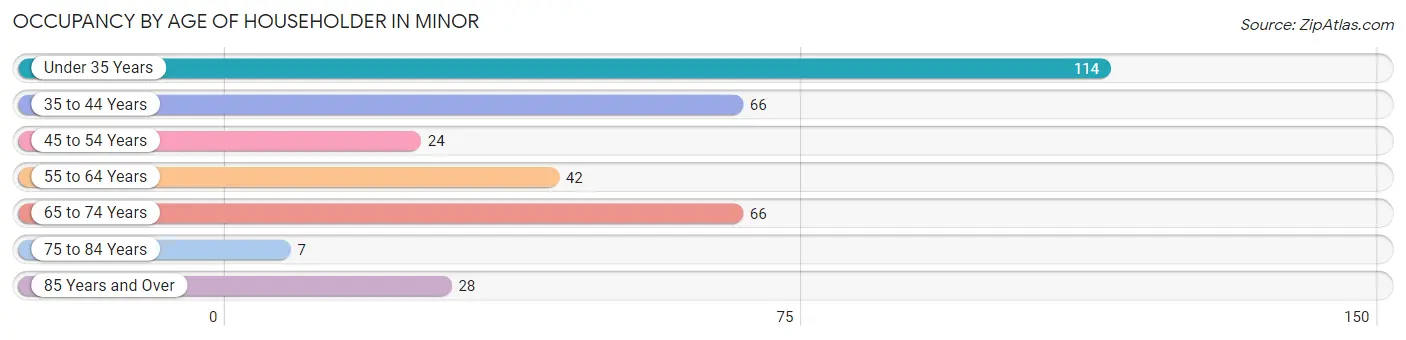
| Age Bracket | # Households | % Households |
| Under 35 Years | 114 | 32.9% |
| 35 to 44 Years | 66 | 19.0% |
| 45 to 54 Years | 24 | 6.9% |
| 55 to 64 Years | 42 | 12.1% |
| 65 to 74 Years | 66 | 19.0% |
| 75 to 84 Years | 7 | 2.0% |
| 85 Years and Over | 28 | 8.1% |
| Total | 347 | 100.0% |
Housing Finances in Minor
Median Income by Occupancy in Minor
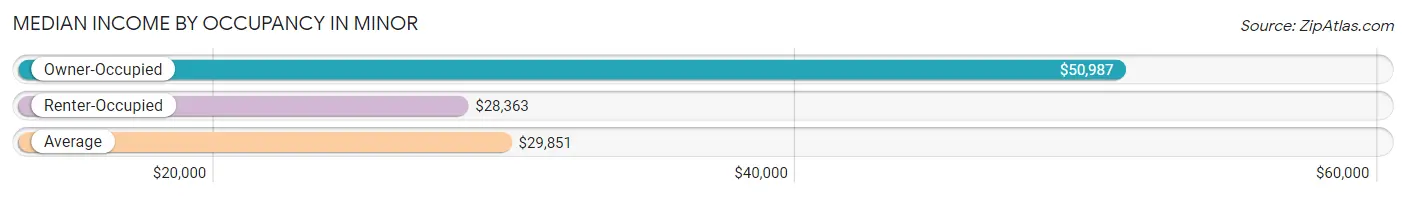
| Occupancy Type | # Households | Median Income |
| Owner-Occupied | 230 (66.3%) | $50,987 |
| Renter-Occupied | 117 (33.7%) | $28,363 |
| Average | 347 (100.0%) | $29,851 |
Occupancy by Householder Income Bracket in Minor
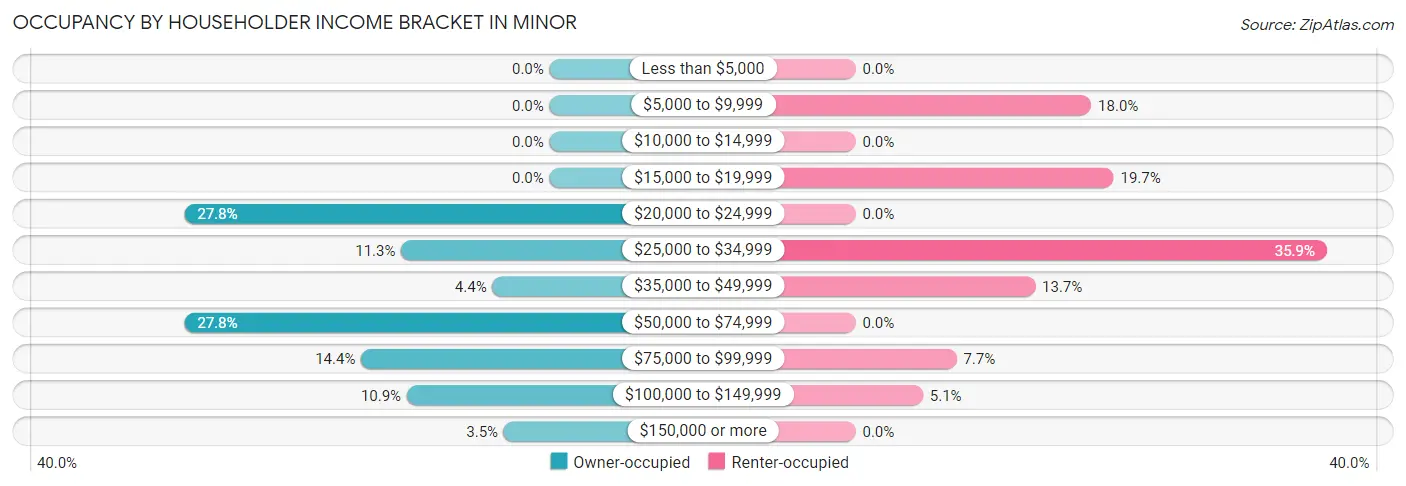
| Income Bracket | Owner-occupied | Renter-occupied |
| Less than $5,000 | 0 (0.0%) | 0 (0.0%) |
| $5,000 to $9,999 | 0 (0.0%) | 21 (17.9%) |
| $10,000 to $14,999 | 0 (0.0%) | 0 (0.0%) |
| $15,000 to $19,999 | 0 (0.0%) | 23 (19.7%) |
| $20,000 to $24,999 | 64 (27.8%) | 0 (0.0%) |
| $25,000 to $34,999 | 26 (11.3%) | 42 (35.9%) |
| $35,000 to $49,999 | 10 (4.3%) | 16 (13.7%) |
| $50,000 to $74,999 | 64 (27.8%) | 0 (0.0%) |
| $75,000 to $99,999 | 33 (14.3%) | 9 (7.7%) |
| $100,000 to $149,999 | 25 (10.9%) | 6 (5.1%) |
| $150,000 or more | 8 (3.5%) | 0 (0.0%) |
| Total | 230 (100.0%) | 117 (100.0%) |
Monthly Housing Cost Tiers in Minor
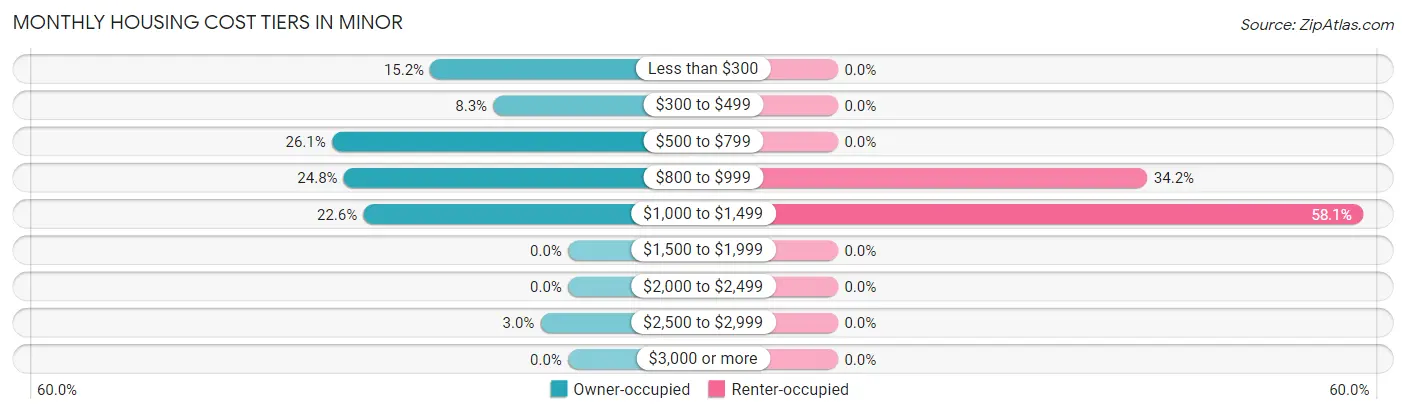
| Monthly Cost | Owner-occupied | Renter-occupied |
| Less than $300 | 35 (15.2%) | 0 (0.0%) |
| $300 to $499 | 19 (8.3%) | 0 (0.0%) |
| $500 to $799 | 60 (26.1%) | 0 (0.0%) |
| $800 to $999 | 57 (24.8%) | 40 (34.2%) |
| $1,000 to $1,499 | 52 (22.6%) | 68 (58.1%) |
| $1,500 to $1,999 | 0 (0.0%) | 0 (0.0%) |
| $2,000 to $2,499 | 0 (0.0%) | 0 (0.0%) |
| $2,500 to $2,999 | 7 (3.0%) | 0 (0.0%) |
| $3,000 or more | 0 (0.0%) | 0 (0.0%) |
| Total | 230 (100.0%) | 117 (100.0%) |
Physical Housing Characteristics in Minor
Housing Structures in Minor
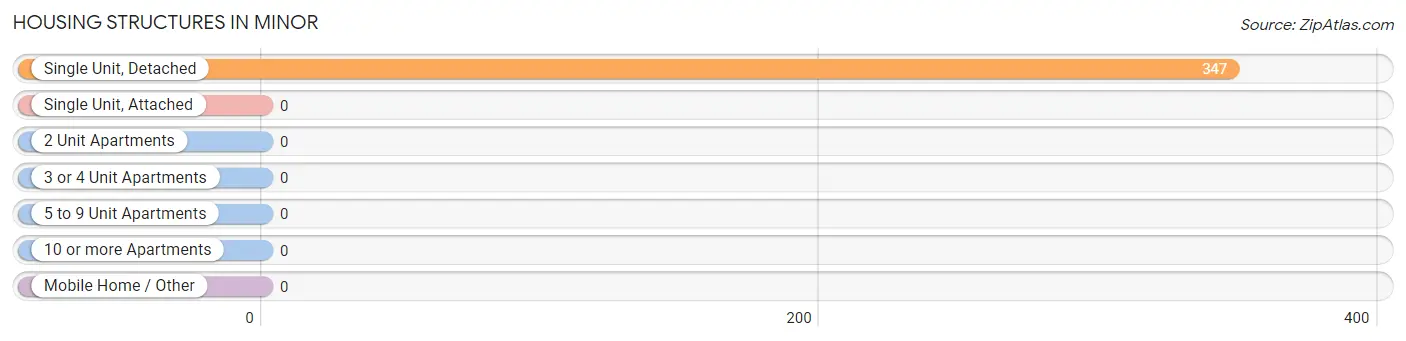
| Structure Type | # Housing Units | % Housing Units |
| Single Unit, Detached | 347 | 100.0% |
| Single Unit, Attached | 0 | 0.0% |
| 2 Unit Apartments | 0 | 0.0% |
| 3 or 4 Unit Apartments | 0 | 0.0% |
| 5 to 9 Unit Apartments | 0 | 0.0% |
| 10 or more Apartments | 0 | 0.0% |
| Mobile Home / Other | 0 | 0.0% |
| Total | 347 | 100.0% |
Housing Structures by Occupancy in Minor
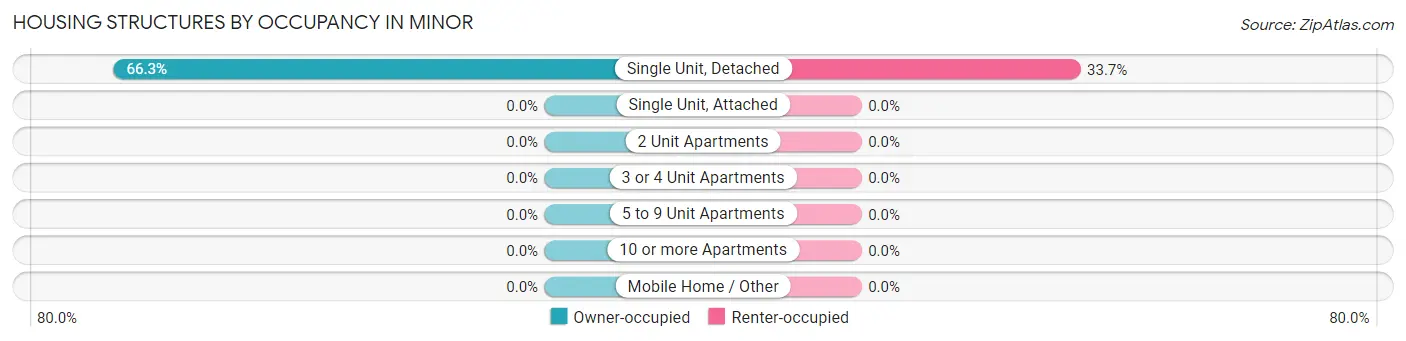
| Structure Type | Owner-occupied | Renter-occupied |
| Single Unit, Detached | 230 (66.3%) | 117 (33.7%) |
| Single Unit, Attached | 0 (0.0%) | 0 (0.0%) |
| 2 Unit Apartments | 0 (0.0%) | 0 (0.0%) |
| 3 or 4 Unit Apartments | 0 (0.0%) | 0 (0.0%) |
| 5 to 9 Unit Apartments | 0 (0.0%) | 0 (0.0%) |
| 10 or more Apartments | 0 (0.0%) | 0 (0.0%) |
| Mobile Home / Other | 0 (0.0%) | 0 (0.0%) |
| Total | 230 (66.3%) | 117 (33.7%) |
Housing Structures by Number of Rooms in Minor
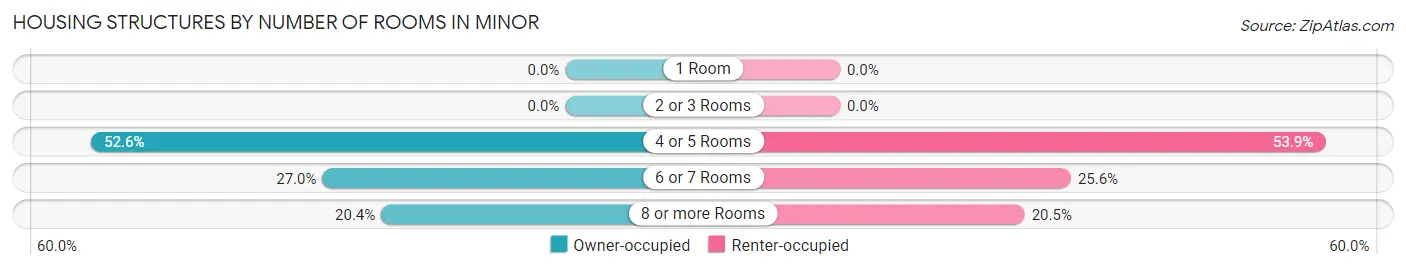
| Number of Rooms | Owner-occupied | Renter-occupied |
| 1 Room | 0 (0.0%) | 0 (0.0%) |
| 2 or 3 Rooms | 0 (0.0%) | 0 (0.0%) |
| 4 or 5 Rooms | 121 (52.6%) | 63 (53.8%) |
| 6 or 7 Rooms | 62 (27.0%) | 30 (25.6%) |
| 8 or more Rooms | 47 (20.4%) | 24 (20.5%) |
| Total | 230 (100.0%) | 117 (100.0%) |
Housing Structure by Heating Type in Minor
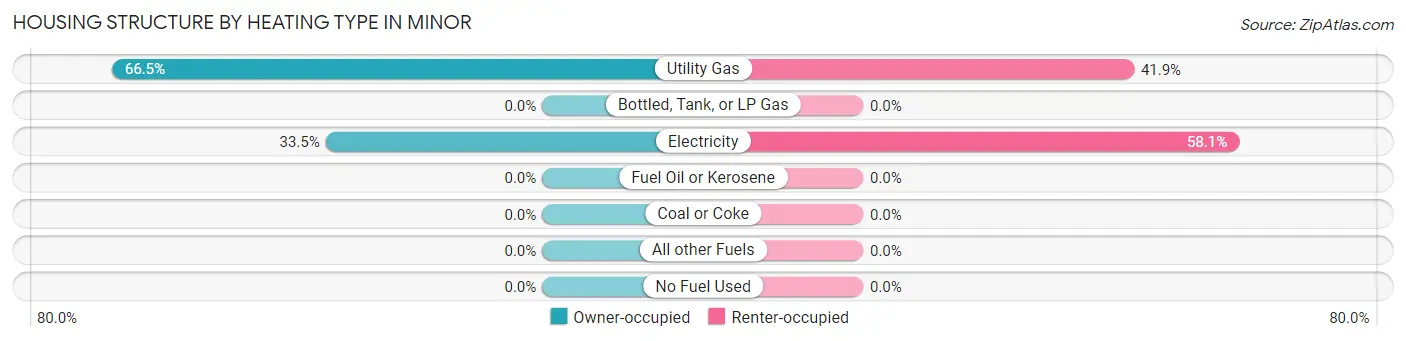
| Heating Type | Owner-occupied | Renter-occupied |
| Utility Gas | 153 (66.5%) | 49 (41.9%) |
| Bottled, Tank, or LP Gas | 0 (0.0%) | 0 (0.0%) |
| Electricity | 77 (33.5%) | 68 (58.1%) |
| Fuel Oil or Kerosene | 0 (0.0%) | 0 (0.0%) |
| Coal or Coke | 0 (0.0%) | 0 (0.0%) |
| All other Fuels | 0 (0.0%) | 0 (0.0%) |
| No Fuel Used | 0 (0.0%) | 0 (0.0%) |
| Total | 230 (100.0%) | 117 (100.0%) |
Household Vehicle Usage in Minor
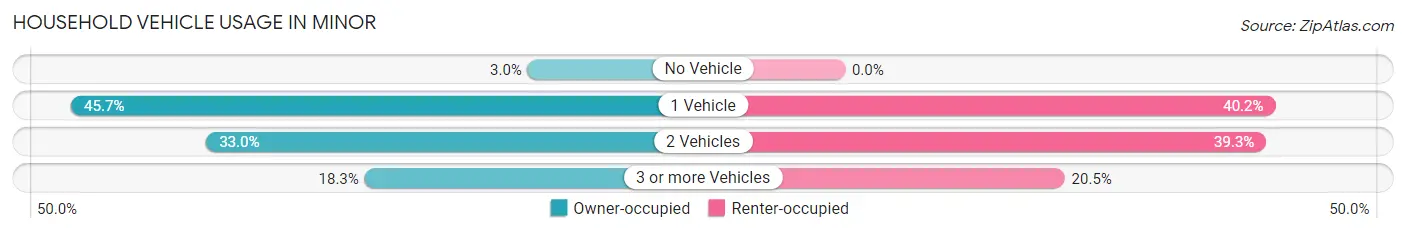
| Vehicles per Household | Owner-occupied | Renter-occupied |
| No Vehicle | 7 (3.0%) | 0 (0.0%) |
| 1 Vehicle | 105 (45.7%) | 47 (40.2%) |
| 2 Vehicles | 76 (33.0%) | 46 (39.3%) |
| 3 or more Vehicles | 42 (18.3%) | 24 (20.5%) |
| Total | 230 (100.0%) | 117 (100.0%) |
Real Estate & Mortgages in Minor
Real Estate and Mortgage Overview in Minor
| Characteristic | Without Mortgage | With Mortgage |
| Housing Units | 80 | 150 |
| Median Property Value | $55,700 | $103,100 |
| Median Household Income | - | - |
| Monthly Housing Costs | $413 | $0 |
| Real Estate Taxes | $514 | $39 |
Property Value by Mortgage Status in Minor
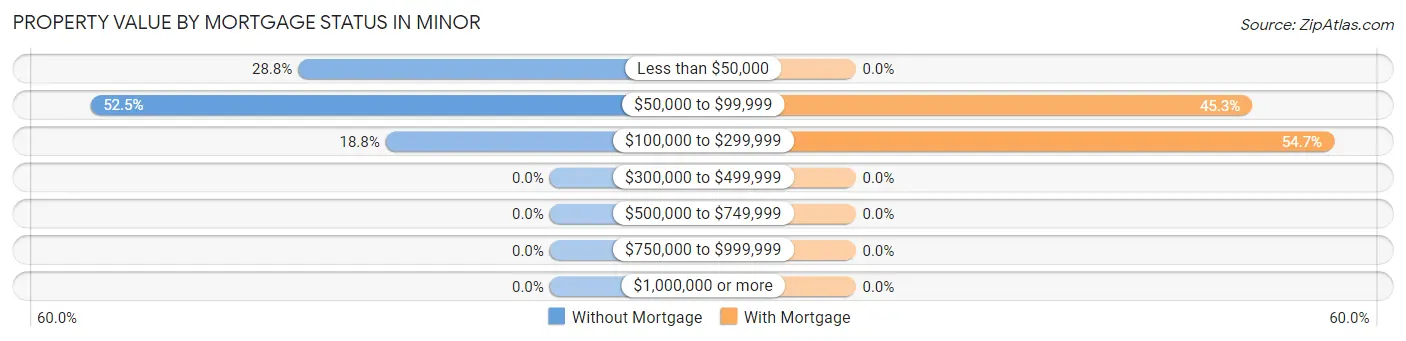
| Property Value | Without Mortgage | With Mortgage |
| Less than $50,000 | 23 (28.7%) | 0 (0.0%) |
| $50,000 to $99,999 | 42 (52.5%) | 68 (45.3%) |
| $100,000 to $299,999 | 15 (18.8%) | 82 (54.7%) |
| $300,000 to $499,999 | 0 (0.0%) | 0 (0.0%) |
| $500,000 to $749,999 | 0 (0.0%) | 0 (0.0%) |
| $750,000 to $999,999 | 0 (0.0%) | 0 (0.0%) |
| $1,000,000 or more | 0 (0.0%) | 0 (0.0%) |
| Total | 80 (100.0%) | 150 (100.0%) |
Household Income by Mortgage Status in Minor
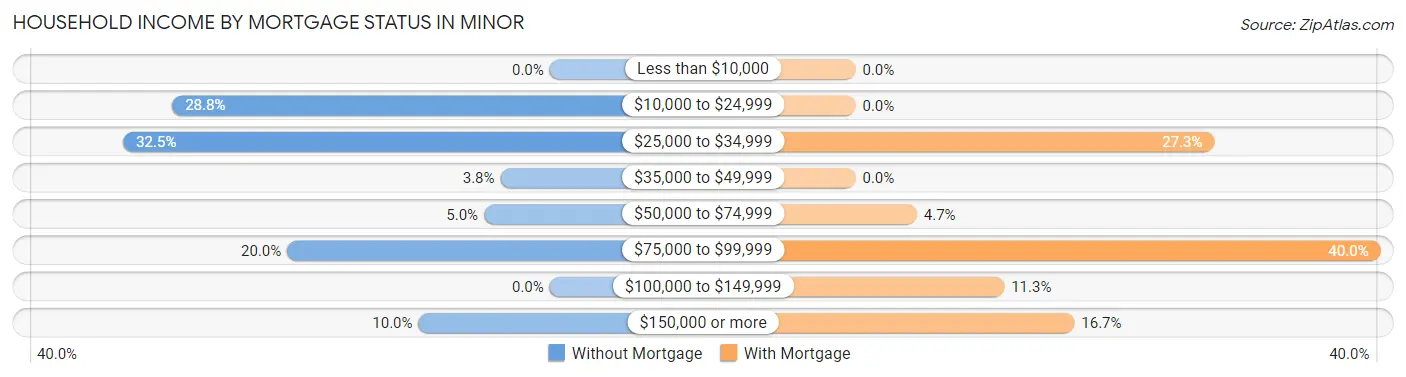
| Household Income | Without Mortgage | With Mortgage |
| Less than $10,000 | 0 (0.0%) | 0 (0.0%) |
| $10,000 to $24,999 | 23 (28.7%) | 0 (0.0%) |
| $25,000 to $34,999 | 26 (32.5%) | 41 (27.3%) |
| $35,000 to $49,999 | 3 (3.7%) | 0 (0.0%) |
| $50,000 to $74,999 | 4 (5.0%) | 7 (4.7%) |
| $75,000 to $99,999 | 16 (20.0%) | 60 (40.0%) |
| $100,000 to $149,999 | 0 (0.0%) | 17 (11.3%) |
| $150,000 or more | 8 (10.0%) | 25 (16.7%) |
| Total | 80 (100.0%) | 150 (100.0%) |
Property Value to Household Income Ratio in Minor
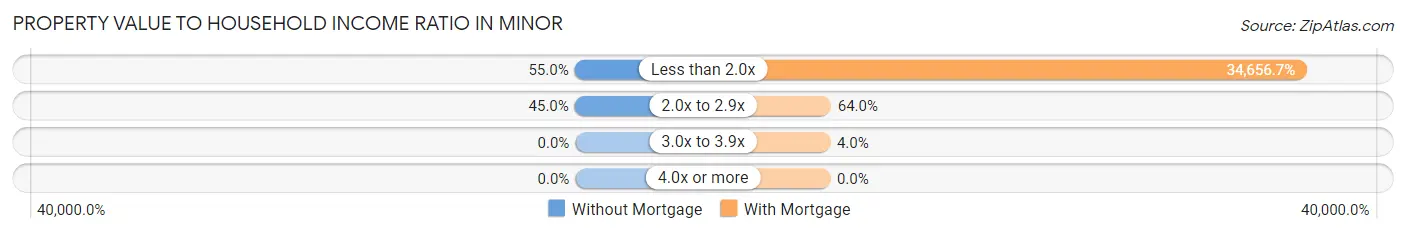
| Value-to-Income Ratio | Without Mortgage | With Mortgage |
| Less than 2.0x | 44 (55.0%) | 51,985 (34,656.7%) |
| 2.0x to 2.9x | 36 (45.0%) | 96 (64.0%) |
| 3.0x to 3.9x | 0 (0.0%) | 6 (4.0%) |
| 4.0x or more | 0 (0.0%) | 0 (0.0%) |
| Total | 80 (100.0%) | 150 (100.0%) |
Real Estate Taxes by Mortgage Status in Minor
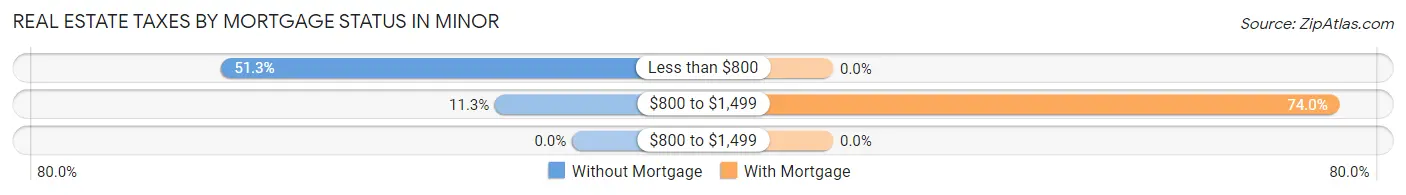
| Property Taxes | Without Mortgage | With Mortgage |
| Less than $800 | 41 (51.2%) | 0 (0.0%) |
| $800 to $1,499 | 9 (11.3%) | 111 (74.0%) |
| $800 to $1,499 | 0 (0.0%) | 0 (0.0%) |
| Total | 80 (100.0%) | 150 (100.0%) |
Health & Disability in Minor
Health Insurance Coverage by Age in Minor
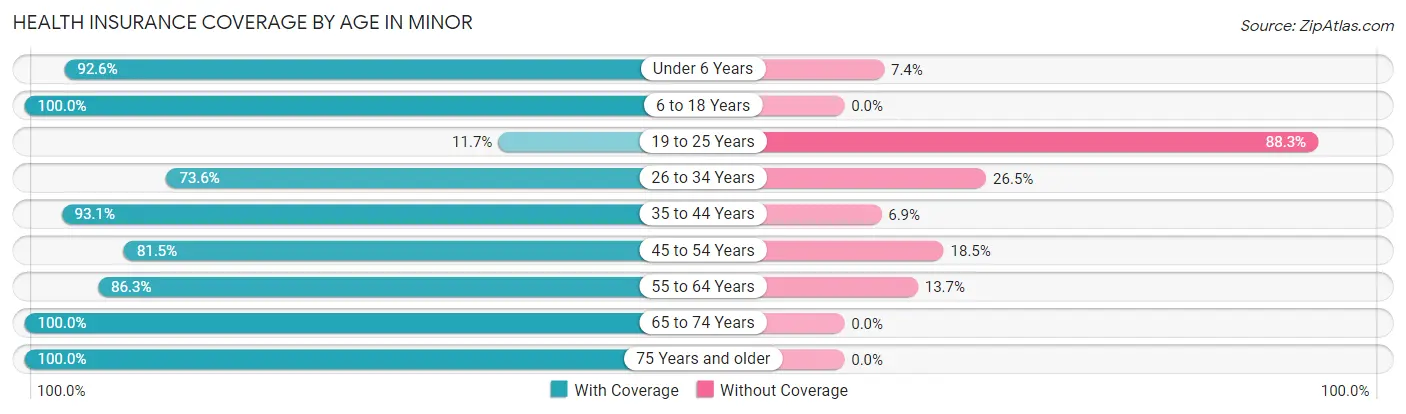
| Age Bracket | With Coverage | Without Coverage |
| Under 6 Years | 200 (92.6%) | 16 (7.4%) |
| 6 to 18 Years | 139 (100.0%) | 0 (0.0%) |
| 19 to 25 Years | 9 (11.7%) | 68 (88.3%) |
| 26 to 34 Years | 114 (73.6%) | 41 (26.5%) |
| 35 to 44 Years | 108 (93.1%) | 8 (6.9%) |
| 45 to 54 Years | 66 (81.5%) | 15 (18.5%) |
| 55 to 64 Years | 63 (86.3%) | 10 (13.7%) |
| 65 to 74 Years | 66 (100.0%) | 0 (0.0%) |
| 75 Years and older | 42 (100.0%) | 0 (0.0%) |
| Total | 807 (83.6%) | 158 (16.4%) |
Health Insurance Coverage by Citizenship Status in Minor
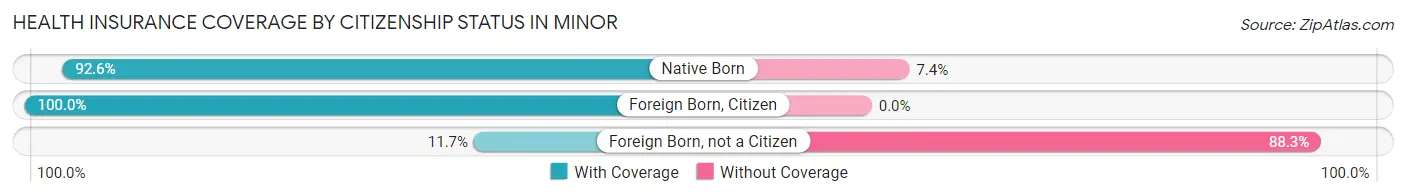
| Citizenship Status | With Coverage | Without Coverage |
| Native Born | 200 (92.6%) | 16 (7.4%) |
| Foreign Born, Citizen | 139 (100.0%) | 0 (0.0%) |
| Foreign Born, not a Citizen | 9 (11.7%) | 68 (88.3%) |
Health Insurance Coverage by Household Income in Minor
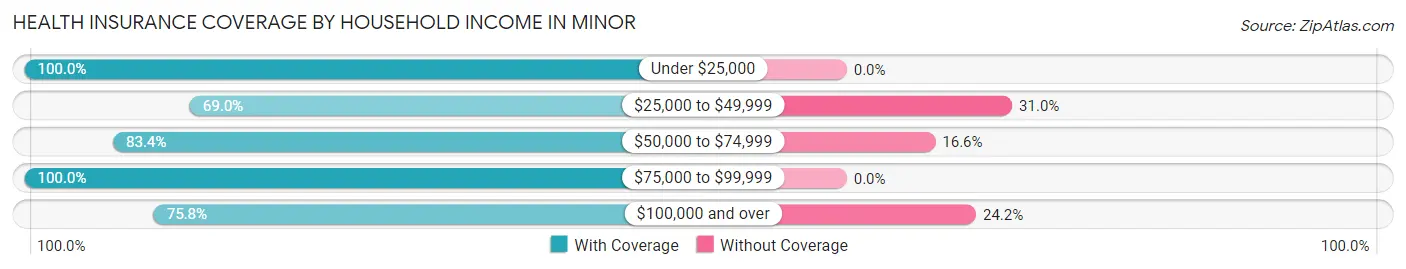
| Household Income | With Coverage | Without Coverage |
| Under $25,000 | 197 (100.0%) | 0 (0.0%) |
| $25,000 to $49,999 | 205 (69.0%) | 92 (31.0%) |
| $50,000 to $74,999 | 176 (83.4%) | 35 (16.6%) |
| $75,000 to $99,999 | 132 (100.0%) | 0 (0.0%) |
| $100,000 and over | 97 (75.8%) | 31 (24.2%) |
Public vs Private Health Insurance Coverage by Age in Minor
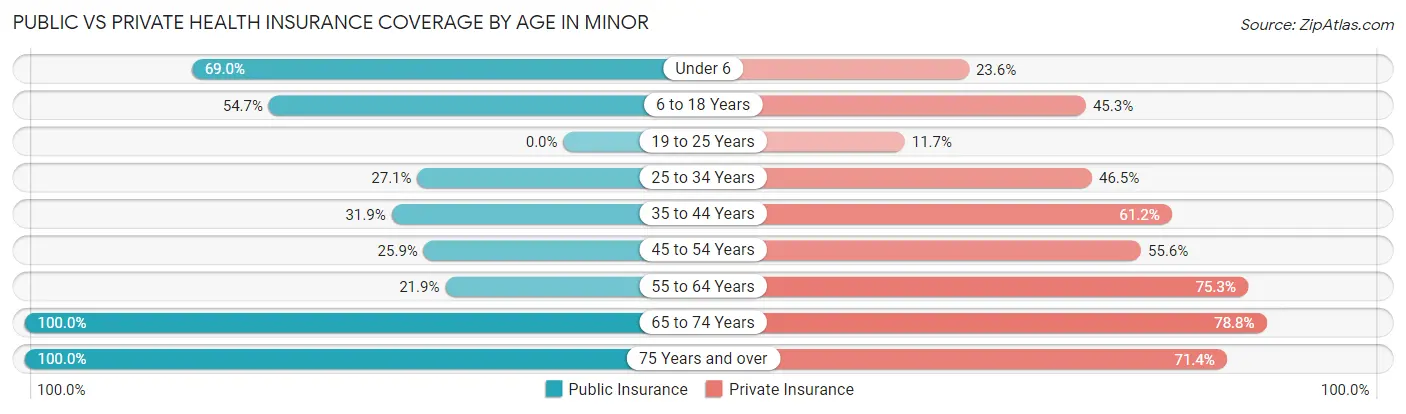
| Age Bracket | Public Insurance | Private Insurance |
| Under 6 | 149 (69.0%) | 51 (23.6%) |
| 6 to 18 Years | 76 (54.7%) | 63 (45.3%) |
| 19 to 25 Years | 0 (0.0%) | 9 (11.7%) |
| 25 to 34 Years | 42 (27.1%) | 72 (46.5%) |
| 35 to 44 Years | 37 (31.9%) | 71 (61.2%) |
| 45 to 54 Years | 21 (25.9%) | 45 (55.6%) |
| 55 to 64 Years | 16 (21.9%) | 55 (75.3%) |
| 65 to 74 Years | 66 (100.0%) | 52 (78.8%) |
| 75 Years and over | 42 (100.0%) | 30 (71.4%) |
| Total | 449 (46.5%) | 448 (46.4%) |
Disability Status by Sex by Age in Minor
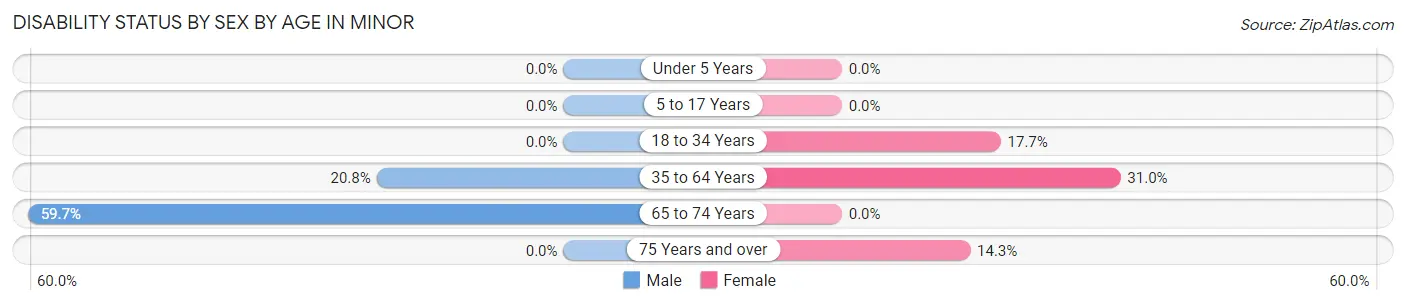
| Age Bracket | Male | Female |
| Under 5 Years | 0 (0.0%) | 0 (0.0%) |
| 5 to 17 Years | 0 (0.0%) | 0 (0.0%) |
| 18 to 34 Years | 0 (0.0%) | 26 (17.7%) |
| 35 to 64 Years | 26 (20.8%) | 45 (31.0%) |
| 65 to 74 Years | 34 (59.7%) | 0 (0.0%) |
| 75 Years and over | 0 (0.0%) | 5 (14.3%) |
Disability Class by Sex by Age in Minor
Disability Class: Hearing Difficulty
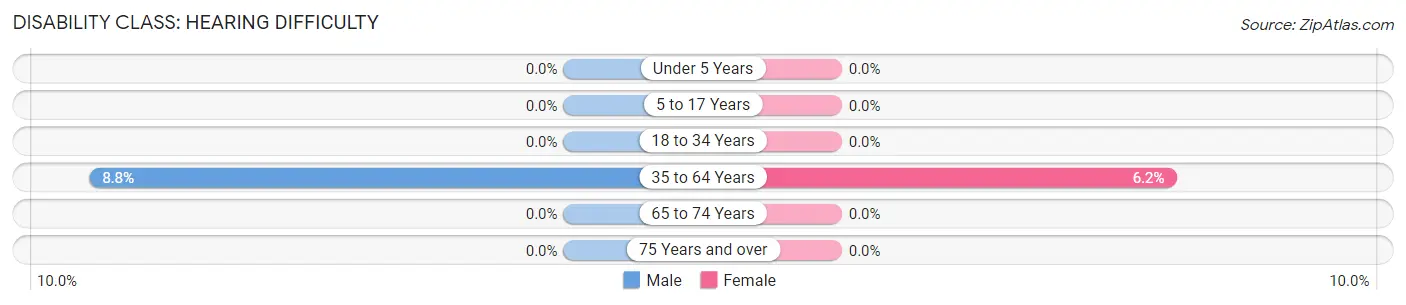
| Age Bracket | Male | Female |
| Under 5 Years | 0 (0.0%) | 0 (0.0%) |
| 5 to 17 Years | 0 (0.0%) | 0 (0.0%) |
| 18 to 34 Years | 0 (0.0%) | 0 (0.0%) |
| 35 to 64 Years | 11 (8.8%) | 9 (6.2%) |
| 65 to 74 Years | 0 (0.0%) | 0 (0.0%) |
| 75 Years and over | 0 (0.0%) | 0 (0.0%) |
Disability Class: Vision Difficulty
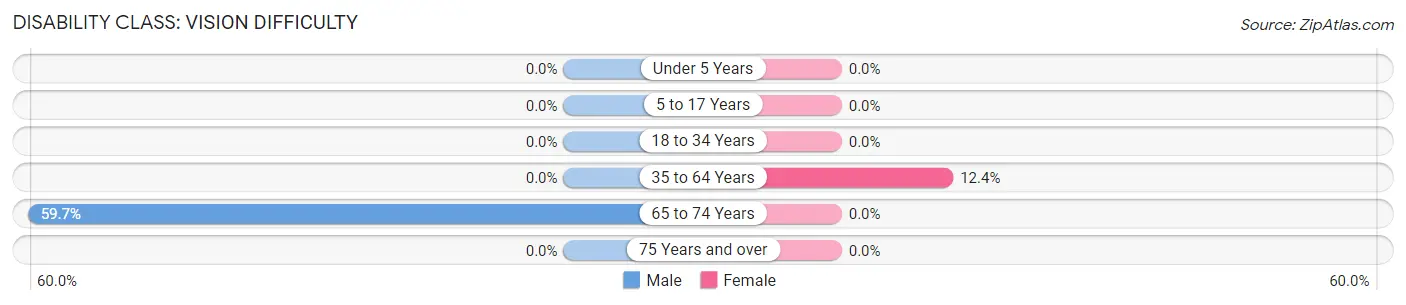
| Age Bracket | Male | Female |
| Under 5 Years | 0 (0.0%) | 0 (0.0%) |
| 5 to 17 Years | 0 (0.0%) | 0 (0.0%) |
| 18 to 34 Years | 0 (0.0%) | 0 (0.0%) |
| 35 to 64 Years | 0 (0.0%) | 18 (12.4%) |
| 65 to 74 Years | 34 (59.7%) | 0 (0.0%) |
| 75 Years and over | 0 (0.0%) | 0 (0.0%) |
Disability Class: Cognitive Difficulty
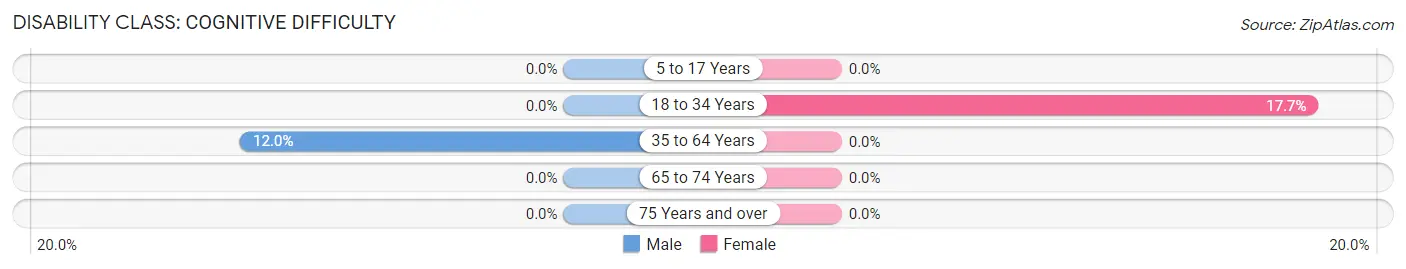
| Age Bracket | Male | Female |
| 5 to 17 Years | 0 (0.0%) | 0 (0.0%) |
| 18 to 34 Years | 0 (0.0%) | 26 (17.7%) |
| 35 to 64 Years | 15 (12.0%) | 0 (0.0%) |
| 65 to 74 Years | 0 (0.0%) | 0 (0.0%) |
| 75 Years and over | 0 (0.0%) | 0 (0.0%) |
Disability Class: Ambulatory Difficulty
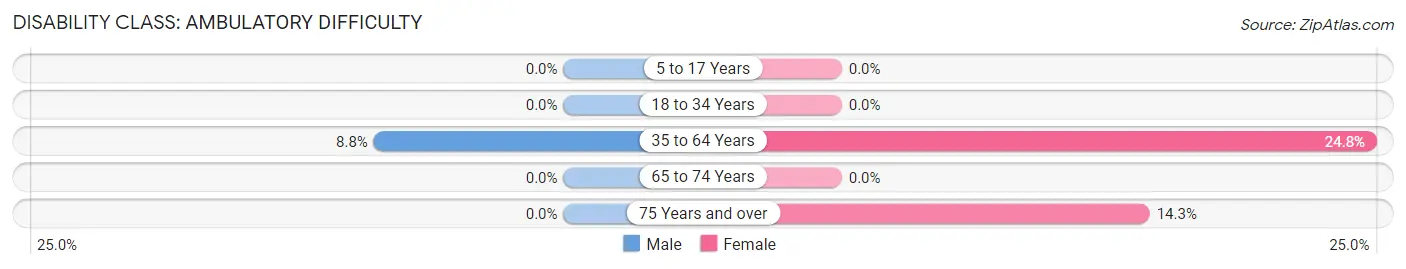
| Age Bracket | Male | Female |
| 5 to 17 Years | 0 (0.0%) | 0 (0.0%) |
| 18 to 34 Years | 0 (0.0%) | 0 (0.0%) |
| 35 to 64 Years | 11 (8.8%) | 36 (24.8%) |
| 65 to 74 Years | 0 (0.0%) | 0 (0.0%) |
| 75 Years and over | 0 (0.0%) | 5 (14.3%) |
Disability Class: Self-Care Difficulty
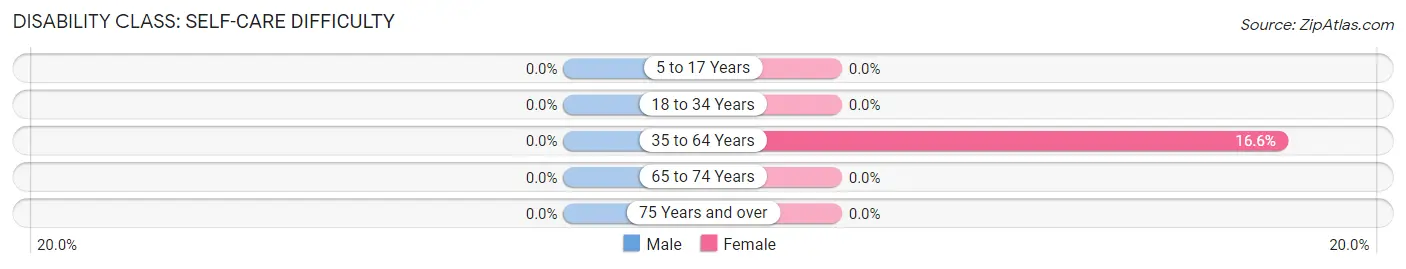
| Age Bracket | Male | Female |
| 5 to 17 Years | 0 (0.0%) | 0 (0.0%) |
| 18 to 34 Years | 0 (0.0%) | 0 (0.0%) |
| 35 to 64 Years | 0 (0.0%) | 24 (16.6%) |
| 65 to 74 Years | 0 (0.0%) | 0 (0.0%) |
| 75 Years and over | 0 (0.0%) | 0 (0.0%) |
Technology Access in Minor
Computing Device Access in Minor
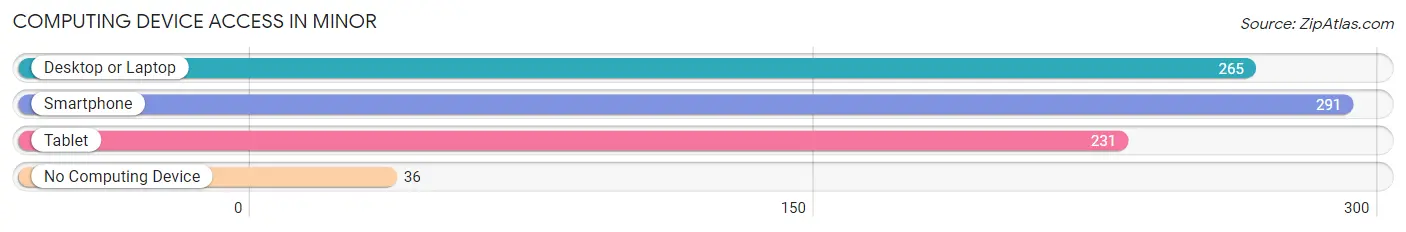
| Device Type | # Households | % Households |
| Desktop or Laptop | 265 | 76.4% |
| Smartphone | 291 | 83.9% |
| Tablet | 231 | 66.6% |
| No Computing Device | 36 | 10.4% |
| Total | 347 | 100.0% |
Internet Access in Minor
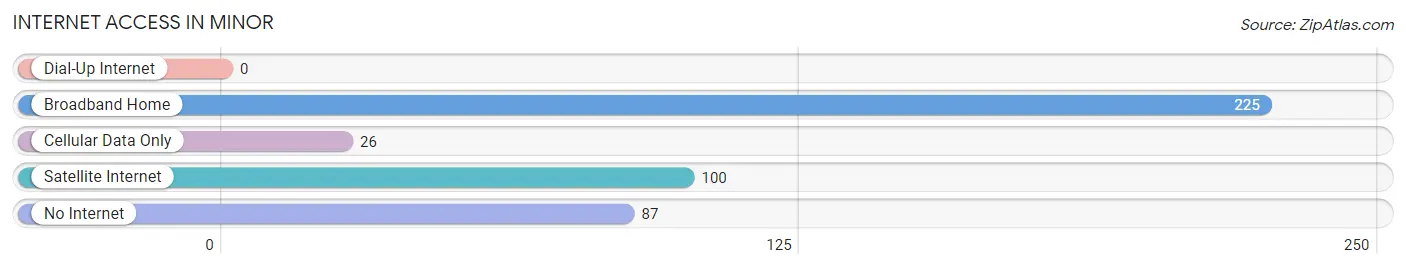
| Internet Type | # Households | % Households |
| Dial-Up Internet | 0 | 0.0% |
| Broadband Home | 225 | 64.8% |
| Cellular Data Only | 26 | 7.5% |
| Satellite Internet | 100 | 28.8% |
| No Internet | 87 | 25.1% |
| Total | 347 | 100.0% |
Minor Summary
Alabama is a state located in the southeastern region of the United States. It is bordered by Tennessee to the north, Georgia to the east, Florida to the south, and Mississippi to the west. Alabama is the 30th largest state in the United States, with an area of 52,419 square miles. It is the 24th most populous state, with a population of 4,887,871 as of 2019.
History
Alabama was first inhabited by Native American tribes, including the Cherokee, Chickasaw, Choctaw, Creek, and Seminole. The first Europeans to explore the area were Spanish explorers in 1540. The area was later colonized by the French in 1702, and then by the British in 1763. In 1817, Alabama became part of the Mississippi Territory, and in 1819, it became the 22nd state admitted to the Union.
During the Civil War, Alabama was a Confederate state. After the war, the state was readmitted to the Union in 1868. During the Reconstruction era, African Americans gained the right to vote and hold office. In the late 19th century, Alabama experienced a period of industrialization and economic growth.
Geography
Alabama is located in the southeastern region of the United States. It is bordered by Tennessee to the north, Georgia to the east, Florida to the south, and Mississippi to the west. Alabama is the 30th largest state in the United States, with an area of 52,419 square miles.
The state is divided into 67 counties. The terrain of Alabama is mostly flat, with the exception of the Appalachian Mountains in the northeast. The state has numerous rivers, including the Alabama, Chattahoochee, Coosa, and Tombigbee. The state also has numerous lakes, including Lake Martin, Lake Guntersville, and Lake Eufaula.
Economy
Alabama’s economy is largely based on agriculture, manufacturing, and services. The state’s agricultural products include poultry, eggs, cattle, and cotton. The state’s manufacturing sector is dominated by the automotive industry, with Honda, Hyundai, and Mercedes-Benz all having plants in the state. The state’s service sector is dominated by healthcare, education, and tourism.
In 2000, the median household income in Alabama was $37,711, and the per capita income was $19,817. The unemployment rate was 4.2%.
Demographics
As of 2019, Alabama’s population was 4,887,871. The state is 68.5% white, 26.2% African American, 2.7% Hispanic or Latino, 1.3% Asian, and 0.7% Native American. The state’s largest cities are Birmingham, Montgomery, Mobile, Huntsville, and Tuscaloosa.
Alabama is a largely rural state, with only about 20% of the population living in urban areas. The state’s largest metropolitan area is the Birmingham-Hoover Metropolitan Area, which has a population of 1,151,801. The state’s capital is Montgomery, which has a population of 201,568.
Common Questions
What is Per Capita Income in Minor?
Per Capita income in Minor is $18,678.
What is the Median Family Income in Minor?
Median Family Income in Minor is $38,929.
What is the Median Household income in Minor?
Median Household Income in Minor is $29,851.
What is Income or Wage Gap in Minor?
Income or Wage Gap in Minor is 19.8%.
Women in Minor earn 80.2 cents for every dollar earned by a man.
What is Inequality or Gini Index in Minor?
Inequality or Gini Index in Minor is 0.39.
What is the Total Population of Minor?
Total Population of Minor is 965.
What is the Total Male Population of Minor?
Total Male Population of Minor is 437.
What is the Total Female Population of Minor?
Total Female Population of Minor is 528.
What is the Ratio of Males per 100 Females in Minor?
There are 82.77 Males per 100 Females in Minor.
What is the Ratio of Females per 100 Males in Minor?
There are 120.82 Females per 100 Males in Minor.
What is the Median Population Age in Minor?
Median Population Age in Minor is 31.0 Years.
What is the Average Family Size in Minor
Average Family Size in Minor is 3.1 People.
What is the Average Household Size in Minor
Average Household Size in Minor is 2.8 People.
How Large is the Labor Force in Minor?
There are 408 People in the Labor Forcein in Minor.
What is the Percentage of People in the Labor Force in Minor?
64.4% of People are in the Labor Force in Minor.
What is the Unemployment Rate in Minor?
Unemployment Rate in Minor is 12.0%.