Talladega, AL Map & Demographics
Talladega Map
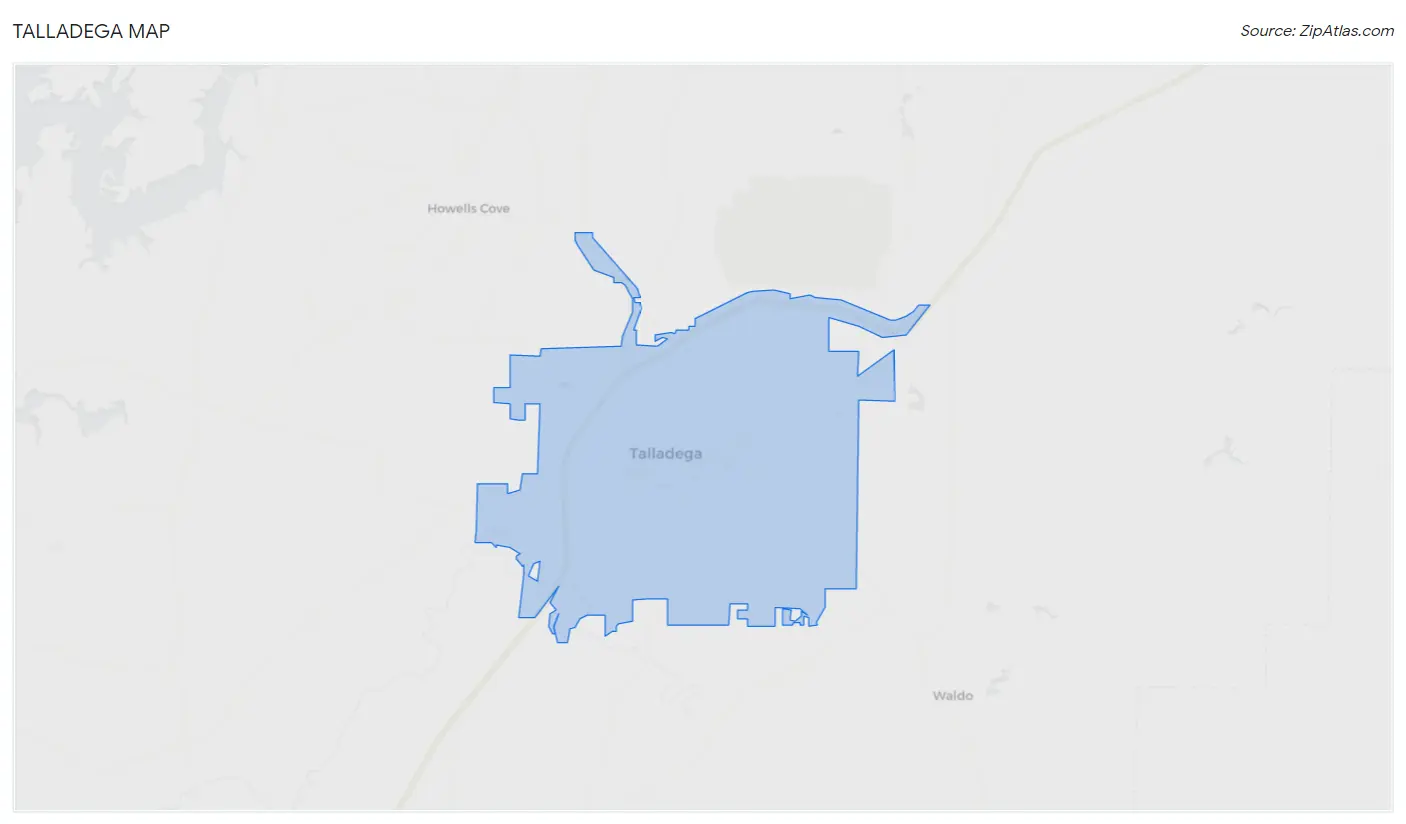
Talladega Overview
$20,856
PER CAPITA INCOME
$47,229
AVG FAMILY INCOME
$37,945
AVG HOUSEHOLD INCOME
22.0%
WAGE / INCOME GAP [ % ]
78.0¢/ $1
WAGE / INCOME GAP [ $ ]
$12,724
FAMILY INCOME DEFICIT
0.49
INEQUALITY / GINI INDEX
15,071
TOTAL POPULATION
7,774
MALE POPULATION
7,297
FEMALE POPULATION
106.54
MALES / 100 FEMALES
93.86
FEMALES / 100 MALES
39.6
MEDIAN AGE
2.8
AVG FAMILY SIZE
2.3
AVG HOUSEHOLD SIZE
5,566
LABOR FORCE [ PEOPLE ]
44.0%
PERCENT IN LABOR FORCE
14.3%
UNEMPLOYMENT RATE
Talladega Zip Codes
Talladega Area Codes
Income in Talladega
Income Overview in Talladega
Per Capita Income in Talladega is $20,856, while median incomes of families and households are $47,229 and $37,945 respectively.
| Characteristic | Number | Measure |
| Per Capita Income | 15,071 | $20,856 |
| Median Family Income | 3,307 | $47,229 |
| Mean Family Income | 3,307 | $60,346 |
| Median Household Income | 5,251 | $37,945 |
| Mean Household Income | 5,251 | $53,813 |
| Income Deficit | 3,307 | $12,724 |
| Wage / Income Gap (%) | 15,071 | 21.98% |
| Wage / Income Gap ($) | 15,071 | 78.02¢ per $1 |
| Gini / Inequality Index | 15,071 | 0.49 |
Earnings by Sex in Talladega
Average Earnings in Talladega are $27,323, $31,996 for men and $24,962 for women, a difference of 22.0%.
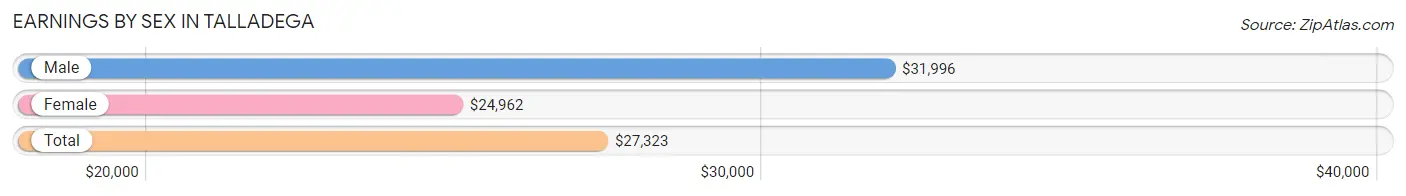
| Sex | Number | Average Earnings |
| Male | 3,294 (51.7%) | $31,996 |
| Female | 3,072 (48.3%) | $24,962 |
| Total | 6,366 (100.0%) | $27,323 |
Earnings by Sex by Income Bracket in Talladega
The most common earnings brackets in Talladega are $2,499 or less for men (350 | 10.6%) and $55,000 to $64,999 for women (342 | 11.1%).
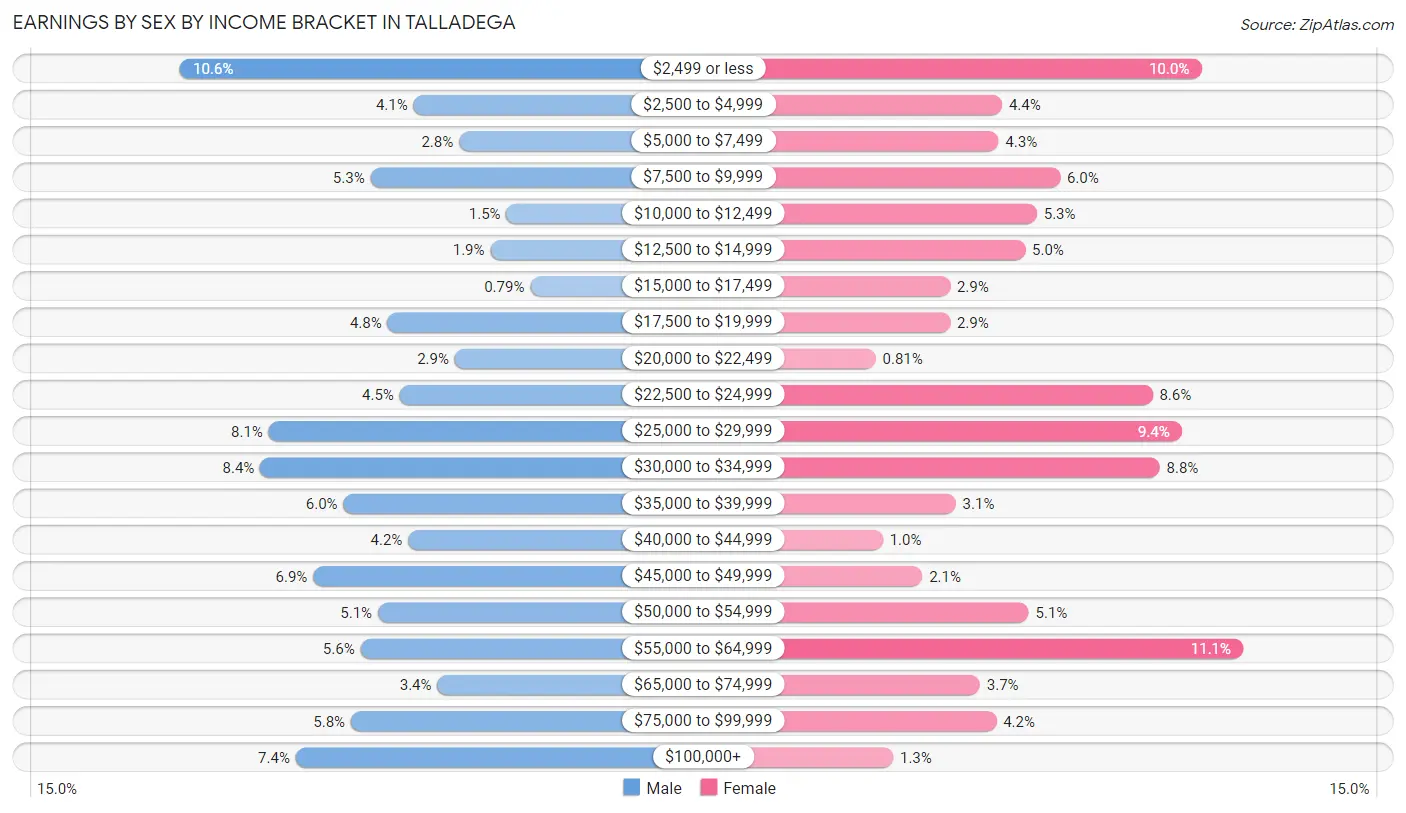
| Income | Male | Female |
| $2,499 or less | 350 (10.6%) | 306 (10.0%) |
| $2,500 to $4,999 | 134 (4.1%) | 134 (4.4%) |
| $5,000 to $7,499 | 92 (2.8%) | 131 (4.3%) |
| $7,500 to $9,999 | 174 (5.3%) | 184 (6.0%) |
| $10,000 to $12,499 | 48 (1.5%) | 164 (5.3%) |
| $12,500 to $14,999 | 63 (1.9%) | 154 (5.0%) |
| $15,000 to $17,499 | 26 (0.8%) | 89 (2.9%) |
| $17,500 to $19,999 | 158 (4.8%) | 89 (2.9%) |
| $20,000 to $22,499 | 96 (2.9%) | 25 (0.8%) |
| $22,500 to $24,999 | 147 (4.5%) | 264 (8.6%) |
| $25,000 to $29,999 | 268 (8.1%) | 289 (9.4%) |
| $30,000 to $34,999 | 276 (8.4%) | 270 (8.8%) |
| $35,000 to $39,999 | 199 (6.0%) | 94 (3.1%) |
| $40,000 to $44,999 | 139 (4.2%) | 31 (1.0%) |
| $45,000 to $49,999 | 227 (6.9%) | 65 (2.1%) |
| $50,000 to $54,999 | 167 (5.1%) | 157 (5.1%) |
| $55,000 to $64,999 | 183 (5.6%) | 342 (11.1%) |
| $65,000 to $74,999 | 112 (3.4%) | 115 (3.7%) |
| $75,000 to $99,999 | 192 (5.8%) | 129 (4.2%) |
| $100,000+ | 243 (7.4%) | 40 (1.3%) |
| Total | 3,294 (100.0%) | 3,072 (100.0%) |
Earnings by Sex by Educational Attainment in Talladega
Average earnings in Talladega are $34,685 for men and $29,645 for women, a difference of 14.5%. Men with an educational attainment of graduate degree enjoy the highest average annual earnings of $125,304, while those with less than high school education earn the least with $30,161. Women with an educational attainment of graduate degree earn the most with the average annual earnings of $54,628, while those with less than high school education have the smallest earnings of $14,963.
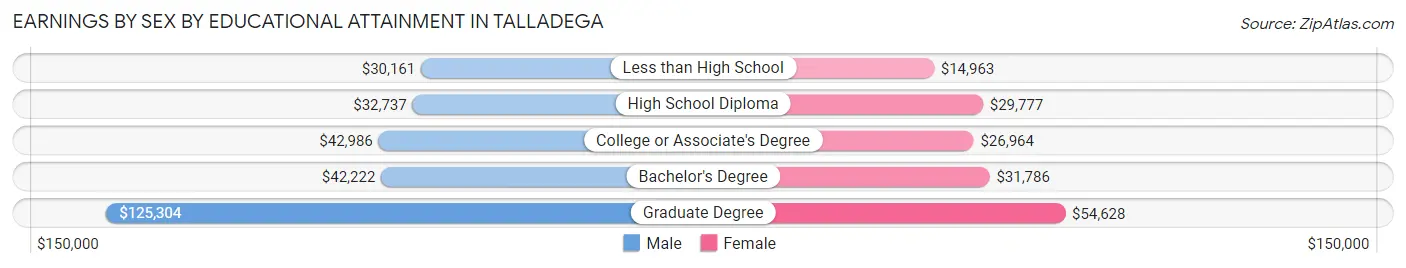
| Educational Attainment | Male Income | Female Income |
| Less than High School | $30,161 | $14,963 |
| High School Diploma | $32,737 | $29,777 |
| College or Associate's Degree | $42,986 | $26,964 |
| Bachelor's Degree | $42,222 | $31,786 |
| Graduate Degree | $125,304 | $54,628 |
| Total | $34,685 | $29,645 |
Family Income in Talladega
Family Income Brackets in Talladega
According to the Talladega family income data, there are 599 families falling into the $50,000 to $74,999 income range, which is the most common income bracket and makes up 18.1% of all families. Conversely, the $200,000+ income bracket is the least frequent group with only 89 families (2.7%) belonging to this category.
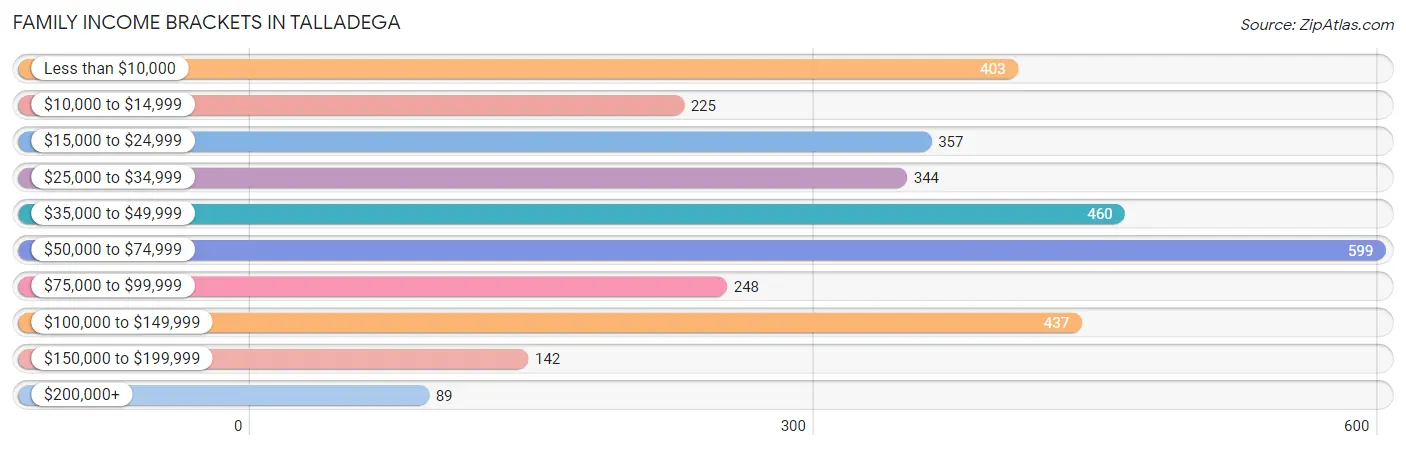
| Income Bracket | # Families | % Families |
| Less than $10,000 | 403 | 12.2% |
| $10,000 to $14,999 | 225 | 6.8% |
| $15,000 to $24,999 | 357 | 10.8% |
| $25,000 to $34,999 | 344 | 10.4% |
| $35,000 to $49,999 | 460 | 13.9% |
| $50,000 to $74,999 | 599 | 18.1% |
| $75,000 to $99,999 | 248 | 7.5% |
| $100,000 to $149,999 | 437 | 13.2% |
| $150,000 to $199,999 | 142 | 4.3% |
| $200,000+ | 89 | 2.7% |
Family Income by Famaliy Size in Talladega
7+ person families (20 | 0.6%) account for the highest median family income in Talladega with $146,750 per family, while 7+ person families (20 | 0.6%) have the highest median income of $20,964 per family member.
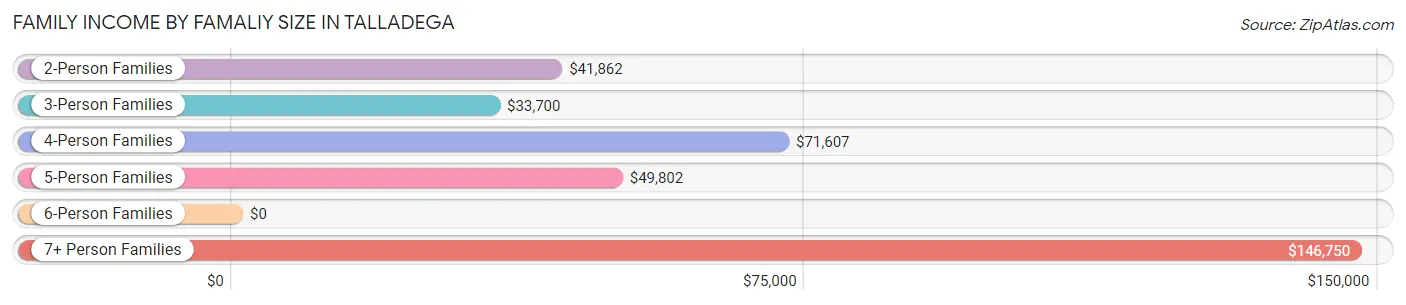
| Income Bracket | # Families | Median Income |
| 2-Person Families | 1,734 (52.4%) | $41,862 |
| 3-Person Families | 678 (20.5%) | $33,700 |
| 4-Person Families | 635 (19.2%) | $71,607 |
| 5-Person Families | 218 (6.6%) | $49,802 |
| 6-Person Families | 22 (0.7%) | $0 |
| 7+ Person Families | 20 (0.6%) | $146,750 |
| Total | 3,307 (100.0%) | $47,229 |
Family Income by Number of Earners in Talladega
The median family income in Talladega is $47,229, with families comprising 3+ earners (311) having the highest median family income of $131,750, while families with no earners (940) have the lowest median family income of $25,100, accounting for 9.4% and 28.4% of families, respectively.
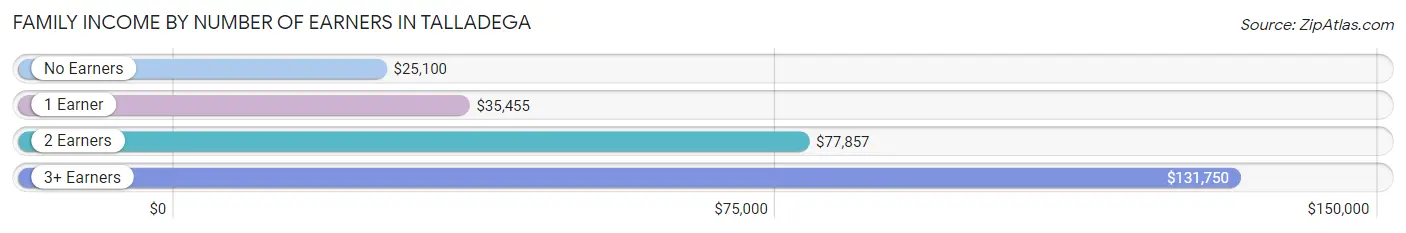
| Number of Earners | # Families | Median Income |
| No Earners | 940 (28.4%) | $25,100 |
| 1 Earner | 1,160 (35.1%) | $35,455 |
| 2 Earners | 896 (27.1%) | $77,857 |
| 3+ Earners | 311 (9.4%) | $131,750 |
| Total | 3,307 (100.0%) | $47,229 |
Household Income in Talladega
Household Income Brackets in Talladega
With 830 households falling in the category, the $15,000 to $24,999 income range is the most frequent in Talladega, accounting for 15.8% of all households. In contrast, only 137 households (2.6%) fall into the $200,000+ income bracket, making it the least populous group.
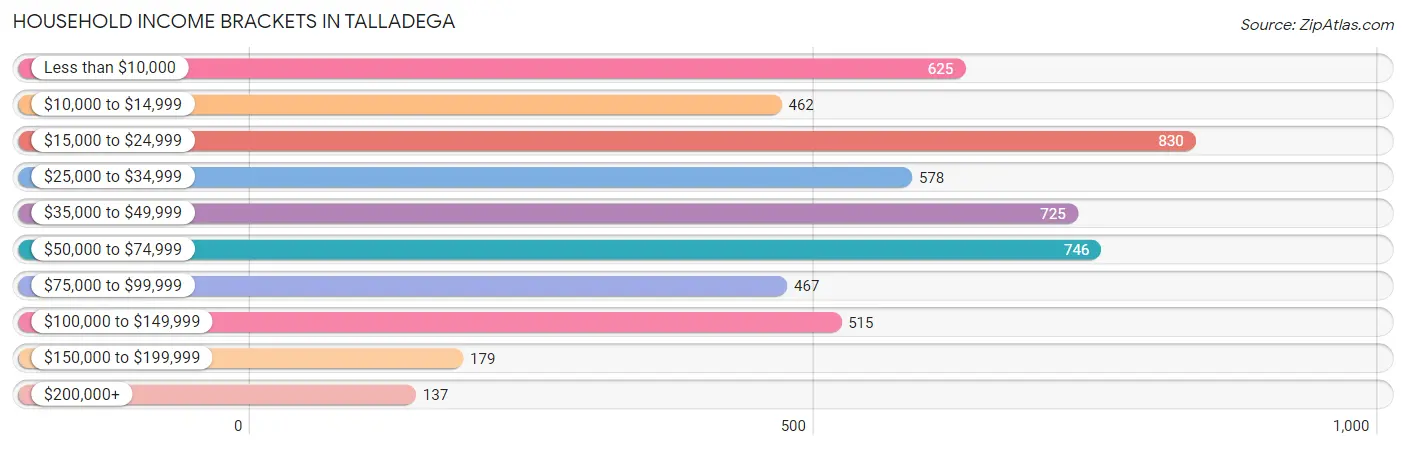
| Income Bracket | # Households | % Households |
| Less than $10,000 | 625 | 11.9% |
| $10,000 to $14,999 | 462 | 8.8% |
| $15,000 to $24,999 | 830 | 15.8% |
| $25,000 to $34,999 | 578 | 11.0% |
| $35,000 to $49,999 | 725 | 13.8% |
| $50,000 to $74,999 | 746 | 14.2% |
| $75,000 to $99,999 | 467 | 8.9% |
| $100,000 to $149,999 | 515 | 9.8% |
| $150,000 to $199,999 | 179 | 3.4% |
| $200,000+ | 137 | 2.6% |
Household Income by Householder Age in Talladega
The median household income in Talladega is $37,945, with the highest median household income of $45,743 found in the 45 to 64 years age bracket for the primary householder. A total of 2,030 households (38.7%) fall into this category. Meanwhile, the 15 to 24 years age bracket for the primary householder has the lowest median household income of $15,859, with 181 households (3.5%) in this group.
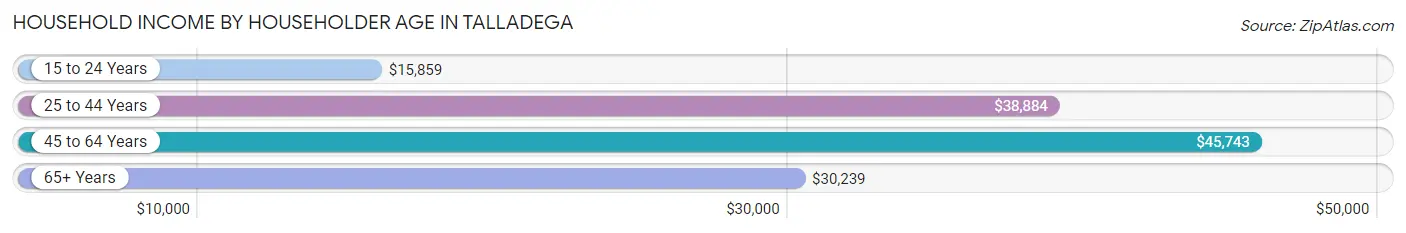
| Income Bracket | # Households | Median Income |
| 15 to 24 Years | 181 (3.5%) | $15,859 |
| 25 to 44 Years | 1,447 (27.6%) | $38,884 |
| 45 to 64 Years | 2,030 (38.7%) | $45,743 |
| 65+ Years | 1,593 (30.3%) | $30,239 |
| Total | 5,251 (100.0%) | $37,945 |
Poverty in Talladega
Income Below Poverty by Sex and Age in Talladega
With 27.6% poverty level for males and 30.0% for females among the residents of Talladega, 5 year old males and 5 year old females are the most vulnerable to poverty, with 74 males (100.0%) and 27 females (100.0%) in their respective age groups living below the poverty level.
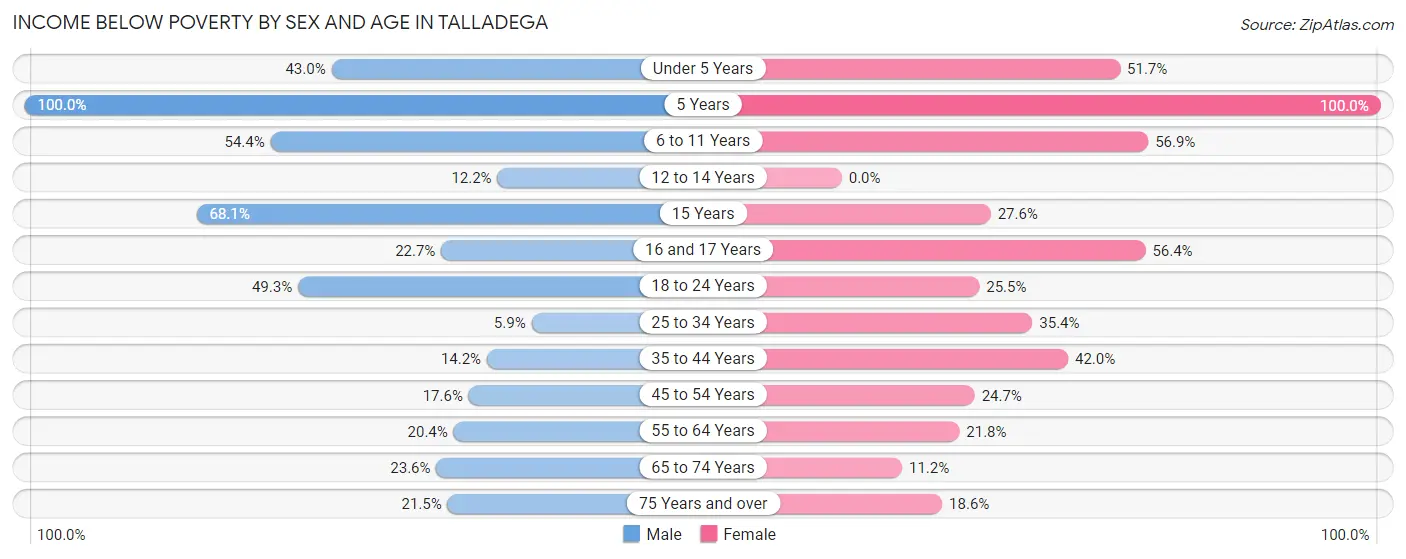
| Age Bracket | Male | Female |
| Under 5 Years | 136 (43.0%) | 171 (51.7%) |
| 5 Years | 74 (100.0%) | 27 (100.0%) |
| 6 to 11 Years | 281 (54.3%) | 211 (56.9%) |
| 12 to 14 Years | 17 (12.2%) | 0 (0.0%) |
| 15 Years | 32 (68.1%) | 34 (27.6%) |
| 16 and 17 Years | 34 (22.7%) | 62 (56.4%) |
| 18 to 24 Years | 367 (49.3%) | 148 (25.5%) |
| 25 to 34 Years | 37 (5.9%) | 295 (35.4%) |
| 35 to 44 Years | 77 (14.2%) | 391 (42.0%) |
| 45 to 54 Years | 138 (17.6%) | 226 (24.7%) |
| 55 to 64 Years | 163 (20.4%) | 170 (21.8%) |
| 65 to 74 Years | 132 (23.6%) | 98 (11.2%) |
| 75 Years and over | 92 (21.5%) | 90 (18.6%) |
| Total | 1,580 (27.6%) | 1,923 (30.0%) |
Income Above Poverty by Sex and Age in Talladega
According to the poverty statistics in Talladega, males aged 25 to 34 years and females aged 12 to 14 years are the age groups that are most secure financially, with 94.1% of males and 100.0% of females in these age groups living above the poverty line.
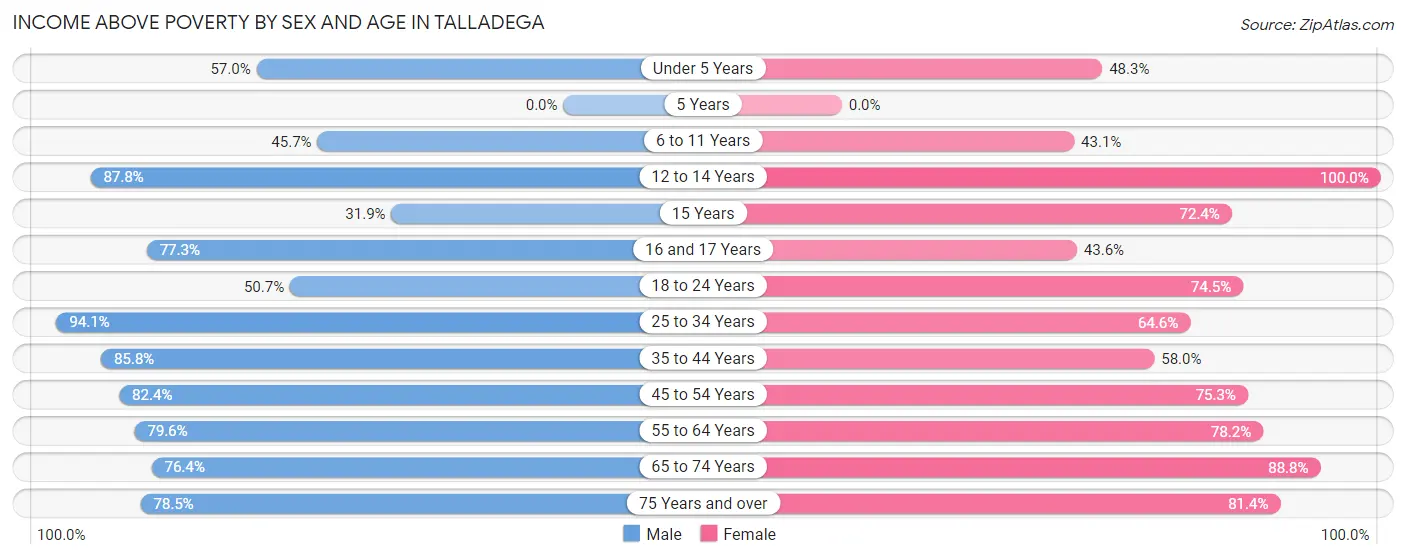
| Age Bracket | Male | Female |
| Under 5 Years | 180 (57.0%) | 160 (48.3%) |
| 5 Years | 0 (0.0%) | 0 (0.0%) |
| 6 to 11 Years | 236 (45.7%) | 160 (43.1%) |
| 12 to 14 Years | 122 (87.8%) | 52 (100.0%) |
| 15 Years | 15 (31.9%) | 89 (72.4%) |
| 16 and 17 Years | 116 (77.3%) | 48 (43.6%) |
| 18 to 24 Years | 378 (50.7%) | 432 (74.5%) |
| 25 to 34 Years | 589 (94.1%) | 539 (64.6%) |
| 35 to 44 Years | 466 (85.8%) | 540 (58.0%) |
| 45 to 54 Years | 648 (82.4%) | 690 (75.3%) |
| 55 to 64 Years | 637 (79.6%) | 609 (78.2%) |
| 65 to 74 Years | 428 (76.4%) | 778 (88.8%) |
| 75 Years and over | 336 (78.5%) | 393 (81.4%) |
| Total | 4,151 (72.4%) | 4,490 (70.0%) |
Income Below Poverty Among Married-Couple Families in Talladega
The poverty statistics for married-couple families in Talladega show that 7.2% or 130 of the total 1,806 families live below the poverty line. Families with 1 or 2 children have the highest poverty rate of 7.8%, comprising of 37 families. On the other hand, families with 3 or 4 children have the lowest poverty rate of 0.0%, which includes 0 families.
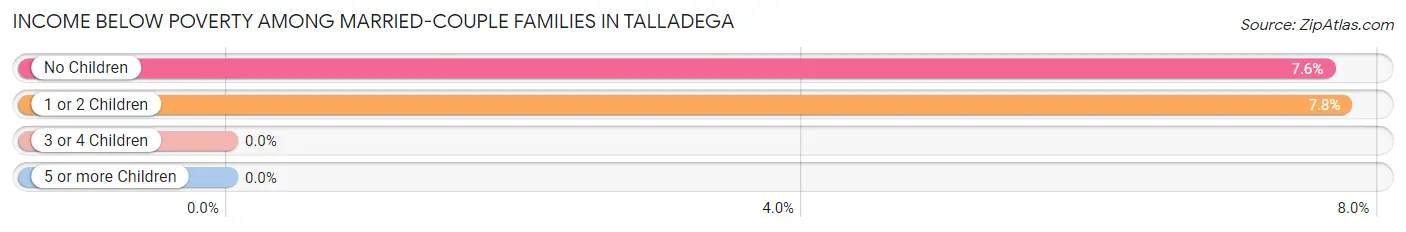
| Children | Above Poverty | Below Poverty |
| No Children | 1,125 (92.4%) | 93 (7.6%) |
| 1 or 2 Children | 440 (92.2%) | 37 (7.8%) |
| 3 or 4 Children | 111 (100.0%) | 0 (0.0%) |
| 5 or more Children | 0 (0.0%) | 0 (0.0%) |
| Total | 1,676 (92.8%) | 130 (7.2%) |
Income Below Poverty Among Single-Parent Households in Talladega
According to the poverty data in Talladega, 20.3% or 51 single-father households and 59.1% or 739 single-mother households are living below the poverty line. Among single-father households, those with 1 or 2 children have the highest poverty rate, with 44 households (46.8%) experiencing poverty. Likewise, among single-mother households, those with 3 or 4 children have the highest poverty rate, with 139 households (88.5%) falling below the poverty line.
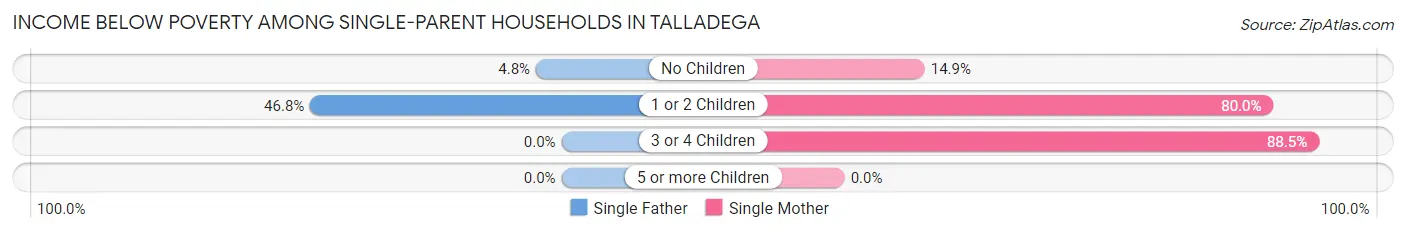
| Children | Single Father | Single Mother |
| No Children | 7 (4.8%) | 63 (14.9%) |
| 1 or 2 Children | 44 (46.8%) | 537 (80.0%) |
| 3 or 4 Children | 0 (0.0%) | 139 (88.5%) |
| 5 or more Children | 0 (0.0%) | 0 (0.0%) |
| Total | 51 (20.3%) | 739 (59.1%) |
Income Below Poverty Among Married-Couple vs Single-Parent Households in Talladega
The poverty data for Talladega shows that 130 of the married-couple family households (7.2%) and 790 of the single-parent households (52.6%) are living below the poverty level. Within the married-couple family households, those with 1 or 2 children have the highest poverty rate, with 37 households (7.8%) falling below the poverty line. Among the single-parent households, those with 3 or 4 children have the highest poverty rate, with 139 household (88.5%) living below poverty.
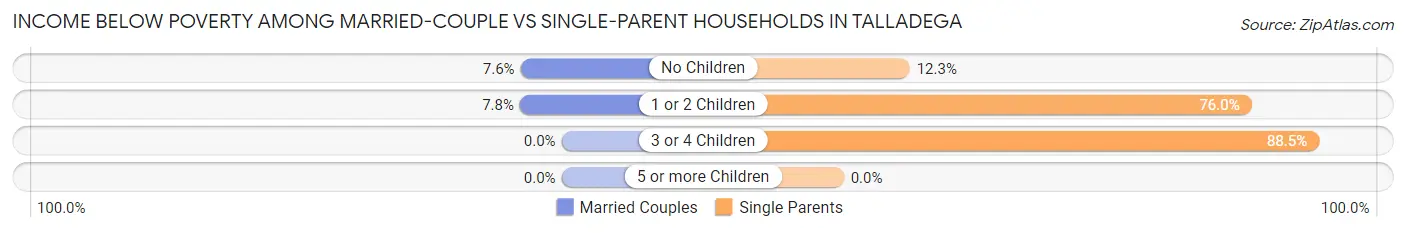
| Children | Married-Couple Families | Single-Parent Households |
| No Children | 93 (7.6%) | 70 (12.3%) |
| 1 or 2 Children | 37 (7.8%) | 581 (75.9%) |
| 3 or 4 Children | 0 (0.0%) | 139 (88.5%) |
| 5 or more Children | 0 (0.0%) | 0 (0.0%) |
| Total | 130 (7.2%) | 790 (52.6%) |
Race in Talladega
The most populous races in Talladega are Black / African American (8,132 | 54.0%), White / Caucasian (6,173 | 41.0%), and Hispanic or Latino (847 | 5.6%).
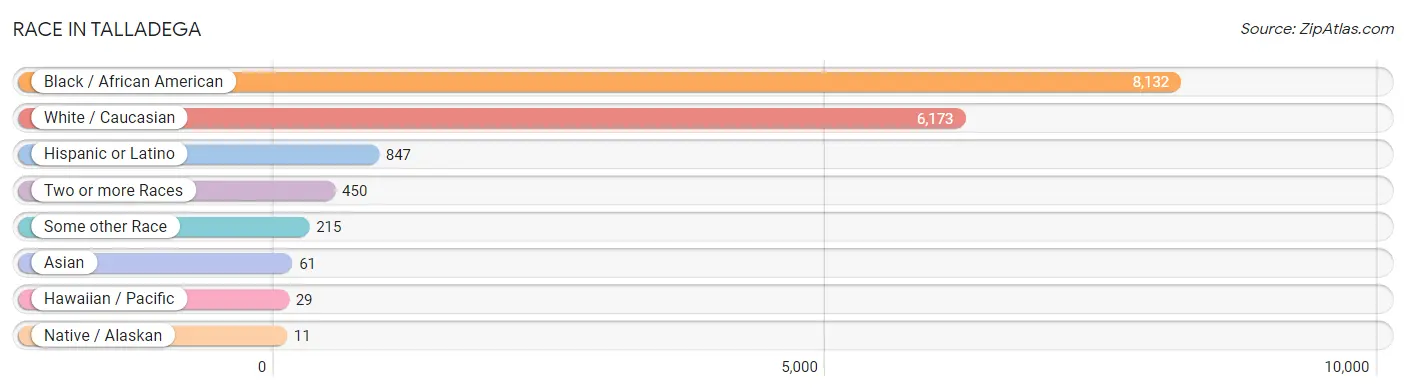
| Race | # Population | % Population |
| Asian | 61 | 0.4% |
| Black / African American | 8,132 | 54.0% |
| Hawaiian / Pacific | 29 | 0.2% |
| Hispanic or Latino | 847 | 5.6% |
| Native / Alaskan | 11 | 0.1% |
| White / Caucasian | 6,173 | 41.0% |
| Two or more Races | 450 | 3.0% |
| Some other Race | 215 | 1.4% |
| Total | 15,071 | 100.0% |
Ancestry in Talladega
The most populous ancestries reported in Talladega are American (2,141 | 14.2%), English (876 | 5.8%), Irish (727 | 4.8%), Mexican (547 | 3.6%), and Scottish (312 | 2.1%), together accounting for 30.5% of all Talladega residents.
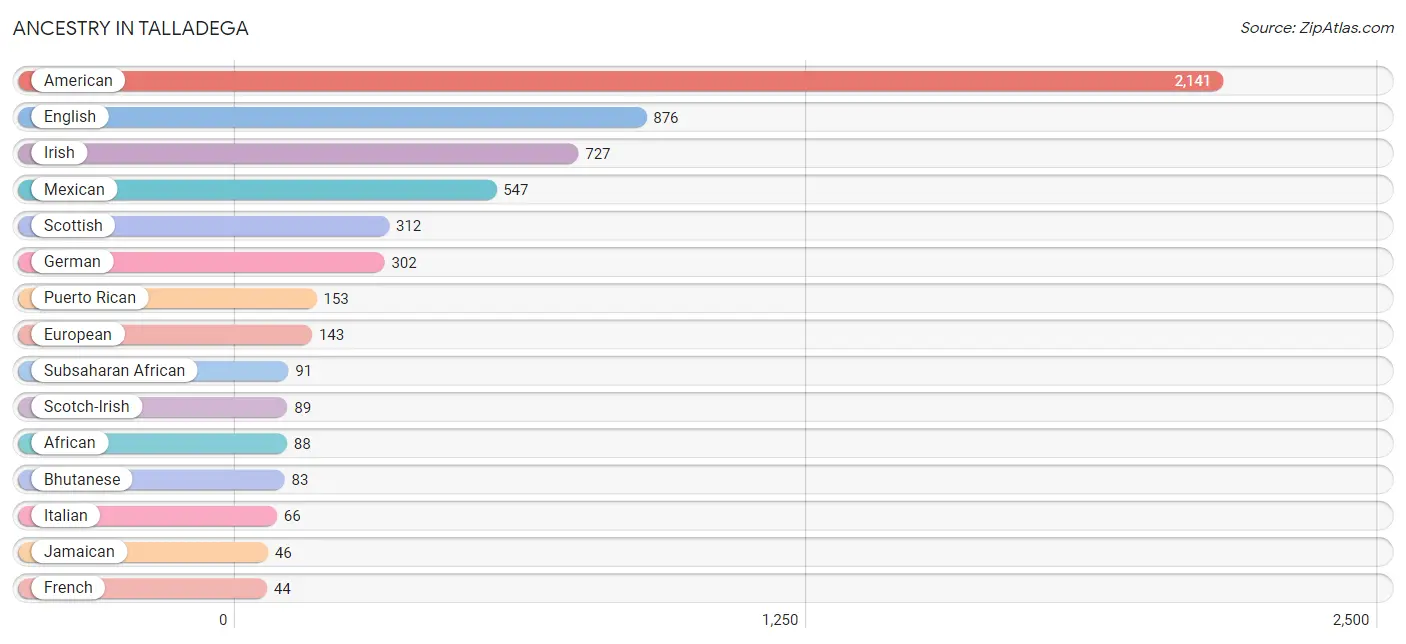
| Ancestry | # Population | % Population |
| African | 88 | 0.6% |
| American | 2,141 | 14.2% |
| Bhutanese | 83 | 0.5% |
| British | 8 | 0.1% |
| Cherokee | 41 | 0.3% |
| Creek | 32 | 0.2% |
| Cuban | 8 | 0.1% |
| Czech | 35 | 0.2% |
| Danish | 34 | 0.2% |
| Dominican | 10 | 0.1% |
| Dutch | 11 | 0.1% |
| English | 876 | 5.8% |
| European | 143 | 0.9% |
| French | 44 | 0.3% |
| French Canadian | 8 | 0.1% |
| German | 302 | 2.0% |
| Ghanaian | 3 | 0.0% |
| Haitian | 24 | 0.2% |
| Indian (Asian) | 20 | 0.1% |
| Irish | 727 | 4.8% |
| Italian | 66 | 0.4% |
| Jamaican | 46 | 0.3% |
| Korean | 11 | 0.1% |
| Mexican | 547 | 3.6% |
| Native Hawaiian | 29 | 0.2% |
| Norwegian | 25 | 0.2% |
| Peruvian | 15 | 0.1% |
| Puerto Rican | 153 | 1.0% |
| Russian | 2 | 0.0% |
| Scandinavian | 9 | 0.1% |
| Scotch-Irish | 89 | 0.6% |
| Scottish | 312 | 2.1% |
| South American | 22 | 0.2% |
| Subsaharan African | 91 | 0.6% |
| Venezuelan | 7 | 0.1% |
| Welsh | 41 | 0.3% |
| West Indian | 4 | 0.0% | View All 37 Rows |
Immigrants in Talladega
The most numerous immigrant groups reported in Talladega came from Latin America (390 | 2.6%), Central America (351 | 2.3%), Mexico (324 | 2.1%), Europe (37 | 0.3%), and Caribbean (32 | 0.2%), together accounting for 7.5% of all Talladega residents.
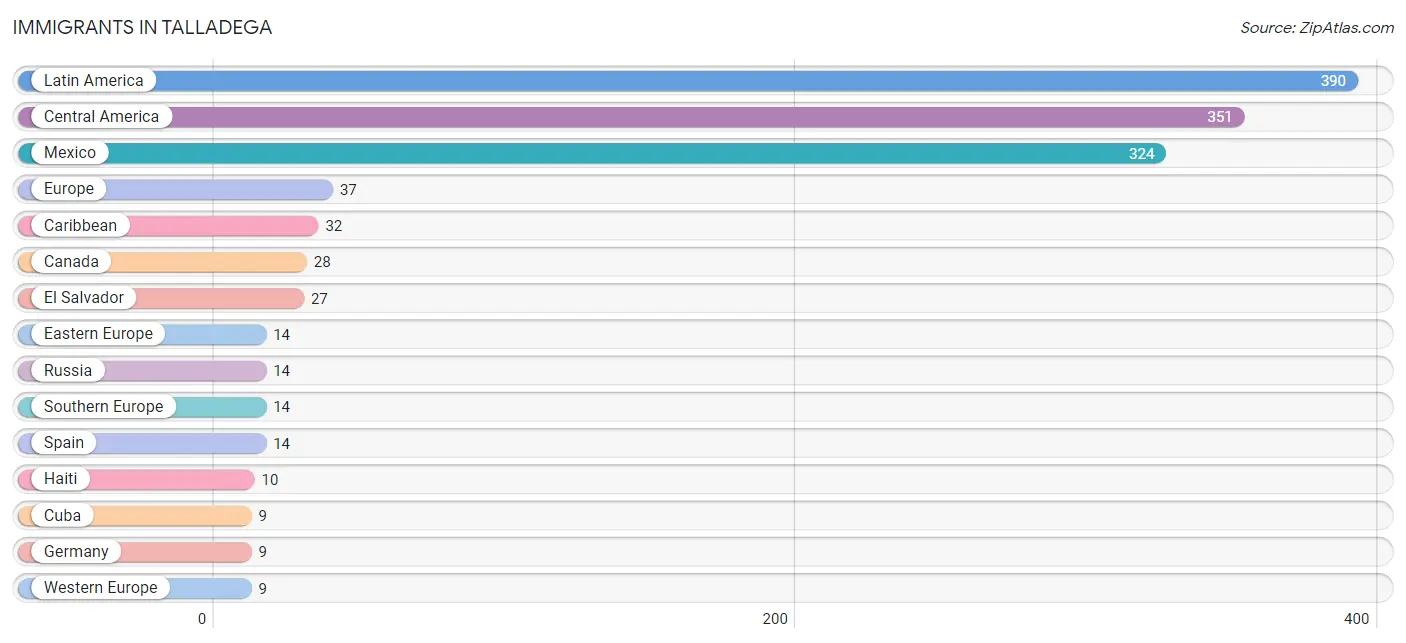
| Immigration Origin | # Population | % Population |
| Africa | 3 | 0.0% |
| Asia | 5 | 0.0% |
| Canada | 28 | 0.2% |
| Caribbean | 32 | 0.2% |
| Central America | 351 | 2.3% |
| China | 5 | 0.0% |
| Cuba | 9 | 0.1% |
| Eastern Asia | 5 | 0.0% |
| Eastern Europe | 14 | 0.1% |
| El Salvador | 27 | 0.2% |
| Europe | 37 | 0.3% |
| Germany | 9 | 0.1% |
| Ghana | 3 | 0.0% |
| Haiti | 10 | 0.1% |
| Latin America | 390 | 2.6% |
| Mexico | 324 | 2.1% |
| Russia | 14 | 0.1% |
| South America | 7 | 0.1% |
| Southern Europe | 14 | 0.1% |
| Spain | 14 | 0.1% |
| Venezuela | 7 | 0.1% |
| Western Africa | 3 | 0.0% |
| Western Europe | 9 | 0.1% | View All 23 Rows |
Sex and Age in Talladega
Sex and Age in Talladega
The most populous age groups in Talladega are 20 to 24 Years (1,109 | 14.3%) for men and 15 to 19 Years (709 | 9.7%) for women.
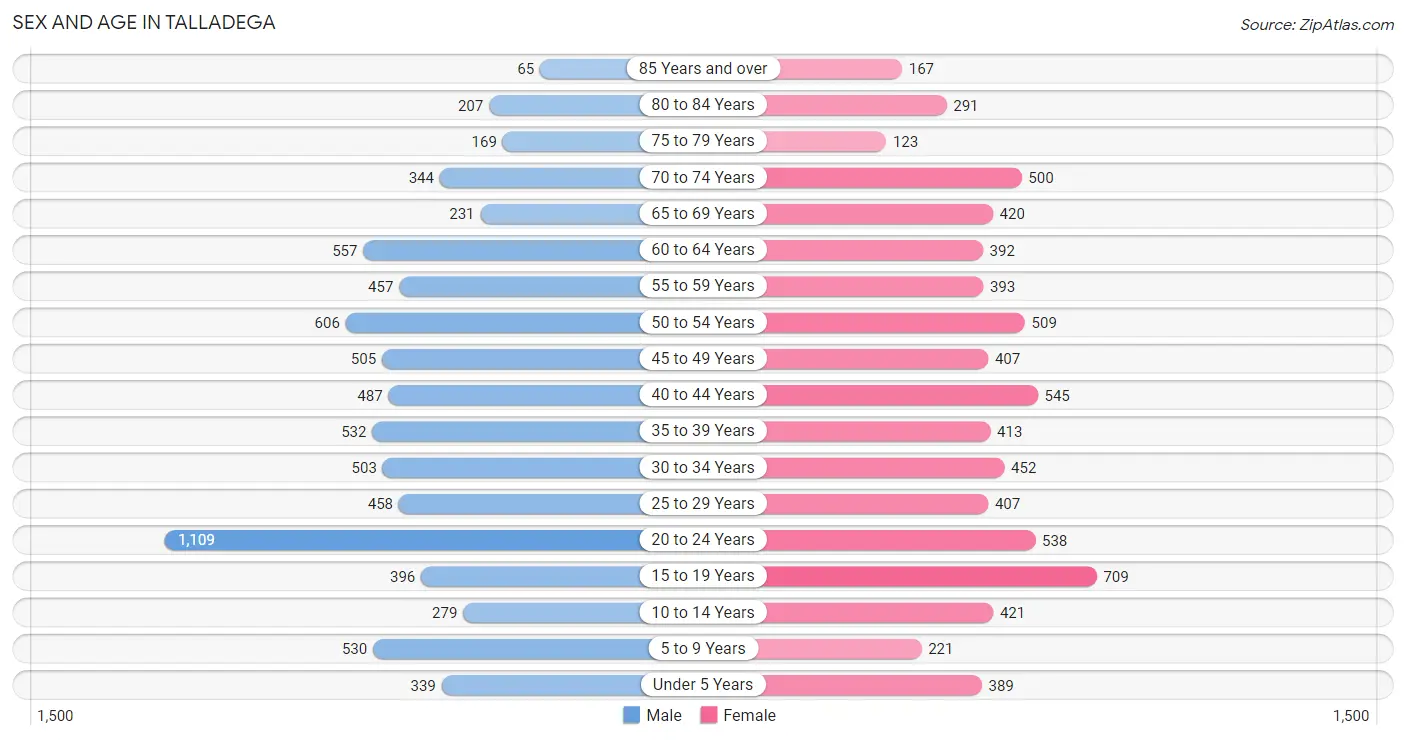
| Age Bracket | Male | Female |
| Under 5 Years | 339 (4.4%) | 389 (5.3%) |
| 5 to 9 Years | 530 (6.8%) | 221 (3.0%) |
| 10 to 14 Years | 279 (3.6%) | 421 (5.8%) |
| 15 to 19 Years | 396 (5.1%) | 709 (9.7%) |
| 20 to 24 Years | 1,109 (14.3%) | 538 (7.4%) |
| 25 to 29 Years | 458 (5.9%) | 407 (5.6%) |
| 30 to 34 Years | 503 (6.5%) | 452 (6.2%) |
| 35 to 39 Years | 532 (6.8%) | 413 (5.7%) |
| 40 to 44 Years | 487 (6.3%) | 545 (7.5%) |
| 45 to 49 Years | 505 (6.5%) | 407 (5.6%) |
| 50 to 54 Years | 606 (7.8%) | 509 (7.0%) |
| 55 to 59 Years | 457 (5.9%) | 393 (5.4%) |
| 60 to 64 Years | 557 (7.2%) | 392 (5.4%) |
| 65 to 69 Years | 231 (3.0%) | 420 (5.8%) |
| 70 to 74 Years | 344 (4.4%) | 500 (6.9%) |
| 75 to 79 Years | 169 (2.2%) | 123 (1.7%) |
| 80 to 84 Years | 207 (2.7%) | 291 (4.0%) |
| 85 Years and over | 65 (0.8%) | 167 (2.3%) |
| Total | 7,774 (100.0%) | 7,297 (100.0%) |
Families and Households in Talladega
Median Family Size in Talladega
The median family size in Talladega is 2.80 persons per family, with single male/father families (251 | 7.6%) accounting for the largest median family size of 3.32 persons per family. On the other hand, single female/mother families (1,250 | 37.8%) represent the smallest median family size with 2.63 persons per family.
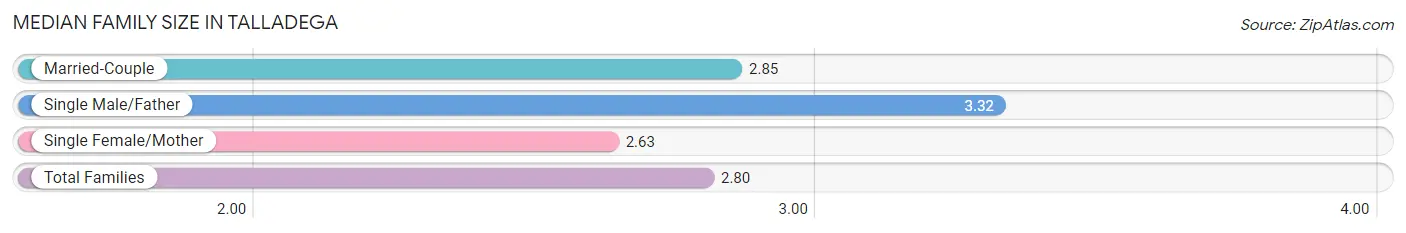
| Family Type | # Families | Family Size |
| Married-Couple | 1,806 (54.6%) | 2.85 |
| Single Male/Father | 251 (7.6%) | 3.32 |
| Single Female/Mother | 1,250 (37.8%) | 2.63 |
| Total Families | 3,307 (100.0%) | 2.80 |
Median Household Size in Talladega
The median household size in Talladega is 2.34 persons per household, with single male/father households (251 | 4.8%) accounting for the largest median household size of 3.89 persons per household. non-family households (1,944 | 37.0%) represent the smallest median household size with 1.38 persons per household.
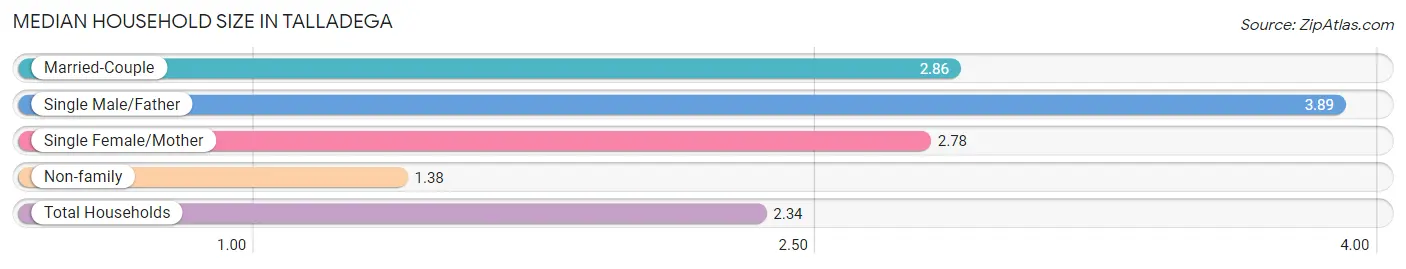
| Household Type | # Households | Household Size |
| Married-Couple | 1,806 (34.4%) | 2.86 |
| Single Male/Father | 251 (4.8%) | 3.89 |
| Single Female/Mother | 1,250 (23.8%) | 2.78 |
| Non-family | 1,944 (37.0%) | 1.38 |
| Total Households | 5,251 (100.0%) | 2.34 |
Household Size by Marriage Status in Talladega
Out of a total of 5,251 households in Talladega, 3,307 (63.0%) are family households, while 1,944 (37.0%) are nonfamily households. The most numerous type of family households are 2-person households, comprising 1,607, and the most common type of nonfamily households are 1-person households, comprising 1,559.
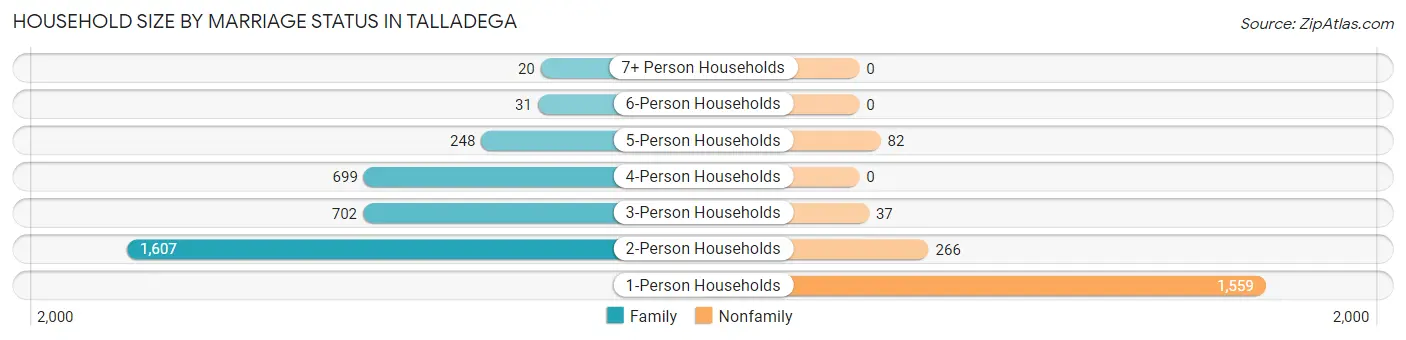
| Household Size | Family Households | Nonfamily Households |
| 1-Person Households | - | 1,559 (29.7%) |
| 2-Person Households | 1,607 (30.6%) | 266 (5.1%) |
| 3-Person Households | 702 (13.4%) | 37 (0.7%) |
| 4-Person Households | 699 (13.3%) | 0 (0.0%) |
| 5-Person Households | 248 (4.7%) | 82 (1.6%) |
| 6-Person Households | 31 (0.6%) | 0 (0.0%) |
| 7+ Person Households | 20 (0.4%) | 0 (0.0%) |
| Total | 3,307 (63.0%) | 1,944 (37.0%) |
Female Fertility in Talladega
Fertility by Age in Talladega
Average fertility rate in Talladega is 59.0 births per 1,000 women. Women in the age bracket of 20 to 34 years have the highest fertility rate with 121.0 births per 1,000 women. Women in the age bracket of 20 to 34 years acount for 80.9% of all women with births.
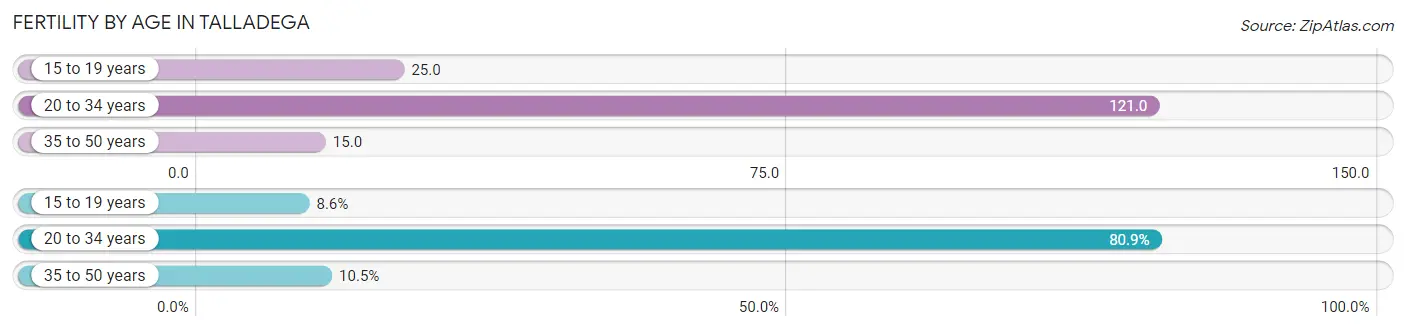
| Age Bracket | Women with Births | Births / 1,000 Women |
| 15 to 19 years | 18 (8.6%) | 25.0 |
| 20 to 34 years | 169 (80.9%) | 121.0 |
| 35 to 50 years | 22 (10.5%) | 15.0 |
| Total | 209 (100.0%) | 59.0 |
Fertility by Age by Marriage Status in Talladega
47.8% of women with births (209) in Talladega are married. The highest percentage of unmarried women with births falls into 15 to 19 years age bracket with 100.0% of them unmarried at the time of birth, while the lowest percentage of unmarried women with births belong to 35 to 50 years age bracket with 0.0% of them unmarried.
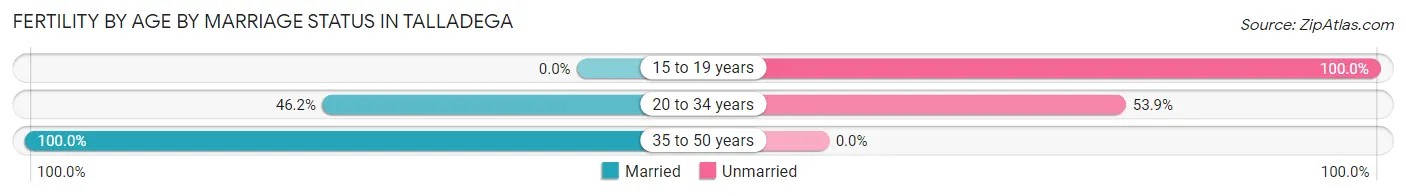
| Age Bracket | Married | Unmarried |
| 15 to 19 years | 0 (0.0%) | 18 (100.0%) |
| 20 to 34 years | 78 (46.2%) | 91 (53.8%) |
| 35 to 50 years | 22 (100.0%) | 0 (0.0%) |
| Total | 100 (47.8%) | 109 (52.1%) |
Fertility by Education in Talladega
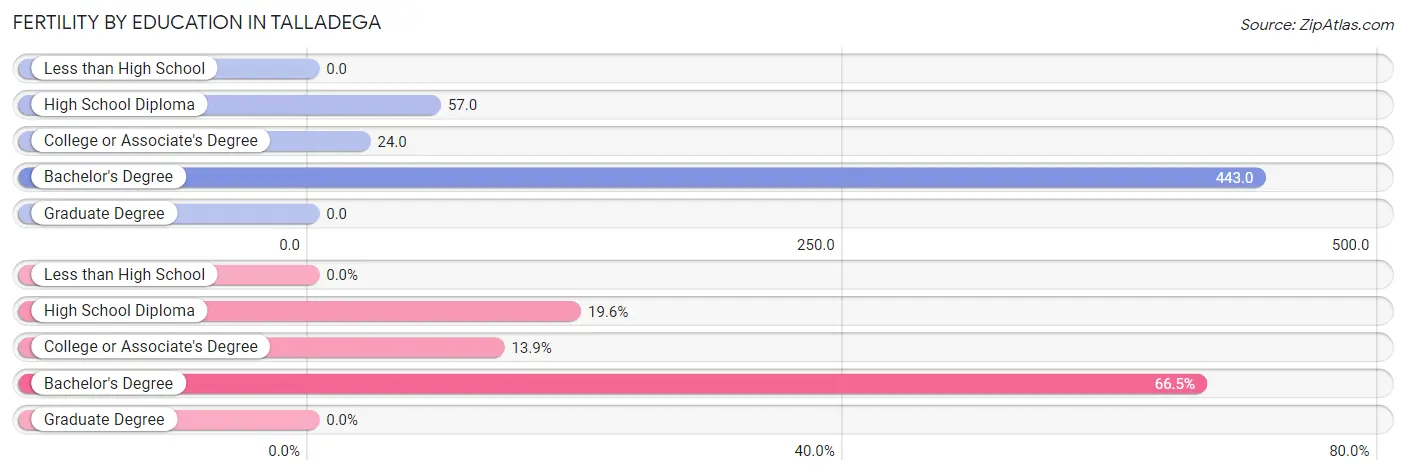
| Educational Attainment | Women with Births | Births / 1,000 Women |
| Less than High School | 0 (0.0%) | 0.0 |
| High School Diploma | 41 (19.6%) | 57.0 |
| College or Associate's Degree | 29 (13.9%) | 24.0 |
| Bachelor's Degree | 139 (66.5%) | 443.0 |
| Graduate Degree | 0 (0.0%) | 0.0 |
| Total | 209 (100.0%) | 59.0 |
Fertility by Education by Marriage Status in Talladega
52.1% of women with births in Talladega are unmarried. Women with the educational attainment of bachelor's degree are most likely to be married with 71.9% of them married at childbirth, while women with the educational attainment of high school diploma are least likely to be married with 100.0% of them unmarried at childbirth.
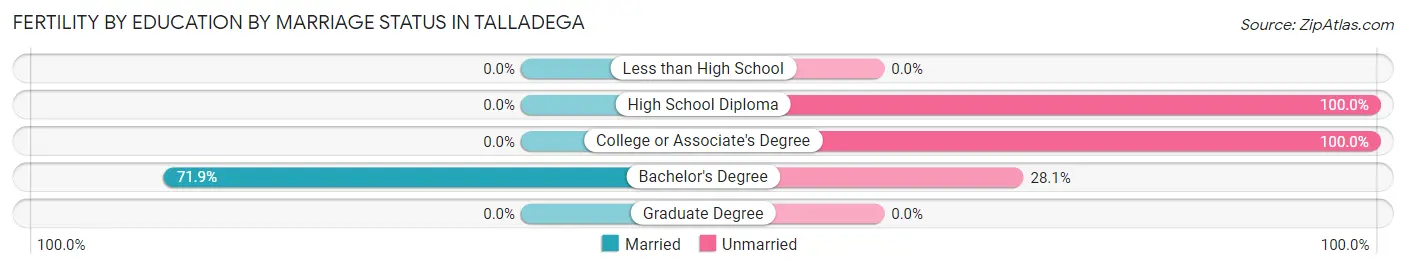
| Educational Attainment | Married | Unmarried |
| Less than High School | 0 (0.0%) | 0 (0.0%) |
| High School Diploma | 0 (0.0%) | 41 (100.0%) |
| College or Associate's Degree | 0 (0.0%) | 29 (100.0%) |
| Bachelor's Degree | 100 (71.9%) | 39 (28.1%) |
| Graduate Degree | 0 (0.0%) | 0 (0.0%) |
| Total | 100 (47.8%) | 109 (52.1%) |
Employment Characteristics in Talladega
Employment by Class of Employer in Talladega
Among the 4,580 employed individuals in Talladega, private company employees (3,108 | 67.9%), state government employees (436 | 9.5%), and not-for-profit organizations (380 | 8.3%) make up the most common classes of employment.
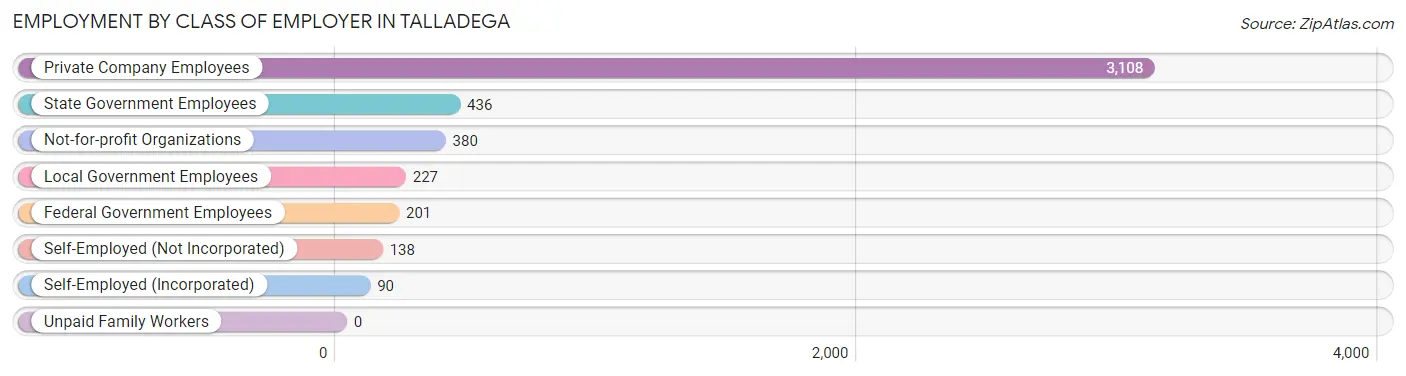
| Employer Class | # Employees | % Employees |
| Private Company Employees | 3,108 | 67.9% |
| Self-Employed (Incorporated) | 90 | 2.0% |
| Self-Employed (Not Incorporated) | 138 | 3.0% |
| Not-for-profit Organizations | 380 | 8.3% |
| Local Government Employees | 227 | 5.0% |
| State Government Employees | 436 | 9.5% |
| Federal Government Employees | 201 | 4.4% |
| Unpaid Family Workers | 0 | 0.0% |
| Total | 4,580 | 100.0% |
Employment Status by Age in Talladega
According to the labor force statistics for Talladega, out of the total population over 16 years of age (12,649), 44.0% or 5,566 individuals are in the labor force, with 14.3% or 796 of them unemployed. The age group with the highest labor force participation rate is 25 to 29 years, with 72.6% or 628 individuals in the labor force. Within the labor force, the 16 to 19 years age range has the highest percentage of unemployed individuals, with 48.6% or 178 of them being unemployed.
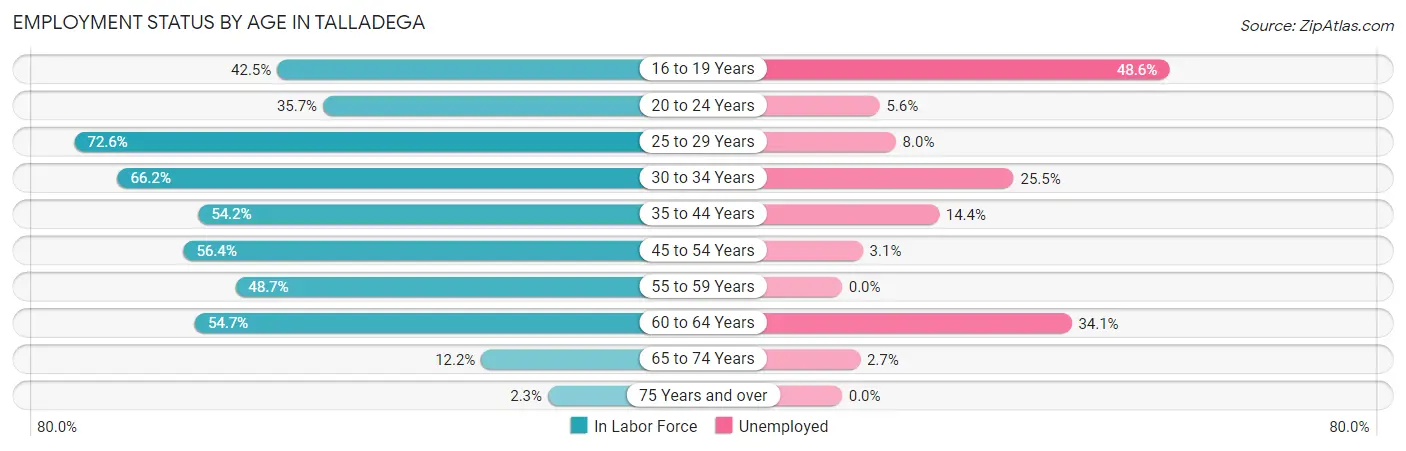
| Age Bracket | In Labor Force | Unemployed |
| 16 to 19 Years | 366 (42.5%) | 178 (48.6%) |
| 20 to 24 Years | 588 (35.7%) | 33 (5.6%) |
| 25 to 29 Years | 628 (72.6%) | 50 (8.0%) |
| 30 to 34 Years | 632 (66.2%) | 161 (25.5%) |
| 35 to 44 Years | 1,072 (54.2%) | 154 (14.4%) |
| 45 to 54 Years | 1,143 (56.4%) | 35 (3.1%) |
| 55 to 59 Years | 414 (48.7%) | 0 (0.0%) |
| 60 to 64 Years | 519 (54.7%) | 177 (34.1%) |
| 65 to 74 Years | 182 (12.2%) | 5 (2.7%) |
| 75 Years and over | 24 (2.3%) | 0 (0.0%) |
| Total | 5,566 (44.0%) | 796 (14.3%) |
Employment Status by Educational Attainment in Talladega
According to labor force statistics for Talladega, 57.8% of individuals (4,406) out of the total population between 25 and 64 years of age (7,623) are in the labor force, with 13.1% or 577 of them being unemployed. The group with the highest labor force participation rate are those with the educational attainment of bachelor's degree or higher, with 83.2% or 742 individuals in the labor force. Within the labor force, individuals with college / associate degree education have the highest percentage of unemployment, with 15.7% or 247 of them being unemployed.
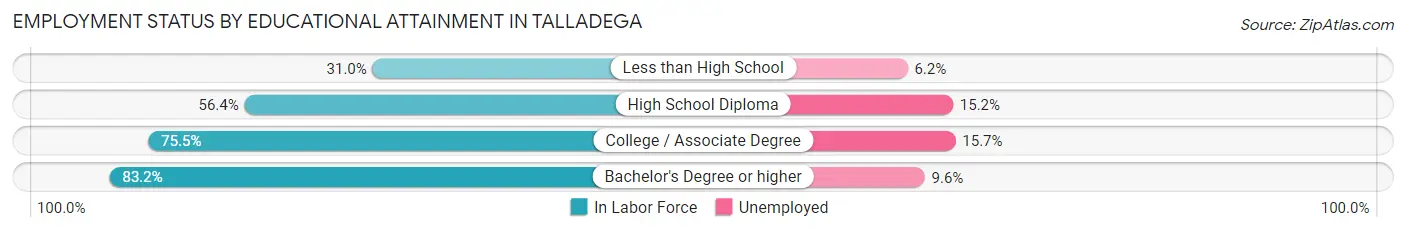
| Educational Attainment | In Labor Force | Unemployed |
| Less than High School | 644 (31.0%) | 129 (6.2%) |
| High School Diploma | 1,446 (56.4%) | 390 (15.2%) |
| College / Associate Degree | 1,576 (75.5%) | 328 (15.7%) |
| Bachelor's Degree or higher | 742 (83.2%) | 86 (9.6%) |
| Total | 4,406 (57.8%) | 999 (13.1%) |
Employment Occupations by Sex in Talladega
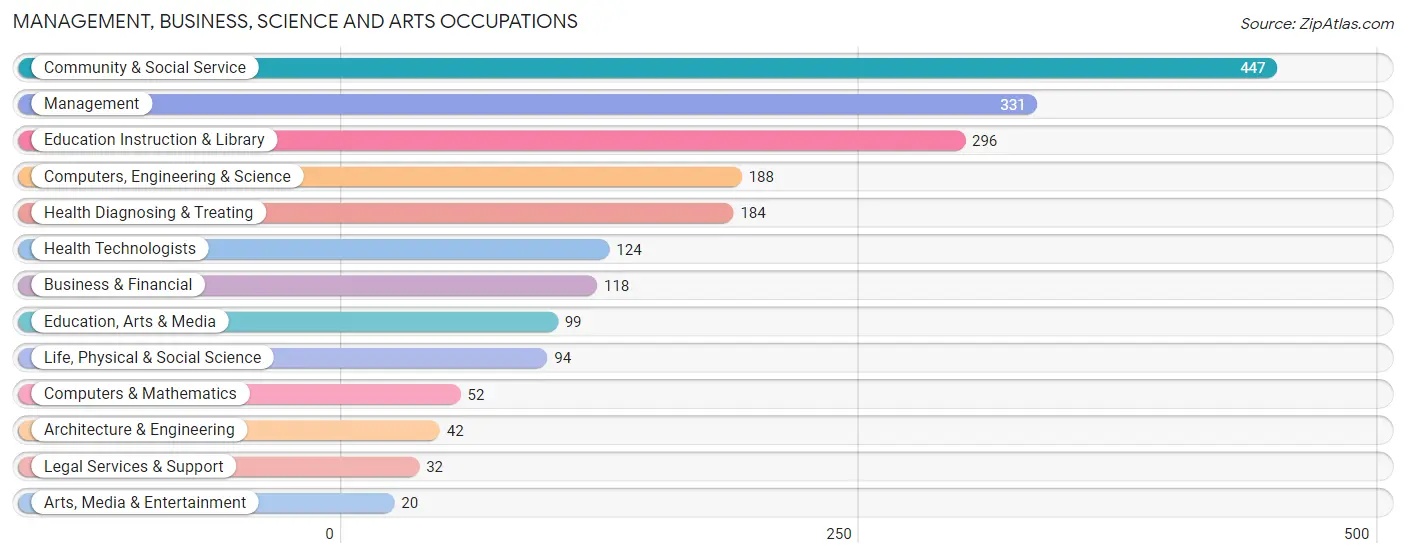
Management, Business, Science and Arts Occupations
The most common Management, Business, Science and Arts occupations in Talladega are Community & Social Service (447 | 9.4%), Management (331 | 6.9%), Education Instruction & Library (296 | 6.2%), Computers, Engineering & Science (188 | 3.9%), and Health Diagnosing & Treating (184 | 3.9%).
Management, Business, Science and Arts Occupations by Sex
Within the Management, Business, Science and Arts occupations in Talladega, the most male-oriented occupations are Architecture & Engineering (100.0%), Management (85.8%), and Computers & Mathematics (48.1%), while the most female-oriented occupations are Life, Physical & Social Science (100.0%), Legal Services & Support (100.0%), and Arts, Media & Entertainment (100.0%).
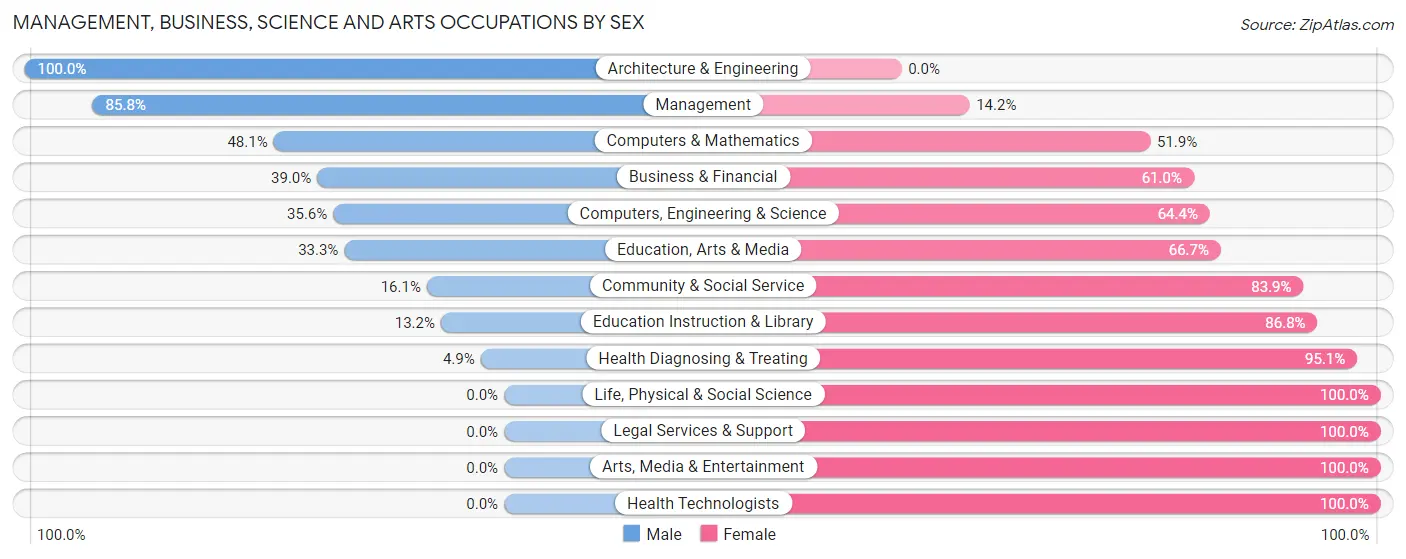
| Occupation | Male | Female |
| Management | 284 (85.8%) | 47 (14.2%) |
| Business & Financial | 46 (39.0%) | 72 (61.0%) |
| Computers, Engineering & Science | 67 (35.6%) | 121 (64.4%) |
| Computers & Mathematics | 25 (48.1%) | 27 (51.9%) |
| Architecture & Engineering | 42 (100.0%) | 0 (0.0%) |
| Life, Physical & Social Science | 0 (0.0%) | 94 (100.0%) |
| Community & Social Service | 72 (16.1%) | 375 (83.9%) |
| Education, Arts & Media | 33 (33.3%) | 66 (66.7%) |
| Legal Services & Support | 0 (0.0%) | 32 (100.0%) |
| Education Instruction & Library | 39 (13.2%) | 257 (86.8%) |
| Arts, Media & Entertainment | 0 (0.0%) | 20 (100.0%) |
| Health Diagnosing & Treating | 9 (4.9%) | 175 (95.1%) |
| Health Technologists | 0 (0.0%) | 124 (100.0%) |
| Total (Category) | 478 (37.7%) | 790 (62.3%) |
| Total (Overall) | 2,254 (47.2%) | 2,519 (52.8%) |
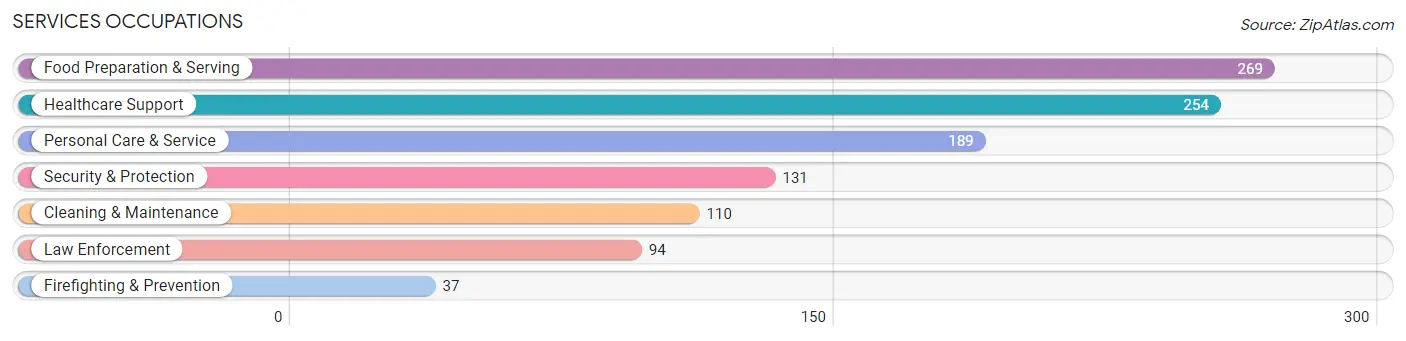
Services Occupations
The most common Services occupations in Talladega are Food Preparation & Serving (269 | 5.6%), Healthcare Support (254 | 5.3%), Personal Care & Service (189 | 4.0%), Security & Protection (131 | 2.7%), and Cleaning & Maintenance (110 | 2.3%).
Services Occupations by Sex
Within the Services occupations in Talladega, the most male-oriented occupations are Cleaning & Maintenance (88.2%), Law Enforcement (34.0%), and Security & Protection (31.3%), while the most female-oriented occupations are Healthcare Support (96.5%), Personal Care & Service (78.8%), and Firefighting & Prevention (75.7%).
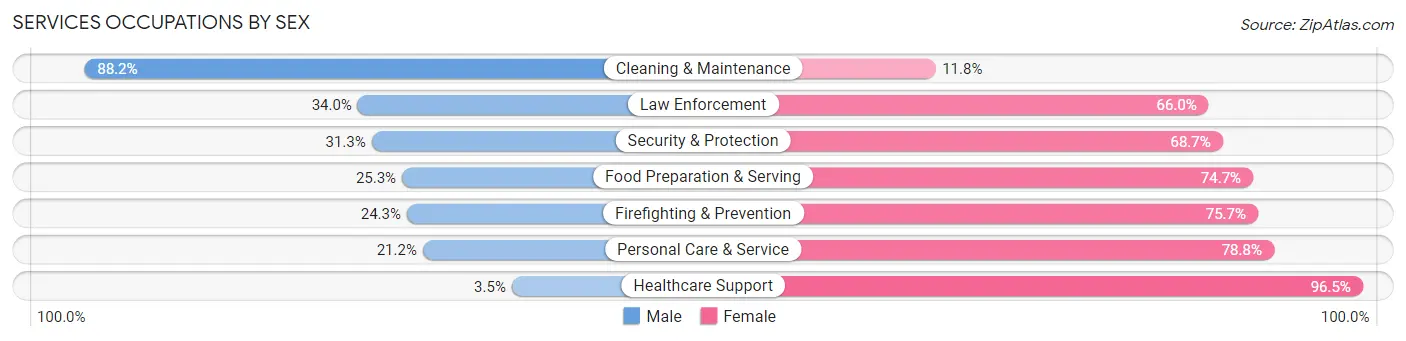
| Occupation | Male | Female |
| Healthcare Support | 9 (3.5%) | 245 (96.5%) |
| Security & Protection | 41 (31.3%) | 90 (68.7%) |
| Firefighting & Prevention | 9 (24.3%) | 28 (75.7%) |
| Law Enforcement | 32 (34.0%) | 62 (66.0%) |
| Food Preparation & Serving | 68 (25.3%) | 201 (74.7%) |
| Cleaning & Maintenance | 97 (88.2%) | 13 (11.8%) |
| Personal Care & Service | 40 (21.2%) | 149 (78.8%) |
| Total (Category) | 255 (26.8%) | 698 (73.2%) |
| Total (Overall) | 2,254 (47.2%) | 2,519 (52.8%) |
Sales and Office Occupations
The most common Sales and Office occupations in Talladega are Sales & Related (400 | 8.4%), and Office & Administration (344 | 7.2%).

Sales and Office Occupations by Sex
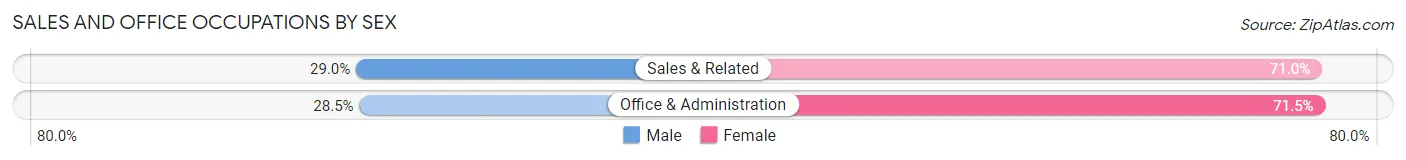
| Occupation | Male | Female |
| Sales & Related | 116 (29.0%) | 284 (71.0%) |
| Office & Administration | 98 (28.5%) | 246 (71.5%) |
| Total (Category) | 214 (28.8%) | 530 (71.2%) |
| Total (Overall) | 2,254 (47.2%) | 2,519 (52.8%) |
Natural Resources, Construction and Maintenance Occupations
The most common Natural Resources, Construction and Maintenance occupations in Talladega are Construction & Extraction (245 | 5.1%), Installation, Maintenance & Repair (205 | 4.3%), and Farming, Fishing & Forestry (30 | 0.6%).
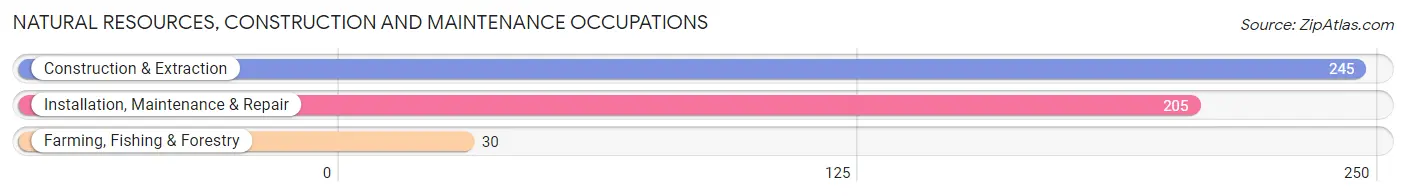
Natural Resources, Construction and Maintenance Occupations by Sex

| Occupation | Male | Female |
| Farming, Fishing & Forestry | 1 (3.3%) | 29 (96.7%) |
| Construction & Extraction | 245 (100.0%) | 0 (0.0%) |
| Installation, Maintenance & Repair | 180 (87.8%) | 25 (12.2%) |
| Total (Category) | 426 (88.7%) | 54 (11.3%) |
| Total (Overall) | 2,254 (47.2%) | 2,519 (52.8%) |
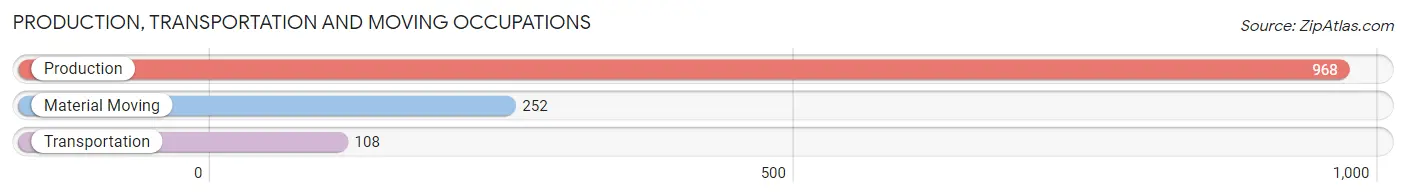
Production, Transportation and Moving Occupations
The most common Production, Transportation and Moving occupations in Talladega are Production (968 | 20.3%), Material Moving (252 | 5.3%), and Transportation (108 | 2.3%).
Production, Transportation and Moving Occupations by Sex
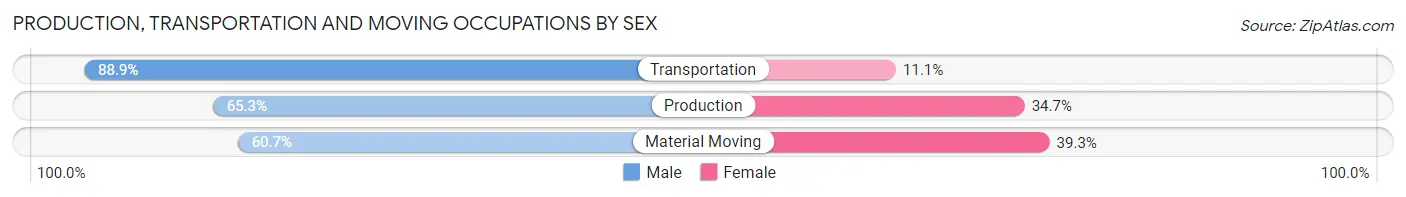
| Occupation | Male | Female |
| Production | 632 (65.3%) | 336 (34.7%) |
| Transportation | 96 (88.9%) | 12 (11.1%) |
| Material Moving | 153 (60.7%) | 99 (39.3%) |
| Total (Category) | 881 (66.3%) | 447 (33.7%) |
| Total (Overall) | 2,254 (47.2%) | 2,519 (52.8%) |
Employment Industries by Sex in Talladega
Employment Industries in Talladega
The major employment industries in Talladega include Manufacturing (1,203 | 25.2%), Health Care & Social Assistance (641 | 13.4%), Educational Services (545 | 11.4%), Retail Trade (484 | 10.1%), and Construction (362 | 7.6%).
Employment Industries by Sex in Talladega
The Talladega industries that see more men than women are Mining, Quarrying, & Extraction (100.0%), Utilities (100.0%), and Construction (92.0%), whereas the industries that tend to have a higher number of women are Information (100.0%), Real Estate, Rental & Leasing (100.0%), and Health Care & Social Assistance (91.9%).
| Industry | Male | Female |
| Agriculture, Fishing & Hunting | 9 (20.0%) | 36 (80.0%) |
| Mining, Quarrying, & Extraction | 20 (100.0%) | 0 (0.0%) |
| Construction | 333 (92.0%) | 29 (8.0%) |
| Manufacturing | 811 (67.4%) | 392 (32.6%) |
| Wholesale Trade | 24 (51.1%) | 23 (48.9%) |
| Retail Trade | 205 (42.4%) | 279 (57.6%) |
| Transportation & Warehousing | 82 (88.2%) | 11 (11.8%) |
| Utilities | 22 (100.0%) | 0 (0.0%) |
| Information | 0 (0.0%) | 25 (100.0%) |
| Finance & Insurance | 71 (33.3%) | 142 (66.7%) |
| Real Estate, Rental & Leasing | 0 (0.0%) | 23 (100.0%) |
| Professional & Scientific | 19 (18.1%) | 86 (81.9%) |
| Enterprise Management | 0 (0.0%) | 0 (0.0%) |
| Administrative & Support | 29 (90.6%) | 3 (9.4%) |
| Educational Services | 175 (32.1%) | 370 (67.9%) |
| Health Care & Social Assistance | 52 (8.1%) | 589 (91.9%) |
| Arts, Entertainment & Recreation | 35 (63.6%) | 20 (36.4%) |
| Accommodation & Food Services | 53 (17.3%) | 253 (82.7%) |
| Public Administration | 171 (53.1%) | 151 (46.9%) |
| Total | 2,254 (47.2%) | 2,519 (52.8%) |
Education in Talladega
School Enrollment in Talladega
The most common levels of schooling among the 3,784 students in Talladega are college / undergraduate (1,367 | 36.1%), high school (847 | 22.4%), and elementary school (600 | 15.9%).
| School Level | # Students | % Students |
| Nursery / Preschool | 230 | 6.1% |
| Kindergarten | 147 | 3.9% |
| Elementary School | 600 | 15.9% |
| Middle School | 551 | 14.6% |
| High School | 847 | 22.4% |
| College / Undergraduate | 1,367 | 36.1% |
| Graduate / Professional | 42 | 1.1% |
| Total | 3,784 | 100.0% |
School Enrollment by Age by Funding Source in Talladega
Out of a total of 3,784 students who are enrolled in schools in Talladega, 916 (24.2%) attend a private institution, while the remaining 2,868 (75.8%) are enrolled in public schools. The age group of 20 to 24 year olds has the highest likelihood of being enrolled in private schools, with 689 (72.5% in the age bracket) enrolled. Conversely, the age group of 3 to 4 year olds has the lowest likelihood of being enrolled in a private school, with 135 (100.0% in the age bracket) attending a public institution.
| Age Bracket | Public School | Private School |
| 3 to 4 Year Olds | 135 (100.0%) | 0 (0.0%) |
| 5 to 9 Year Old | 646 (88.6%) | 83 (11.4%) |
| 10 to 14 Year Olds | 687 (98.1%) | 13 (1.9%) |
| 15 to 17 Year Olds | 473 (95.0%) | 25 (5.0%) |
| 18 to 19 Year Olds | 306 (84.1%) | 58 (15.9%) |
| 20 to 24 Year Olds | 261 (27.5%) | 689 (72.5%) |
| 25 to 34 Year Olds | 257 (100.0%) | 0 (0.0%) |
| 35 Years and over | 103 (68.2%) | 48 (31.8%) |
| Total | 2,868 (75.8%) | 916 (24.2%) |
Educational Attainment by Field of Study in Talladega
Education (352 | 22.9%), arts & humanities (246 | 16.0%), business (219 | 14.3%), liberal arts & history (134 | 8.7%), and social sciences (94 | 6.1%) are the most common fields of study among 1,535 individuals in Talladega who have obtained a bachelor's degree or higher.
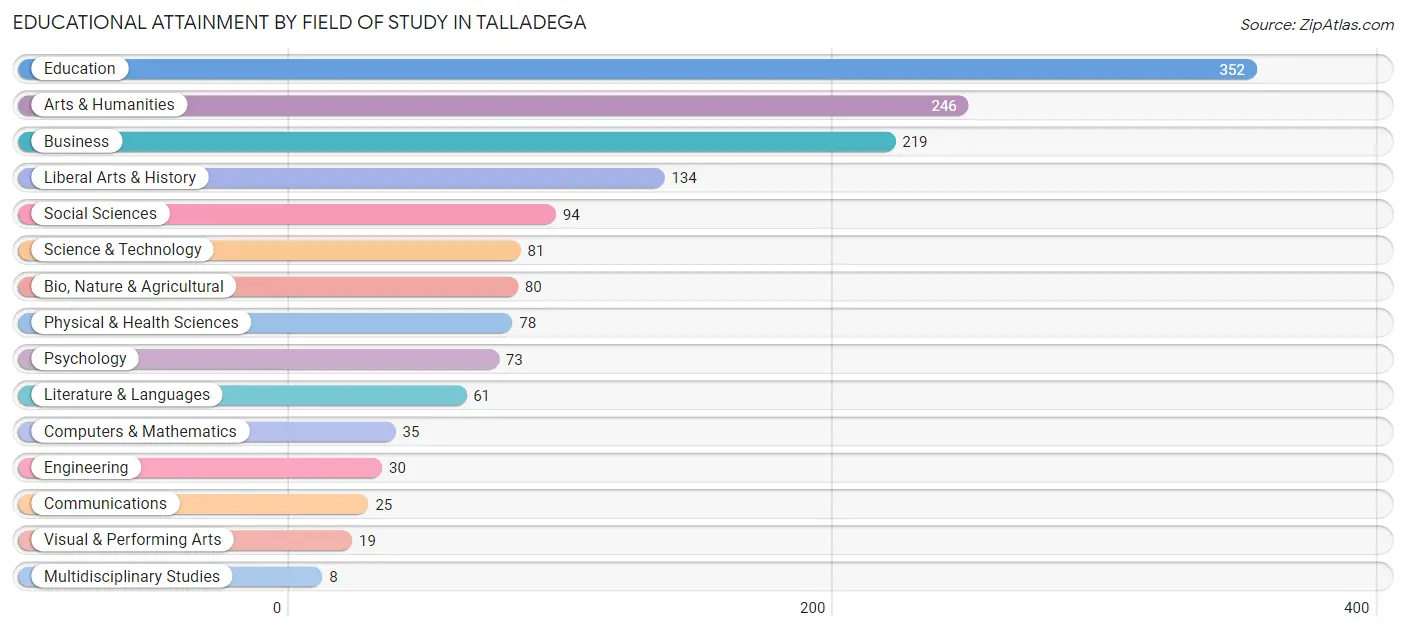
| Field of Study | # Graduates | % Graduates |
| Computers & Mathematics | 35 | 2.3% |
| Bio, Nature & Agricultural | 80 | 5.2% |
| Physical & Health Sciences | 78 | 5.1% |
| Psychology | 73 | 4.8% |
| Social Sciences | 94 | 6.1% |
| Engineering | 30 | 1.9% |
| Multidisciplinary Studies | 8 | 0.5% |
| Science & Technology | 81 | 5.3% |
| Business | 219 | 14.3% |
| Education | 352 | 22.9% |
| Literature & Languages | 61 | 4.0% |
| Liberal Arts & History | 134 | 8.7% |
| Visual & Performing Arts | 19 | 1.2% |
| Communications | 25 | 1.6% |
| Arts & Humanities | 246 | 16.0% |
| Total | 1,535 | 100.0% |
Transportation & Commute in Talladega
Vehicle Availability by Sex in Talladega
The most prevalent vehicle ownership categories in Talladega are males with 2 vehicles (632, accounting for 29.4%) and females with 2 vehicles (532, making up 26.3%).
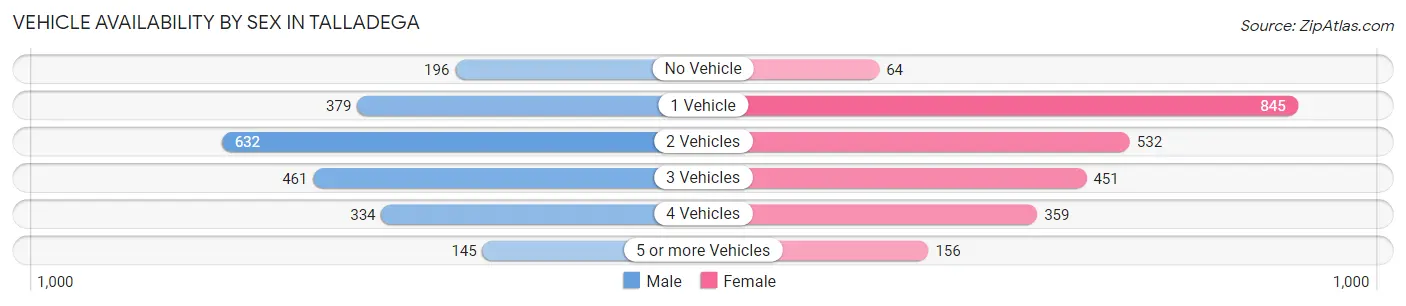
| Vehicles Available | Male | Female |
| No Vehicle | 196 (9.1%) | 64 (2.7%) |
| 1 Vehicle | 379 (17.6%) | 845 (35.1%) |
| 2 Vehicles | 632 (29.4%) | 532 (22.1%) |
| 3 Vehicles | 461 (21.5%) | 451 (18.7%) |
| 4 Vehicles | 334 (15.6%) | 359 (14.9%) |
| 5 or more Vehicles | 145 (6.8%) | 156 (6.5%) |
| Total | 2,147 (100.0%) | 2,407 (100.0%) |
Commute Time in Talladega
The most frequently occuring commute durations in Talladega are 5 to 9 minutes (1,003 commuters, 22.4%), 30 to 34 minutes (734 commuters, 16.4%), and 10 to 14 minutes (633 commuters, 14.1%).
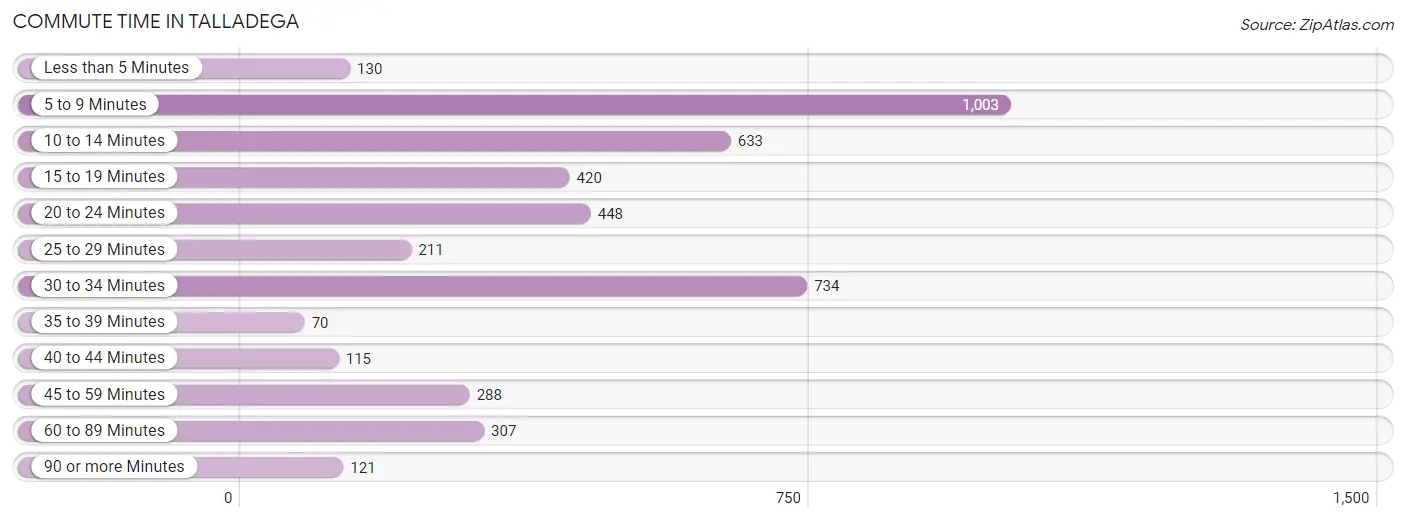
| Commute Time | # Commuters | % Commuters |
| Less than 5 Minutes | 130 | 2.9% |
| 5 to 9 Minutes | 1,003 | 22.4% |
| 10 to 14 Minutes | 633 | 14.1% |
| 15 to 19 Minutes | 420 | 9.4% |
| 20 to 24 Minutes | 448 | 10.0% |
| 25 to 29 Minutes | 211 | 4.7% |
| 30 to 34 Minutes | 734 | 16.4% |
| 35 to 39 Minutes | 70 | 1.6% |
| 40 to 44 Minutes | 115 | 2.6% |
| 45 to 59 Minutes | 288 | 6.4% |
| 60 to 89 Minutes | 307 | 6.9% |
| 90 or more Minutes | 121 | 2.7% |
Commute Time by Sex in Talladega
The most common commute times in Talladega are 5 to 9 minutes (420 commuters, 19.9%) for males and 5 to 9 minutes (583 commuters, 24.6%) for females.
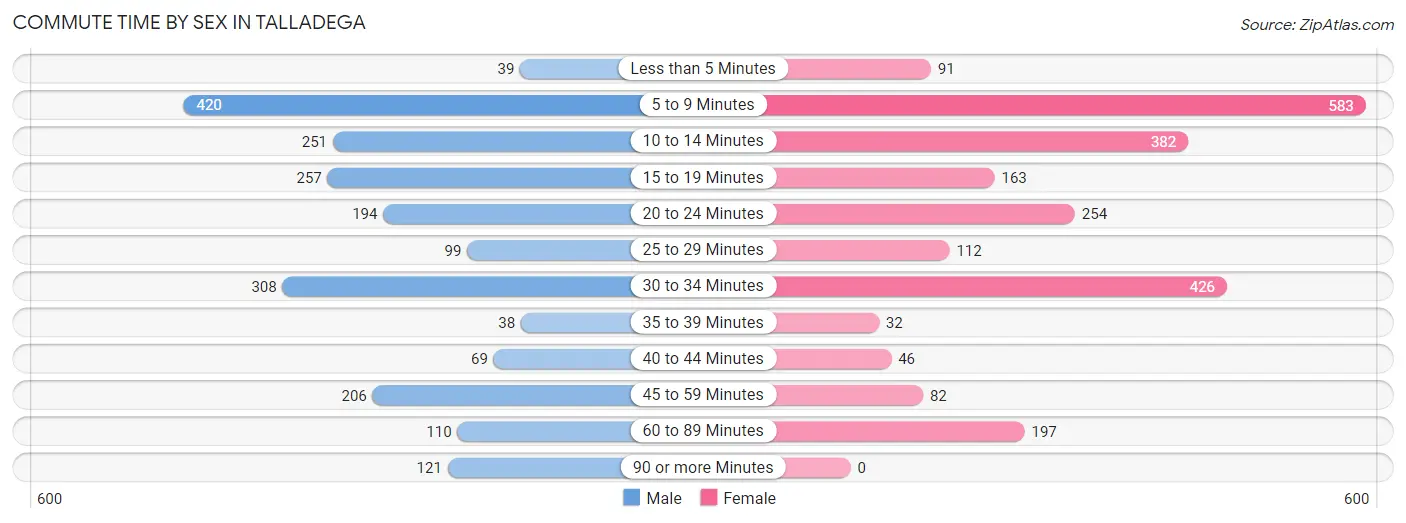
| Commute Time | Male | Female |
| Less than 5 Minutes | 39 (1.8%) | 91 (3.8%) |
| 5 to 9 Minutes | 420 (19.9%) | 583 (24.6%) |
| 10 to 14 Minutes | 251 (11.9%) | 382 (16.1%) |
| 15 to 19 Minutes | 257 (12.2%) | 163 (6.9%) |
| 20 to 24 Minutes | 194 (9.2%) | 254 (10.7%) |
| 25 to 29 Minutes | 99 (4.7%) | 112 (4.7%) |
| 30 to 34 Minutes | 308 (14.6%) | 426 (18.0%) |
| 35 to 39 Minutes | 38 (1.8%) | 32 (1.3%) |
| 40 to 44 Minutes | 69 (3.3%) | 46 (1.9%) |
| 45 to 59 Minutes | 206 (9.8%) | 82 (3.5%) |
| 60 to 89 Minutes | 110 (5.2%) | 197 (8.3%) |
| 90 or more Minutes | 121 (5.7%) | 0 (0.0%) |
Time of Departure to Work by Sex in Talladega
The most frequent times of departure to work in Talladega are 6:30 AM to 6:59 AM (375, 17.8%) for males and 7:00 AM to 7:29 AM (547, 23.1%) for females.
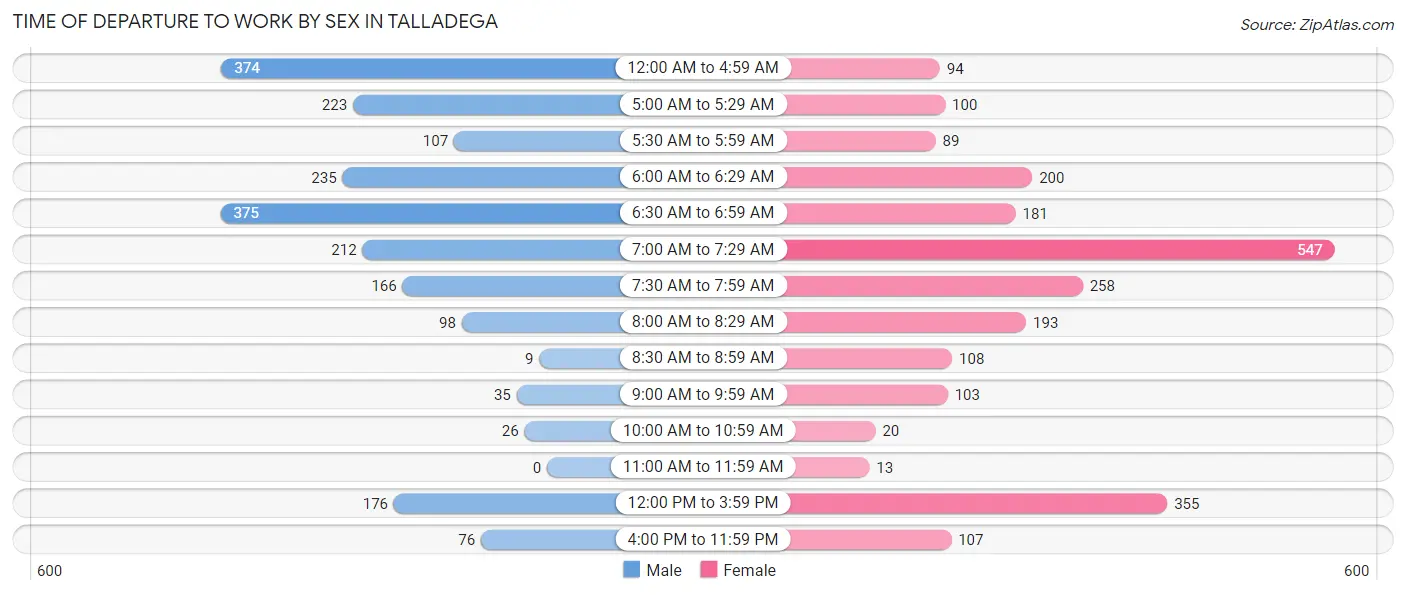
| Time of Departure | Male | Female |
| 12:00 AM to 4:59 AM | 374 (17.7%) | 94 (4.0%) |
| 5:00 AM to 5:29 AM | 223 (10.6%) | 100 (4.2%) |
| 5:30 AM to 5:59 AM | 107 (5.1%) | 89 (3.8%) |
| 6:00 AM to 6:29 AM | 235 (11.1%) | 200 (8.5%) |
| 6:30 AM to 6:59 AM | 375 (17.8%) | 181 (7.6%) |
| 7:00 AM to 7:29 AM | 212 (10.0%) | 547 (23.1%) |
| 7:30 AM to 7:59 AM | 166 (7.9%) | 258 (10.9%) |
| 8:00 AM to 8:29 AM | 98 (4.6%) | 193 (8.2%) |
| 8:30 AM to 8:59 AM | 9 (0.4%) | 108 (4.6%) |
| 9:00 AM to 9:59 AM | 35 (1.7%) | 103 (4.3%) |
| 10:00 AM to 10:59 AM | 26 (1.2%) | 20 (0.8%) |
| 11:00 AM to 11:59 AM | 0 (0.0%) | 13 (0.5%) |
| 12:00 PM to 3:59 PM | 176 (8.3%) | 355 (15.0%) |
| 4:00 PM to 11:59 PM | 76 (3.6%) | 107 (4.5%) |
| Total | 2,112 (100.0%) | 2,368 (100.0%) |
Housing Occupancy in Talladega
Occupancy by Ownership in Talladega
Of the total 5,251 dwellings in Talladega, owner-occupied units account for 2,842 (54.1%), while renter-occupied units make up 2,409 (45.9%).
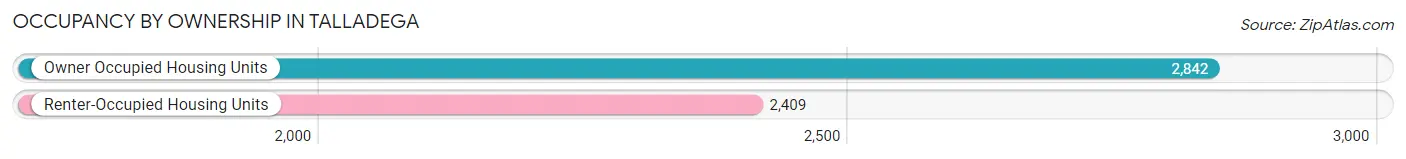
| Occupancy | # Housing Units | % Housing Units |
| Owner Occupied Housing Units | 2,842 | 54.1% |
| Renter-Occupied Housing Units | 2,409 | 45.9% |
| Total Occupied Housing Units | 5,251 | 100.0% |
Occupancy by Household Size in Talladega
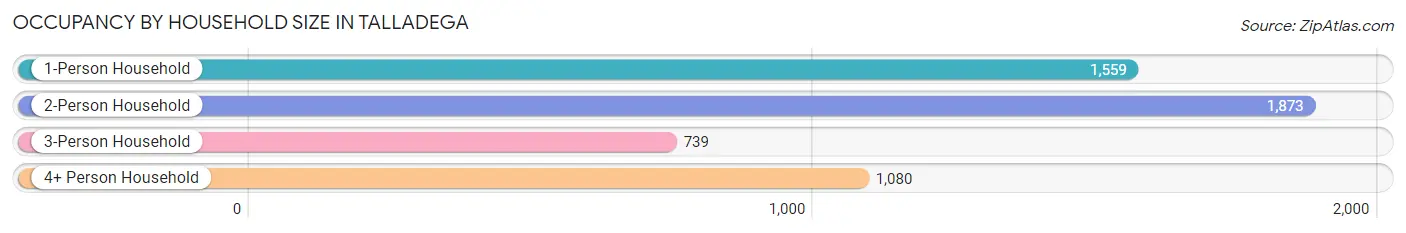
| Household Size | # Housing Units | % Housing Units |
| 1-Person Household | 1,559 | 29.7% |
| 2-Person Household | 1,873 | 35.7% |
| 3-Person Household | 739 | 14.1% |
| 4+ Person Household | 1,080 | 20.6% |
| Total Housing Units | 5,251 | 100.0% |
Occupancy by Ownership by Household Size in Talladega
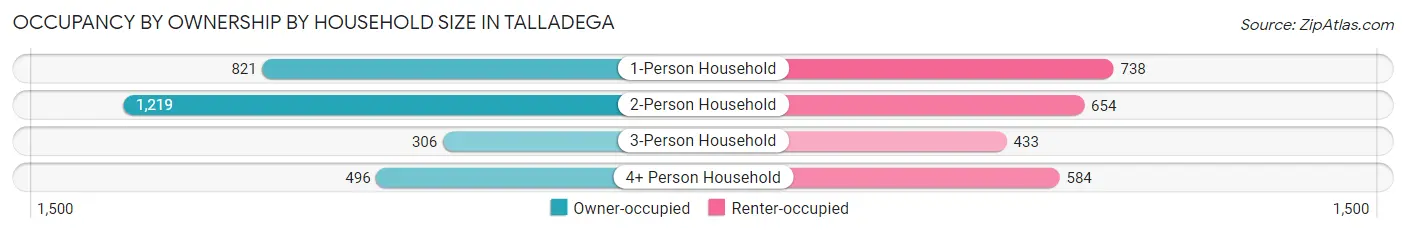
| Household Size | Owner-occupied | Renter-occupied |
| 1-Person Household | 821 (52.7%) | 738 (47.3%) |
| 2-Person Household | 1,219 (65.1%) | 654 (34.9%) |
| 3-Person Household | 306 (41.4%) | 433 (58.6%) |
| 4+ Person Household | 496 (45.9%) | 584 (54.1%) |
| Total Housing Units | 2,842 (54.1%) | 2,409 (45.9%) |
Occupancy by Educational Attainment in Talladega
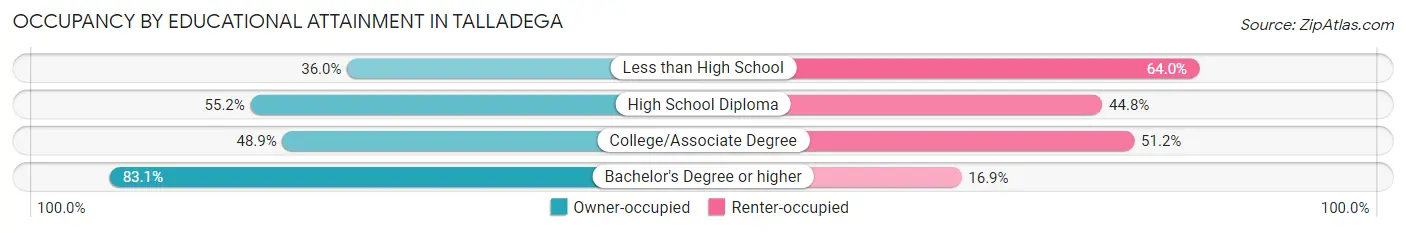
| Household Size | Owner-occupied | Renter-occupied |
| Less than High School | 434 (36.0%) | 771 (64.0%) |
| High School Diploma | 914 (55.2%) | 742 (44.8%) |
| College/Associate Degree | 702 (48.8%) | 735 (51.1%) |
| Bachelor's Degree or higher | 792 (83.1%) | 161 (16.9%) |
Occupancy by Age of Householder in Talladega
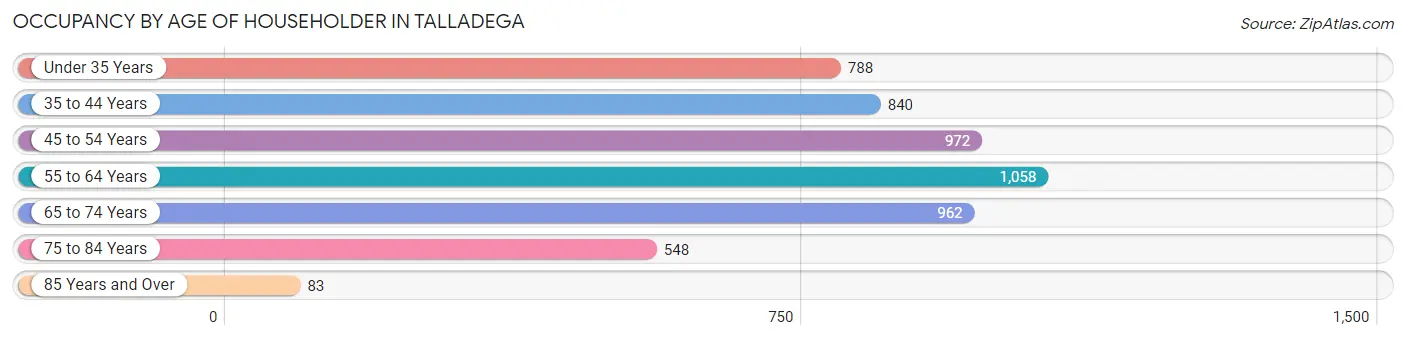
| Age Bracket | # Households | % Households |
| Under 35 Years | 788 | 15.0% |
| 35 to 44 Years | 840 | 16.0% |
| 45 to 54 Years | 972 | 18.5% |
| 55 to 64 Years | 1,058 | 20.2% |
| 65 to 74 Years | 962 | 18.3% |
| 75 to 84 Years | 548 | 10.4% |
| 85 Years and Over | 83 | 1.6% |
| Total | 5,251 | 100.0% |
Housing Finances in Talladega
Median Income by Occupancy in Talladega
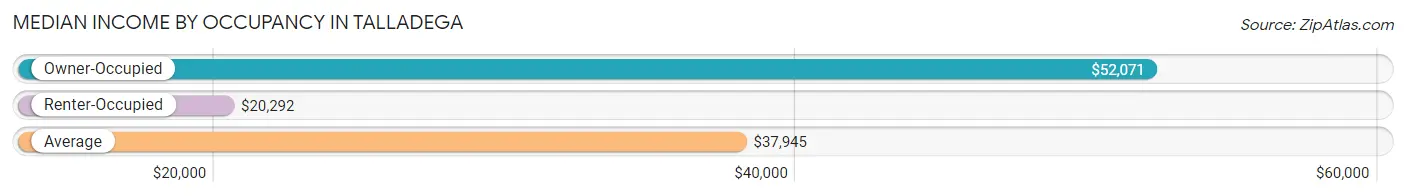
| Occupancy Type | # Households | Median Income |
| Owner-Occupied | 2,842 (54.1%) | $52,071 |
| Renter-Occupied | 2,409 (45.9%) | $20,292 |
| Average | 5,251 (100.0%) | $37,945 |
Occupancy by Householder Income Bracket in Talladega
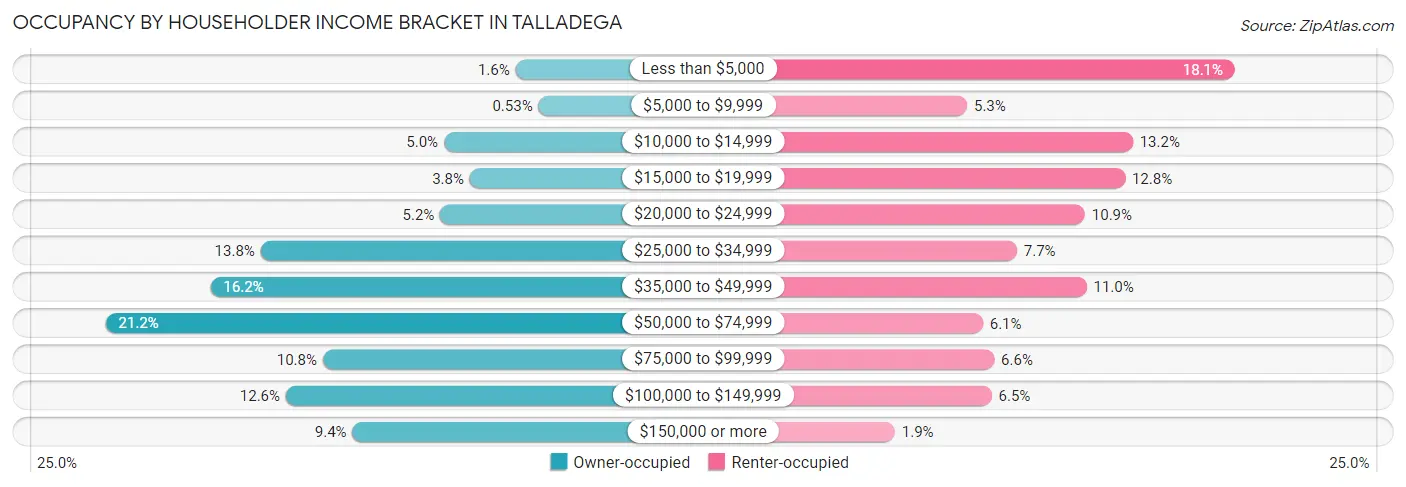
| Income Bracket | Owner-occupied | Renter-occupied |
| Less than $5,000 | 46 (1.6%) | 435 (18.1%) |
| $5,000 to $9,999 | 15 (0.5%) | 128 (5.3%) |
| $10,000 to $14,999 | 143 (5.0%) | 318 (13.2%) |
| $15,000 to $19,999 | 108 (3.8%) | 309 (12.8%) |
| $20,000 to $24,999 | 148 (5.2%) | 263 (10.9%) |
| $25,000 to $34,999 | 391 (13.8%) | 185 (7.7%) |
| $35,000 to $49,999 | 459 (16.2%) | 265 (11.0%) |
| $50,000 to $74,999 | 601 (21.1%) | 146 (6.1%) |
| $75,000 to $99,999 | 307 (10.8%) | 159 (6.6%) |
| $100,000 to $149,999 | 357 (12.6%) | 156 (6.5%) |
| $150,000 or more | 267 (9.4%) | 45 (1.9%) |
| Total | 2,842 (100.0%) | 2,409 (100.0%) |
Monthly Housing Cost Tiers in Talladega
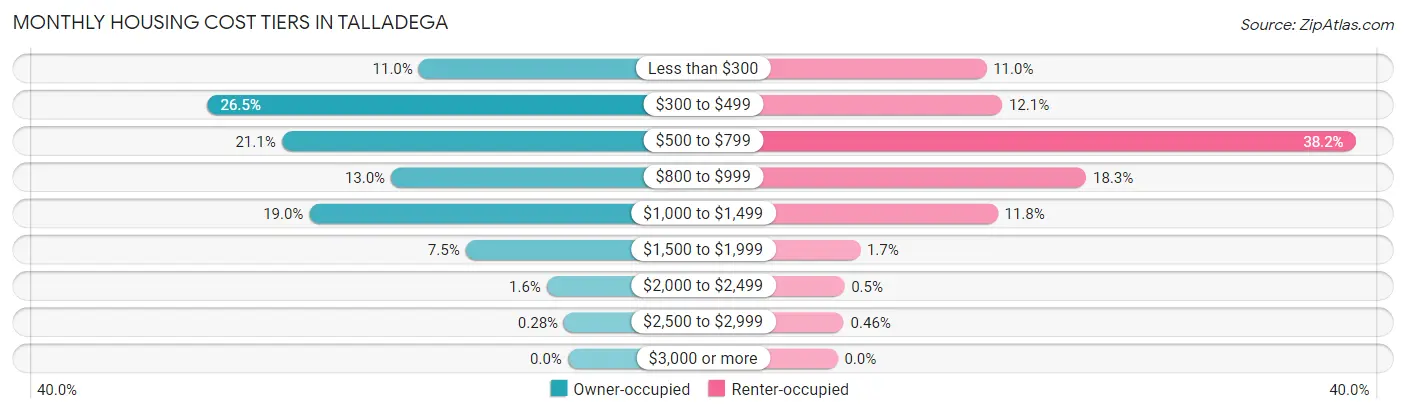
| Monthly Cost | Owner-occupied | Renter-occupied |
| Less than $300 | 312 (11.0%) | 264 (11.0%) |
| $300 to $499 | 754 (26.5%) | 292 (12.1%) |
| $500 to $799 | 599 (21.1%) | 919 (38.2%) |
| $800 to $999 | 370 (13.0%) | 441 (18.3%) |
| $1,000 to $1,499 | 541 (19.0%) | 284 (11.8%) |
| $1,500 to $1,999 | 214 (7.5%) | 40 (1.7%) |
| $2,000 to $2,499 | 44 (1.5%) | 12 (0.5%) |
| $2,500 to $2,999 | 8 (0.3%) | 11 (0.5%) |
| $3,000 or more | 0 (0.0%) | 0 (0.0%) |
| Total | 2,842 (100.0%) | 2,409 (100.0%) |
Physical Housing Characteristics in Talladega
Housing Structures in Talladega
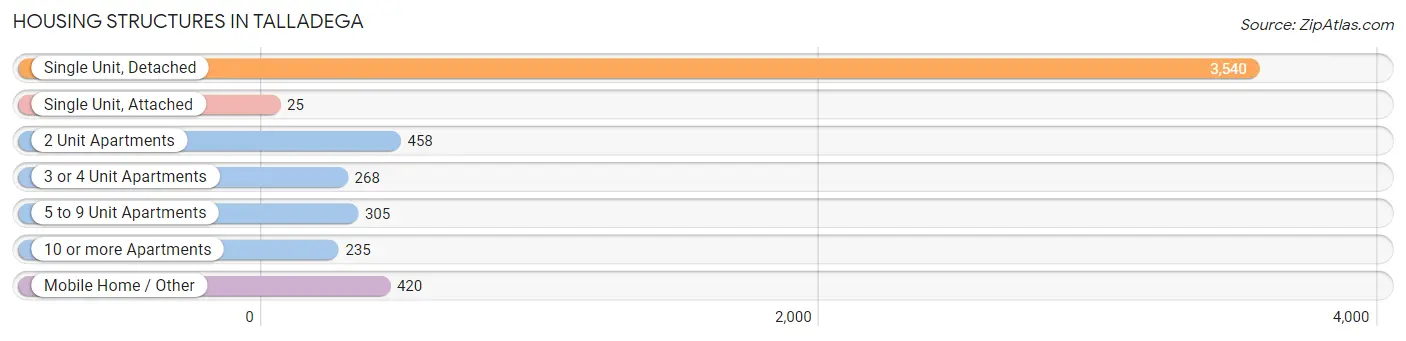
| Structure Type | # Housing Units | % Housing Units |
| Single Unit, Detached | 3,540 | 67.4% |
| Single Unit, Attached | 25 | 0.5% |
| 2 Unit Apartments | 458 | 8.7% |
| 3 or 4 Unit Apartments | 268 | 5.1% |
| 5 to 9 Unit Apartments | 305 | 5.8% |
| 10 or more Apartments | 235 | 4.5% |
| Mobile Home / Other | 420 | 8.0% |
| Total | 5,251 | 100.0% |
Housing Structures by Occupancy in Talladega
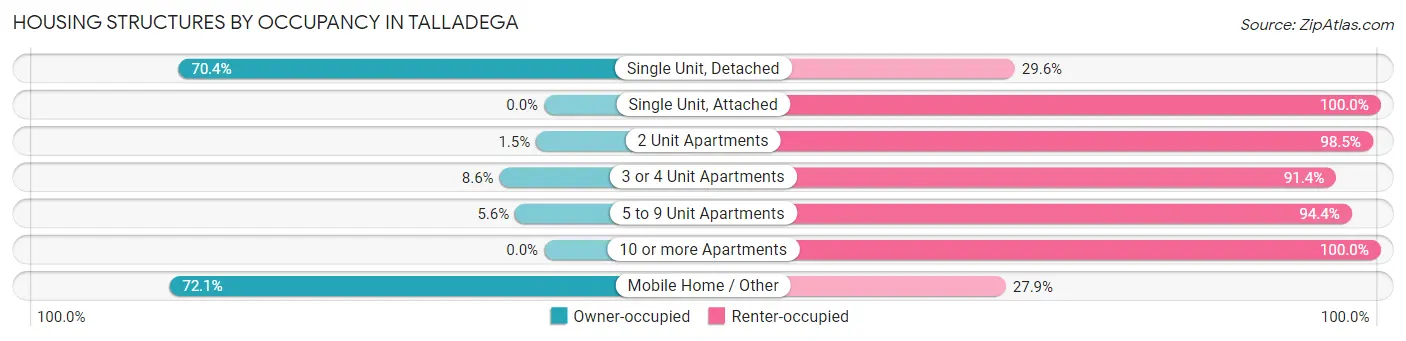
| Structure Type | Owner-occupied | Renter-occupied |
| Single Unit, Detached | 2,492 (70.4%) | 1,048 (29.6%) |
| Single Unit, Attached | 0 (0.0%) | 25 (100.0%) |
| 2 Unit Apartments | 7 (1.5%) | 451 (98.5%) |
| 3 or 4 Unit Apartments | 23 (8.6%) | 245 (91.4%) |
| 5 to 9 Unit Apartments | 17 (5.6%) | 288 (94.4%) |
| 10 or more Apartments | 0 (0.0%) | 235 (100.0%) |
| Mobile Home / Other | 303 (72.1%) | 117 (27.9%) |
| Total | 2,842 (54.1%) | 2,409 (45.9%) |
Housing Structures by Number of Rooms in Talladega
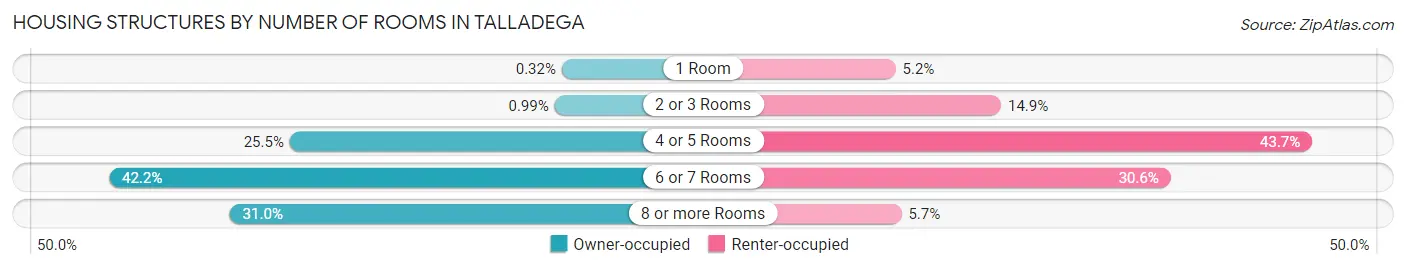
| Number of Rooms | Owner-occupied | Renter-occupied |
| 1 Room | 9 (0.3%) | 124 (5.1%) |
| 2 or 3 Rooms | 28 (1.0%) | 359 (14.9%) |
| 4 or 5 Rooms | 724 (25.5%) | 1,052 (43.7%) |
| 6 or 7 Rooms | 1,199 (42.2%) | 737 (30.6%) |
| 8 or more Rooms | 882 (31.0%) | 137 (5.7%) |
| Total | 2,842 (100.0%) | 2,409 (100.0%) |
Housing Structure by Heating Type in Talladega
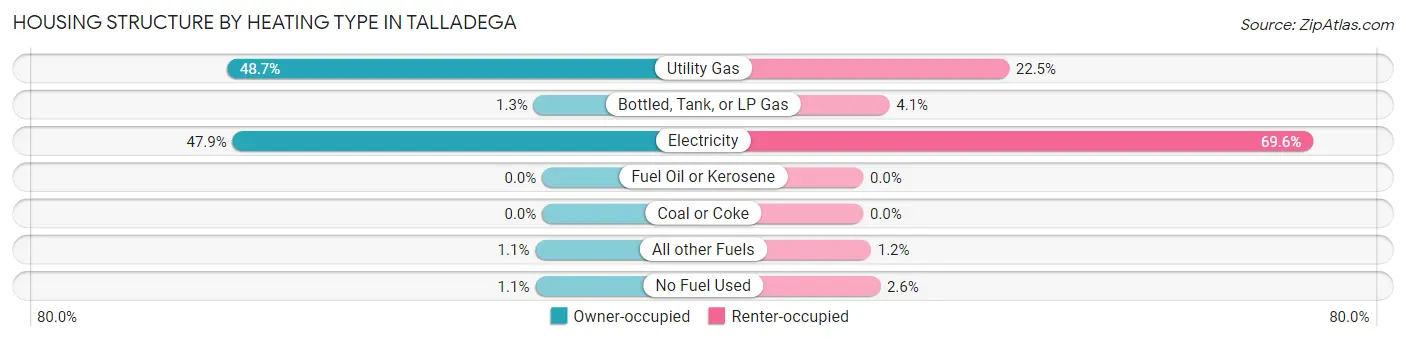
| Heating Type | Owner-occupied | Renter-occupied |
| Utility Gas | 1,385 (48.7%) | 543 (22.5%) |
| Bottled, Tank, or LP Gas | 37 (1.3%) | 98 (4.1%) |
| Electricity | 1,360 (47.8%) | 1,676 (69.6%) |
| Fuel Oil or Kerosene | 0 (0.0%) | 0 (0.0%) |
| Coal or Coke | 0 (0.0%) | 0 (0.0%) |
| All other Fuels | 30 (1.1%) | 29 (1.2%) |
| No Fuel Used | 30 (1.1%) | 63 (2.6%) |
| Total | 2,842 (100.0%) | 2,409 (100.0%) |
Household Vehicle Usage in Talladega
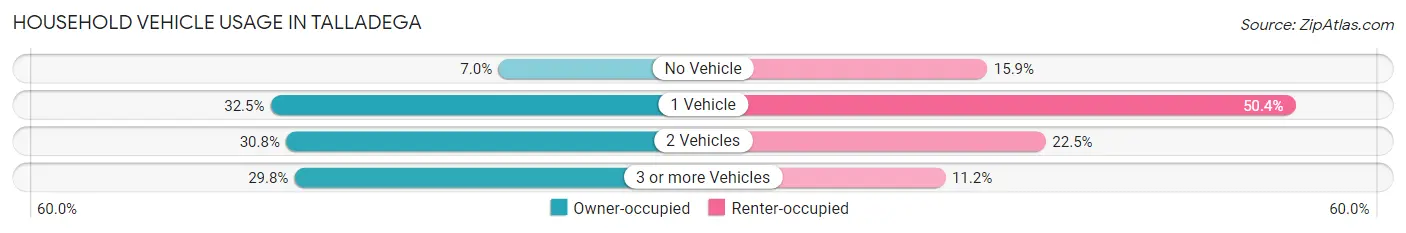
| Vehicles per Household | Owner-occupied | Renter-occupied |
| No Vehicle | 198 (7.0%) | 383 (15.9%) |
| 1 Vehicle | 923 (32.5%) | 1,215 (50.4%) |
| 2 Vehicles | 874 (30.7%) | 541 (22.5%) |
| 3 or more Vehicles | 847 (29.8%) | 270 (11.2%) |
| Total | 2,842 (100.0%) | 2,409 (100.0%) |
Real Estate & Mortgages in Talladega
Real Estate and Mortgage Overview in Talladega
| Characteristic | Without Mortgage | With Mortgage |
| Housing Units | 1,530 | 1,312 |
| Median Property Value | $86,100 | $118,100 |
| Median Household Income | $45,369 | $176 |
| Monthly Housing Costs | $387 | $0 |
| Real Estate Taxes | $317 | $223 |
Property Value by Mortgage Status in Talladega
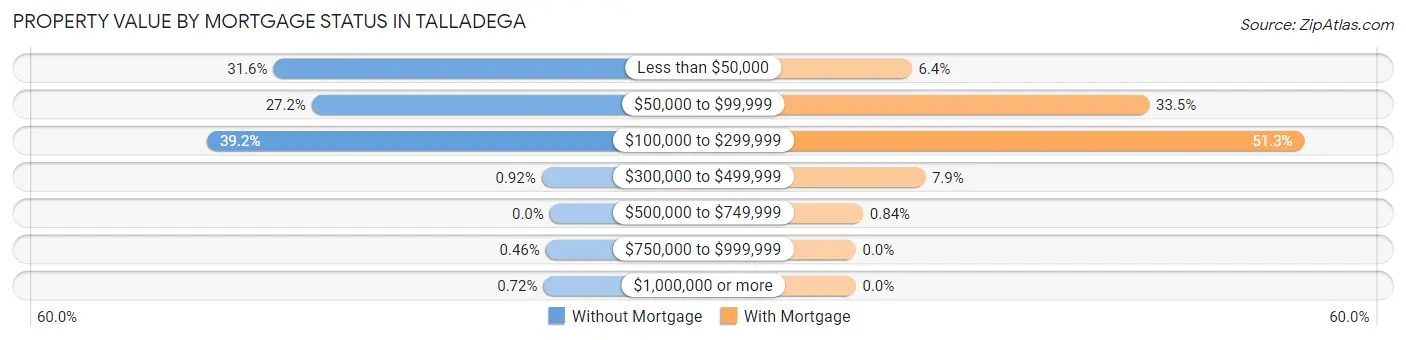
| Property Value | Without Mortgage | With Mortgage |
| Less than $50,000 | 483 (31.6%) | 84 (6.4%) |
| $50,000 to $99,999 | 416 (27.2%) | 440 (33.5%) |
| $100,000 to $299,999 | 599 (39.2%) | 673 (51.3%) |
| $300,000 to $499,999 | 14 (0.9%) | 104 (7.9%) |
| $500,000 to $749,999 | 0 (0.0%) | 11 (0.8%) |
| $750,000 to $999,999 | 7 (0.5%) | 0 (0.0%) |
| $1,000,000 or more | 11 (0.7%) | 0 (0.0%) |
| Total | 1,530 (100.0%) | 1,312 (100.0%) |
Household Income by Mortgage Status in Talladega
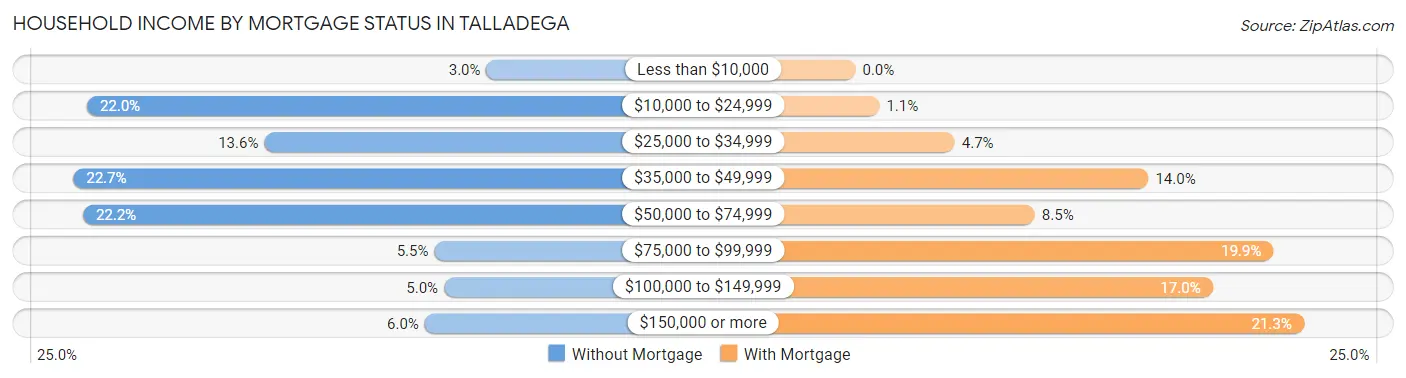
| Household Income | Without Mortgage | With Mortgage |
| Less than $10,000 | 46 (3.0%) | 0 (0.0%) |
| $10,000 to $24,999 | 337 (22.0%) | 15 (1.1%) |
| $25,000 to $34,999 | 208 (13.6%) | 62 (4.7%) |
| $35,000 to $49,999 | 347 (22.7%) | 183 (14.0%) |
| $50,000 to $74,999 | 340 (22.2%) | 112 (8.5%) |
| $75,000 to $99,999 | 84 (5.5%) | 261 (19.9%) |
| $100,000 to $149,999 | 77 (5.0%) | 223 (17.0%) |
| $150,000 or more | 91 (5.9%) | 280 (21.3%) |
| Total | 1,530 (100.0%) | 1,312 (100.0%) |
Property Value to Household Income Ratio in Talladega
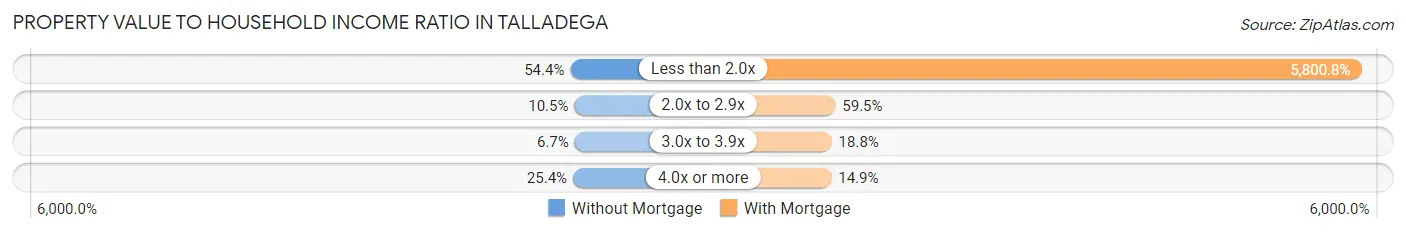
| Value-to-Income Ratio | Without Mortgage | With Mortgage |
| Less than 2.0x | 832 (54.4%) | 76,106 (5,800.8%) |
| 2.0x to 2.9x | 160 (10.5%) | 780 (59.5%) |
| 3.0x to 3.9x | 103 (6.7%) | 246 (18.8%) |
| 4.0x or more | 389 (25.4%) | 195 (14.9%) |
| Total | 1,530 (100.0%) | 1,312 (100.0%) |
Real Estate Taxes by Mortgage Status in Talladega
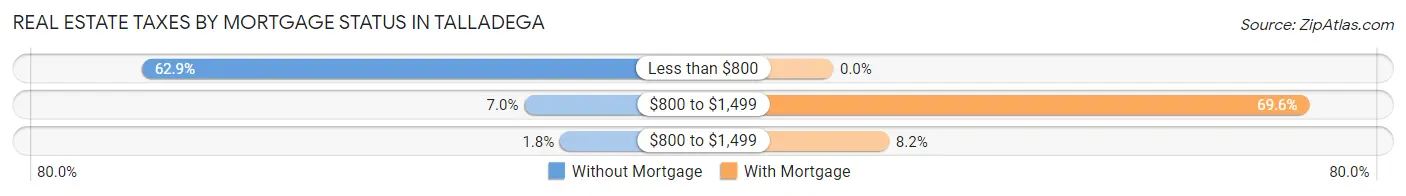
| Property Taxes | Without Mortgage | With Mortgage |
| Less than $800 | 962 (62.9%) | 0 (0.0%) |
| $800 to $1,499 | 107 (7.0%) | 913 (69.6%) |
| $800 to $1,499 | 27 (1.8%) | 107 (8.2%) |
| Total | 1,530 (100.0%) | 1,312 (100.0%) |
Health & Disability in Talladega
Health Insurance Coverage by Age in Talladega
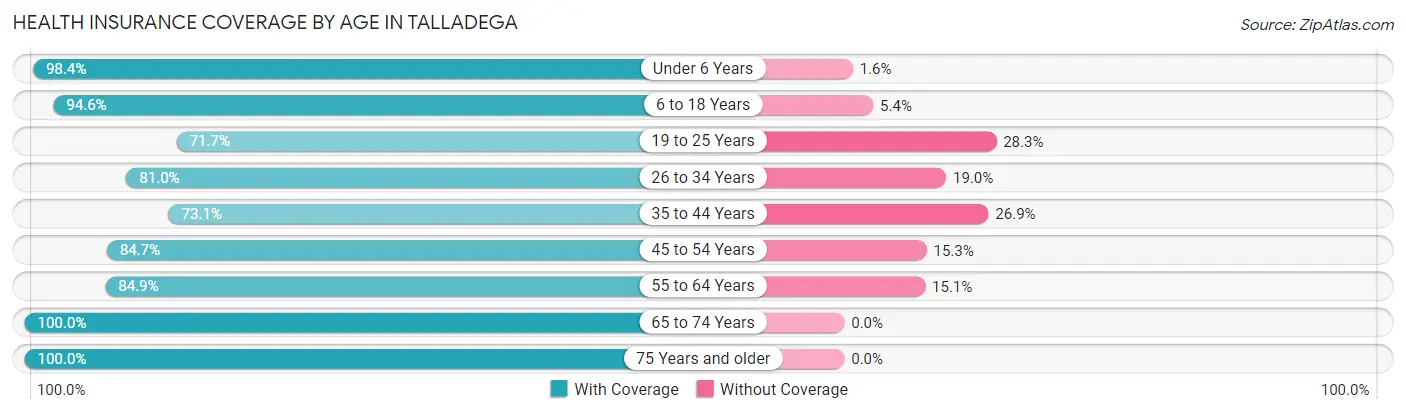
| Age Bracket | With Coverage | Without Coverage |
| Under 6 Years | 816 (98.4%) | 13 (1.6%) |
| 6 to 18 Years | 1,723 (94.6%) | 98 (5.4%) |
| 19 to 25 Years | 1,247 (71.7%) | 493 (28.3%) |
| 26 to 34 Years | 1,079 (81.0%) | 253 (19.0%) |
| 35 to 44 Years | 1,078 (73.1%) | 396 (26.9%) |
| 45 to 54 Years | 1,441 (84.7%) | 261 (15.3%) |
| 55 to 64 Years | 1,341 (84.9%) | 238 (15.1%) |
| 65 to 74 Years | 1,436 (100.0%) | 0 (0.0%) |
| 75 Years and older | 911 (100.0%) | 0 (0.0%) |
| Total | 11,072 (86.3%) | 1,752 (13.7%) |
Health Insurance Coverage by Citizenship Status in Talladega

| Citizenship Status | With Coverage | Without Coverage |
| Native Born | 816 (98.4%) | 13 (1.6%) |
| Foreign Born, Citizen | 1,723 (94.6%) | 98 (5.4%) |
| Foreign Born, not a Citizen | 1,247 (71.7%) | 493 (28.3%) |
Health Insurance Coverage by Household Income in Talladega
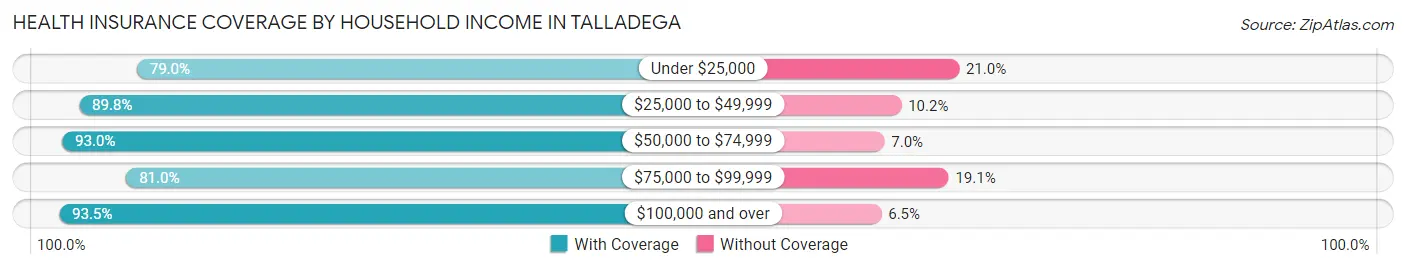
| Household Income | With Coverage | Without Coverage |
| Under $25,000 | 3,243 (79.0%) | 863 (21.0%) |
| $25,000 to $49,999 | 2,218 (89.8%) | 252 (10.2%) |
| $50,000 to $74,999 | 1,624 (93.0%) | 123 (7.0%) |
| $75,000 to $99,999 | 1,062 (80.9%) | 250 (19.1%) |
| $100,000 and over | 2,490 (93.5%) | 172 (6.5%) |
Public vs Private Health Insurance Coverage by Age in Talladega
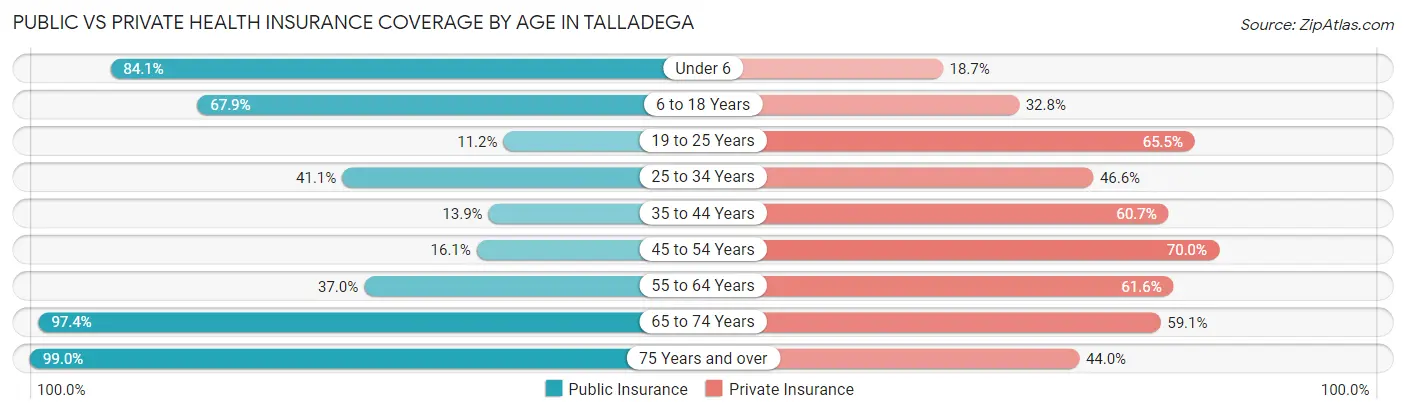
| Age Bracket | Public Insurance | Private Insurance |
| Under 6 | 697 (84.1%) | 155 (18.7%) |
| 6 to 18 Years | 1,237 (67.9%) | 598 (32.8%) |
| 19 to 25 Years | 194 (11.2%) | 1,140 (65.5%) |
| 25 to 34 Years | 547 (41.1%) | 621 (46.6%) |
| 35 to 44 Years | 205 (13.9%) | 894 (60.7%) |
| 45 to 54 Years | 274 (16.1%) | 1,191 (70.0%) |
| 55 to 64 Years | 584 (37.0%) | 972 (61.6%) |
| 65 to 74 Years | 1,399 (97.4%) | 849 (59.1%) |
| 75 Years and over | 902 (99.0%) | 401 (44.0%) |
| Total | 6,039 (47.1%) | 6,821 (53.2%) |
Disability Status by Sex by Age in Talladega
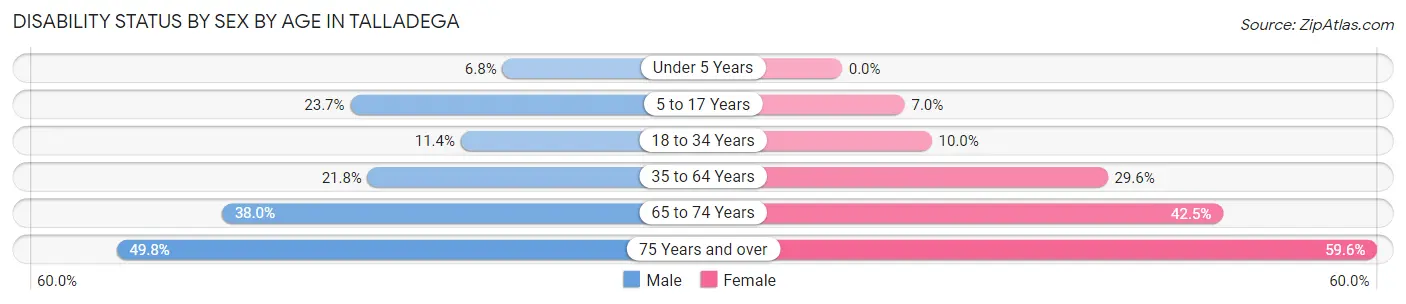
| Age Bracket | Male | Female |
| Under 5 Years | 23 (6.8%) | 0 (0.0%) |
| 5 to 17 Years | 237 (23.7%) | 48 (7.0%) |
| 18 to 34 Years | 195 (11.4%) | 160 (10.0%) |
| 35 to 64 Years | 464 (21.8%) | 777 (29.6%) |
| 65 to 74 Years | 213 (38.0%) | 372 (42.5%) |
| 75 Years and over | 213 (49.8%) | 288 (59.6%) |
Disability Class by Sex by Age in Talladega
Disability Class: Hearing Difficulty
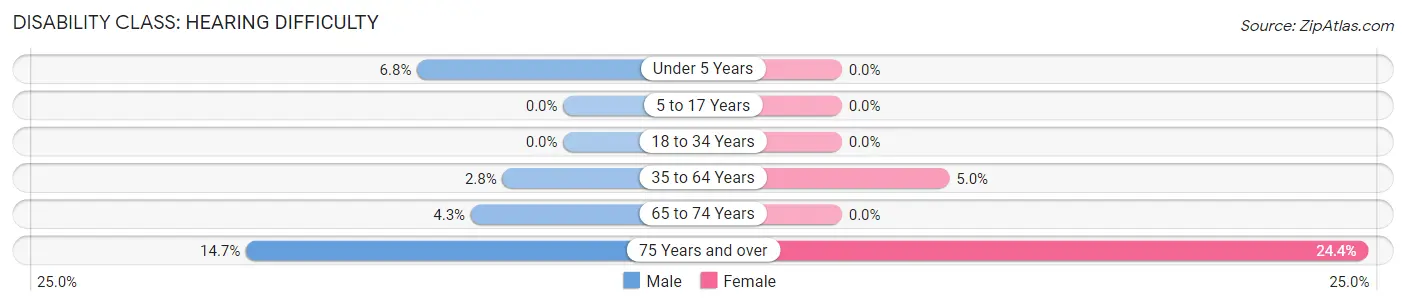
| Age Bracket | Male | Female |
| Under 5 Years | 23 (6.8%) | 0 (0.0%) |
| 5 to 17 Years | 0 (0.0%) | 0 (0.0%) |
| 18 to 34 Years | 0 (0.0%) | 0 (0.0%) |
| 35 to 64 Years | 60 (2.8%) | 131 (5.0%) |
| 65 to 74 Years | 24 (4.3%) | 0 (0.0%) |
| 75 Years and over | 63 (14.7%) | 118 (24.4%) |
Disability Class: Vision Difficulty
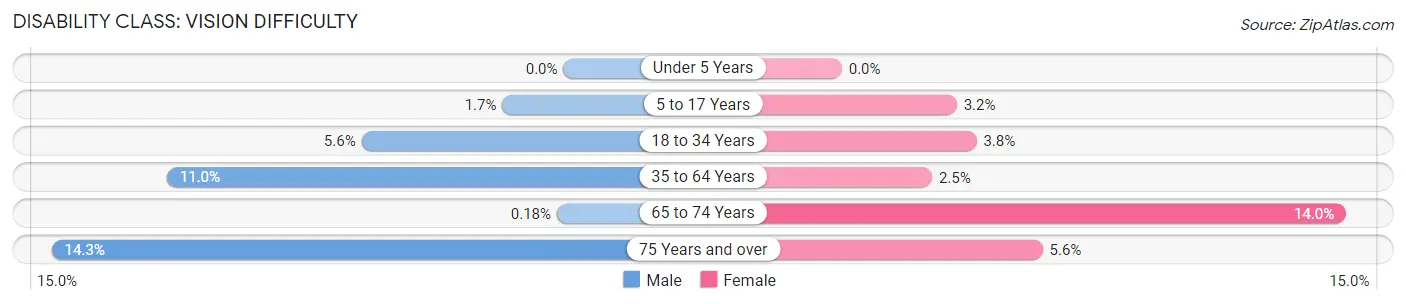
| Age Bracket | Male | Female |
| Under 5 Years | 0 (0.0%) | 0 (0.0%) |
| 5 to 17 Years | 17 (1.7%) | 22 (3.2%) |
| 18 to 34 Years | 96 (5.6%) | 60 (3.7%) |
| 35 to 64 Years | 235 (11.0%) | 66 (2.5%) |
| 65 to 74 Years | 1 (0.2%) | 123 (14.0%) |
| 75 Years and over | 61 (14.2%) | 27 (5.6%) |
Disability Class: Cognitive Difficulty
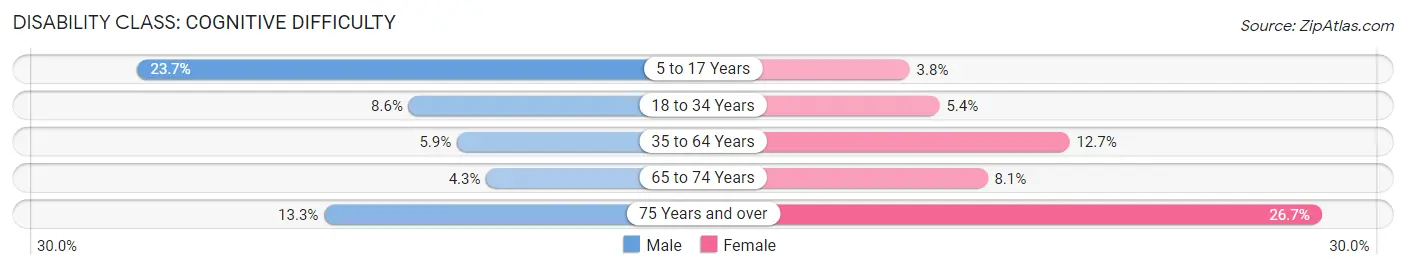
| Age Bracket | Male | Female |
| 5 to 17 Years | 237 (23.7%) | 26 (3.8%) |
| 18 to 34 Years | 147 (8.6%) | 87 (5.4%) |
| 35 to 64 Years | 126 (5.9%) | 333 (12.7%) |
| 65 to 74 Years | 24 (4.3%) | 71 (8.1%) |
| 75 Years and over | 57 (13.3%) | 129 (26.7%) |
Disability Class: Ambulatory Difficulty
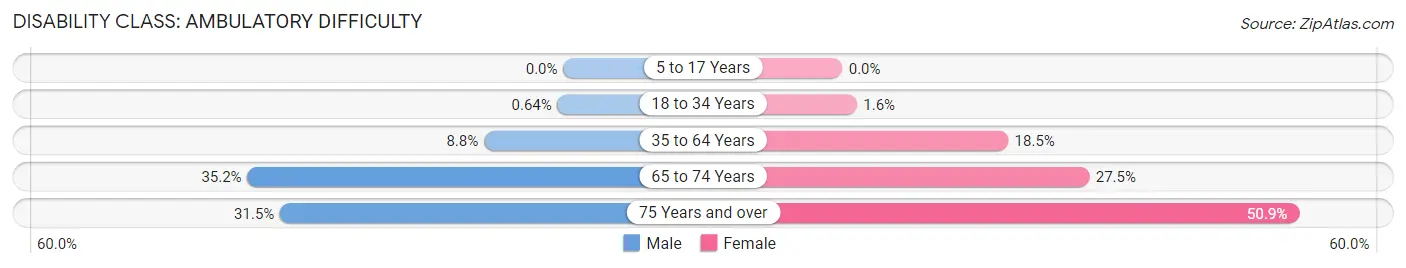
| Age Bracket | Male | Female |
| 5 to 17 Years | 0 (0.0%) | 0 (0.0%) |
| 18 to 34 Years | 11 (0.6%) | 26 (1.6%) |
| 35 to 64 Years | 188 (8.8%) | 485 (18.5%) |
| 65 to 74 Years | 197 (35.2%) | 241 (27.5%) |
| 75 Years and over | 135 (31.5%) | 246 (50.9%) |
Disability Class: Self-Care Difficulty
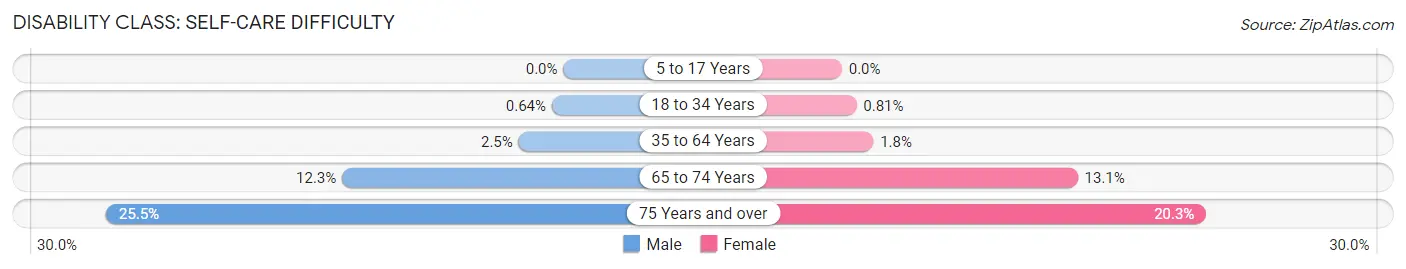
| Age Bracket | Male | Female |
| 5 to 17 Years | 0 (0.0%) | 0 (0.0%) |
| 18 to 34 Years | 11 (0.6%) | 13 (0.8%) |
| 35 to 64 Years | 53 (2.5%) | 46 (1.8%) |
| 65 to 74 Years | 69 (12.3%) | 115 (13.1%) |
| 75 Years and over | 109 (25.5%) | 98 (20.3%) |
Technology Access in Talladega
Computing Device Access in Talladega
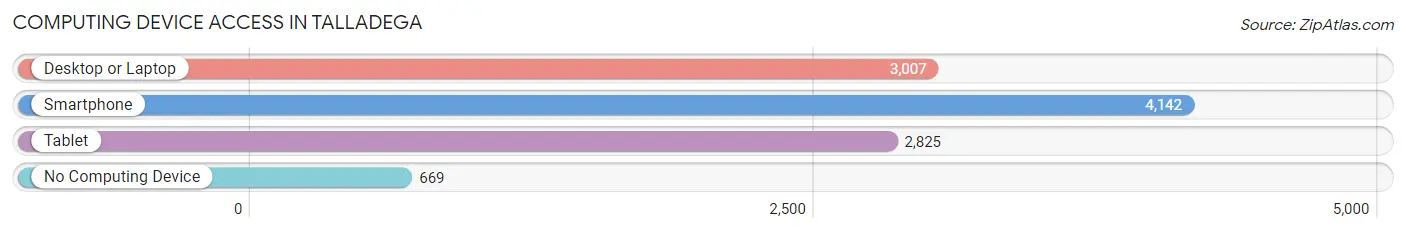
| Device Type | # Households | % Households |
| Desktop or Laptop | 3,007 | 57.3% |
| Smartphone | 4,142 | 78.9% |
| Tablet | 2,825 | 53.8% |
| No Computing Device | 669 | 12.7% |
| Total | 5,251 | 100.0% |
Internet Access in Talladega
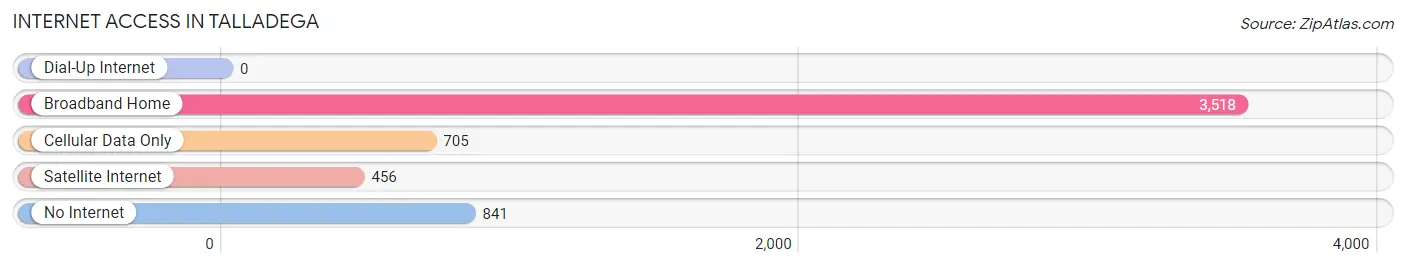
| Internet Type | # Households | % Households |
| Dial-Up Internet | 0 | 0.0% |
| Broadband Home | 3,518 | 67.0% |
| Cellular Data Only | 705 | 13.4% |
| Satellite Internet | 456 | 8.7% |
| No Internet | 841 | 16.0% |
| Total | 5,251 | 100.0% |
Talladega Summary
Talladega, Alabama is a city located in Talladega County in the state of Alabama. It is the county seat of Talladega County and is located in the east-central part of the state. The city is situated at the foothills of the Appalachian Mountains and is located approximately 50 miles east of Birmingham. The city has a population of 15,676 as of the 2010 census.
History
The area that is now Talladega was originally inhabited by the Creek Indians. The city was founded in 1835 and was named after a Creek Indian chief named Talladega. The city was incorporated in 1839 and was the county seat of Talladega County. During the Civil War, Talladega was a major supply center for the Confederate Army. After the war, the city experienced a period of growth and development. In the late 19th century, the city was a major center for the production of iron and steel.
Geography
Talladega is located at 33°27'N 86°10'W (33.45, -86.17). The city has a total area of 16.2 square miles, of which 16.1 square miles is land and 0.1 square miles is water. The city is located in the foothills of the Appalachian Mountains and is situated at an elevation of 590 feet above sea level.
Economy
Talladega's economy is largely based on manufacturing and tourism. The city is home to several large manufacturing plants, including a Honda plant, a Goodyear plant, and a Michelin plant. The city is also home to several tourist attractions, including the Talladega Superspeedway, the Talladega National Forest, and the Talladega Scenic Byway.
Demographics
As of the 2010 census, there were 15,676 people, 6,541 households, and 4,072 families residing in the city. The population density was 971.2 people per square mile. The racial makeup of the city was 63.2% White, 34.2% African American, 0.3% Native American, 0.5% Asian, 0.1% Pacific Islander, 0.7% from other races, and 0.9% from two or more races. Hispanic or Latino of any race were 1.7% of the population.
The median income for a household in the city was $30,945, and the median income for a family was $37,945. The per capita income for the city was $17,845. About 19.2% of families and 22.3% of the population were below the poverty line, including 33.2% of those under age 18 and 16.2% of those age 65 or over.
Common Questions
What is Per Capita Income in Talladega?
Per Capita income in Talladega is $20,856.
What is the Median Family Income in Talladega?
Median Family Income in Talladega is $47,229.
What is the Median Household income in Talladega?
Median Household Income in Talladega is $37,945.
What is Income or Wage Gap in Talladega?
Income or Wage Gap in Talladega is 22.0%.
Women in Talladega earn 78.0 cents for every dollar earned by a man.
What is Family Income Deficit in Talladega?
Family Income Deficit in Talladega is $12,724.
Families that are below poverty line in Talladega earn $12,724 less on average than the poverty threshold level.
What is Inequality or Gini Index in Talladega?
Inequality or Gini Index in Talladega is 0.49.
What is the Total Population of Talladega?
Total Population of Talladega is 15,071.
What is the Total Male Population of Talladega?
Total Male Population of Talladega is 7,774.
What is the Total Female Population of Talladega?
Total Female Population of Talladega is 7,297.
What is the Ratio of Males per 100 Females in Talladega?
There are 106.54 Males per 100 Females in Talladega.
What is the Ratio of Females per 100 Males in Talladega?
There are 93.86 Females per 100 Males in Talladega.
What is the Median Population Age in Talladega?
Median Population Age in Talladega is 39.6 Years.
What is the Average Family Size in Talladega
Average Family Size in Talladega is 2.8 People.
What is the Average Household Size in Talladega
Average Household Size in Talladega is 2.3 People.
How Large is the Labor Force in Talladega?
There are 5,566 People in the Labor Forcein in Talladega.
What is the Percentage of People in the Labor Force in Talladega?
44.0% of People are in the Labor Force in Talladega.
What is the Unemployment Rate in Talladega?
Unemployment Rate in Talladega is 14.3%.