Shelby, AL Map & Demographics
Shelby Map
Shelby Overview
$26,111
PER CAPITA INCOME
$28,403
AVG HOUSEHOLD INCOME
22.3%
WAGE / INCOME GAP [ % ]
77.7¢/ $1
WAGE / INCOME GAP [ $ ]
0.55
INEQUALITY / GINI INDEX
799
TOTAL POPULATION
518
MALE POPULATION
281
FEMALE POPULATION
184.34
MALES / 100 FEMALES
54.25
FEMALES / 100 MALES
56.3
MEDIAN AGE
3.0
AVG FAMILY SIZE
2.2
AVG HOUSEHOLD SIZE
275
LABOR FORCE [ PEOPLE ]
39.5%
PERCENT IN LABOR FORCE
Shelby Zip Codes
Shelby Area Codes
Income in Shelby
Income Overview in Shelby
| Characteristic | Number | Measure |
| Per Capita Income | 799 | $26,111 |
| Median Family Income | 209 | $0 |
| Mean Family Income | 209 | $82,833 |
| Median Household Income | 360 | $28,403 |
| Mean Household Income | 360 | $55,029 |
| Income Deficit | 209 | $0 |
| Wage / Income Gap (%) | 799 | 22.27% |
| Wage / Income Gap ($) | 799 | 77.73¢ per $1 |
| Gini / Inequality Index | 799 | 0.55 |
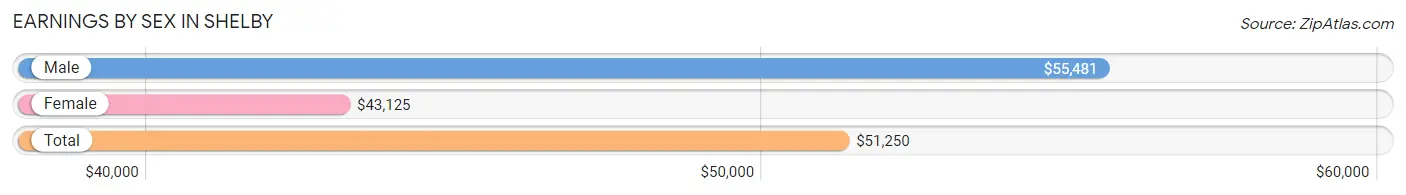
Earnings by Sex in Shelby
Average Earnings in Shelby are $51,250, $55,481 for men and $43,125 for women, a difference of 22.3%.
| Sex | Number | Average Earnings |
| Male | 165 (60.0%) | $55,481 |
| Female | 110 (40.0%) | $43,125 |
| Total | 275 (100.0%) | $51,250 |
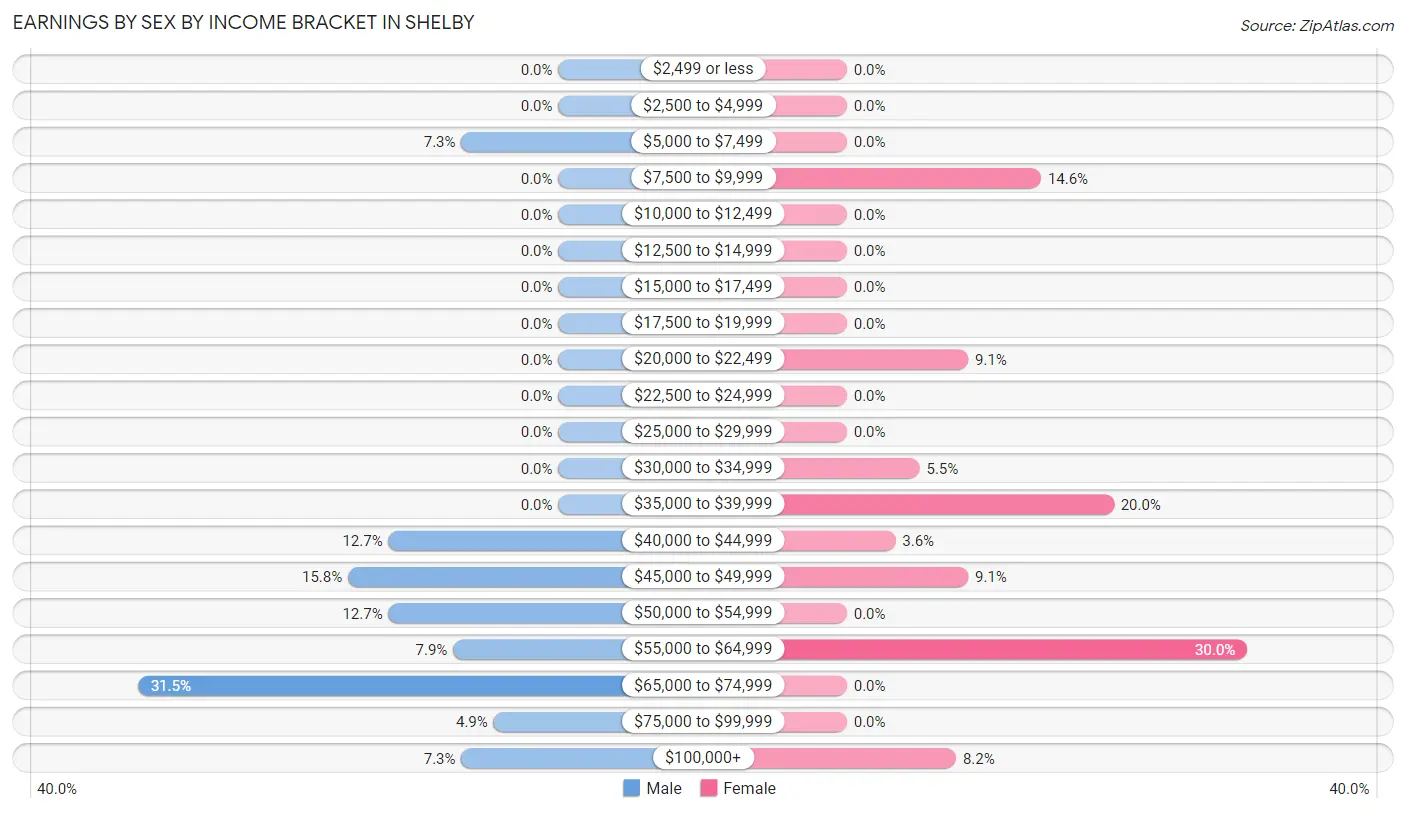
Earnings by Sex by Income Bracket in Shelby
The most common earnings brackets in Shelby are $65,000 to $74,999 for men (52 | 31.5%) and $55,000 to $64,999 for women (33 | 30.0%).
| Income | Male | Female |
| $2,499 or less | 0 (0.0%) | 0 (0.0%) |
| $2,500 to $4,999 | 0 (0.0%) | 0 (0.0%) |
| $5,000 to $7,499 | 12 (7.3%) | 0 (0.0%) |
| $7,500 to $9,999 | 0 (0.0%) | 16 (14.5%) |
| $10,000 to $12,499 | 0 (0.0%) | 0 (0.0%) |
| $12,500 to $14,999 | 0 (0.0%) | 0 (0.0%) |
| $15,000 to $17,499 | 0 (0.0%) | 0 (0.0%) |
| $17,500 to $19,999 | 0 (0.0%) | 0 (0.0%) |
| $20,000 to $22,499 | 0 (0.0%) | 10 (9.1%) |
| $22,500 to $24,999 | 0 (0.0%) | 0 (0.0%) |
| $25,000 to $29,999 | 0 (0.0%) | 0 (0.0%) |
| $30,000 to $34,999 | 0 (0.0%) | 6 (5.4%) |
| $35,000 to $39,999 | 0 (0.0%) | 22 (20.0%) |
| $40,000 to $44,999 | 21 (12.7%) | 4 (3.6%) |
| $45,000 to $49,999 | 26 (15.8%) | 10 (9.1%) |
| $50,000 to $54,999 | 21 (12.7%) | 0 (0.0%) |
| $55,000 to $64,999 | 13 (7.9%) | 33 (30.0%) |
| $65,000 to $74,999 | 52 (31.5%) | 0 (0.0%) |
| $75,000 to $99,999 | 8 (4.9%) | 0 (0.0%) |
| $100,000+ | 12 (7.3%) | 9 (8.2%) |
| Total | 165 (100.0%) | 110 (100.0%) |
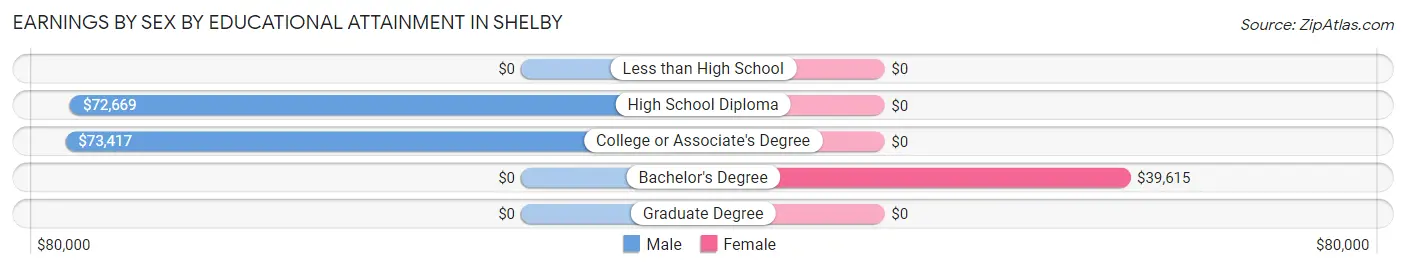
Earnings by Sex by Educational Attainment in Shelby
Average earnings in Shelby are $72,885 for men and $48,750 for women, a difference of 33.1%. Men with an educational attainment of college or associate's degree enjoy the highest average annual earnings of $73,417, while those with high school diploma education earn the least with $72,669. Women with an educational attainment of bachelor's degree earn the most with the average annual earnings of $39,615, while those with bachelor's degree education have the smallest earnings of $39,615.
| Educational Attainment | Male Income | Female Income |
| Less than High School | - | - |
| High School Diploma | $72,669 | $0 |
| College or Associate's Degree | $73,417 | $0 |
| Bachelor's Degree | - | - |
| Graduate Degree | - | - |
| Total | $72,885 | $48,750 |
Family Income in Shelby
Family Income Brackets in Shelby
According to the Shelby family income data, there are 49 families falling into the $100,000 to $149,999 income range, which is the most common income bracket and makes up 23.4% of all families.
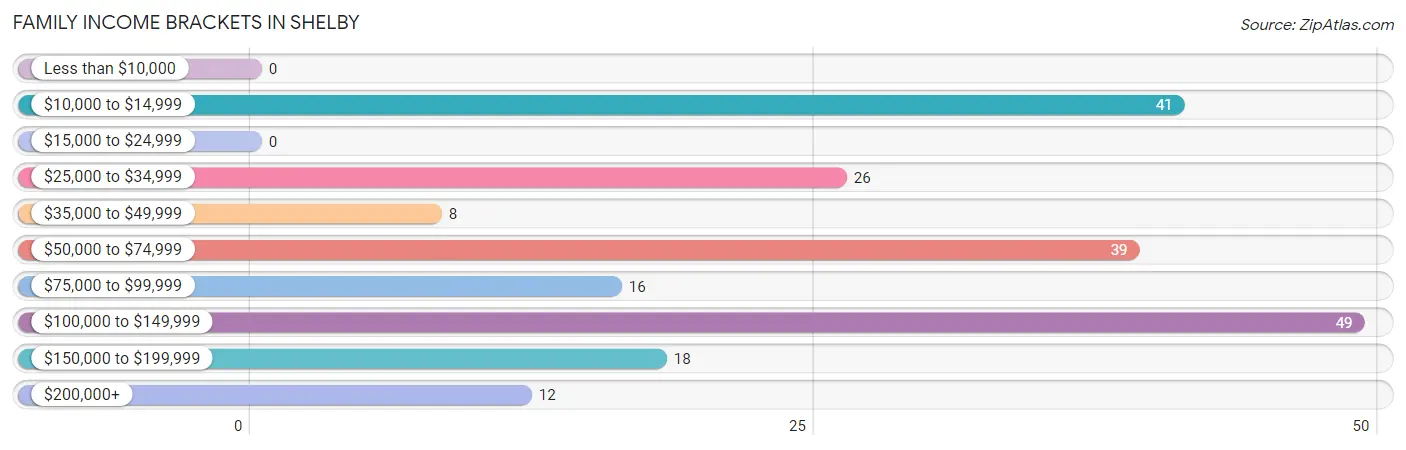
| Income Bracket | # Families | % Families |
| Less than $10,000 | 0 | 0.0% |
| $10,000 to $14,999 | 41 | 19.6% |
| $15,000 to $24,999 | 0 | 0.0% |
| $25,000 to $34,999 | 26 | 12.4% |
| $35,000 to $49,999 | 8 | 3.8% |
| $50,000 to $74,999 | 39 | 18.7% |
| $75,000 to $99,999 | 16 | 7.7% |
| $100,000 to $149,999 | 49 | 23.4% |
| $150,000 to $199,999 | 18 | 8.6% |
| $200,000+ | 12 | 5.7% |
Family Income by Famaliy Size in Shelby
4-person families (57 | 27.3%) account for the highest median family income in Shelby with $139,330 per family, while 4-person families (57 | 27.3%) have the highest median income of $34,832 per family member.
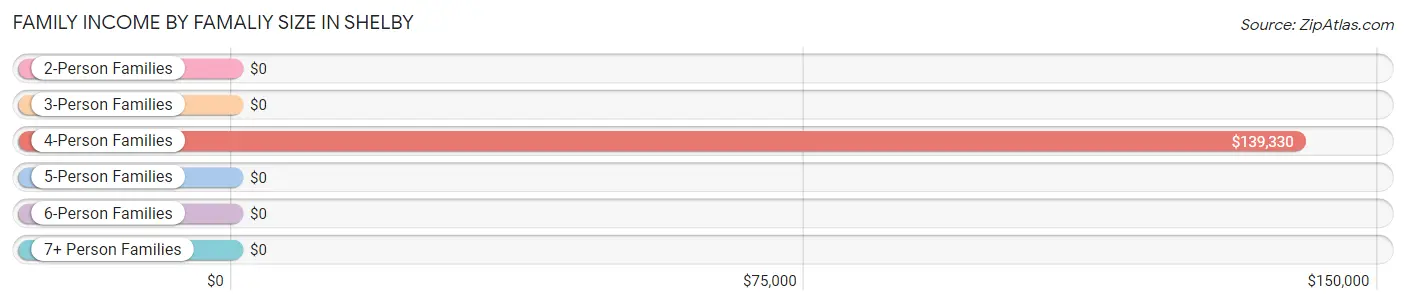
| Income Bracket | # Families | Median Income |
| 2-Person Families | 105 (50.2%) | $0 |
| 3-Person Families | 39 (18.7%) | $0 |
| 4-Person Families | 57 (27.3%) | $139,330 |
| 5-Person Families | 8 (3.8%) | $0 |
| 6-Person Families | 0 (0.0%) | $0 |
| 7+ Person Families | 0 (0.0%) | $0 |
| Total | 209 (100.0%) | $0 |
Family Income by Number of Earners in Shelby
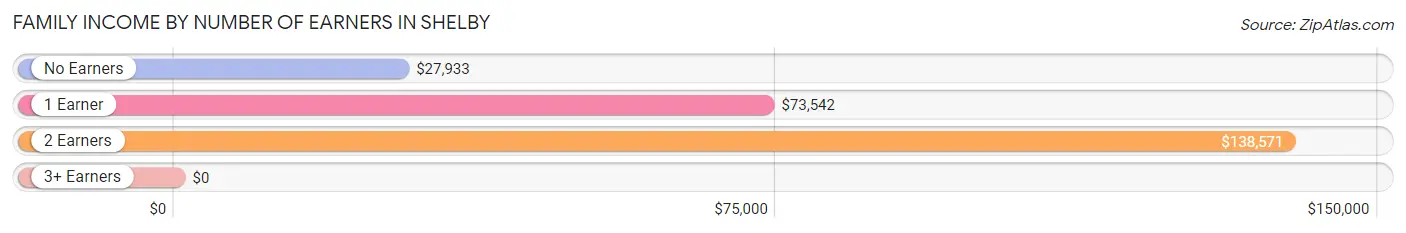
| Number of Earners | # Families | Median Income |
| No Earners | 91 (43.5%) | $27,933 |
| 1 Earner | 39 (18.7%) | $73,542 |
| 2 Earners | 58 (27.8%) | $138,571 |
| 3+ Earners | 21 (10.1%) | $0 |
| Total | 209 (100.0%) | $0 |
Household Income in Shelby
Household Income Brackets in Shelby
With 75 households falling in the category, the $10,000 to $14,999 income range is the most frequent in Shelby, accounting for 20.8% of all households. In contrast, only 8 households (2.2%) fall into the $35,000 to $49,999 income bracket, making it the least populous group.
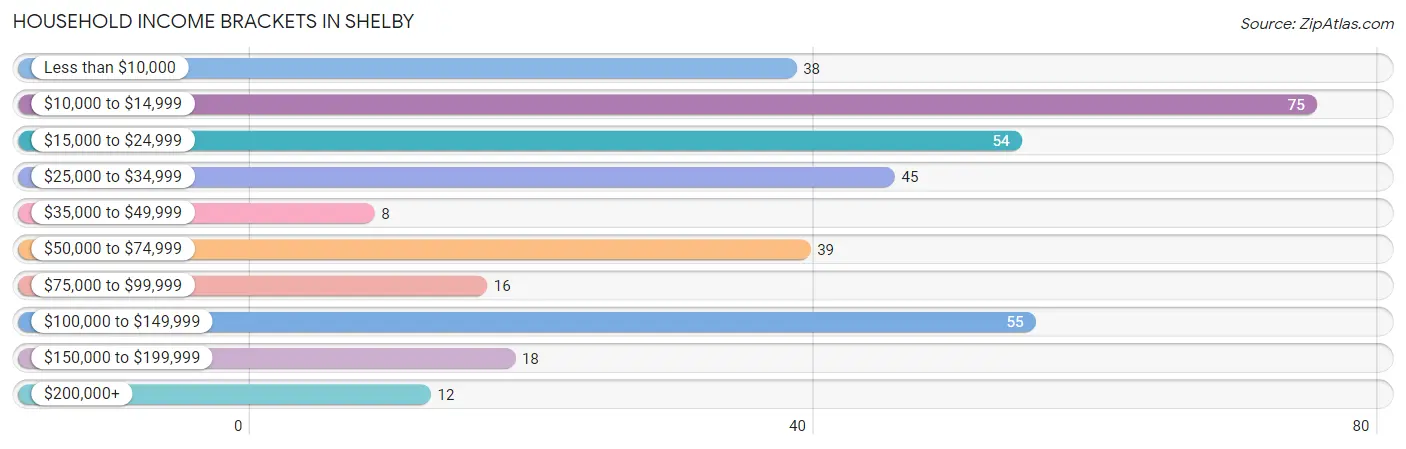
| Income Bracket | # Households | % Households |
| Less than $10,000 | 38 | 10.6% |
| $10,000 to $14,999 | 75 | 20.8% |
| $15,000 to $24,999 | 54 | 15.0% |
| $25,000 to $34,999 | 45 | 12.5% |
| $35,000 to $49,999 | 8 | 2.2% |
| $50,000 to $74,999 | 39 | 10.8% |
| $75,000 to $99,999 | 16 | 4.4% |
| $100,000 to $149,999 | 55 | 15.3% |
| $150,000 to $199,999 | 18 | 5.0% |
| $200,000+ | 12 | 3.3% |
Household Income by Householder Age in Shelby
The median household income in Shelby is $28,403, with the highest median household income of $138,839 found in the 25 to 44 years age bracket for the primary householder. A total of 44 households (12.2%) fall into this category.
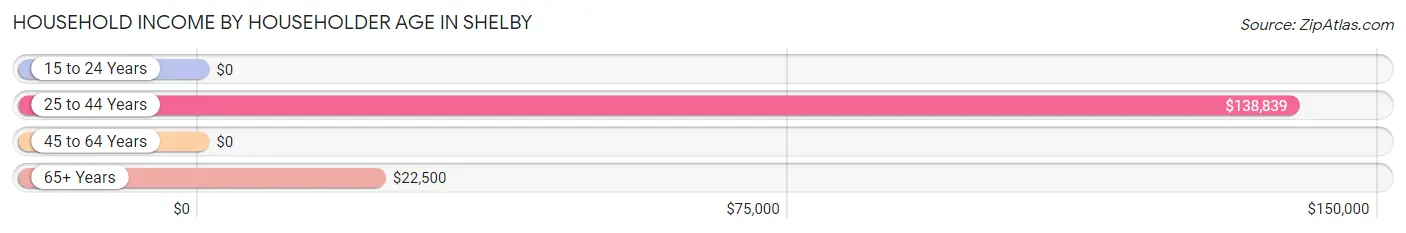
| Income Bracket | # Households | Median Income |
| 15 to 24 Years | 0 (0.0%) | $0 |
| 25 to 44 Years | 44 (12.2%) | $138,839 |
| 45 to 64 Years | 138 (38.3%) | $0 |
| 65+ Years | 178 (49.4%) | $22,500 |
| Total | 360 (100.0%) | $28,403 |
Poverty in Shelby
Income Below Poverty by Sex and Age in Shelby
With 19.1% poverty level for males and 20.4% for females among the residents of Shelby, 75 year old and over males and 75 year old and over females are the most vulnerable to poverty, with 65 males (56.0%) and 31 females (47.7%) in their respective age groups living below the poverty level.
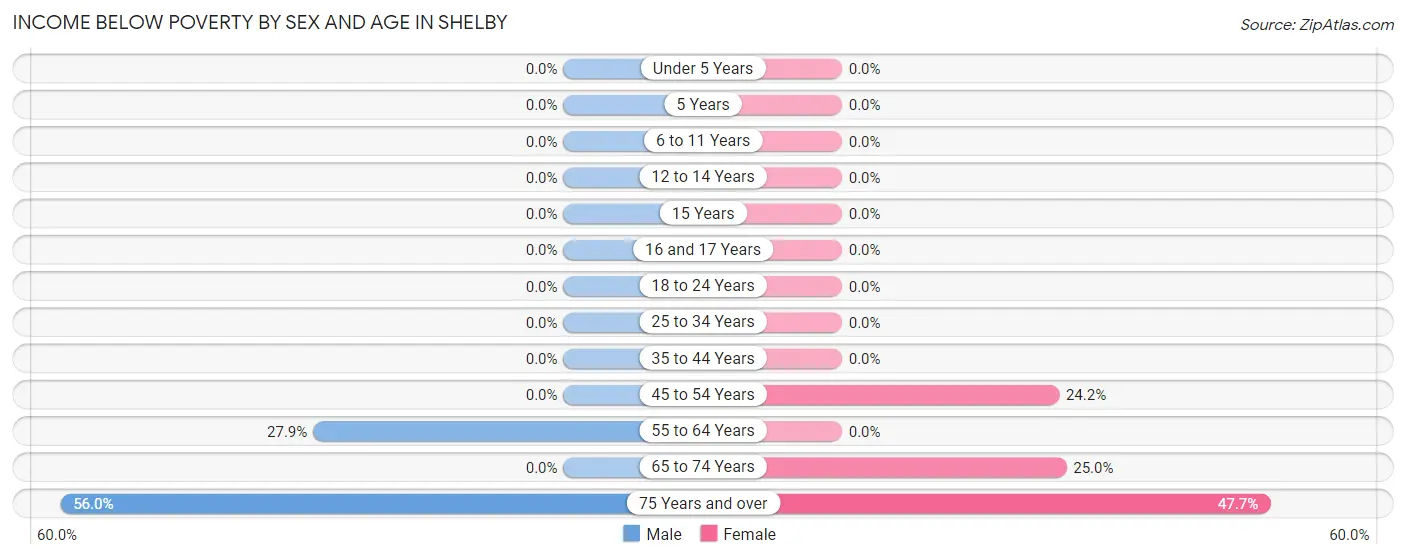
| Age Bracket | Male | Female |
| Under 5 Years | 0 (0.0%) | 0 (0.0%) |
| 5 Years | 0 (0.0%) | 0 (0.0%) |
| 6 to 11 Years | 0 (0.0%) | 0 (0.0%) |
| 12 to 14 Years | 0 (0.0%) | 0 (0.0%) |
| 15 Years | 0 (0.0%) | 0 (0.0%) |
| 16 and 17 Years | 0 (0.0%) | 0 (0.0%) |
| 18 to 24 Years | 0 (0.0%) | 0 (0.0%) |
| 25 to 34 Years | 0 (0.0%) | 0 (0.0%) |
| 35 to 44 Years | 0 (0.0%) | 0 (0.0%) |
| 45 to 54 Years | 0 (0.0%) | 15 (24.2%) |
| 55 to 64 Years | 34 (27.9%) | 0 (0.0%) |
| 65 to 74 Years | 0 (0.0%) | 10 (25.0%) |
| 75 Years and over | 65 (56.0%) | 31 (47.7%) |
| Total | 99 (19.1%) | 56 (20.4%) |
Income Above Poverty by Sex and Age in Shelby
According to the poverty statistics in Shelby, males aged under 5 years and females aged 6 to 11 years are the age groups that are most secure financially, with 100.0% of males and 100.0% of females in these age groups living above the poverty line.
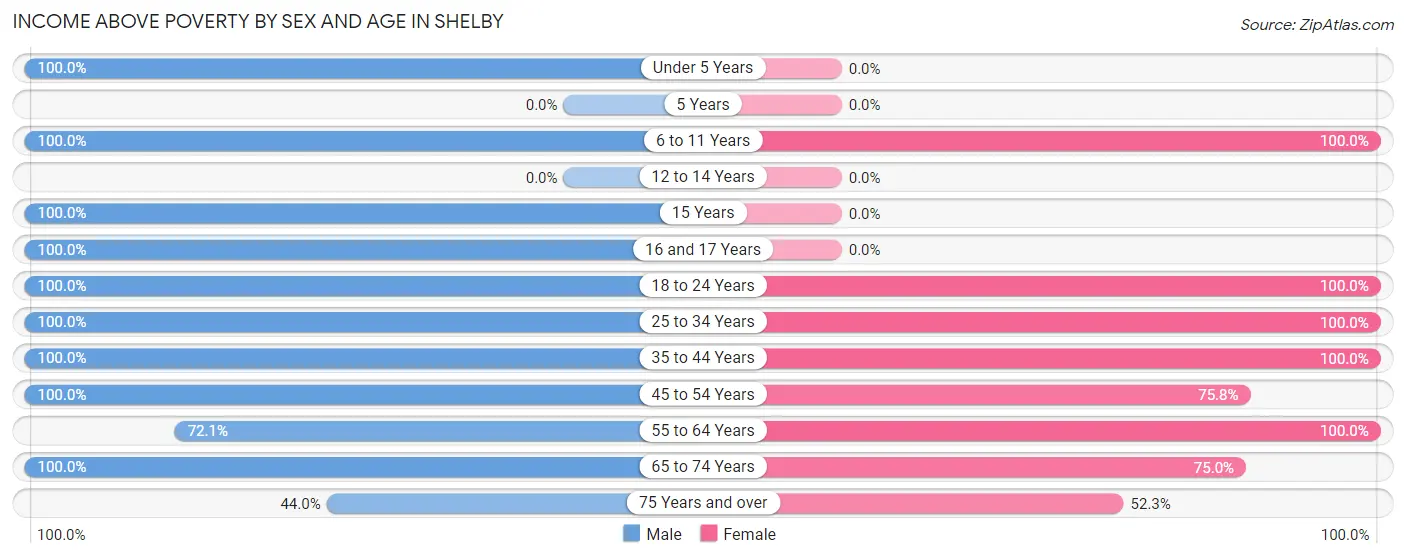
| Age Bracket | Male | Female |
| Under 5 Years | 30 (100.0%) | 0 (0.0%) |
| 5 Years | 0 (0.0%) | 0 (0.0%) |
| 6 to 11 Years | 48 (100.0%) | 10 (100.0%) |
| 12 to 14 Years | 0 (0.0%) | 0 (0.0%) |
| 15 Years | 8 (100.0%) | 0 (0.0%) |
| 16 and 17 Years | 27 (100.0%) | 0 (0.0%) |
| 18 to 24 Years | 37 (100.0%) | 16 (100.0%) |
| 25 to 34 Years | 49 (100.0%) | 33 (100.0%) |
| 35 to 44 Years | 22 (100.0%) | 9 (100.0%) |
| 45 to 54 Years | 22 (100.0%) | 47 (75.8%) |
| 55 to 64 Years | 88 (72.1%) | 40 (100.0%) |
| 65 to 74 Years | 37 (100.0%) | 30 (75.0%) |
| 75 Years and over | 51 (44.0%) | 34 (52.3%) |
| Total | 419 (80.9%) | 219 (79.6%) |
Income Below Poverty Among Married-Couple Families in Shelby
The poverty statistics for married-couple families in Shelby show that 16.3% or 31 of the total 190 families live below the poverty line. Families with no children have the highest poverty rate of 27.4%, comprising of 31 families. On the other hand, families with 1 or 2 children have the lowest poverty rate of 0.0%, which includes 0 families.
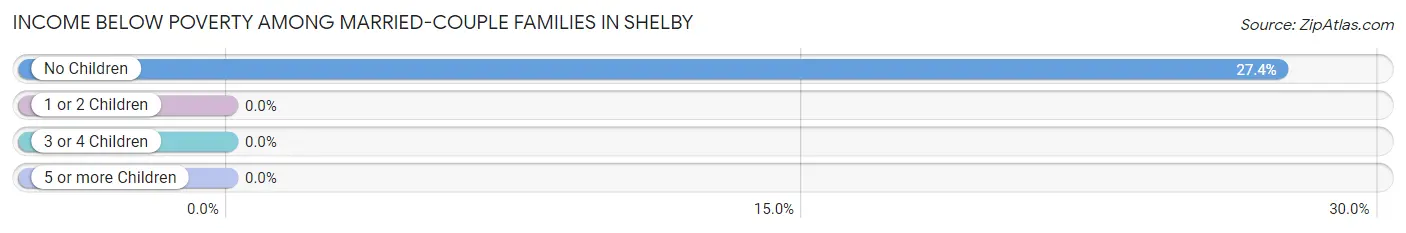
| Children | Above Poverty | Below Poverty |
| No Children | 82 (72.6%) | 31 (27.4%) |
| 1 or 2 Children | 77 (100.0%) | 0 (0.0%) |
| 3 or 4 Children | 0 (0.0%) | 0 (0.0%) |
| 5 or more Children | 0 (0.0%) | 0 (0.0%) |
| Total | 159 (83.7%) | 31 (16.3%) |
Income Below Poverty Among Single-Parent Households in Shelby
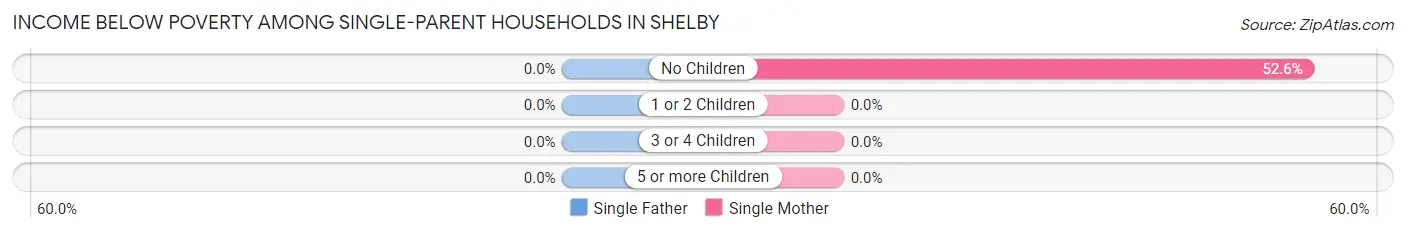
| Children | Single Father | Single Mother |
| No Children | 0 (0.0%) | 10 (52.6%) |
| 1 or 2 Children | 0 (0.0%) | 0 (0.0%) |
| 3 or 4 Children | 0 (0.0%) | 0 (0.0%) |
| 5 or more Children | 0 (0.0%) | 0 (0.0%) |
| Total | 0 (0.0%) | 10 (52.6%) |
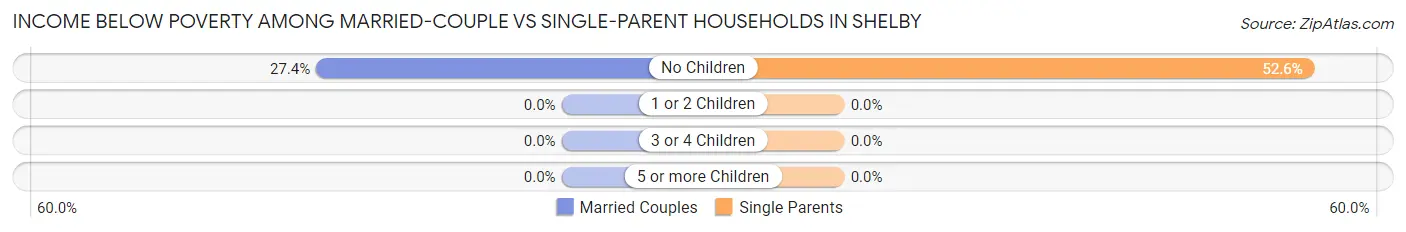
Income Below Poverty Among Married-Couple vs Single-Parent Households in Shelby
The poverty data for Shelby shows that 31 of the married-couple family households (16.3%) and 10 of the single-parent households (52.6%) are living below the poverty level. Within the married-couple family households, those with no children have the highest poverty rate, with 31 households (27.4%) falling below the poverty line. Among the single-parent households, those with no children have the highest poverty rate, with 10 household (52.6%) living below poverty.
| Children | Married-Couple Families | Single-Parent Households |
| No Children | 31 (27.4%) | 10 (52.6%) |
| 1 or 2 Children | 0 (0.0%) | 0 (0.0%) |
| 3 or 4 Children | 0 (0.0%) | 0 (0.0%) |
| 5 or more Children | 0 (0.0%) | 0 (0.0%) |
| Total | 31 (16.3%) | 10 (52.6%) |
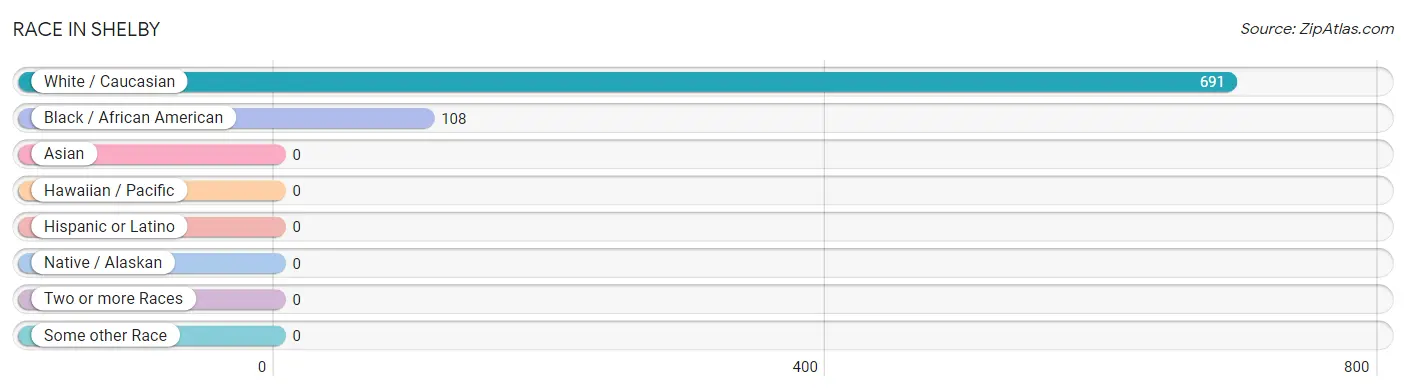
Race in Shelby
The most populous races in Shelby are White / Caucasian (691 | 86.5%), and Black / African American (108 | 13.5%).
| Race | # Population | % Population |
| Asian | 0 | 0.0% |
| Black / African American | 108 | 13.5% |
| Hawaiian / Pacific | 0 | 0.0% |
| Hispanic or Latino | 0 | 0.0% |
| Native / Alaskan | 0 | 0.0% |
| White / Caucasian | 691 | 86.5% |
| Two or more Races | 0 | 0.0% |
| Some other Race | 0 | 0.0% |
| Total | 799 | 100.0% |
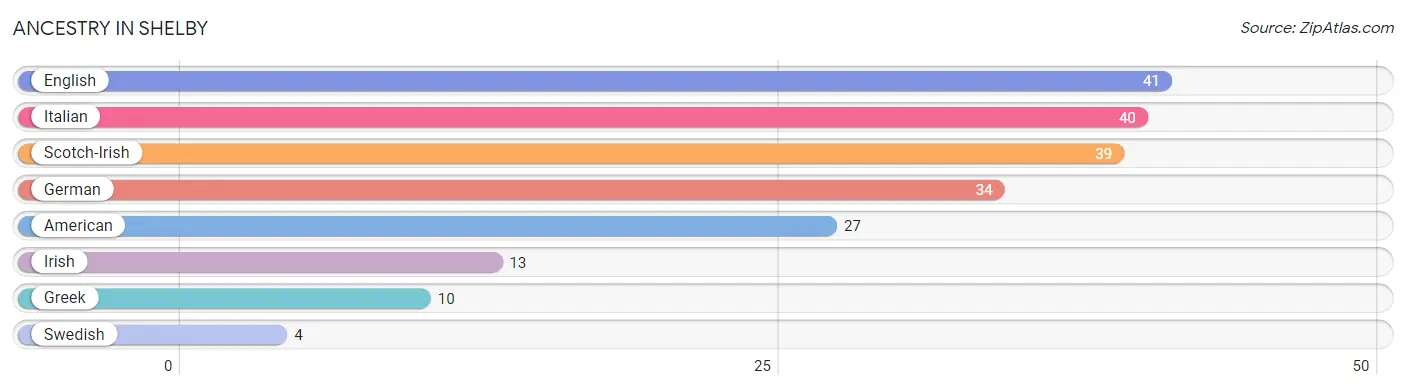
Ancestry in Shelby
The most populous ancestries reported in Shelby are English (41 | 5.1%), Italian (40 | 5.0%), Scotch-Irish (39 | 4.9%), German (34 | 4.3%), and American (27 | 3.4%), together accounting for 22.7% of all Shelby residents.
| Ancestry | # Population | % Population |
| American | 27 | 3.4% |
| English | 41 | 5.1% |
| German | 34 | 4.3% |
| Greek | 10 | 1.3% |
| Irish | 13 | 1.6% |
| Italian | 40 | 5.0% |
| Scotch-Irish | 39 | 4.9% |
| Swedish | 4 | 0.5% | View All 8 Rows |
Immigrants in Shelby

| Immigration Origin | # Population | % Population | View All 0 Rows |
Sex and Age in Shelby
Sex and Age in Shelby
The most populous age groups in Shelby are 55 to 59 Years (69 | 13.3%) for men and 50 to 54 Years (48 | 17.1%) for women.
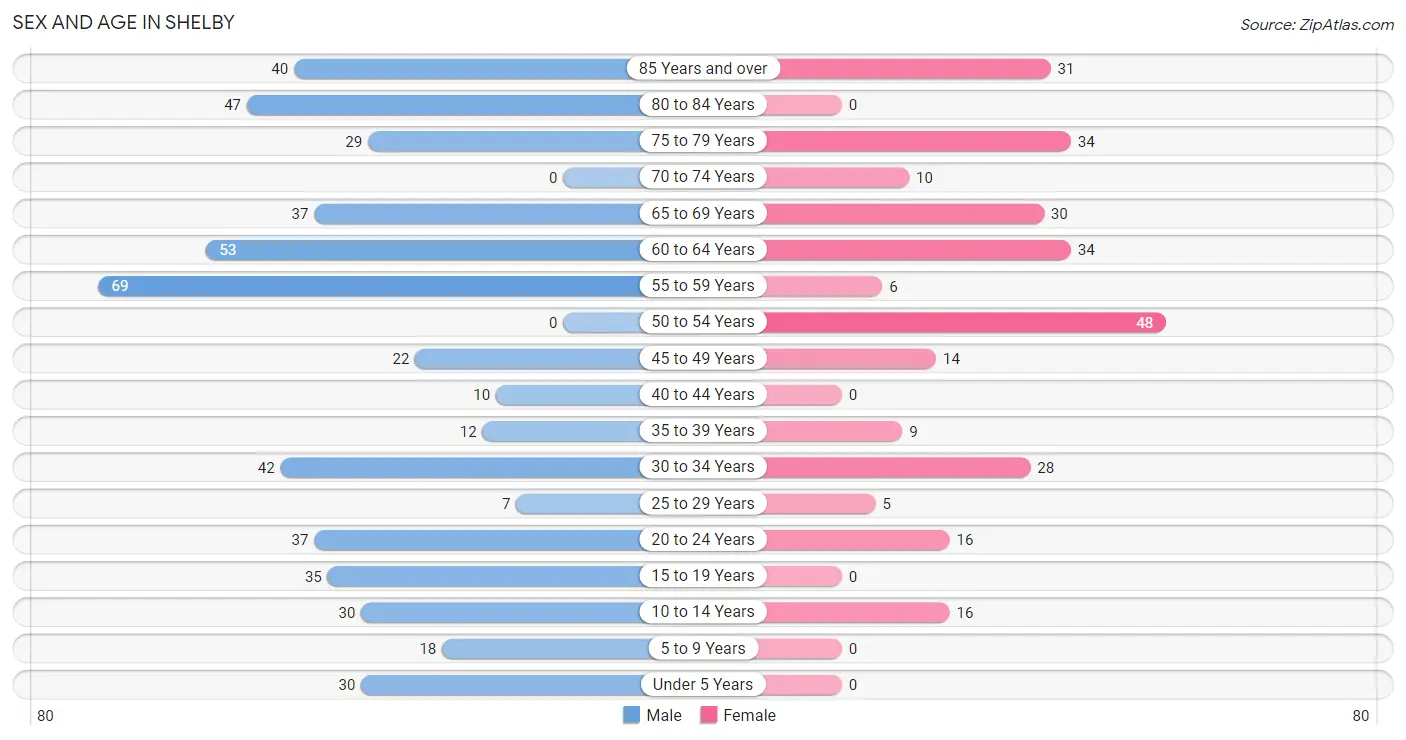
| Age Bracket | Male | Female |
| Under 5 Years | 30 (5.8%) | 0 (0.0%) |
| 5 to 9 Years | 18 (3.5%) | 0 (0.0%) |
| 10 to 14 Years | 30 (5.8%) | 16 (5.7%) |
| 15 to 19 Years | 35 (6.8%) | 0 (0.0%) |
| 20 to 24 Years | 37 (7.1%) | 16 (5.7%) |
| 25 to 29 Years | 7 (1.3%) | 5 (1.8%) |
| 30 to 34 Years | 42 (8.1%) | 28 (10.0%) |
| 35 to 39 Years | 12 (2.3%) | 9 (3.2%) |
| 40 to 44 Years | 10 (1.9%) | 0 (0.0%) |
| 45 to 49 Years | 22 (4.3%) | 14 (5.0%) |
| 50 to 54 Years | 0 (0.0%) | 48 (17.1%) |
| 55 to 59 Years | 69 (13.3%) | 6 (2.1%) |
| 60 to 64 Years | 53 (10.2%) | 34 (12.1%) |
| 65 to 69 Years | 37 (7.1%) | 30 (10.7%) |
| 70 to 74 Years | 0 (0.0%) | 10 (3.6%) |
| 75 to 79 Years | 29 (5.6%) | 34 (12.1%) |
| 80 to 84 Years | 47 (9.1%) | 0 (0.0%) |
| 85 Years and over | 40 (7.7%) | 31 (11.0%) |
| Total | 518 (100.0%) | 281 (100.0%) |
Families and Households in Shelby
Median Family Size in Shelby
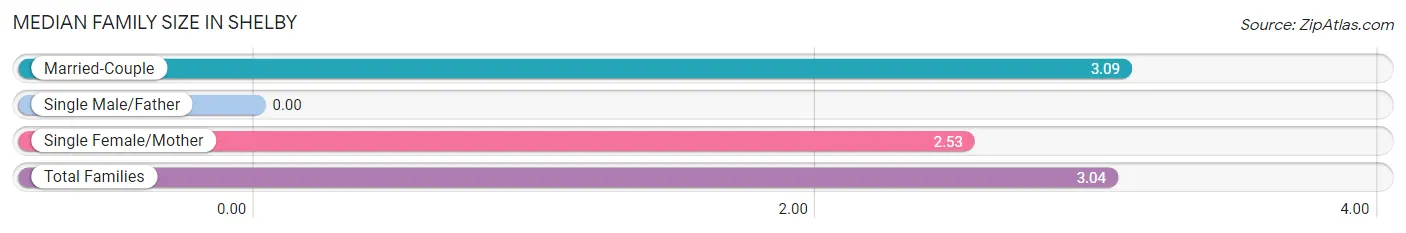
| Family Type | # Families | Family Size |
| Married-Couple | 190 (90.9%) | 3.09 |
| Single Male/Father | 0 (0.0%) | - |
| Single Female/Mother | 19 (9.1%) | 2.53 |
| Total Families | 209 (100.0%) | 3.04 |
Median Household Size in Shelby
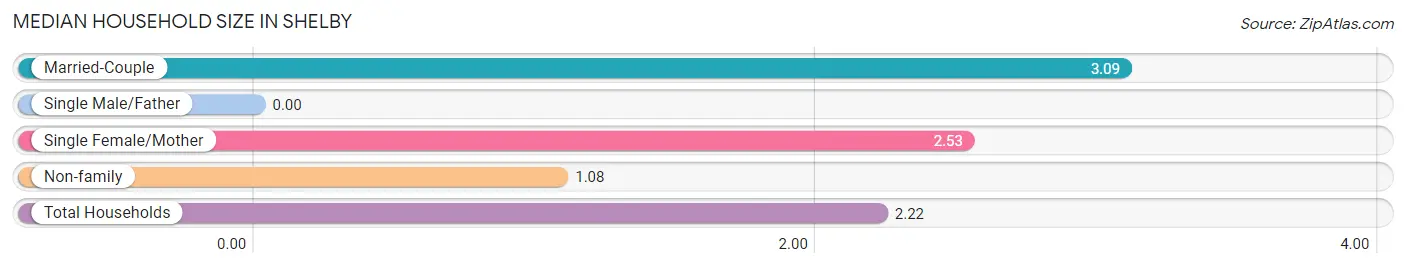
| Household Type | # Households | Household Size |
| Married-Couple | 190 (52.8%) | 3.09 |
| Single Male/Father | 0 (0.0%) | - |
| Single Female/Mother | 19 (5.3%) | 2.53 |
| Non-family | 151 (41.9%) | 1.08 |
| Total Households | 360 (100.0%) | 2.22 |
Household Size by Marriage Status in Shelby
Out of a total of 360 households in Shelby, 209 (58.1%) are family households, while 151 (41.9%) are nonfamily households. The most numerous type of family households are 2-person households, comprising 105, and the most common type of nonfamily households are 1-person households, comprising 145.
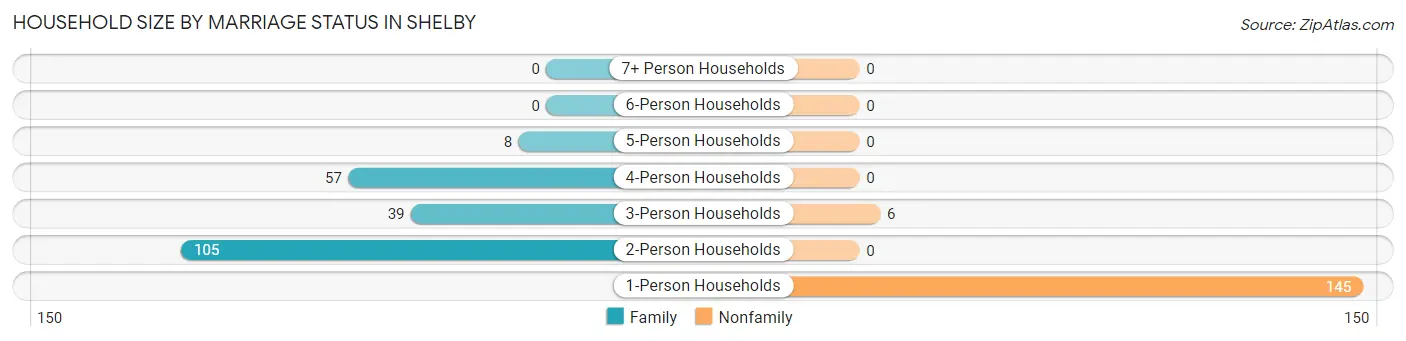
| Household Size | Family Households | Nonfamily Households |
| 1-Person Households | - | 145 (40.3%) |
| 2-Person Households | 105 (29.2%) | 0 (0.0%) |
| 3-Person Households | 39 (10.8%) | 6 (1.7%) |
| 4-Person Households | 57 (15.8%) | 0 (0.0%) |
| 5-Person Households | 8 (2.2%) | 0 (0.0%) |
| 6-Person Households | 0 (0.0%) | 0 (0.0%) |
| 7+ Person Households | 0 (0.0%) | 0 (0.0%) |
| Total | 209 (58.1%) | 151 (41.9%) |
Female Fertility in Shelby
Fertility by Age in Shelby
| Age Bracket | Women with Births | Births / 1,000 Women |
| 15 to 19 years | 0 (0.0%) | 0.0 |
| 20 to 34 years | 0 (0.0%) | 0.0 |
| 35 to 50 years | 0 (0.0%) | 0.0 |
| Total | 0 (0.0%) | 0.0 |
Fertility by Age by Marriage Status in Shelby
| Age Bracket | Married | Unmarried |
| 15 to 19 years | 0 (0.0%) | 0 (0.0%) |
| 20 to 34 years | 0 (0.0%) | 0 (0.0%) |
| 35 to 50 years | 0 (0.0%) | 0 (0.0%) |
| Total | 0 (0.0%) | 0 (0.0%) |
Fertility by Education in Shelby
| Educational Attainment | Women with Births | Births / 1,000 Women |
| Less than High School | 0 (0.0%) | 0.0 |
| High School Diploma | 0 (0.0%) | 0.0 |
| College or Associate's Degree | 0 (0.0%) | 0.0 |
| Bachelor's Degree | 0 (0.0%) | 0.0 |
| Graduate Degree | 0 (0.0%) | 0.0 |
| Total | 0 (0.0%) | 0.0 |
Fertility by Education by Marriage Status in Shelby
| Educational Attainment | Married | Unmarried |
| Less than High School | 0 (0.0%) | 0 (0.0%) |
| High School Diploma | 0 (0.0%) | 0 (0.0%) |
| College or Associate's Degree | 0 (0.0%) | 0 (0.0%) |
| Bachelor's Degree | 0 (0.0%) | 0 (0.0%) |
| Graduate Degree | 0 (0.0%) | 0 (0.0%) |
| Total | 0 (0.0%) | 0 (0.0%) |
Employment Characteristics in Shelby
Employment by Class of Employer in Shelby
Among the 275 employed individuals in Shelby, private company employees (159 | 57.8%), state government employees (31 | 11.3%), and local government employees (29 | 10.5%) make up the most common classes of employment.
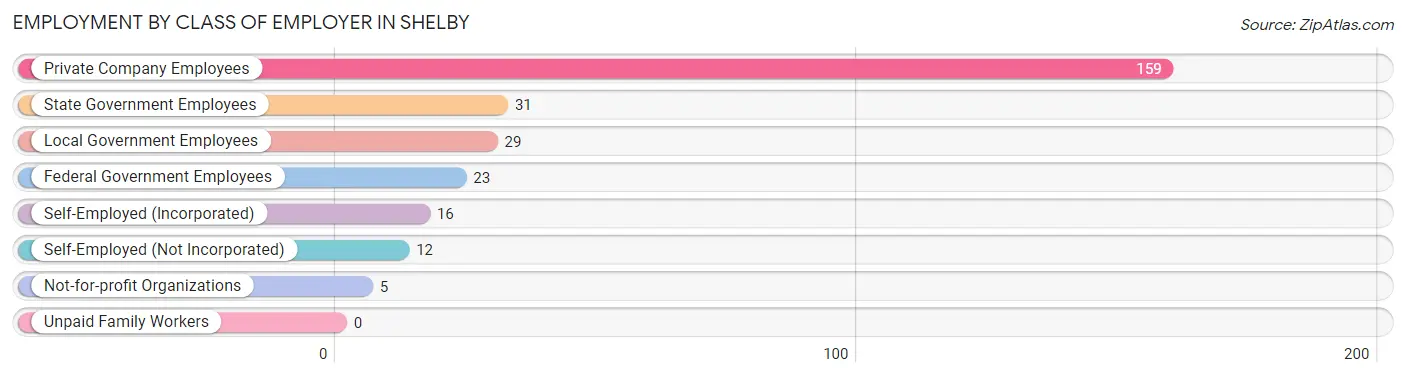
| Employer Class | # Employees | % Employees |
| Private Company Employees | 159 | 57.8% |
| Self-Employed (Incorporated) | 16 | 5.8% |
| Self-Employed (Not Incorporated) | 12 | 4.4% |
| Not-for-profit Organizations | 5 | 1.8% |
| Local Government Employees | 29 | 10.5% |
| State Government Employees | 31 | 11.3% |
| Federal Government Employees | 23 | 8.4% |
| Unpaid Family Workers | 0 | 0.0% |
| Total | 275 | 100.0% |
Employment Status by Age in Shelby
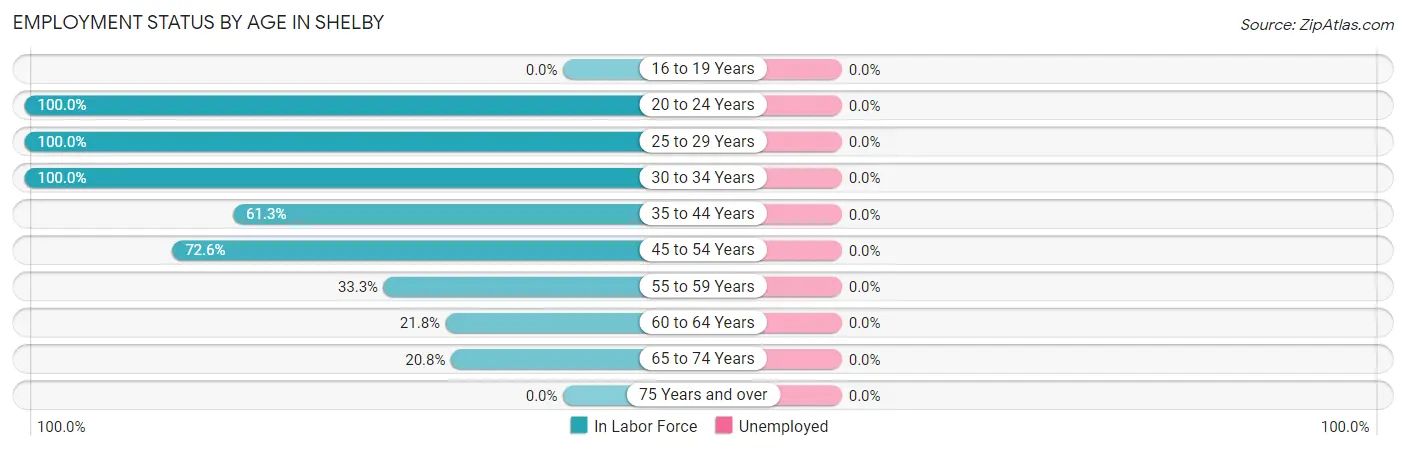
| Age Bracket | In Labor Force | Unemployed |
| 16 to 19 Years | 0 (0.0%) | 0 (0.0%) |
| 20 to 24 Years | 53 (100.0%) | 0 (0.0%) |
| 25 to 29 Years | 12 (100.0%) | 0 (0.0%) |
| 30 to 34 Years | 70 (100.0%) | 0 (0.0%) |
| 35 to 44 Years | 19 (61.3%) | 0 (0.0%) |
| 45 to 54 Years | 61 (72.6%) | 0 (0.0%) |
| 55 to 59 Years | 25 (33.3%) | 0 (0.0%) |
| 60 to 64 Years | 19 (21.8%) | 0 (0.0%) |
| 65 to 74 Years | 16 (20.8%) | 0 (0.0%) |
| 75 Years and over | 0 (0.0%) | 0 (0.0%) |
| Total | 275 (39.5%) | 0 (0.0%) |
Employment Status by Educational Attainment in Shelby
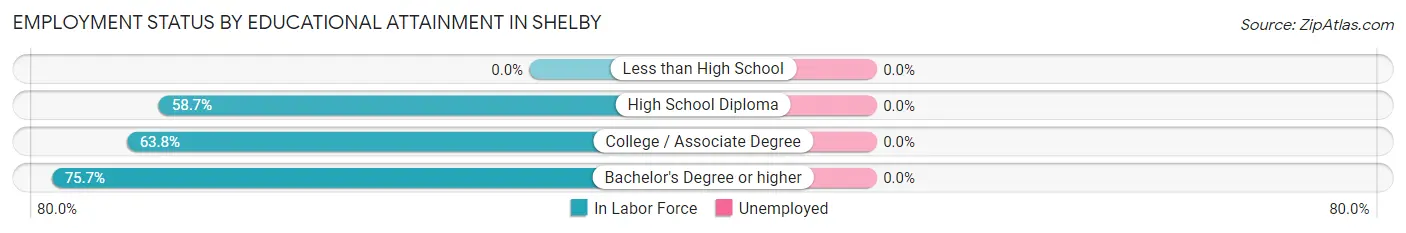
| Educational Attainment | In Labor Force | Unemployed |
| Less than High School | 0 (0.0%) | 0 (0.0%) |
| High School Diploma | 118 (58.7%) | 0 (0.0%) |
| College / Associate Degree | 60 (63.8%) | 0 (0.0%) |
| Bachelor's Degree or higher | 28 (75.7%) | 0 (0.0%) |
| Total | 206 (57.4%) | 0 (0.0%) |
Employment Occupations by Sex in Shelby
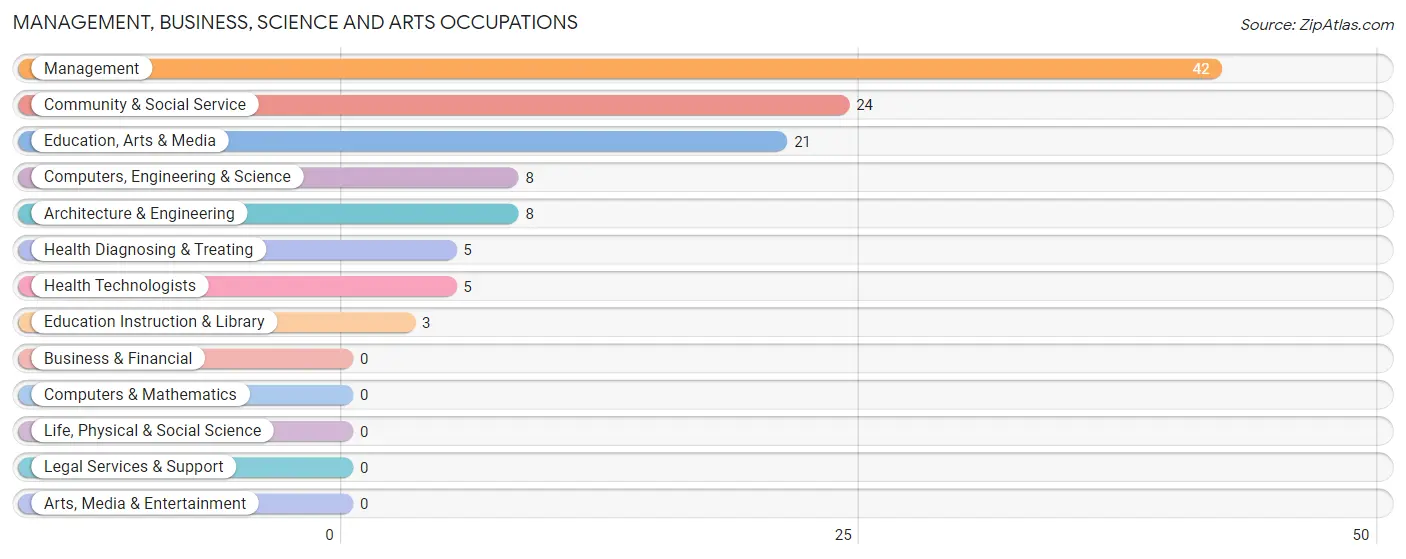
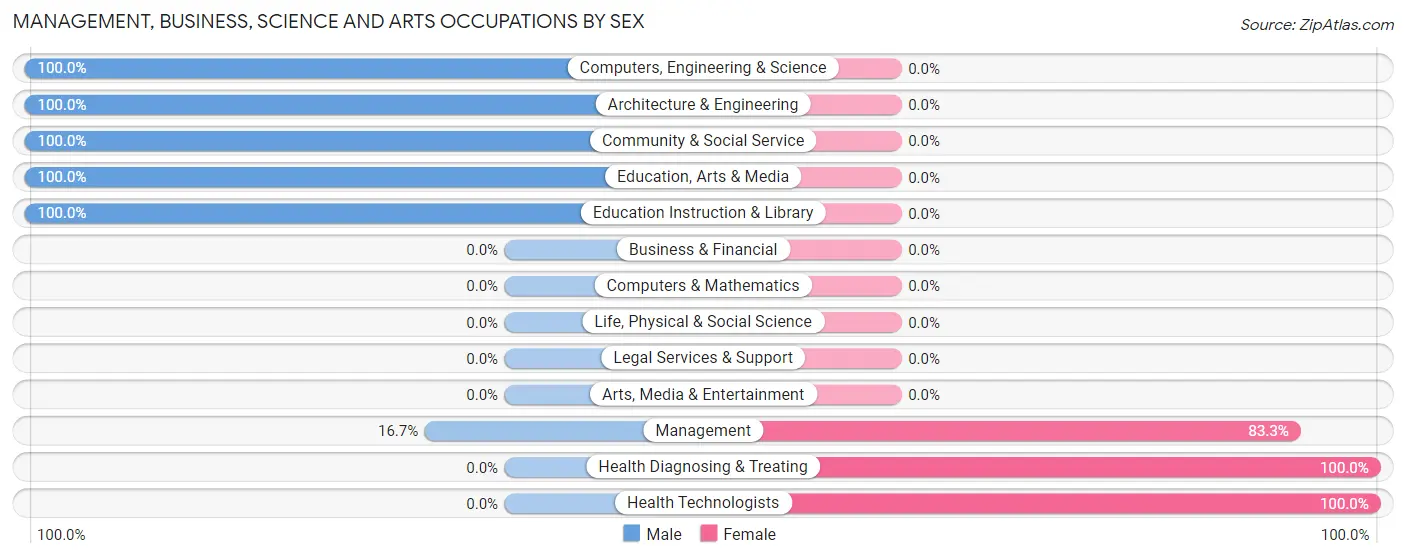
Management, Business, Science and Arts Occupations
The most common Management, Business, Science and Arts occupations in Shelby are Management (42 | 15.3%), Community & Social Service (24 | 8.7%), Education, Arts & Media (21 | 7.6%), Computers, Engineering & Science (8 | 2.9%), and Architecture & Engineering (8 | 2.9%).
Management, Business, Science and Arts Occupations by Sex
Within the Management, Business, Science and Arts occupations in Shelby, the most male-oriented occupations are Computers, Engineering & Science (100.0%), Architecture & Engineering (100.0%), and Community & Social Service (100.0%), while the most female-oriented occupations are Health Diagnosing & Treating (100.0%), Health Technologists (100.0%), and Management (83.3%).
| Occupation | Male | Female |
| Management | 7 (16.7%) | 35 (83.3%) |
| Business & Financial | 0 (0.0%) | 0 (0.0%) |
| Computers, Engineering & Science | 8 (100.0%) | 0 (0.0%) |
| Computers & Mathematics | 0 (0.0%) | 0 (0.0%) |
| Architecture & Engineering | 8 (100.0%) | 0 (0.0%) |
| Life, Physical & Social Science | 0 (0.0%) | 0 (0.0%) |
| Community & Social Service | 24 (100.0%) | 0 (0.0%) |
| Education, Arts & Media | 21 (100.0%) | 0 (0.0%) |
| Legal Services & Support | 0 (0.0%) | 0 (0.0%) |
| Education Instruction & Library | 3 (100.0%) | 0 (0.0%) |
| Arts, Media & Entertainment | 0 (0.0%) | 0 (0.0%) |
| Health Diagnosing & Treating | 0 (0.0%) | 5 (100.0%) |
| Health Technologists | 0 (0.0%) | 5 (100.0%) |
| Total (Category) | 39 (49.4%) | 40 (50.6%) |
| Total (Overall) | 165 (60.0%) | 110 (40.0%) |
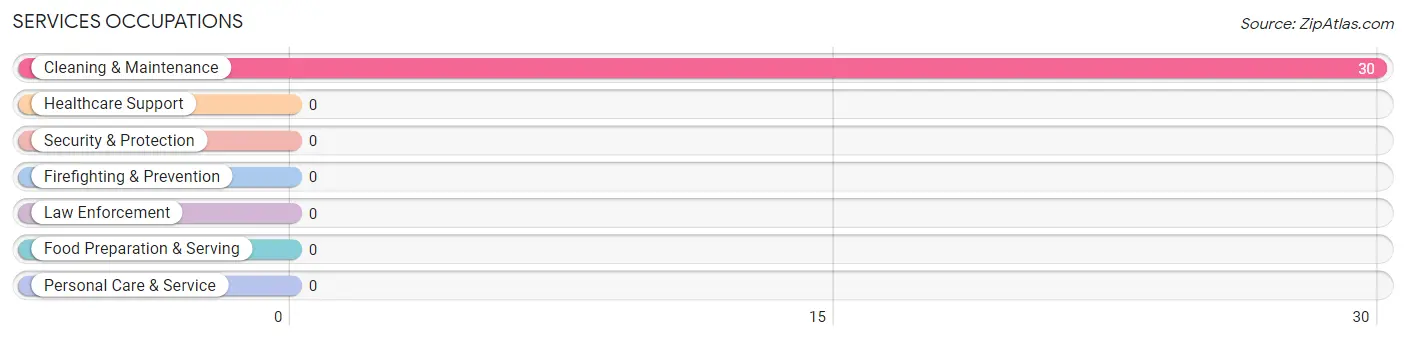
Services Occupations
The most common Services occupations in Shelby are , and Cleaning & Maintenance (30 | 10.9%).
Services Occupations by Sex
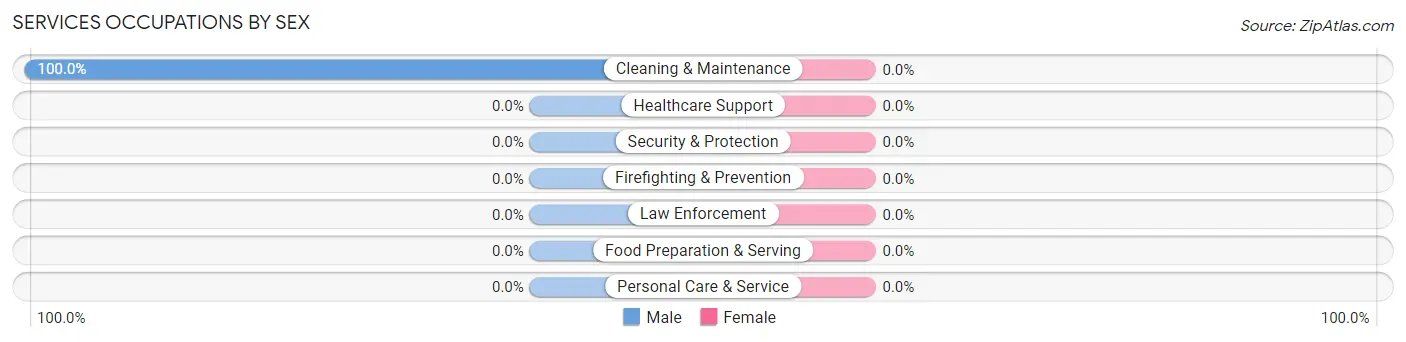
| Occupation | Male | Female |
| Healthcare Support | 0 (0.0%) | 0 (0.0%) |
| Security & Protection | 0 (0.0%) | 0 (0.0%) |
| Firefighting & Prevention | 0 (0.0%) | 0 (0.0%) |
| Law Enforcement | 0 (0.0%) | 0 (0.0%) |
| Food Preparation & Serving | 0 (0.0%) | 0 (0.0%) |
| Cleaning & Maintenance | 30 (100.0%) | 0 (0.0%) |
| Personal Care & Service | 0 (0.0%) | 0 (0.0%) |
| Total (Category) | 30 (100.0%) | 0 (0.0%) |
| Total (Overall) | 165 (60.0%) | 110 (40.0%) |
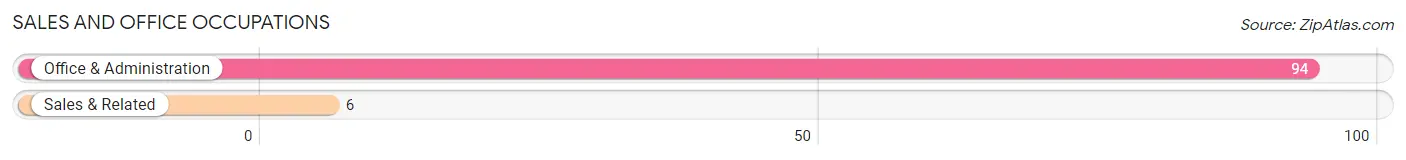
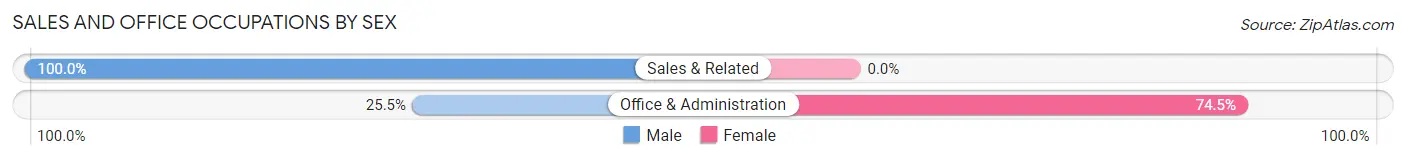
Sales and Office Occupations
The most common Sales and Office occupations in Shelby are Office & Administration (94 | 34.2%), and Sales & Related (6 | 2.2%).
Sales and Office Occupations by Sex
| Occupation | Male | Female |
| Sales & Related | 6 (100.0%) | 0 (0.0%) |
| Office & Administration | 24 (25.5%) | 70 (74.5%) |
| Total (Category) | 30 (30.0%) | 70 (70.0%) |
| Total (Overall) | 165 (60.0%) | 110 (40.0%) |
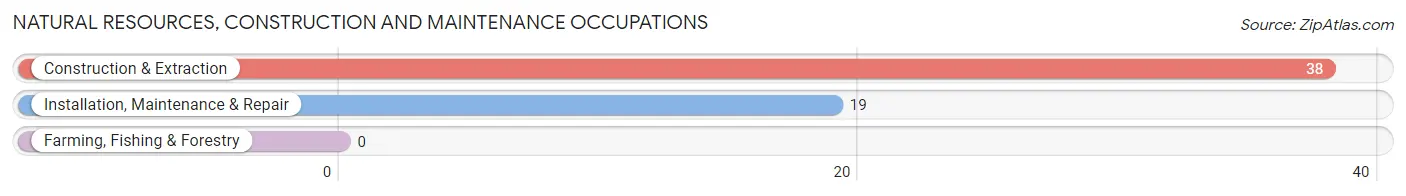
Natural Resources, Construction and Maintenance Occupations
The most common Natural Resources, Construction and Maintenance occupations in Shelby are Construction & Extraction (38 | 13.8%), and Installation, Maintenance & Repair (19 | 6.9%).
Natural Resources, Construction and Maintenance Occupations by Sex
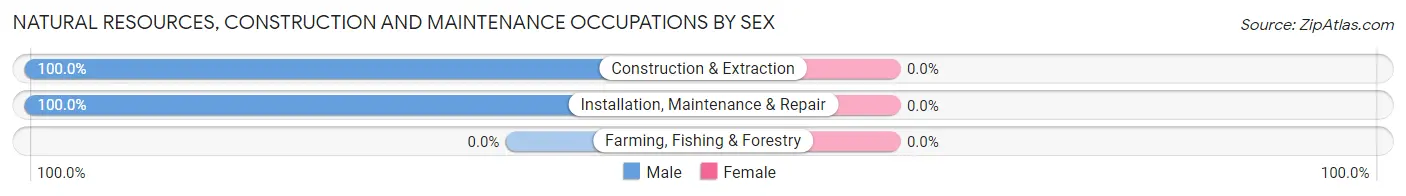
| Occupation | Male | Female |
| Farming, Fishing & Forestry | 0 (0.0%) | 0 (0.0%) |
| Construction & Extraction | 38 (100.0%) | 0 (0.0%) |
| Installation, Maintenance & Repair | 19 (100.0%) | 0 (0.0%) |
| Total (Category) | 57 (100.0%) | 0 (0.0%) |
| Total (Overall) | 165 (60.0%) | 110 (40.0%) |
Production, Transportation and Moving Occupations
The most common Production, Transportation and Moving occupations in Shelby are , and Material Moving (9 | 3.3%).
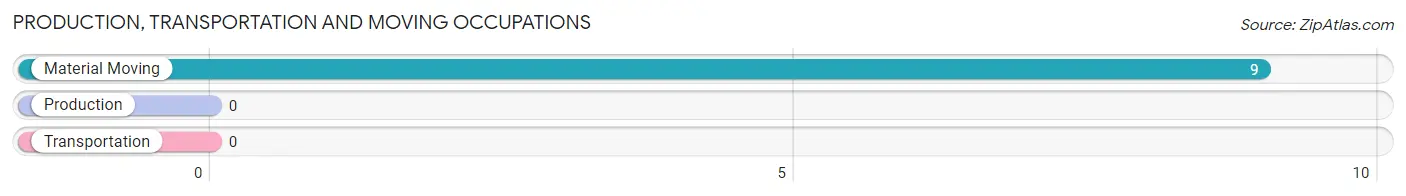
Production, Transportation and Moving Occupations by Sex
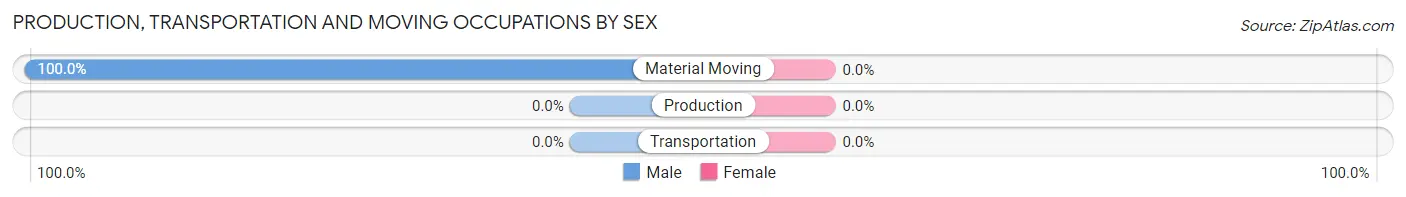
| Occupation | Male | Female |
| Production | 0 (0.0%) | 0 (0.0%) |
| Transportation | 0 (0.0%) | 0 (0.0%) |
| Material Moving | 9 (100.0%) | 0 (0.0%) |
| Total (Category) | 9 (100.0%) | 0 (0.0%) |
| Total (Overall) | 165 (60.0%) | 110 (40.0%) |
Employment Industries by Sex in Shelby
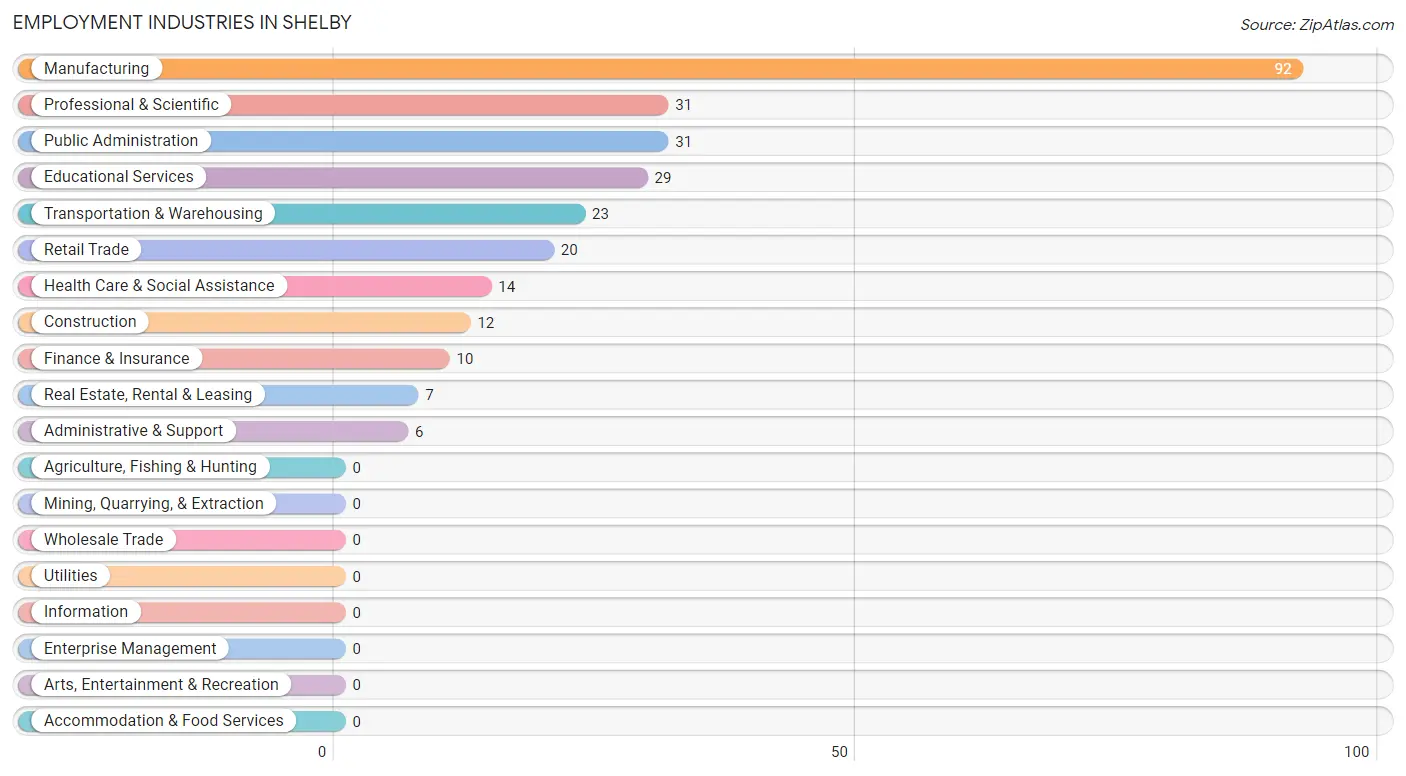
Employment Industries in Shelby
The major employment industries in Shelby include Manufacturing (92 | 33.5%), Professional & Scientific (31 | 11.3%), Public Administration (31 | 11.3%), Educational Services (29 | 10.5%), and Transportation & Warehousing (23 | 8.4%).
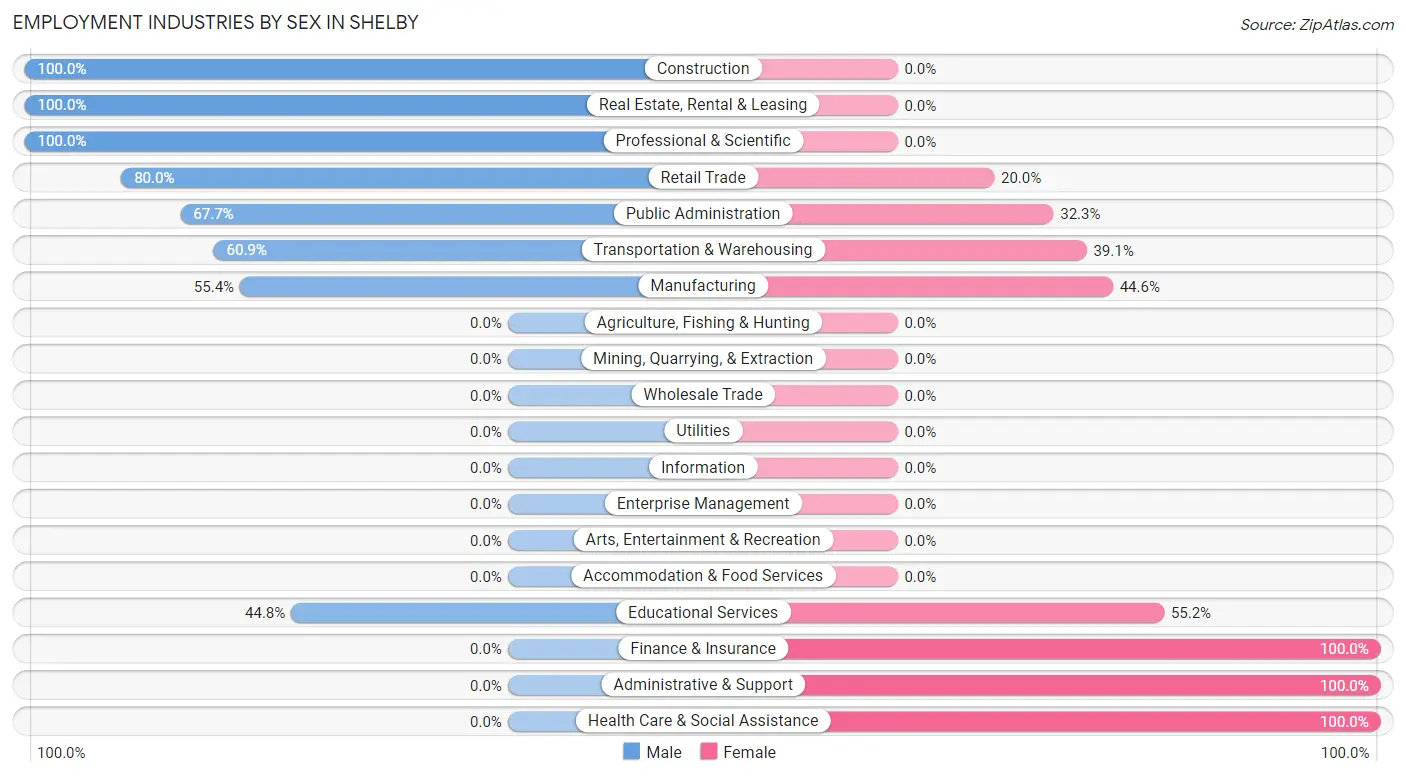
Employment Industries by Sex in Shelby
The Shelby industries that see more men than women are Construction (100.0%), Real Estate, Rental & Leasing (100.0%), and Professional & Scientific (100.0%), whereas the industries that tend to have a higher number of women are Finance & Insurance (100.0%), Administrative & Support (100.0%), and Health Care & Social Assistance (100.0%).
| Industry | Male | Female |
| Agriculture, Fishing & Hunting | 0 (0.0%) | 0 (0.0%) |
| Mining, Quarrying, & Extraction | 0 (0.0%) | 0 (0.0%) |
| Construction | 12 (100.0%) | 0 (0.0%) |
| Manufacturing | 51 (55.4%) | 41 (44.6%) |
| Wholesale Trade | 0 (0.0%) | 0 (0.0%) |
| Retail Trade | 16 (80.0%) | 4 (20.0%) |
| Transportation & Warehousing | 14 (60.9%) | 9 (39.1%) |
| Utilities | 0 (0.0%) | 0 (0.0%) |
| Information | 0 (0.0%) | 0 (0.0%) |
| Finance & Insurance | 0 (0.0%) | 10 (100.0%) |
| Real Estate, Rental & Leasing | 7 (100.0%) | 0 (0.0%) |
| Professional & Scientific | 31 (100.0%) | 0 (0.0%) |
| Enterprise Management | 0 (0.0%) | 0 (0.0%) |
| Administrative & Support | 0 (0.0%) | 6 (100.0%) |
| Educational Services | 13 (44.8%) | 16 (55.2%) |
| Health Care & Social Assistance | 0 (0.0%) | 14 (100.0%) |
| Arts, Entertainment & Recreation | 0 (0.0%) | 0 (0.0%) |
| Accommodation & Food Services | 0 (0.0%) | 0 (0.0%) |
| Public Administration | 21 (67.7%) | 10 (32.3%) |
| Total | 165 (60.0%) | 110 (40.0%) |
Education in Shelby
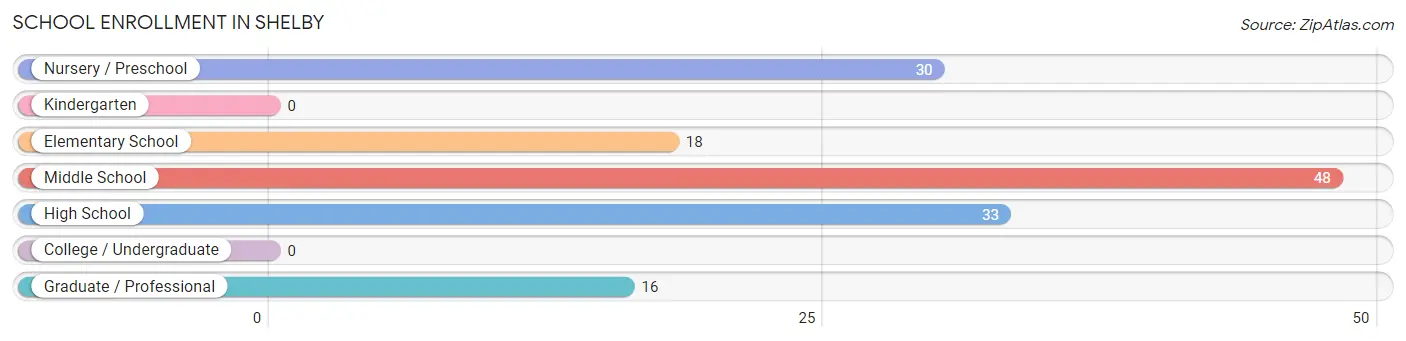
School Enrollment in Shelby
The most common levels of schooling among the 145 students in Shelby are middle school (48 | 33.1%), high school (33 | 22.8%), and nursery / preschool (30 | 20.7%).
| School Level | # Students | % Students |
| Nursery / Preschool | 30 | 20.7% |
| Kindergarten | 0 | 0.0% |
| Elementary School | 18 | 12.4% |
| Middle School | 48 | 33.1% |
| High School | 33 | 22.8% |
| College / Undergraduate | 0 | 0.0% |
| Graduate / Professional | 16 | 11.0% |
| Total | 145 | 100.0% |
School Enrollment by Age by Funding Source in Shelby
Out of a total of 145 students who are enrolled in schools in Shelby, 7 (4.8%) attend a private institution, while the remaining 138 (95.2%) are enrolled in public schools. The age group of 15 to 17 year olds has the highest likelihood of being enrolled in private schools, with 7 (20.0% in the age bracket) enrolled. Conversely, the age group of 3 to 4 year olds has the lowest likelihood of being enrolled in a private school, with 30 (100.0% in the age bracket) attending a public institution.
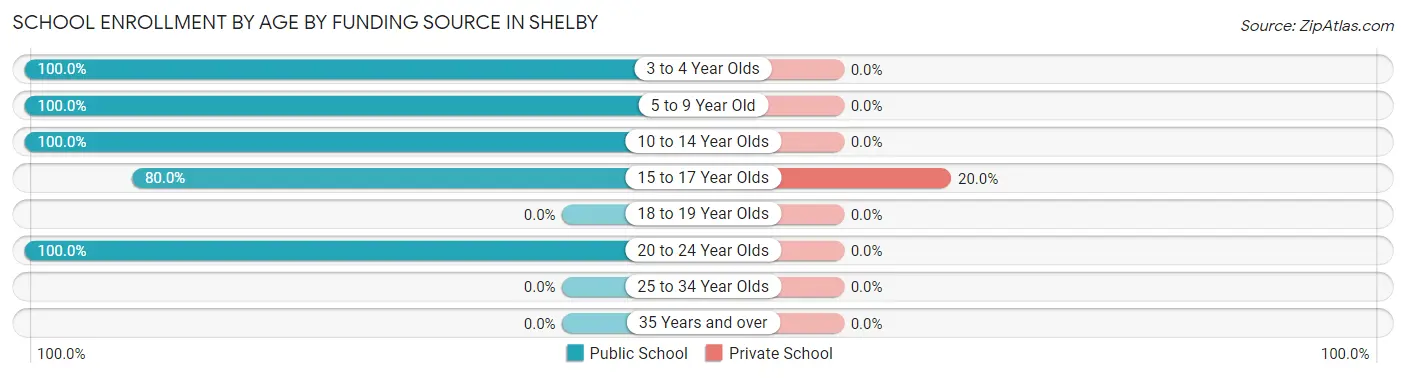
| Age Bracket | Public School | Private School |
| 3 to 4 Year Olds | 30 (100.0%) | 0 (0.0%) |
| 5 to 9 Year Old | 18 (100.0%) | 0 (0.0%) |
| 10 to 14 Year Olds | 46 (100.0%) | 0 (0.0%) |
| 15 to 17 Year Olds | 28 (80.0%) | 7 (20.0%) |
| 18 to 19 Year Olds | 0 (0.0%) | 0 (0.0%) |
| 20 to 24 Year Olds | 16 (100.0%) | 0 (0.0%) |
| 25 to 34 Year Olds | 0 (0.0%) | 0 (0.0%) |
| 35 Years and over | 0 (0.0%) | 0 (0.0%) |
| Total | 138 (95.2%) | 7 (4.8%) |
Educational Attainment by Field of Study in Shelby
Engineering (38 | 41.3%), education (23 | 25.0%), literature & languages (13 | 14.1%), liberal arts & history (13 | 14.1%), and arts & humanities (5 | 5.4%) are the most common fields of study among 92 individuals in Shelby who have obtained a bachelor's degree or higher.
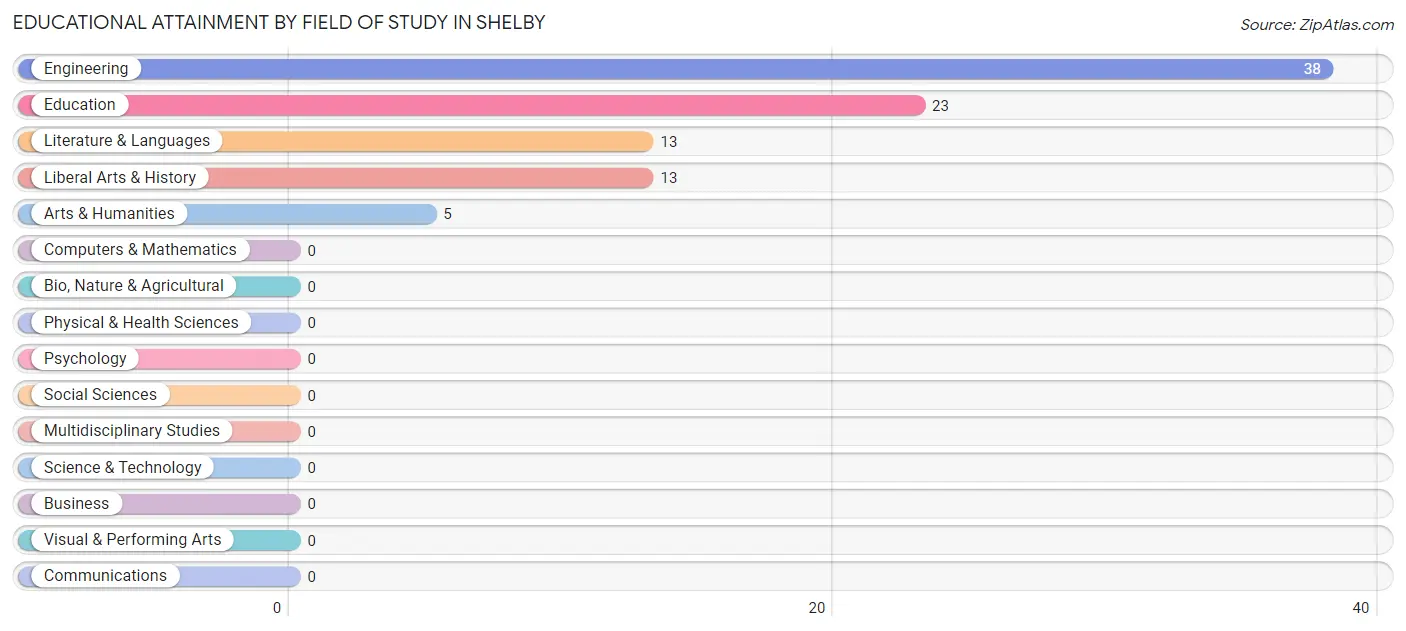
| Field of Study | # Graduates | % Graduates |
| Computers & Mathematics | 0 | 0.0% |
| Bio, Nature & Agricultural | 0 | 0.0% |
| Physical & Health Sciences | 0 | 0.0% |
| Psychology | 0 | 0.0% |
| Social Sciences | 0 | 0.0% |
| Engineering | 38 | 41.3% |
| Multidisciplinary Studies | 0 | 0.0% |
| Science & Technology | 0 | 0.0% |
| Business | 0 | 0.0% |
| Education | 23 | 25.0% |
| Literature & Languages | 13 | 14.1% |
| Liberal Arts & History | 13 | 14.1% |
| Visual & Performing Arts | 0 | 0.0% |
| Communications | 0 | 0.0% |
| Arts & Humanities | 5 | 5.4% |
| Total | 92 | 100.0% |
Transportation & Commute in Shelby
Vehicle Availability by Sex in Shelby
The most prevalent vehicle ownership categories in Shelby are males with 3 vehicles (56, accounting for 33.9%) and females with 3 vehicles (39, making up 50.9%).
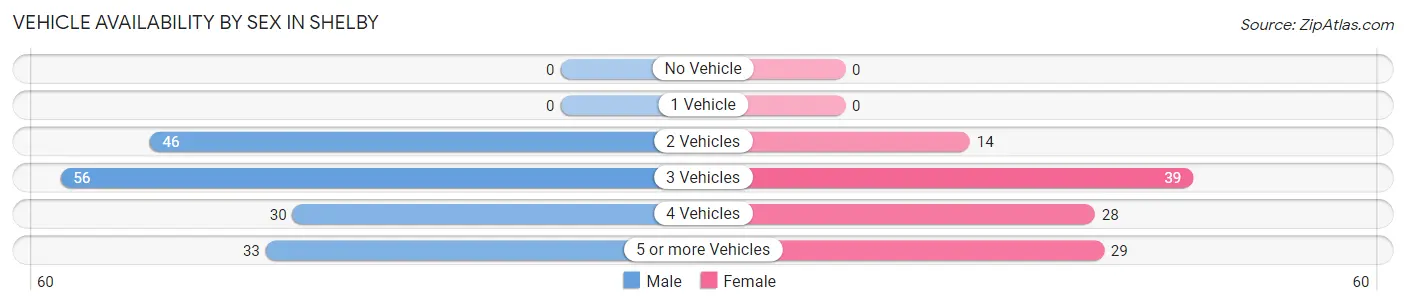
| Vehicles Available | Male | Female |
| No Vehicle | 0 (0.0%) | 0 (0.0%) |
| 1 Vehicle | 0 (0.0%) | 0 (0.0%) |
| 2 Vehicles | 46 (27.9%) | 14 (12.7%) |
| 3 Vehicles | 56 (33.9%) | 39 (35.4%) |
| 4 Vehicles | 30 (18.2%) | 28 (25.5%) |
| 5 or more Vehicles | 33 (20.0%) | 29 (26.4%) |
| Total | 165 (100.0%) | 110 (100.0%) |
Commute Time in Shelby
The most frequently occuring commute durations in Shelby are 5 to 9 minutes (74 commuters, 26.9%), 10 to 14 minutes (50 commuters, 18.2%), and 25 to 29 minutes (33 commuters, 12.0%).
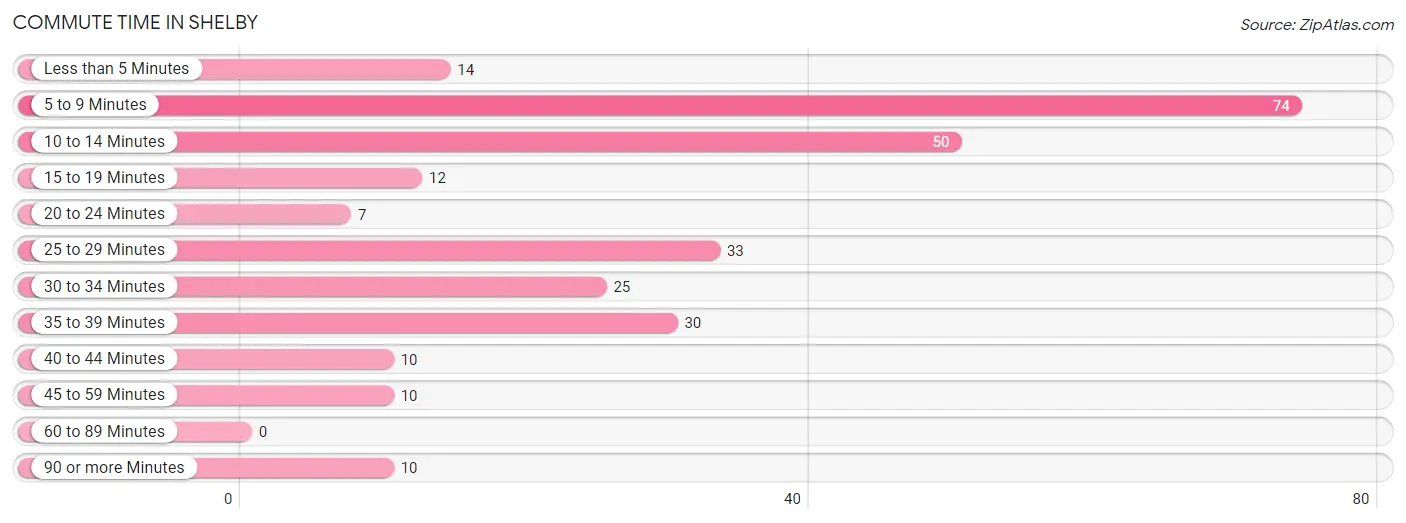
| Commute Time | # Commuters | % Commuters |
| Less than 5 Minutes | 14 | 5.1% |
| 5 to 9 Minutes | 74 | 26.9% |
| 10 to 14 Minutes | 50 | 18.2% |
| 15 to 19 Minutes | 12 | 4.4% |
| 20 to 24 Minutes | 7 | 2.5% |
| 25 to 29 Minutes | 33 | 12.0% |
| 30 to 34 Minutes | 25 | 9.1% |
| 35 to 39 Minutes | 30 | 10.9% |
| 40 to 44 Minutes | 10 | 3.6% |
| 45 to 59 Minutes | 10 | 3.6% |
| 60 to 89 Minutes | 0 | 0.0% |
| 90 or more Minutes | 10 | 3.6% |
Commute Time by Sex in Shelby
The most common commute times in Shelby are 5 to 9 minutes (36 commuters, 21.8%) for males and 5 to 9 minutes (38 commuters, 34.5%) for females.
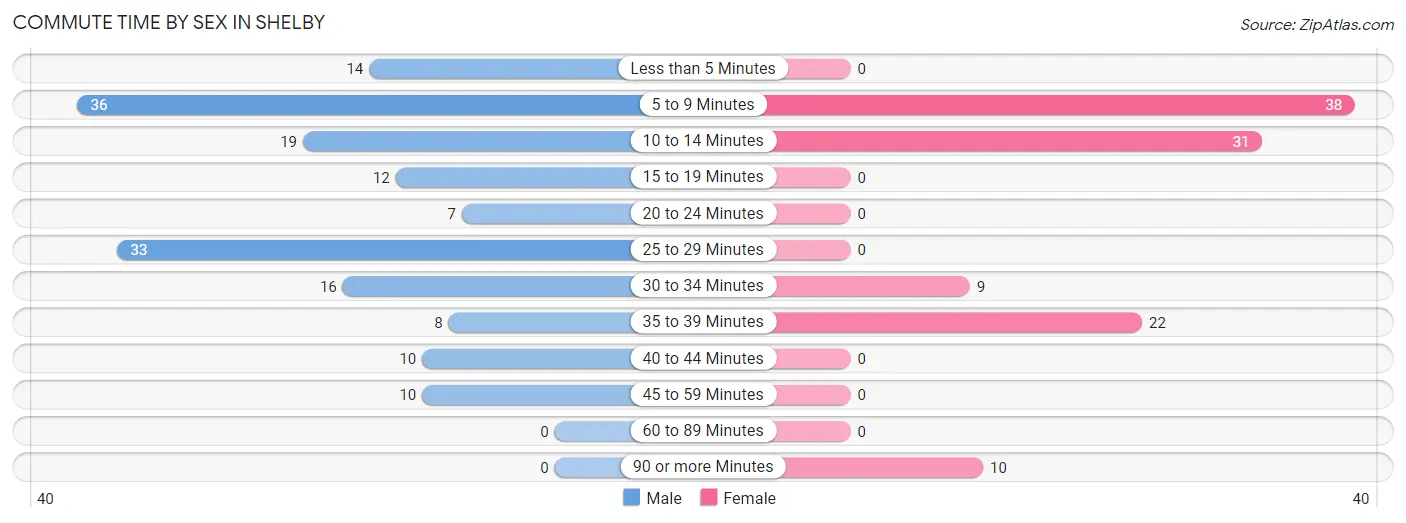
| Commute Time | Male | Female |
| Less than 5 Minutes | 14 (8.5%) | 0 (0.0%) |
| 5 to 9 Minutes | 36 (21.8%) | 38 (34.5%) |
| 10 to 14 Minutes | 19 (11.5%) | 31 (28.2%) |
| 15 to 19 Minutes | 12 (7.3%) | 0 (0.0%) |
| 20 to 24 Minutes | 7 (4.2%) | 0 (0.0%) |
| 25 to 29 Minutes | 33 (20.0%) | 0 (0.0%) |
| 30 to 34 Minutes | 16 (9.7%) | 9 (8.2%) |
| 35 to 39 Minutes | 8 (4.9%) | 22 (20.0%) |
| 40 to 44 Minutes | 10 (6.1%) | 0 (0.0%) |
| 45 to 59 Minutes | 10 (6.1%) | 0 (0.0%) |
| 60 to 89 Minutes | 0 (0.0%) | 0 (0.0%) |
| 90 or more Minutes | 0 (0.0%) | 10 (9.1%) |
Time of Departure to Work by Sex in Shelby
The most frequent times of departure to work in Shelby are 12:00 AM to 4:59 AM (42, 25.5%) for males and 7:00 AM to 7:29 AM (59, 53.6%) for females.
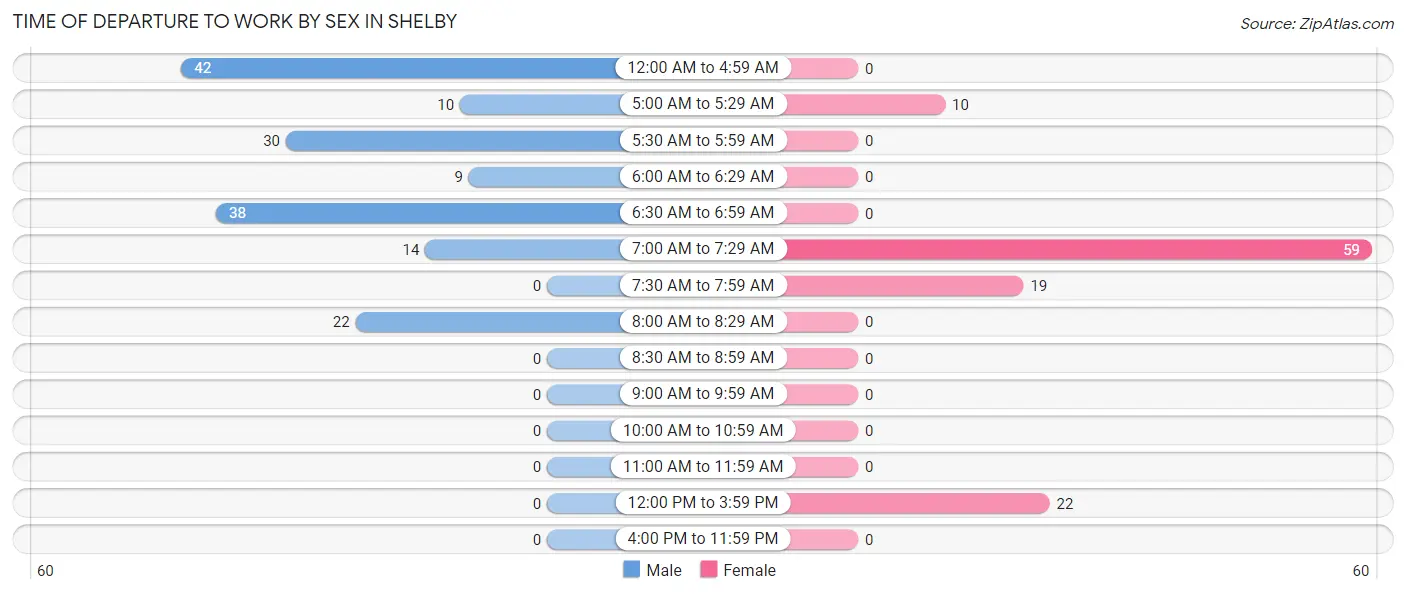
| Time of Departure | Male | Female |
| 12:00 AM to 4:59 AM | 42 (25.5%) | 0 (0.0%) |
| 5:00 AM to 5:29 AM | 10 (6.1%) | 10 (9.1%) |
| 5:30 AM to 5:59 AM | 30 (18.2%) | 0 (0.0%) |
| 6:00 AM to 6:29 AM | 9 (5.4%) | 0 (0.0%) |
| 6:30 AM to 6:59 AM | 38 (23.0%) | 0 (0.0%) |
| 7:00 AM to 7:29 AM | 14 (8.5%) | 59 (53.6%) |
| 7:30 AM to 7:59 AM | 0 (0.0%) | 19 (17.3%) |
| 8:00 AM to 8:29 AM | 22 (13.3%) | 0 (0.0%) |
| 8:30 AM to 8:59 AM | 0 (0.0%) | 0 (0.0%) |
| 9:00 AM to 9:59 AM | 0 (0.0%) | 0 (0.0%) |
| 10:00 AM to 10:59 AM | 0 (0.0%) | 0 (0.0%) |
| 11:00 AM to 11:59 AM | 0 (0.0%) | 0 (0.0%) |
| 12:00 PM to 3:59 PM | 0 (0.0%) | 22 (20.0%) |
| 4:00 PM to 11:59 PM | 0 (0.0%) | 0 (0.0%) |
| Total | 165 (100.0%) | 110 (100.0%) |
Housing Occupancy in Shelby
Occupancy by Ownership in Shelby
Of the total 360 dwellings in Shelby, owner-occupied units account for 360 (100.0%), while renter-occupied units make up 0 (0.0%).
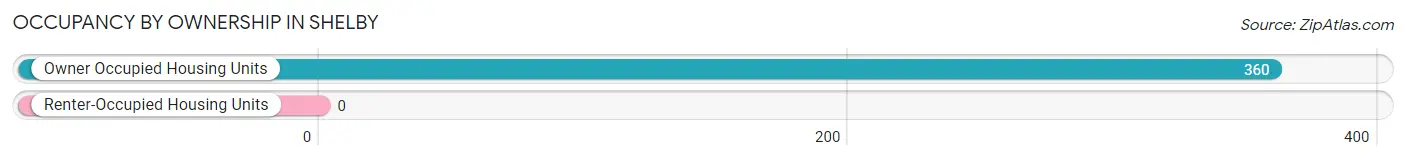
| Occupancy | # Housing Units | % Housing Units |
| Owner Occupied Housing Units | 360 | 100.0% |
| Renter-Occupied Housing Units | 0 | 0.0% |
| Total Occupied Housing Units | 360 | 100.0% |
Occupancy by Household Size in Shelby
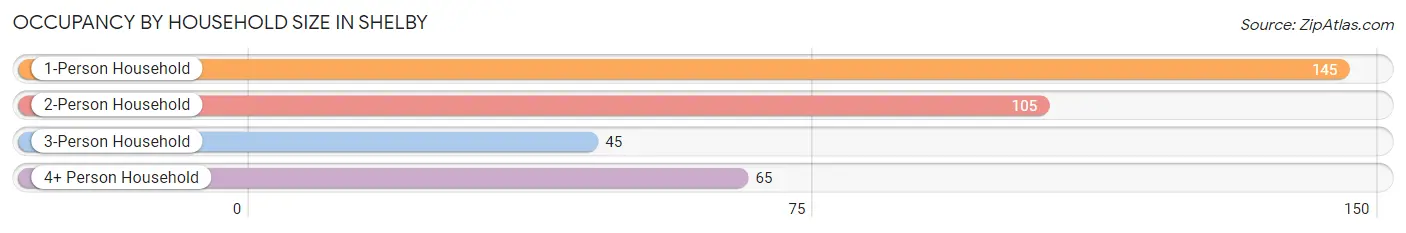
| Household Size | # Housing Units | % Housing Units |
| 1-Person Household | 145 | 40.3% |
| 2-Person Household | 105 | 29.2% |
| 3-Person Household | 45 | 12.5% |
| 4+ Person Household | 65 | 18.1% |
| Total Housing Units | 360 | 100.0% |
Occupancy by Ownership by Household Size in Shelby
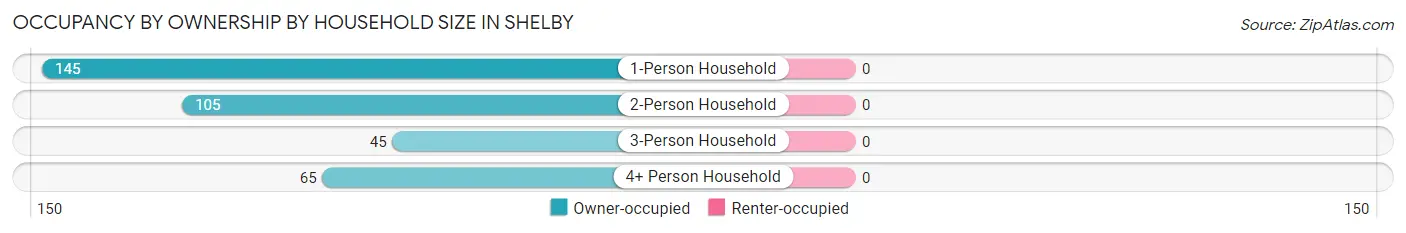
| Household Size | Owner-occupied | Renter-occupied |
| 1-Person Household | 145 (100.0%) | 0 (0.0%) |
| 2-Person Household | 105 (100.0%) | 0 (0.0%) |
| 3-Person Household | 45 (100.0%) | 0 (0.0%) |
| 4+ Person Household | 65 (100.0%) | 0 (0.0%) |
| Total Housing Units | 360 (100.0%) | 0 (0.0%) |
Occupancy by Educational Attainment in Shelby
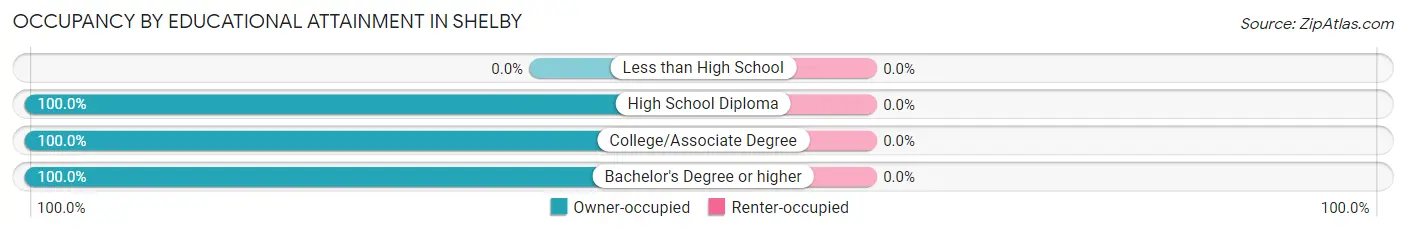
| Household Size | Owner-occupied | Renter-occupied |
| Less than High School | 0 (0.0%) | 0 (0.0%) |
| High School Diploma | 189 (100.0%) | 0 (0.0%) |
| College/Associate Degree | 110 (100.0%) | 0 (0.0%) |
| Bachelor's Degree or higher | 61 (100.0%) | 0 (0.0%) |
Occupancy by Age of Householder in Shelby
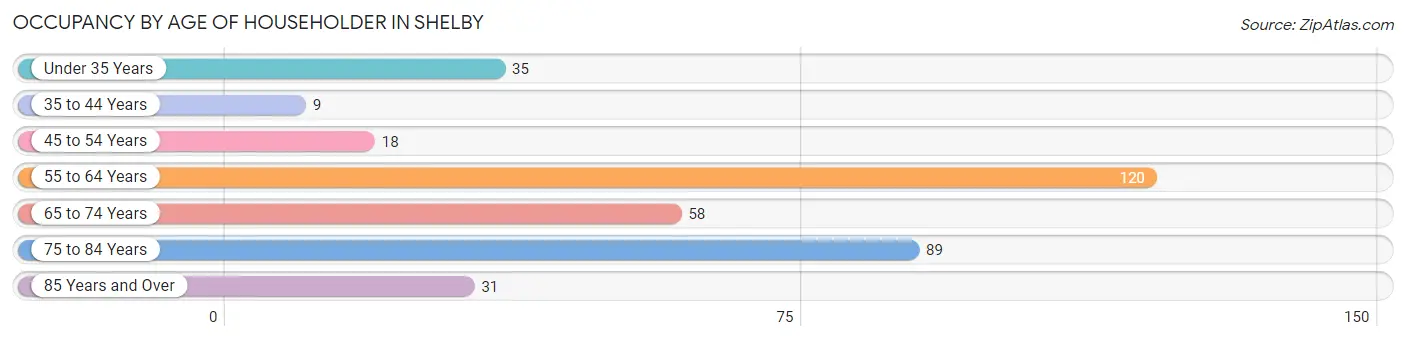
| Age Bracket | # Households | % Households |
| Under 35 Years | 35 | 9.7% |
| 35 to 44 Years | 9 | 2.5% |
| 45 to 54 Years | 18 | 5.0% |
| 55 to 64 Years | 120 | 33.3% |
| 65 to 74 Years | 58 | 16.1% |
| 75 to 84 Years | 89 | 24.7% |
| 85 Years and Over | 31 | 8.6% |
| Total | 360 | 100.0% |
Housing Finances in Shelby
Median Income by Occupancy in Shelby
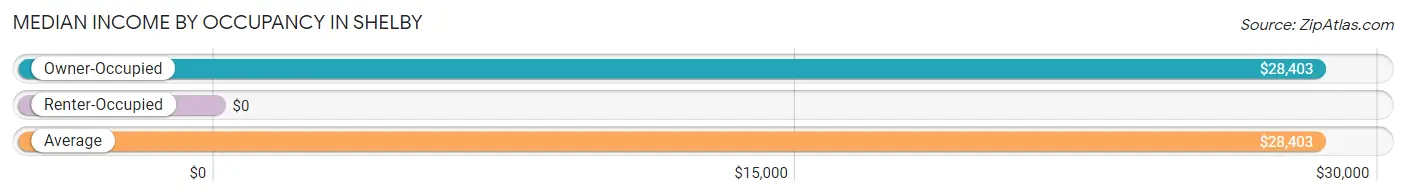
| Occupancy Type | # Households | Median Income |
| Owner-Occupied | 360 (100.0%) | $28,403 |
| Renter-Occupied | 0 (0.0%) | $0 |
| Average | 360 (100.0%) | $28,403 |
Occupancy by Householder Income Bracket in Shelby
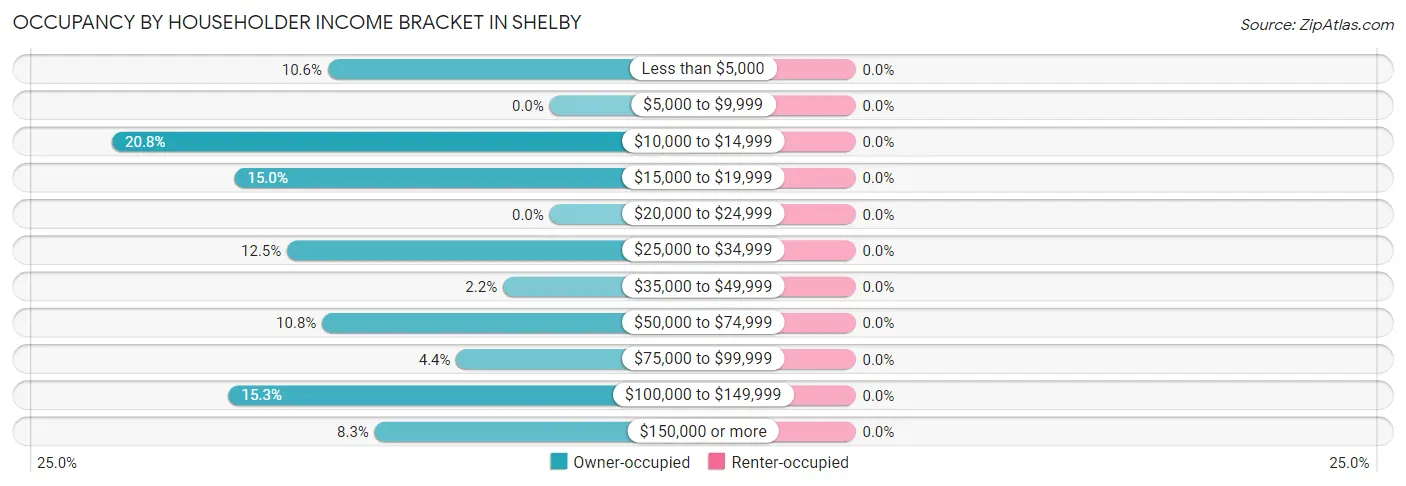
| Income Bracket | Owner-occupied | Renter-occupied |
| Less than $5,000 | 38 (10.6%) | 0 (0.0%) |
| $5,000 to $9,999 | 0 (0.0%) | 0 (0.0%) |
| $10,000 to $14,999 | 75 (20.8%) | 0 (0.0%) |
| $15,000 to $19,999 | 54 (15.0%) | 0 (0.0%) |
| $20,000 to $24,999 | 0 (0.0%) | 0 (0.0%) |
| $25,000 to $34,999 | 45 (12.5%) | 0 (0.0%) |
| $35,000 to $49,999 | 8 (2.2%) | 0 (0.0%) |
| $50,000 to $74,999 | 39 (10.8%) | 0 (0.0%) |
| $75,000 to $99,999 | 16 (4.4%) | 0 (0.0%) |
| $100,000 to $149,999 | 55 (15.3%) | 0 (0.0%) |
| $150,000 or more | 30 (8.3%) | 0 (0.0%) |
| Total | 360 (100.0%) | 0 (0.0%) |
Monthly Housing Cost Tiers in Shelby
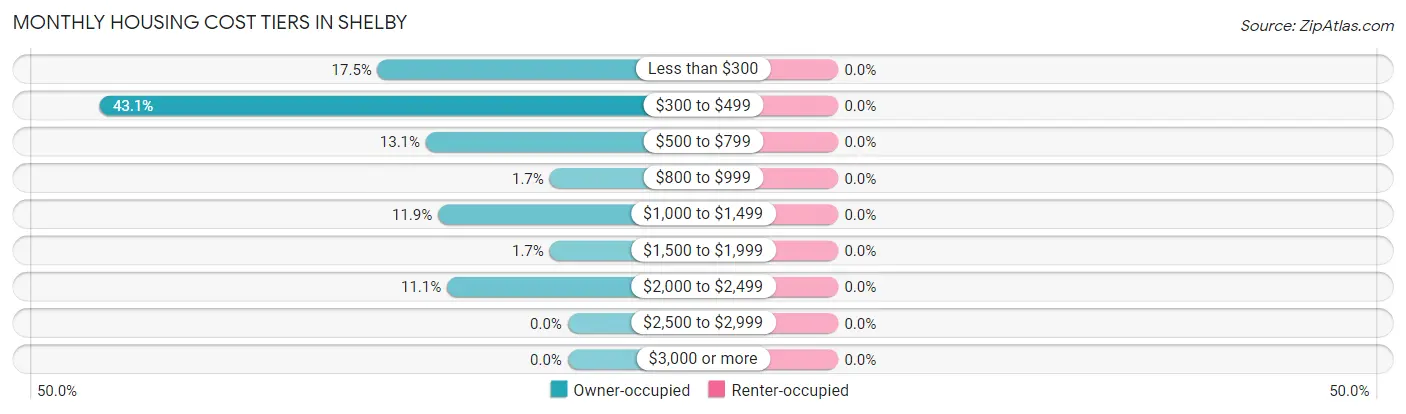
| Monthly Cost | Owner-occupied | Renter-occupied |
| Less than $300 | 63 (17.5%) | 0 (0.0%) |
| $300 to $499 | 155 (43.1%) | 0 (0.0%) |
| $500 to $799 | 47 (13.1%) | 0 (0.0%) |
| $800 to $999 | 6 (1.7%) | 0 (0.0%) |
| $1,000 to $1,499 | 43 (11.9%) | 0 (0.0%) |
| $1,500 to $1,999 | 6 (1.7%) | 0 (0.0%) |
| $2,000 to $2,499 | 40 (11.1%) | 0 (0.0%) |
| $2,500 to $2,999 | 0 (0.0%) | 0 (0.0%) |
| $3,000 or more | 0 (0.0%) | 0 (0.0%) |
| Total | 360 (100.0%) | 0 (0.0%) |
Physical Housing Characteristics in Shelby
Housing Structures in Shelby
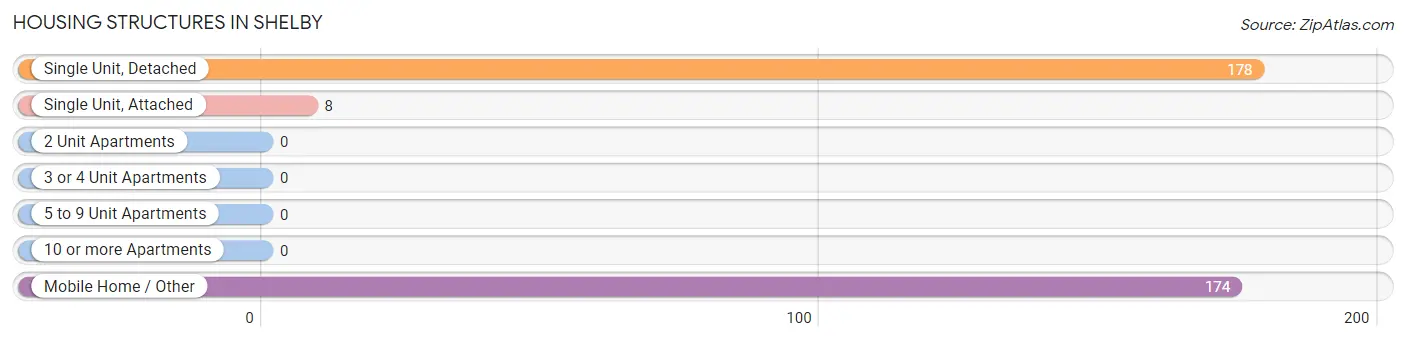
| Structure Type | # Housing Units | % Housing Units |
| Single Unit, Detached | 178 | 49.4% |
| Single Unit, Attached | 8 | 2.2% |
| 2 Unit Apartments | 0 | 0.0% |
| 3 or 4 Unit Apartments | 0 | 0.0% |
| 5 to 9 Unit Apartments | 0 | 0.0% |
| 10 or more Apartments | 0 | 0.0% |
| Mobile Home / Other | 174 | 48.3% |
| Total | 360 | 100.0% |
Housing Structures by Occupancy in Shelby
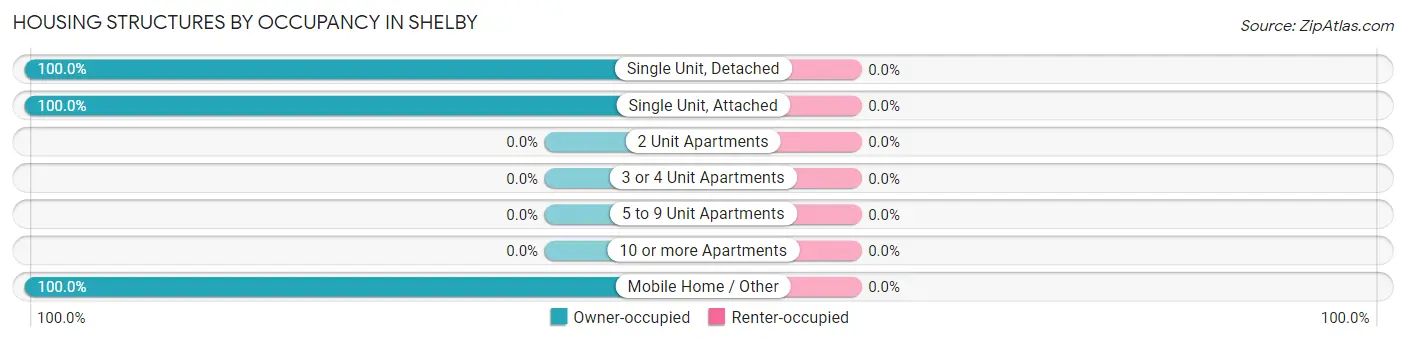
| Structure Type | Owner-occupied | Renter-occupied |
| Single Unit, Detached | 178 (100.0%) | 0 (0.0%) |
| Single Unit, Attached | 8 (100.0%) | 0 (0.0%) |
| 2 Unit Apartments | 0 (0.0%) | 0 (0.0%) |
| 3 or 4 Unit Apartments | 0 (0.0%) | 0 (0.0%) |
| 5 to 9 Unit Apartments | 0 (0.0%) | 0 (0.0%) |
| 10 or more Apartments | 0 (0.0%) | 0 (0.0%) |
| Mobile Home / Other | 174 (100.0%) | 0 (0.0%) |
| Total | 360 (100.0%) | 0 (0.0%) |
Housing Structures by Number of Rooms in Shelby
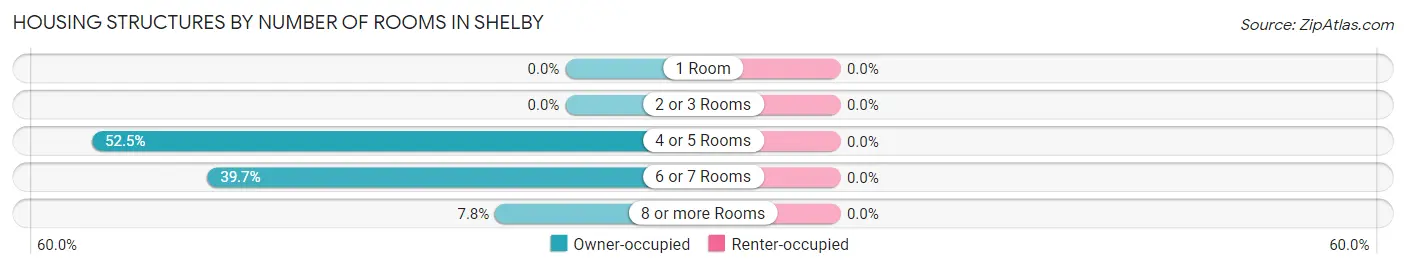
| Number of Rooms | Owner-occupied | Renter-occupied |
| 1 Room | 0 (0.0%) | 0 (0.0%) |
| 2 or 3 Rooms | 0 (0.0%) | 0 (0.0%) |
| 4 or 5 Rooms | 189 (52.5%) | 0 (0.0%) |
| 6 or 7 Rooms | 143 (39.7%) | 0 (0.0%) |
| 8 or more Rooms | 28 (7.8%) | 0 (0.0%) |
| Total | 360 (100.0%) | 0 (0.0%) |
Housing Structure by Heating Type in Shelby
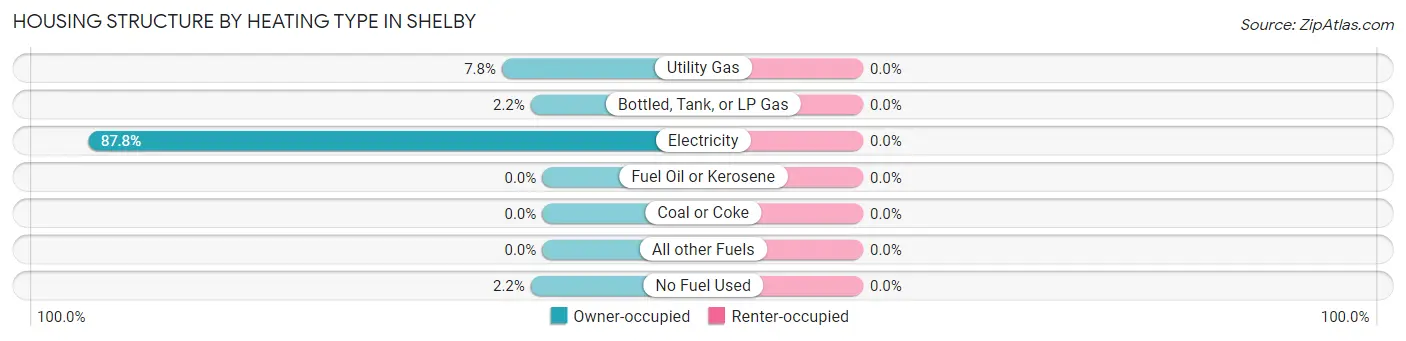
| Heating Type | Owner-occupied | Renter-occupied |
| Utility Gas | 28 (7.8%) | 0 (0.0%) |
| Bottled, Tank, or LP Gas | 8 (2.2%) | 0 (0.0%) |
| Electricity | 316 (87.8%) | 0 (0.0%) |
| Fuel Oil or Kerosene | 0 (0.0%) | 0 (0.0%) |
| Coal or Coke | 0 (0.0%) | 0 (0.0%) |
| All other Fuels | 0 (0.0%) | 0 (0.0%) |
| No Fuel Used | 8 (2.2%) | 0 (0.0%) |
| Total | 360 (100.0%) | 0 (0.0%) |
Household Vehicle Usage in Shelby
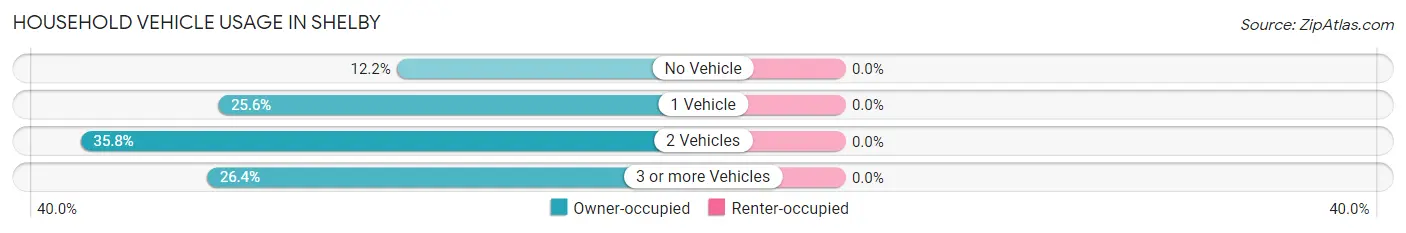
| Vehicles per Household | Owner-occupied | Renter-occupied |
| No Vehicle | 44 (12.2%) | 0 (0.0%) |
| 1 Vehicle | 92 (25.6%) | 0 (0.0%) |
| 2 Vehicles | 129 (35.8%) | 0 (0.0%) |
| 3 or more Vehicles | 95 (26.4%) | 0 (0.0%) |
| Total | 360 (100.0%) | 0 (0.0%) |
Real Estate & Mortgages in Shelby
Real Estate and Mortgage Overview in Shelby
| Characteristic | Without Mortgage | With Mortgage |
| Housing Units | 257 | 103 |
| Median Property Value | $92,100 | $0 |
| Median Household Income | $15,718 | $21 |
| Monthly Housing Costs | $346 | $0 |
| Real Estate Taxes | - | - |
Property Value by Mortgage Status in Shelby
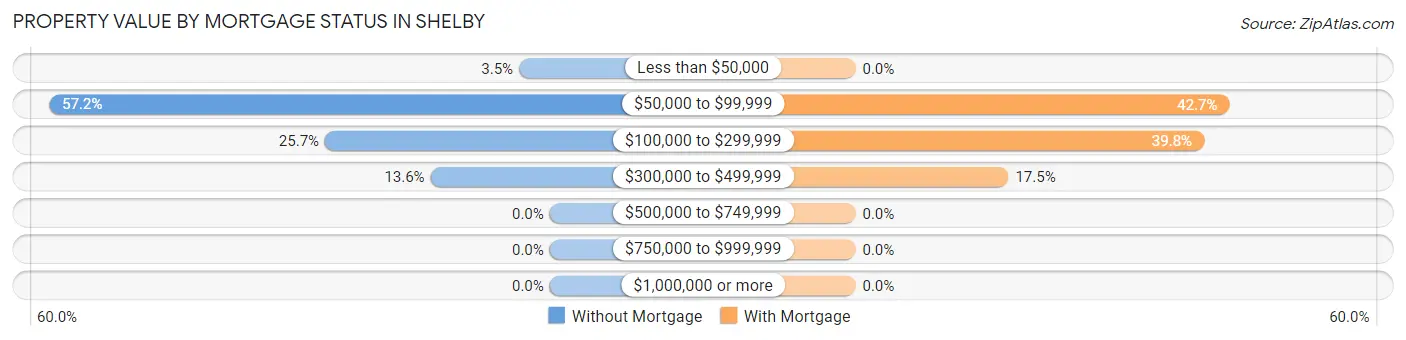
| Property Value | Without Mortgage | With Mortgage |
| Less than $50,000 | 9 (3.5%) | 0 (0.0%) |
| $50,000 to $99,999 | 147 (57.2%) | 44 (42.7%) |
| $100,000 to $299,999 | 66 (25.7%) | 41 (39.8%) |
| $300,000 to $499,999 | 35 (13.6%) | 18 (17.5%) |
| $500,000 to $749,999 | 0 (0.0%) | 0 (0.0%) |
| $750,000 to $999,999 | 0 (0.0%) | 0 (0.0%) |
| $1,000,000 or more | 0 (0.0%) | 0 (0.0%) |
| Total | 257 (100.0%) | 103 (100.0%) |
Household Income by Mortgage Status in Shelby
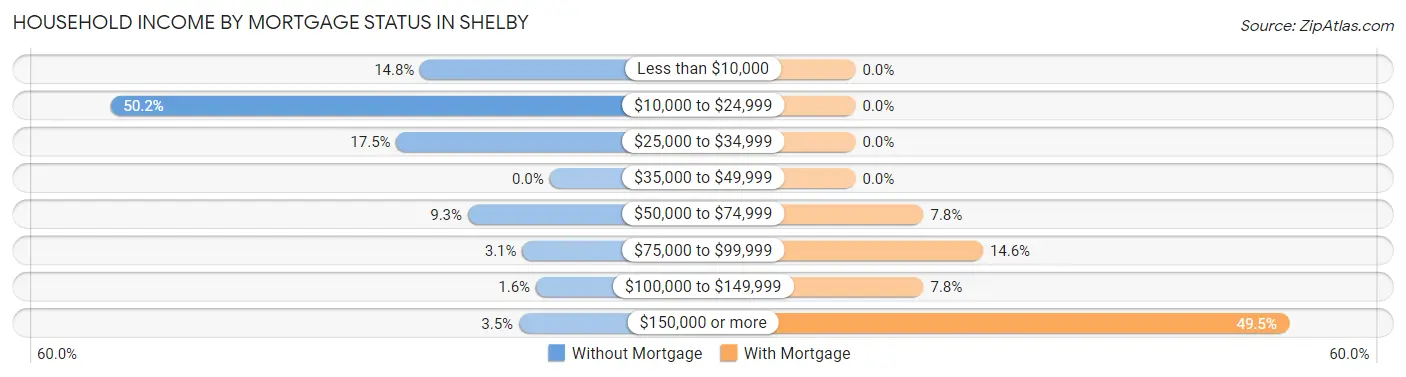
| Household Income | Without Mortgage | With Mortgage |
| Less than $10,000 | 38 (14.8%) | 0 (0.0%) |
| $10,000 to $24,999 | 129 (50.2%) | 0 (0.0%) |
| $25,000 to $34,999 | 45 (17.5%) | 0 (0.0%) |
| $35,000 to $49,999 | 0 (0.0%) | 0 (0.0%) |
| $50,000 to $74,999 | 24 (9.3%) | 8 (7.8%) |
| $75,000 to $99,999 | 8 (3.1%) | 15 (14.6%) |
| $100,000 to $149,999 | 4 (1.6%) | 8 (7.8%) |
| $150,000 or more | 9 (3.5%) | 51 (49.5%) |
| Total | 257 (100.0%) | 103 (100.0%) |
Property Value to Household Income Ratio in Shelby
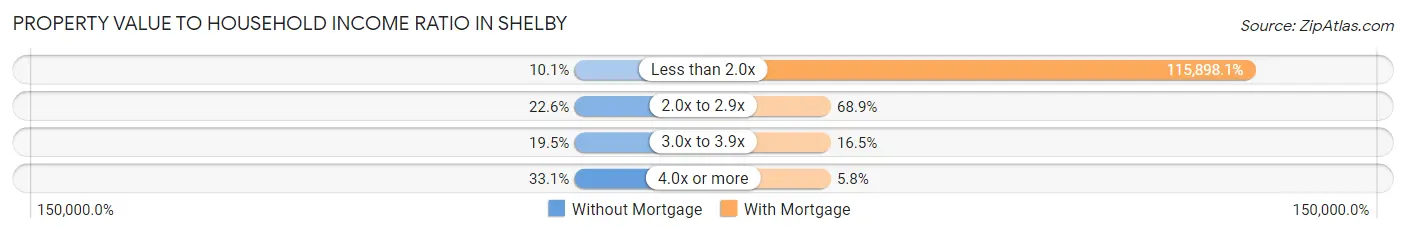
| Value-to-Income Ratio | Without Mortgage | With Mortgage |
| Less than 2.0x | 26 (10.1%) | 119,375 (115,898.1%) |
| 2.0x to 2.9x | 58 (22.6%) | 71 (68.9%) |
| 3.0x to 3.9x | 50 (19.5%) | 17 (16.5%) |
| 4.0x or more | 85 (33.1%) | 6 (5.8%) |
| Total | 257 (100.0%) | 103 (100.0%) |
Real Estate Taxes by Mortgage Status in Shelby
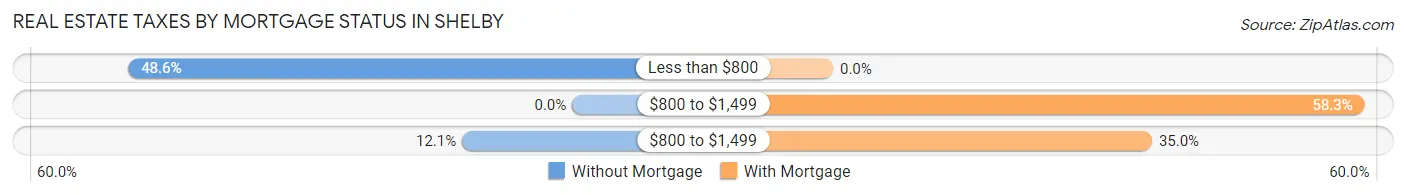
| Property Taxes | Without Mortgage | With Mortgage |
| Less than $800 | 125 (48.6%) | 0 (0.0%) |
| $800 to $1,499 | 0 (0.0%) | 60 (58.3%) |
| $800 to $1,499 | 31 (12.1%) | 36 (34.9%) |
| Total | 257 (100.0%) | 103 (100.0%) |
Health & Disability in Shelby
Health Insurance Coverage by Age in Shelby
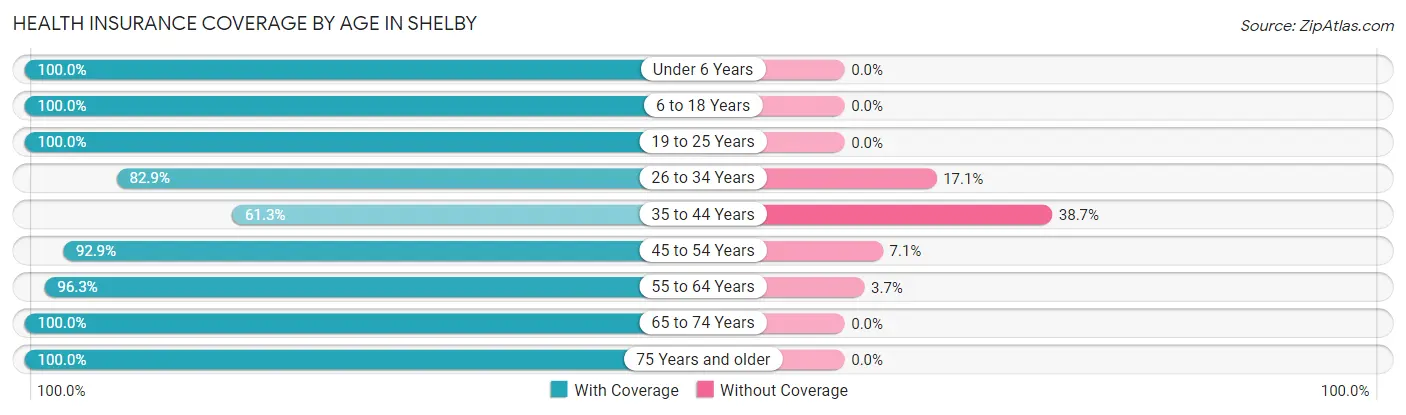
| Age Bracket | With Coverage | Without Coverage |
| Under 6 Years | 30 (100.0%) | 0 (0.0%) |
| 6 to 18 Years | 99 (100.0%) | 0 (0.0%) |
| 19 to 25 Years | 65 (100.0%) | 0 (0.0%) |
| 26 to 34 Years | 58 (82.9%) | 12 (17.1%) |
| 35 to 44 Years | 19 (61.3%) | 12 (38.7%) |
| 45 to 54 Years | 78 (92.9%) | 6 (7.1%) |
| 55 to 64 Years | 156 (96.3%) | 6 (3.7%) |
| 65 to 74 Years | 77 (100.0%) | 0 (0.0%) |
| 75 Years and older | 181 (100.0%) | 0 (0.0%) |
| Total | 763 (95.5%) | 36 (4.5%) |
Health Insurance Coverage by Citizenship Status in Shelby
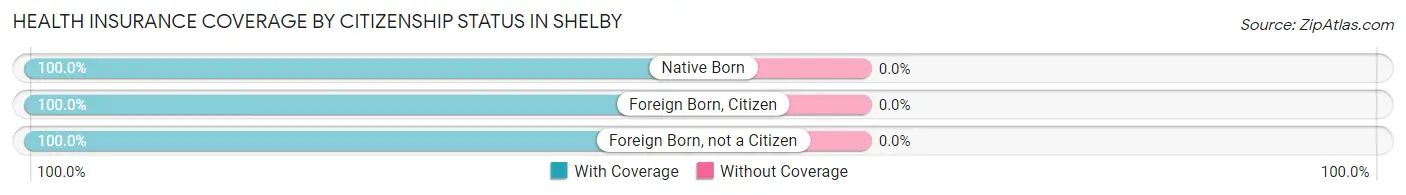
| Citizenship Status | With Coverage | Without Coverage |
| Native Born | 30 (100.0%) | 0 (0.0%) |
| Foreign Born, Citizen | 99 (100.0%) | 0 (0.0%) |
| Foreign Born, not a Citizen | 65 (100.0%) | 0 (0.0%) |
Health Insurance Coverage by Household Income in Shelby
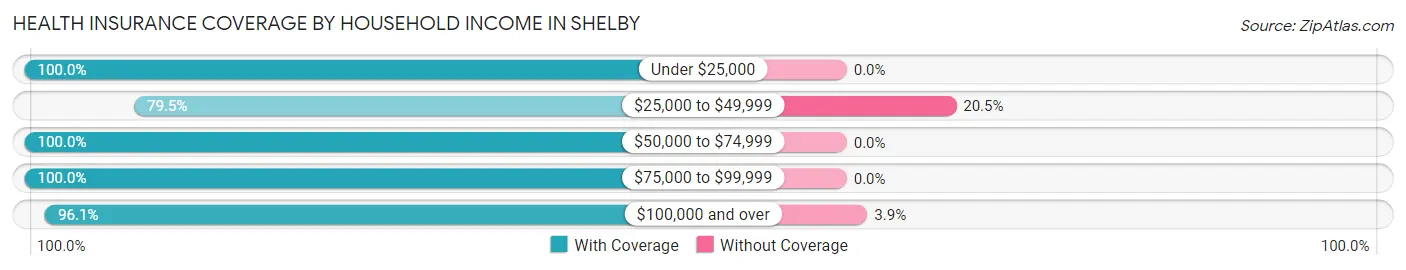
| Household Income | With Coverage | Without Coverage |
| Under $25,000 | 209 (100.0%) | 0 (0.0%) |
| $25,000 to $49,999 | 93 (79.5%) | 24 (20.5%) |
| $50,000 to $74,999 | 114 (100.0%) | 0 (0.0%) |
| $75,000 to $99,999 | 48 (100.0%) | 0 (0.0%) |
| $100,000 and over | 299 (96.1%) | 12 (3.9%) |
Public vs Private Health Insurance Coverage by Age in Shelby
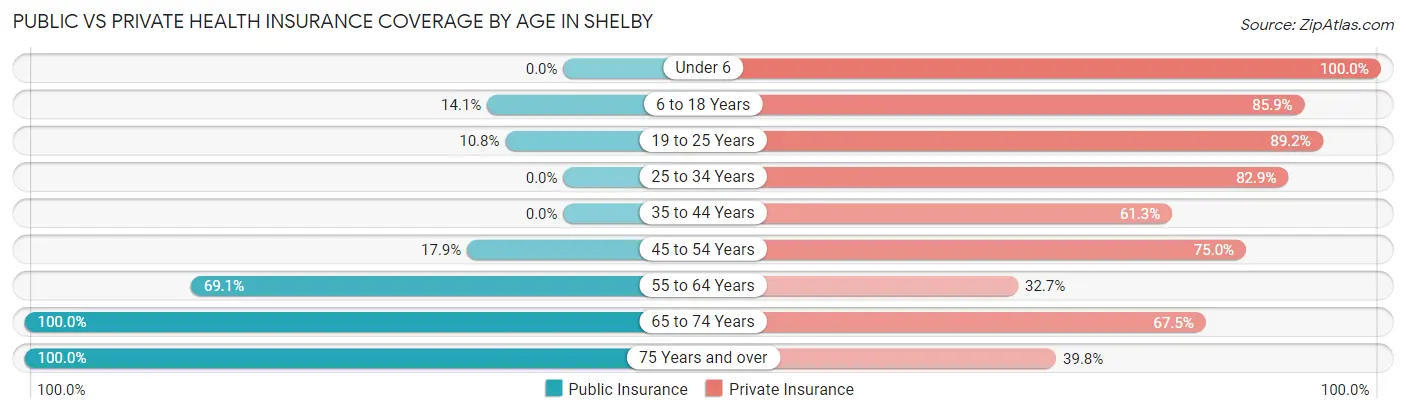
| Age Bracket | Public Insurance | Private Insurance |
| Under 6 | 0 (0.0%) | 30 (100.0%) |
| 6 to 18 Years | 14 (14.1%) | 85 (85.9%) |
| 19 to 25 Years | 7 (10.8%) | 58 (89.2%) |
| 25 to 34 Years | 0 (0.0%) | 58 (82.9%) |
| 35 to 44 Years | 0 (0.0%) | 19 (61.3%) |
| 45 to 54 Years | 15 (17.9%) | 63 (75.0%) |
| 55 to 64 Years | 112 (69.1%) | 53 (32.7%) |
| 65 to 74 Years | 77 (100.0%) | 52 (67.5%) |
| 75 Years and over | 181 (100.0%) | 72 (39.8%) |
| Total | 406 (50.8%) | 490 (61.3%) |
Disability Status by Sex by Age in Shelby
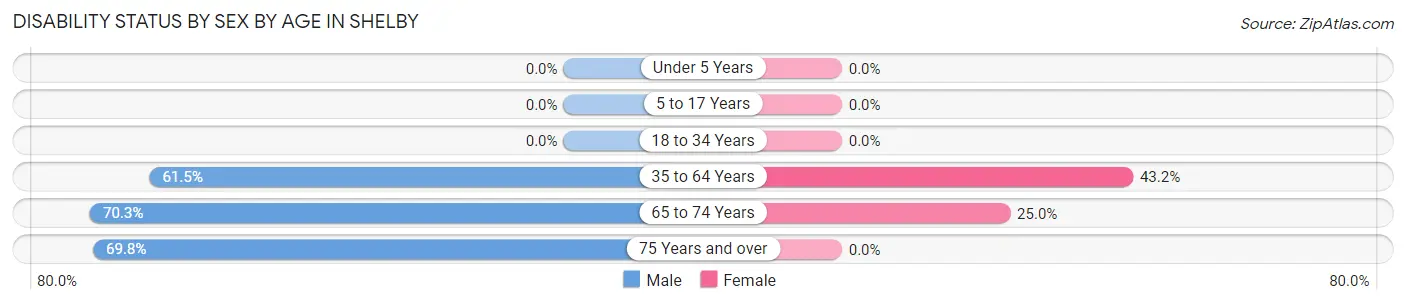
| Age Bracket | Male | Female |
| Under 5 Years | 0 (0.0%) | 0 (0.0%) |
| 5 to 17 Years | 0 (0.0%) | 0 (0.0%) |
| 18 to 34 Years | 0 (0.0%) | 0 (0.0%) |
| 35 to 64 Years | 102 (61.5%) | 48 (43.2%) |
| 65 to 74 Years | 26 (70.3%) | 10 (25.0%) |
| 75 Years and over | 81 (69.8%) | 0 (0.0%) |
Disability Class by Sex by Age in Shelby
Disability Class: Hearing Difficulty
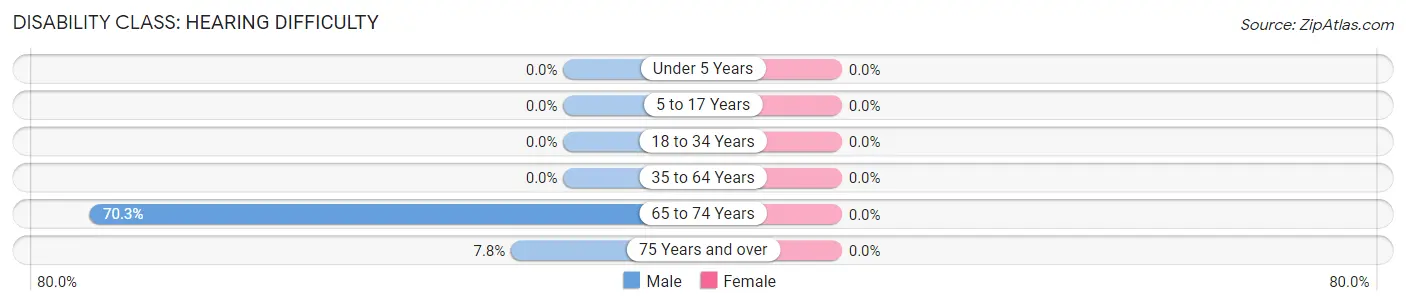
| Age Bracket | Male | Female |
| Under 5 Years | 0 (0.0%) | 0 (0.0%) |
| 5 to 17 Years | 0 (0.0%) | 0 (0.0%) |
| 18 to 34 Years | 0 (0.0%) | 0 (0.0%) |
| 35 to 64 Years | 0 (0.0%) | 0 (0.0%) |
| 65 to 74 Years | 26 (70.3%) | 0 (0.0%) |
| 75 Years and over | 9 (7.8%) | 0 (0.0%) |
Disability Class: Vision Difficulty
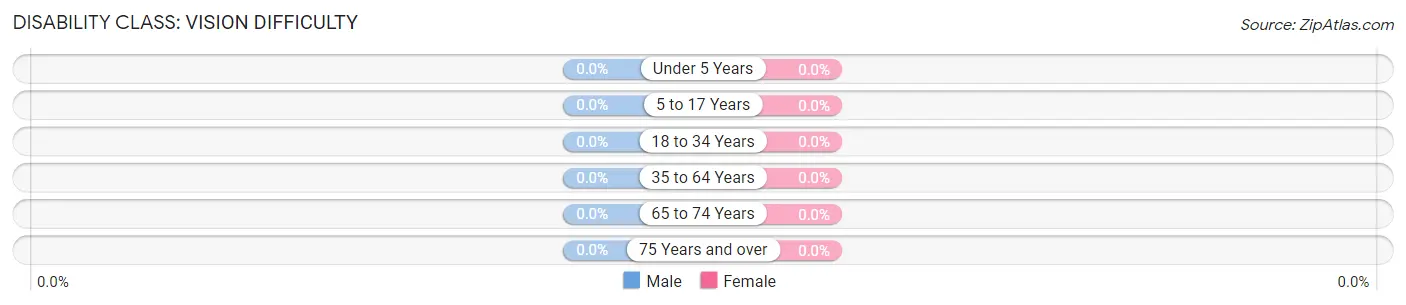
| Age Bracket | Male | Female |
| Under 5 Years | 0 (0.0%) | 0 (0.0%) |
| 5 to 17 Years | 0 (0.0%) | 0 (0.0%) |
| 18 to 34 Years | 0 (0.0%) | 0 (0.0%) |
| 35 to 64 Years | 0 (0.0%) | 0 (0.0%) |
| 65 to 74 Years | 0 (0.0%) | 0 (0.0%) |
| 75 Years and over | 0 (0.0%) | 0 (0.0%) |
Disability Class: Cognitive Difficulty
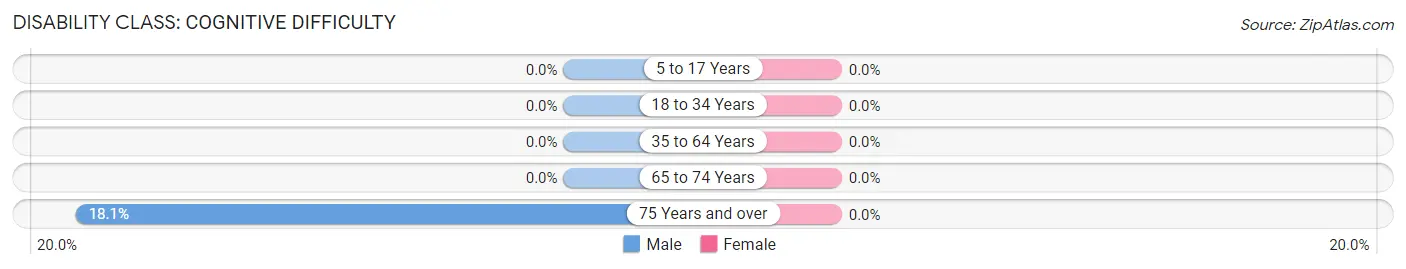
| Age Bracket | Male | Female |
| 5 to 17 Years | 0 (0.0%) | 0 (0.0%) |
| 18 to 34 Years | 0 (0.0%) | 0 (0.0%) |
| 35 to 64 Years | 0 (0.0%) | 0 (0.0%) |
| 65 to 74 Years | 0 (0.0%) | 0 (0.0%) |
| 75 Years and over | 21 (18.1%) | 0 (0.0%) |
Disability Class: Ambulatory Difficulty
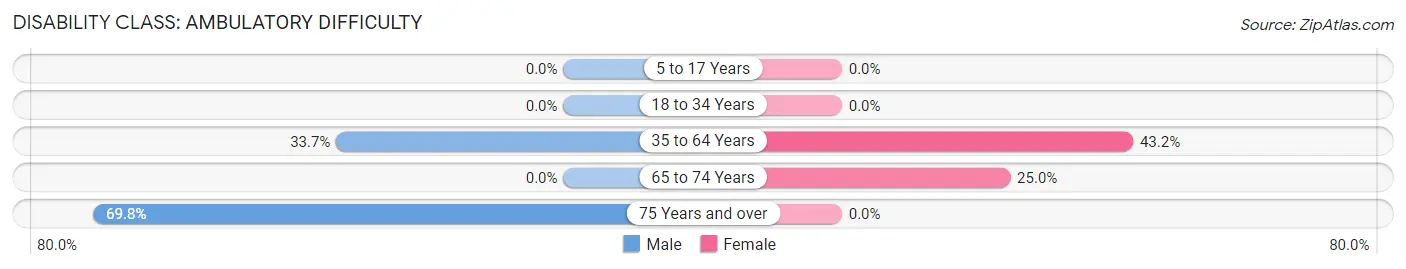
| Age Bracket | Male | Female |
| 5 to 17 Years | 0 (0.0%) | 0 (0.0%) |
| 18 to 34 Years | 0 (0.0%) | 0 (0.0%) |
| 35 to 64 Years | 56 (33.7%) | 48 (43.2%) |
| 65 to 74 Years | 0 (0.0%) | 10 (25.0%) |
| 75 Years and over | 81 (69.8%) | 0 (0.0%) |
Disability Class: Self-Care Difficulty
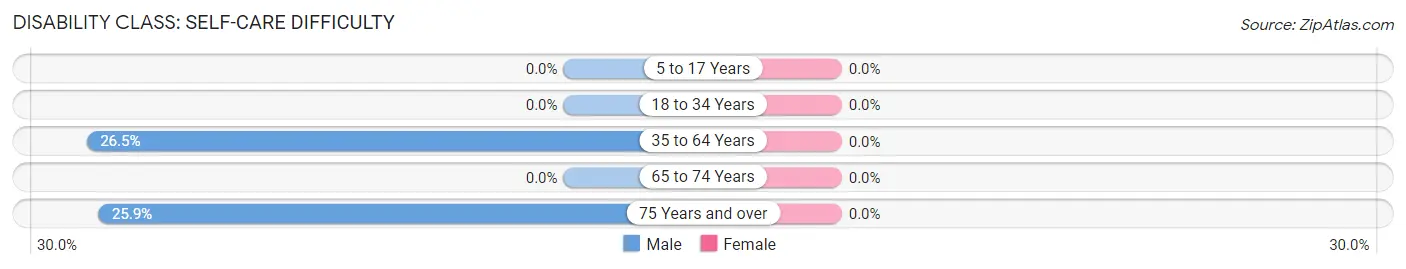
| Age Bracket | Male | Female |
| 5 to 17 Years | 0 (0.0%) | 0 (0.0%) |
| 18 to 34 Years | 0 (0.0%) | 0 (0.0%) |
| 35 to 64 Years | 44 (26.5%) | 0 (0.0%) |
| 65 to 74 Years | 0 (0.0%) | 0 (0.0%) |
| 75 Years and over | 30 (25.9%) | 0 (0.0%) |
Technology Access in Shelby
Computing Device Access in Shelby
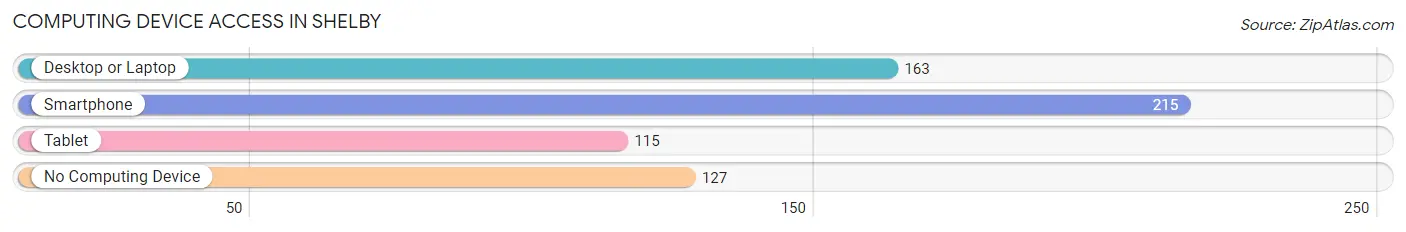
| Device Type | # Households | % Households |
| Desktop or Laptop | 163 | 45.3% |
| Smartphone | 215 | 59.7% |
| Tablet | 115 | 31.9% |
| No Computing Device | 127 | 35.3% |
| Total | 360 | 100.0% |
Internet Access in Shelby
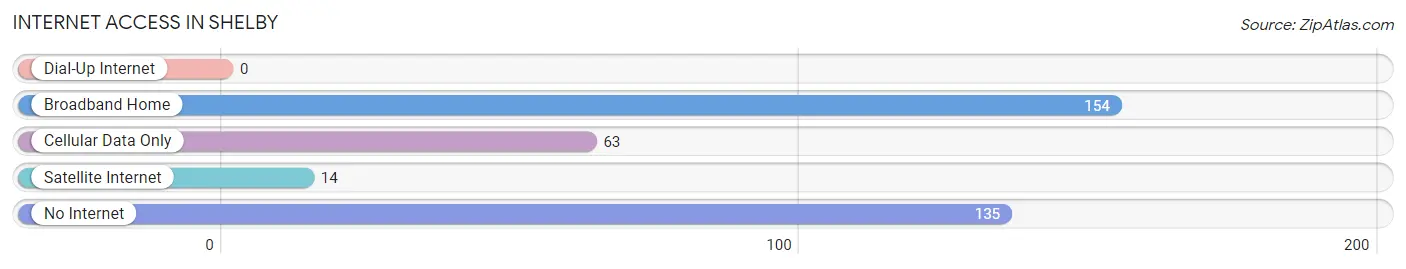
| Internet Type | # Households | % Households |
| Dial-Up Internet | 0 | 0.0% |
| Broadband Home | 154 | 42.8% |
| Cellular Data Only | 63 | 17.5% |
| Satellite Internet | 14 | 3.9% |
| No Internet | 135 | 37.5% |
| Total | 360 | 100.0% |
Shelby Summary
Shelby, Alabama is a small town located in the northwest corner of the state, near the Mississippi border. It is part of the Birmingham-Hoover Metropolitan Statistical Area and is the county seat of Shelby County. The town was founded in 1818 and has a population of approximately 2,000 people.
Geography
Shelby is located in the northwest corner of Alabama, near the Mississippi border. It is situated in the foothills of the Appalachian Mountains and is part of the Black Belt region of the state. The town is located on the banks of the Cahaba River, which is a tributary of the Alabama River. The town is surrounded by rolling hills and forests, and is home to several small lakes.
The climate in Shelby is humid subtropical, with hot, humid summers and mild winters. The average annual temperature is around 68°F (20°C), and the average annual precipitation is around 50 inches (127 cm).
Economy
Shelby’s economy is largely based on agriculture and forestry. The town is home to several small farms, and the surrounding area is known for its timber production. The town also has a small manufacturing sector, with several small factories producing furniture, textiles, and other goods.
The town is also home to several small businesses, including restaurants, shops, and other services. The town is also home to a small airport, which serves the surrounding area.
Demographics
As of the 2010 census, the population of Shelby was 2,000 people. The racial makeup of the town was 95.2% White, 2.2% African American, 0.7% Native American, 0.2% Asian, 0.1% Pacific Islander, 0.4% from other races, and 1.2% from two or more races. Hispanic or Latino of any race were 1.2% of the population.
The median income for a household in Shelby was $31,250, and the median income for a family was $37,500. The per capita income for the town was $17,857. About 16.2% of families and 19.2% of the population were below the poverty line, including 25.2% of those under age 18 and 11.2% of those age 65 or over.
History
Shelby was founded in 1818 by settlers from North Carolina. The town was named after Isaac Shelby, the first governor of Kentucky. The town was originally a farming community, and the surrounding area was known for its timber production.
In the late 19th century, Shelby became a center for the timber industry, and the town’s population grew rapidly. The town was also home to several small factories, which produced furniture, textiles, and other goods.
In the early 20th century, Shelby was a popular tourist destination, and the town was home to several resorts and hotels. The town was also home to several small businesses, including restaurants, shops, and other services.
In the late 20th century, Shelby’s economy shifted away from agriculture and timber production, and the town’s population began to decline. The town is now home to several small businesses, and the surrounding area is known for its timber production.
Common Questions
What is Per Capita Income in Shelby?
Per Capita income in Shelby is $26,111.
What is the Median Household income in Shelby?
Median Household Income in Shelby is $28,403.
What is Income or Wage Gap in Shelby?
Income or Wage Gap in Shelby is 22.3%.
Women in Shelby earn 77.7 cents for every dollar earned by a man.
What is Inequality or Gini Index in Shelby?
Inequality or Gini Index in Shelby is 0.55.
What is the Total Population of Shelby?
Total Population of Shelby is 799.
What is the Total Male Population of Shelby?
Total Male Population of Shelby is 518.
What is the Total Female Population of Shelby?
Total Female Population of Shelby is 281.
What is the Ratio of Males per 100 Females in Shelby?
There are 184.34 Males per 100 Females in Shelby.
What is the Ratio of Females per 100 Males in Shelby?
There are 54.25 Females per 100 Males in Shelby.
What is the Median Population Age in Shelby?
Median Population Age in Shelby is 56.3 Years.
What is the Average Family Size in Shelby
Average Family Size in Shelby is 3.0 People.
What is the Average Household Size in Shelby
Average Household Size in Shelby is 2.2 People.
How Large is the Labor Force in Shelby?
There are 275 People in the Labor Forcein in Shelby.
What is the Percentage of People in the Labor Force in Shelby?
39.5% of People are in the Labor Force in Shelby.