Elberta, AL Map & Demographics
Elberta Map
Elberta Overview
$27,418
PER CAPITA INCOME
$55,625
AVG FAMILY INCOME
$47,452
AVG HOUSEHOLD INCOME
44.6%
WAGE / INCOME GAP [ % ]
55.4¢/ $1
WAGE / INCOME GAP [ $ ]
0.42
INEQUALITY / GINI INDEX
2,140
TOTAL POPULATION
1,119
MALE POPULATION
1,021
FEMALE POPULATION
109.60
MALES / 100 FEMALES
91.24
FEMALES / 100 MALES
49.2
MEDIAN AGE
3.2
AVG FAMILY SIZE
2.2
AVG HOUSEHOLD SIZE
1,113
LABOR FORCE [ PEOPLE ]
59.8%
PERCENT IN LABOR FORCE
4.2%
UNEMPLOYMENT RATE
Elberta Zip Codes
Elberta Area Codes
Income in Elberta
Income Overview in Elberta
Per Capita Income in Elberta is $27,418, while median incomes of families and households are $55,625 and $47,452 respectively.
| Characteristic | Number | Measure |
| Per Capita Income | 2,140 | $27,418 |
| Median Family Income | 445 | $55,625 |
| Mean Family Income | 445 | $75,600 |
| Median Household Income | 961 | $47,452 |
| Mean Household Income | 961 | $59,069 |
| Income Deficit | 445 | $0 |
| Wage / Income Gap (%) | 2,140 | 44.58% |
| Wage / Income Gap ($) | 2,140 | 55.42¢ per $1 |
| Gini / Inequality Index | 2,140 | 0.42 |
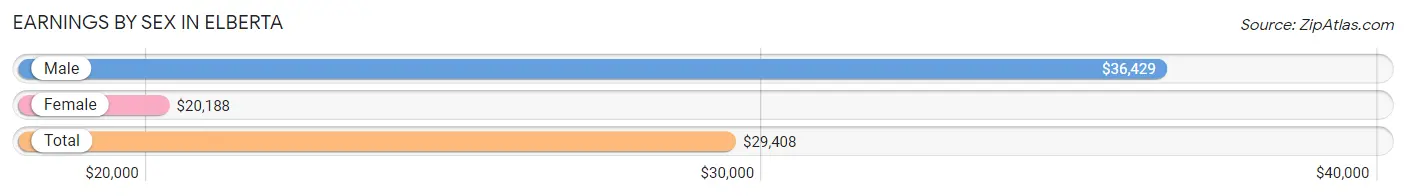
Earnings by Sex in Elberta
Average Earnings in Elberta are $29,408, $36,429 for men and $20,188 for women, a difference of 44.6%.
| Sex | Number | Average Earnings |
| Male | 698 (62.1%) | $36,429 |
| Female | 426 (37.9%) | $20,188 |
| Total | 1,124 (100.0%) | $29,408 |
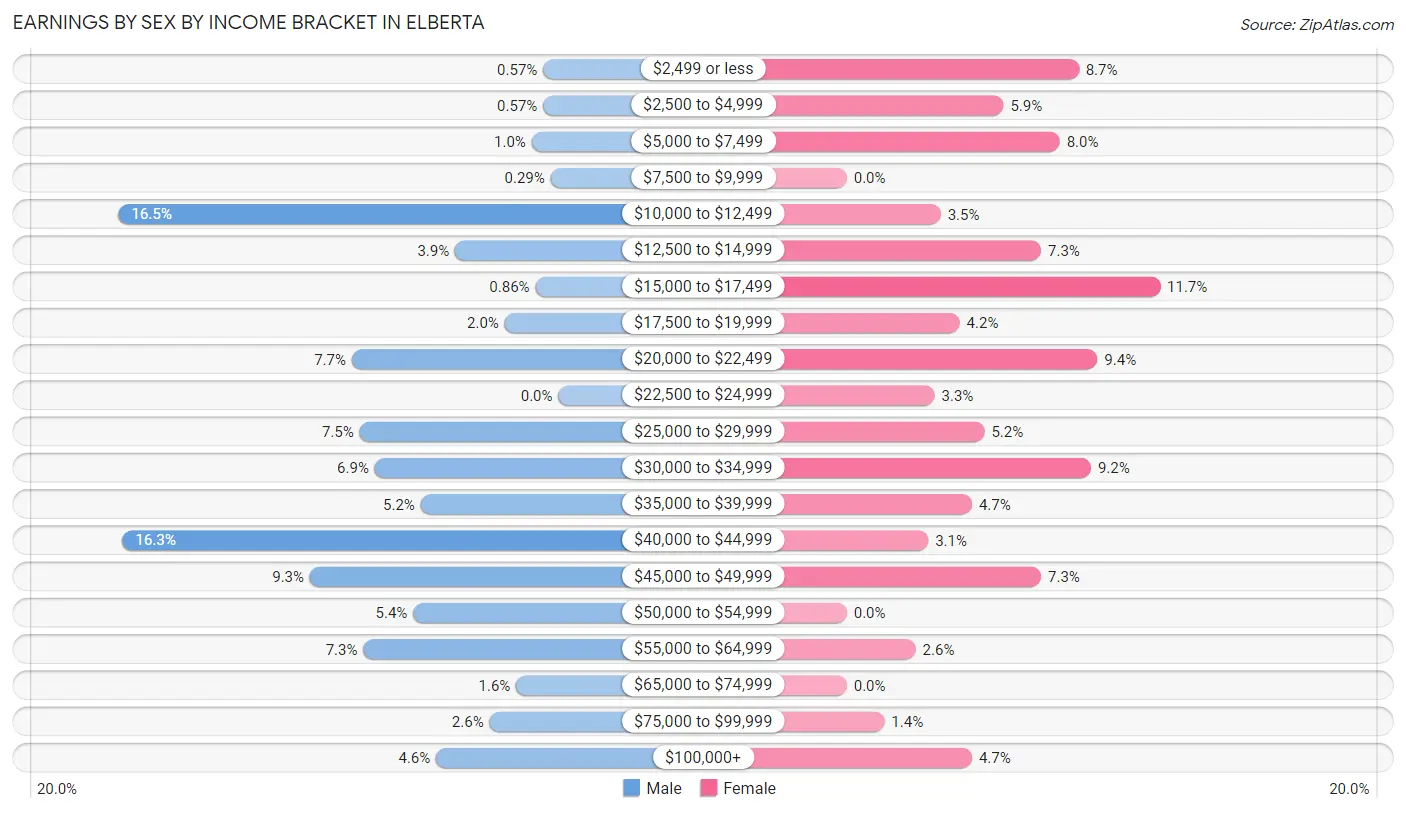
Earnings by Sex by Income Bracket in Elberta
The most common earnings brackets in Elberta are $10,000 to $12,499 for men (115 | 16.5%) and $15,000 to $17,499 for women (50 | 11.7%).
| Income | Male | Female |
| $2,499 or less | 4 (0.6%) | 37 (8.7%) |
| $2,500 to $4,999 | 4 (0.6%) | 25 (5.9%) |
| $5,000 to $7,499 | 7 (1.0%) | 34 (8.0%) |
| $7,500 to $9,999 | 2 (0.3%) | 0 (0.0%) |
| $10,000 to $12,499 | 115 (16.5%) | 15 (3.5%) |
| $12,500 to $14,999 | 27 (3.9%) | 31 (7.3%) |
| $15,000 to $17,499 | 6 (0.9%) | 50 (11.7%) |
| $17,500 to $19,999 | 14 (2.0%) | 18 (4.2%) |
| $20,000 to $22,499 | 54 (7.7%) | 40 (9.4%) |
| $22,500 to $24,999 | 0 (0.0%) | 14 (3.3%) |
| $25,000 to $29,999 | 52 (7.4%) | 22 (5.2%) |
| $30,000 to $34,999 | 48 (6.9%) | 39 (9.1%) |
| $35,000 to $39,999 | 36 (5.2%) | 20 (4.7%) |
| $40,000 to $44,999 | 114 (16.3%) | 13 (3.0%) |
| $45,000 to $49,999 | 65 (9.3%) | 31 (7.3%) |
| $50,000 to $54,999 | 38 (5.4%) | 0 (0.0%) |
| $55,000 to $64,999 | 51 (7.3%) | 11 (2.6%) |
| $65,000 to $74,999 | 11 (1.6%) | 0 (0.0%) |
| $75,000 to $99,999 | 18 (2.6%) | 6 (1.4%) |
| $100,000+ | 32 (4.6%) | 20 (4.7%) |
| Total | 698 (100.0%) | 426 (100.0%) |
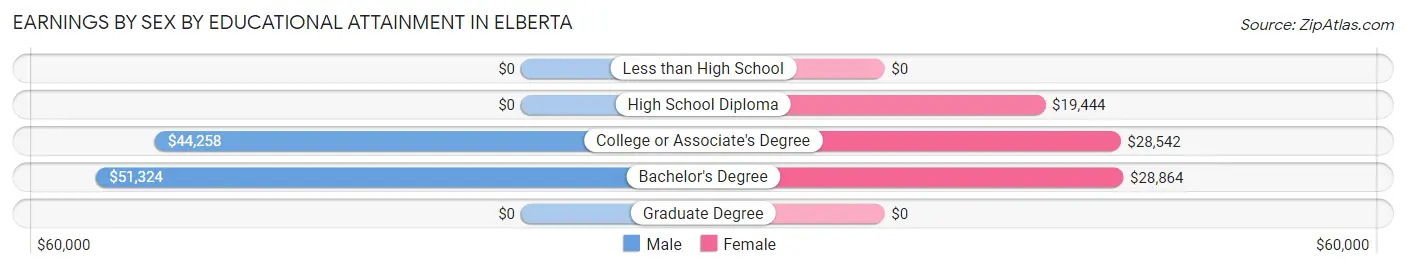
Earnings by Sex by Educational Attainment in Elberta
Average earnings in Elberta are $43,161 for men and $22,500 for women, a difference of 47.9%. Men with an educational attainment of bachelor's degree enjoy the highest average annual earnings of $51,324, while those with college or associate's degree education earn the least with $44,258. Women with an educational attainment of bachelor's degree earn the most with the average annual earnings of $28,864, while those with high school diploma education have the smallest earnings of $19,444.
| Educational Attainment | Male Income | Female Income |
| Less than High School | - | - |
| High School Diploma | - | - |
| College or Associate's Degree | $44,258 | $28,542 |
| Bachelor's Degree | $51,324 | $28,864 |
| Graduate Degree | - | - |
| Total | $43,161 | $22,500 |
Family Income in Elberta
Family Income Brackets in Elberta
According to the Elberta family income data, there are 108 families falling into the $50,000 to $74,999 income range, which is the most common income bracket and makes up 24.3% of all families. Conversely, the $150,000 to $199,999 income bracket is the least frequent group with only 6 families (1.3%) belonging to this category.
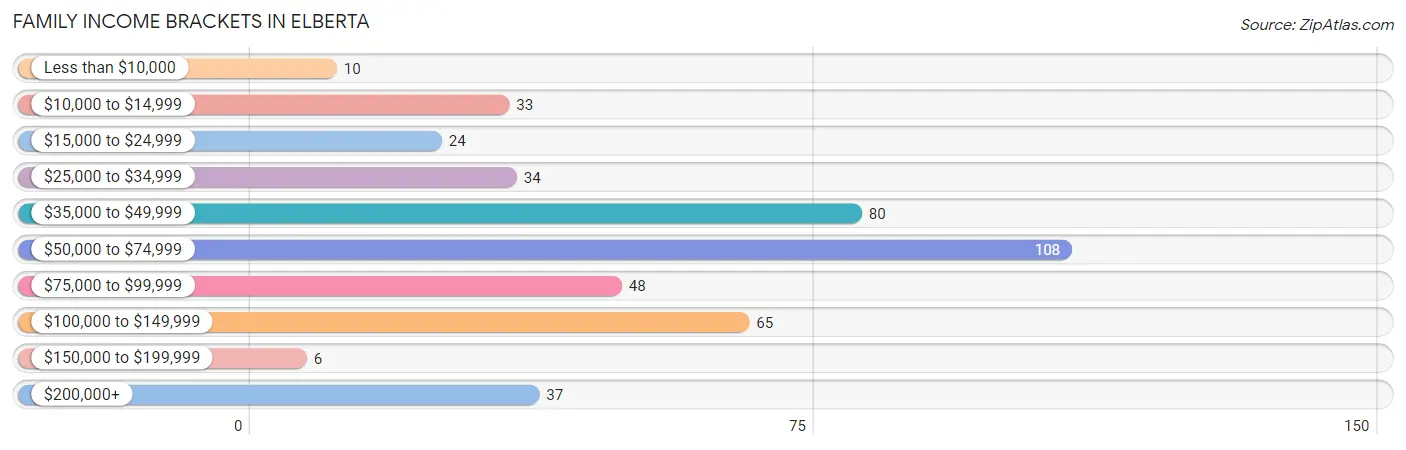
| Income Bracket | # Families | % Families |
| Less than $10,000 | 10 | 2.2% |
| $10,000 to $14,999 | 33 | 7.4% |
| $15,000 to $24,999 | 24 | 5.4% |
| $25,000 to $34,999 | 34 | 7.6% |
| $35,000 to $49,999 | 80 | 18.0% |
| $50,000 to $74,999 | 108 | 24.3% |
| $75,000 to $99,999 | 48 | 10.8% |
| $100,000 to $149,999 | 65 | 14.6% |
| $150,000 to $199,999 | 6 | 1.3% |
| $200,000+ | 37 | 8.3% |
Family Income by Famaliy Size in Elberta
5-person families (34 | 7.6%) account for the highest median family income in Elberta with $69,167 per family, while 2-person families (266 | 59.8%) have the highest median income of $29,038 per family member.
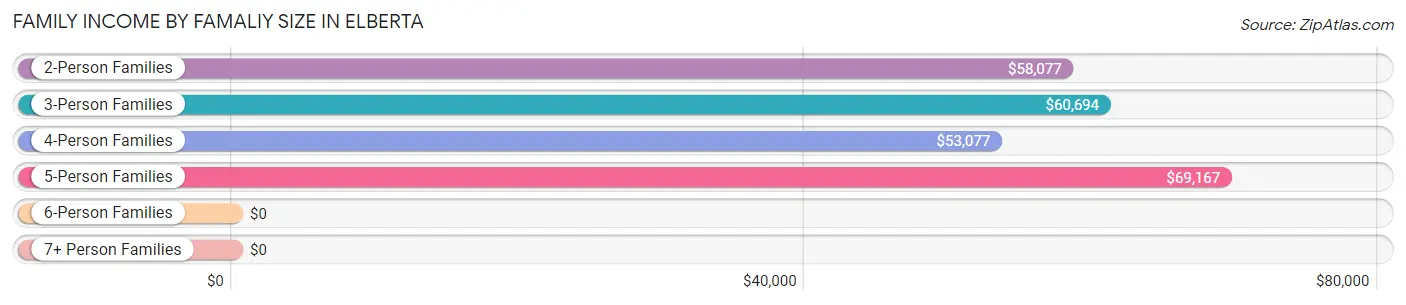
| Income Bracket | # Families | Median Income |
| 2-Person Families | 266 (59.8%) | $58,077 |
| 3-Person Families | 69 (15.5%) | $60,694 |
| 4-Person Families | 76 (17.1%) | $53,077 |
| 5-Person Families | 34 (7.6%) | $69,167 |
| 6-Person Families | 0 (0.0%) | $0 |
| 7+ Person Families | 0 (0.0%) | $0 |
| Total | 445 (100.0%) | $55,625 |
Family Income by Number of Earners in Elberta
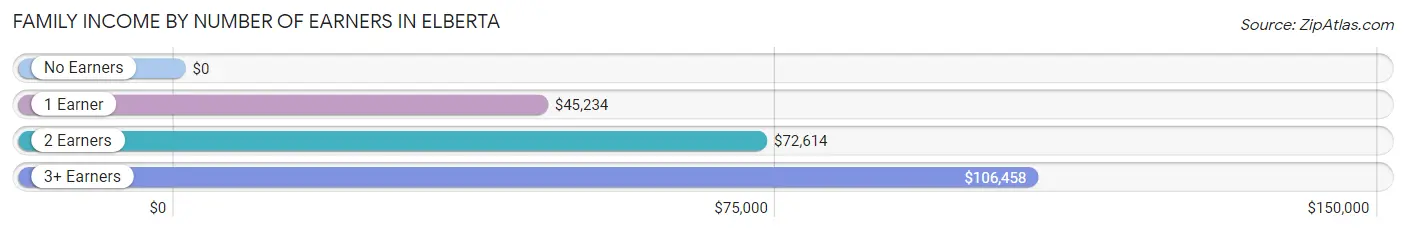
| Number of Earners | # Families | Median Income |
| No Earners | 94 (21.1%) | $0 |
| 1 Earner | 151 (33.9%) | $45,234 |
| 2 Earners | 185 (41.6%) | $72,614 |
| 3+ Earners | 15 (3.4%) | $106,458 |
| Total | 445 (100.0%) | $55,625 |
Household Income in Elberta
Household Income Brackets in Elberta
With 273 households falling in the category, the $50,000 to $74,999 income range is the most frequent in Elberta, accounting for 28.4% of all households. In contrast, only 17 households (1.8%) fall into the $150,000 to $199,999 income bracket, making it the least populous group.
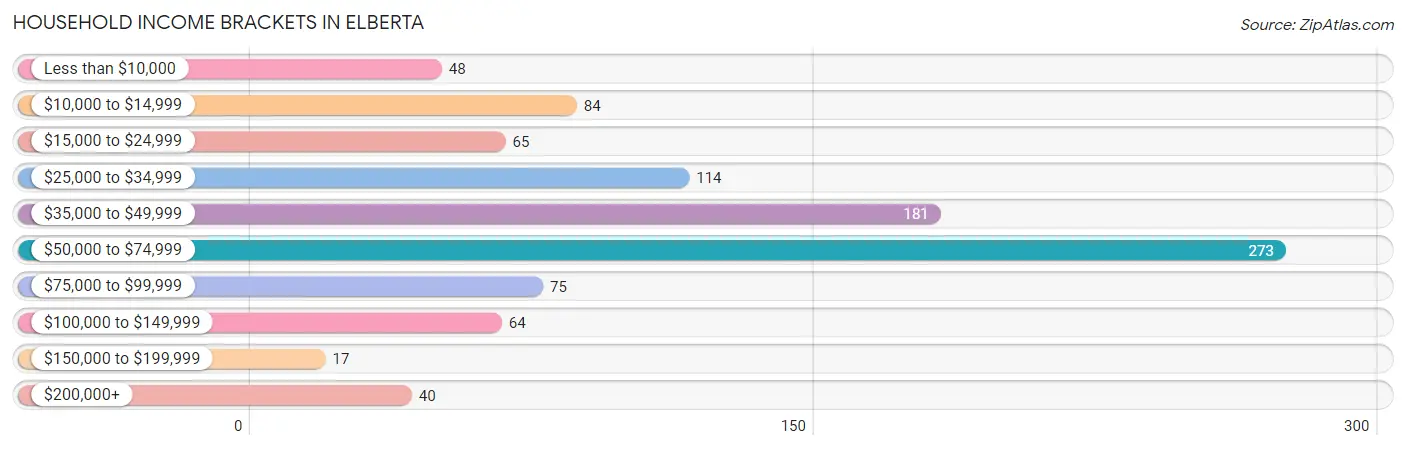
| Income Bracket | # Households | % Households |
| Less than $10,000 | 48 | 5.0% |
| $10,000 to $14,999 | 84 | 8.7% |
| $15,000 to $24,999 | 65 | 6.8% |
| $25,000 to $34,999 | 114 | 11.9% |
| $35,000 to $49,999 | 181 | 18.8% |
| $50,000 to $74,999 | 273 | 28.4% |
| $75,000 to $99,999 | 75 | 7.8% |
| $100,000 to $149,999 | 64 | 6.7% |
| $150,000 to $199,999 | 17 | 1.8% |
| $200,000+ | 40 | 4.2% |
Household Income by Householder Age in Elberta
The median household income in Elberta is $47,452, with the highest median household income of $55,757 found in the 45 to 64 years age bracket for the primary householder. A total of 427 households (44.4%) fall into this category. Meanwhile, the 65+ years age bracket for the primary householder has the lowest median household income of $31,420, with 287 households (29.9%) in this group.
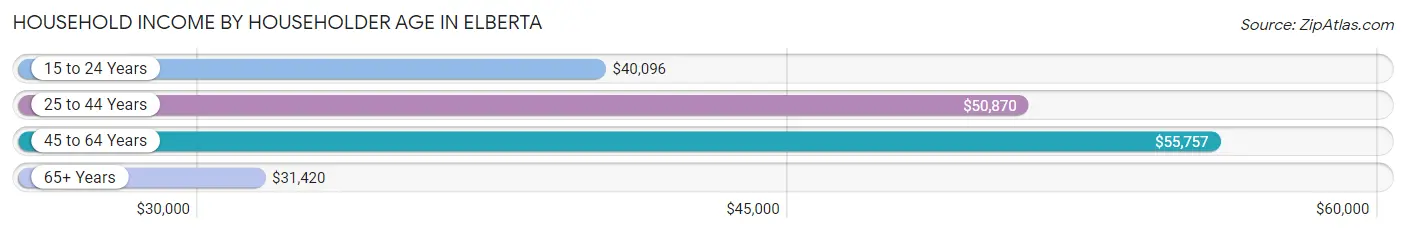
| Income Bracket | # Households | Median Income |
| 15 to 24 Years | 51 (5.3%) | $40,096 |
| 25 to 44 Years | 196 (20.4%) | $50,870 |
| 45 to 64 Years | 427 (44.4%) | $55,757 |
| 65+ Years | 287 (29.9%) | $31,420 |
| Total | 961 (100.0%) | $47,452 |
Poverty in Elberta
Income Below Poverty by Sex and Age in Elberta
With 21.4% poverty level for males and 20.4% for females among the residents of Elberta, 12 to 14 year old males and under 5 year old females are the most vulnerable to poverty, with 9 males (56.2%) and 17 females (50.0%) in their respective age groups living below the poverty level.
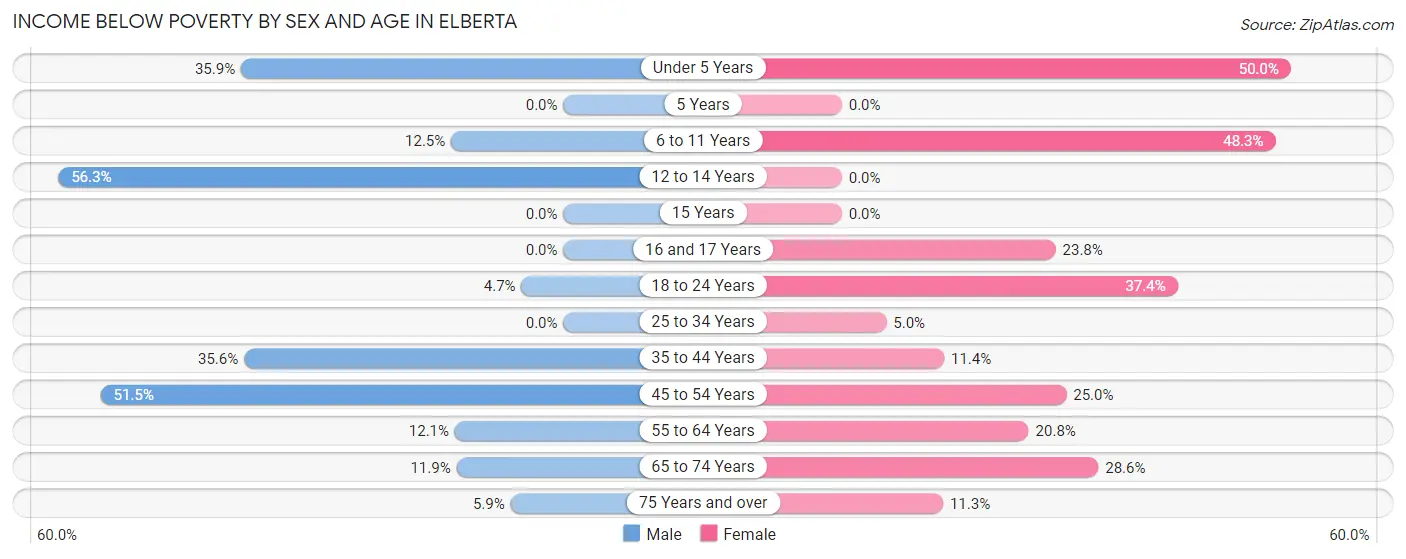
| Age Bracket | Male | Female |
| Under 5 Years | 28 (35.9%) | 17 (50.0%) |
| 5 Years | 0 (0.0%) | 0 (0.0%) |
| 6 to 11 Years | 4 (12.5%) | 14 (48.3%) |
| 12 to 14 Years | 9 (56.2%) | 0 (0.0%) |
| 15 Years | 0 (0.0%) | 0 (0.0%) |
| 16 and 17 Years | 0 (0.0%) | 5 (23.8%) |
| 18 to 24 Years | 7 (4.7%) | 40 (37.4%) |
| 25 to 34 Years | 0 (0.0%) | 6 (5.0%) |
| 35 to 44 Years | 32 (35.6%) | 9 (11.4%) |
| 45 to 54 Years | 117 (51.5%) | 22 (25.0%) |
| 55 to 64 Years | 29 (12.1%) | 36 (20.8%) |
| 65 to 74 Years | 10 (11.9%) | 42 (28.6%) |
| 75 Years and over | 3 (5.9%) | 16 (11.3%) |
| Total | 239 (21.4%) | 207 (20.4%) |
Income Above Poverty by Sex and Age in Elberta
According to the poverty statistics in Elberta, males aged 5 years and females aged 12 to 14 years are the age groups that are most secure financially, with 100.0% of males and 100.0% of females in these age groups living above the poverty line.
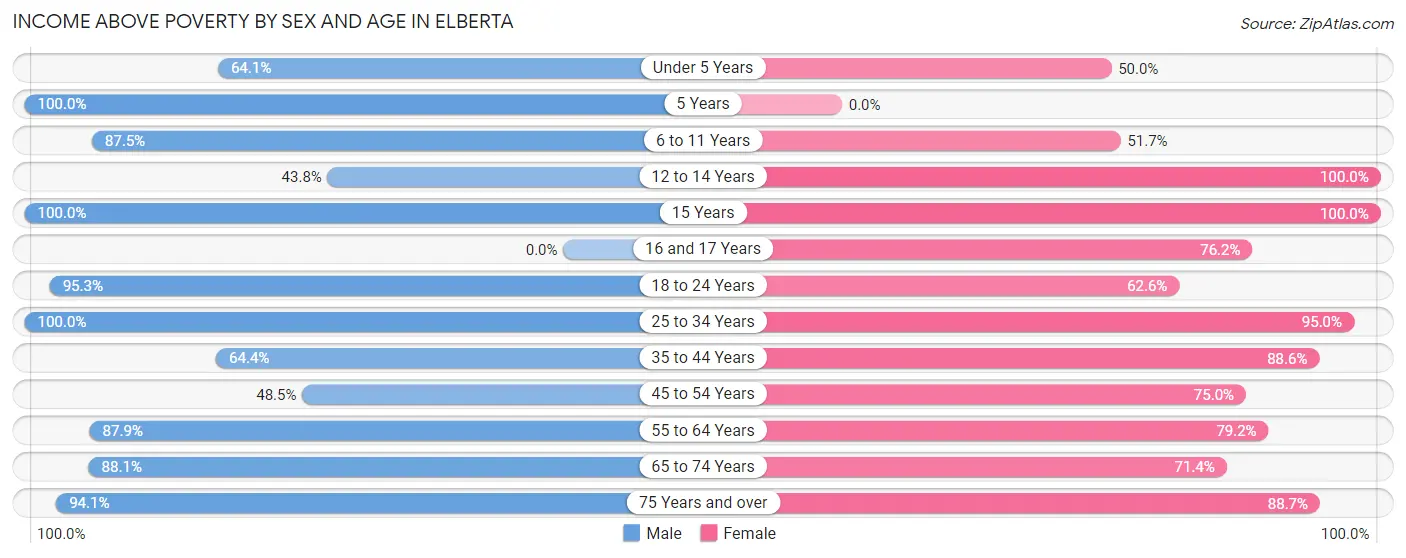
| Age Bracket | Male | Female |
| Under 5 Years | 50 (64.1%) | 17 (50.0%) |
| 5 Years | 2 (100.0%) | 0 (0.0%) |
| 6 to 11 Years | 28 (87.5%) | 15 (51.7%) |
| 12 to 14 Years | 7 (43.8%) | 59 (100.0%) |
| 15 Years | 8 (100.0%) | 12 (100.0%) |
| 16 and 17 Years | 0 (0.0%) | 16 (76.2%) |
| 18 to 24 Years | 143 (95.3%) | 67 (62.6%) |
| 25 to 34 Years | 141 (100.0%) | 115 (95.0%) |
| 35 to 44 Years | 58 (64.4%) | 70 (88.6%) |
| 45 to 54 Years | 110 (48.5%) | 66 (75.0%) |
| 55 to 64 Years | 211 (87.9%) | 137 (79.2%) |
| 65 to 74 Years | 74 (88.1%) | 105 (71.4%) |
| 75 Years and over | 48 (94.1%) | 126 (88.7%) |
| Total | 880 (78.6%) | 805 (79.5%) |
Income Below Poverty Among Married-Couple Families in Elberta
The poverty statistics for married-couple families in Elberta show that 4.3% or 12 of the total 277 families live below the poverty line. Families with 1 or 2 children have the highest poverty rate of 8.4%, comprising of 9 families. On the other hand, families with no children have the lowest poverty rate of 1.8%, which includes 3 families.
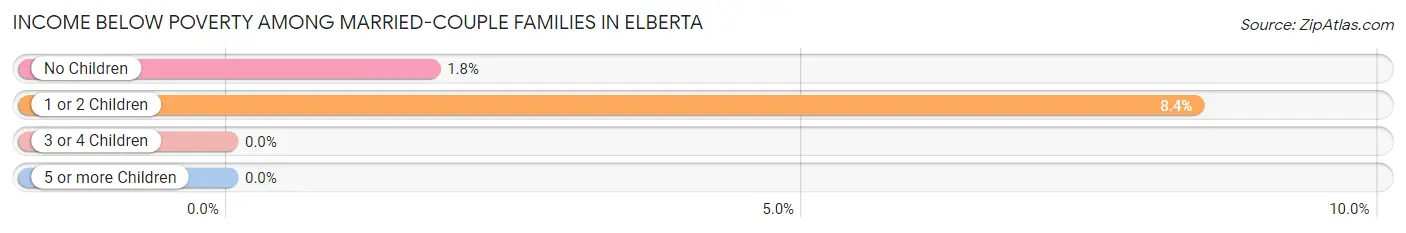
| Children | Above Poverty | Below Poverty |
| No Children | 167 (98.2%) | 3 (1.8%) |
| 1 or 2 Children | 98 (91.6%) | 9 (8.4%) |
| 3 or 4 Children | 0 (0.0%) | 0 (0.0%) |
| 5 or more Children | 0 (0.0%) | 0 (0.0%) |
| Total | 265 (95.7%) | 12 (4.3%) |
Income Below Poverty Among Single-Parent Households in Elberta
According to the poverty data in Elberta, 5.0% or 2 single-father households and 35.2% or 45 single-mother households are living below the poverty line. Among single-father households, those with no children have the highest poverty rate, with 2 households (7.4%) experiencing poverty. Likewise, among single-mother households, those with 1 or 2 children have the highest poverty rate, with 22 households (46.8%) falling below the poverty line.
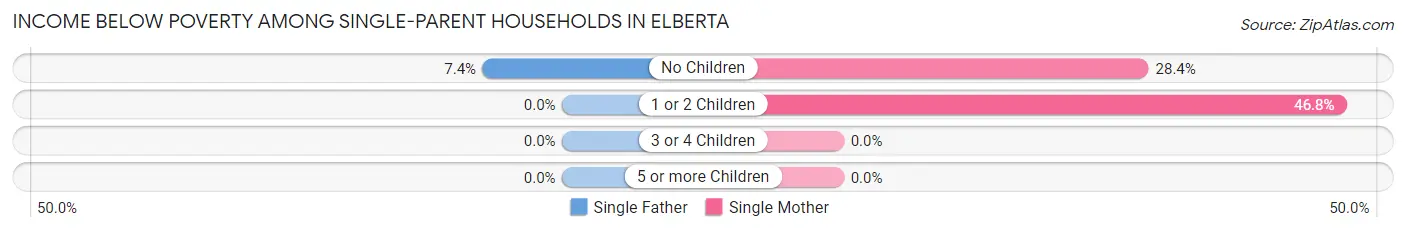
| Children | Single Father | Single Mother |
| No Children | 2 (7.4%) | 23 (28.4%) |
| 1 or 2 Children | 0 (0.0%) | 22 (46.8%) |
| 3 or 4 Children | 0 (0.0%) | 0 (0.0%) |
| 5 or more Children | 0 (0.0%) | 0 (0.0%) |
| Total | 2 (5.0%) | 45 (35.2%) |
Income Below Poverty Among Married-Couple vs Single-Parent Households in Elberta
The poverty data for Elberta shows that 12 of the married-couple family households (4.3%) and 47 of the single-parent households (28.0%) are living below the poverty level. Within the married-couple family households, those with 1 or 2 children have the highest poverty rate, with 9 households (8.4%) falling below the poverty line. Among the single-parent households, those with 1 or 2 children have the highest poverty rate, with 22 household (36.7%) living below poverty.
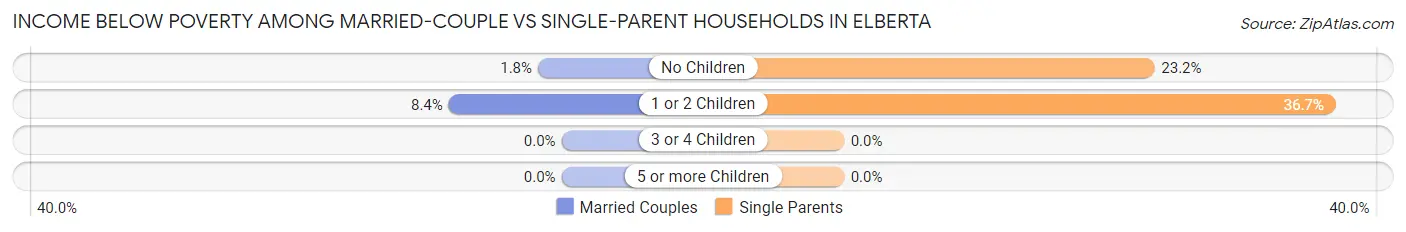
| Children | Married-Couple Families | Single-Parent Households |
| No Children | 3 (1.8%) | 25 (23.2%) |
| 1 or 2 Children | 9 (8.4%) | 22 (36.7%) |
| 3 or 4 Children | 0 (0.0%) | 0 (0.0%) |
| 5 or more Children | 0 (0.0%) | 0 (0.0%) |
| Total | 12 (4.3%) | 47 (28.0%) |
Race in Elberta
The most populous races in Elberta are White / Caucasian (1,930 | 90.2%), Two or more Races (191 | 8.9%), and Hispanic or Latino (109 | 5.1%).
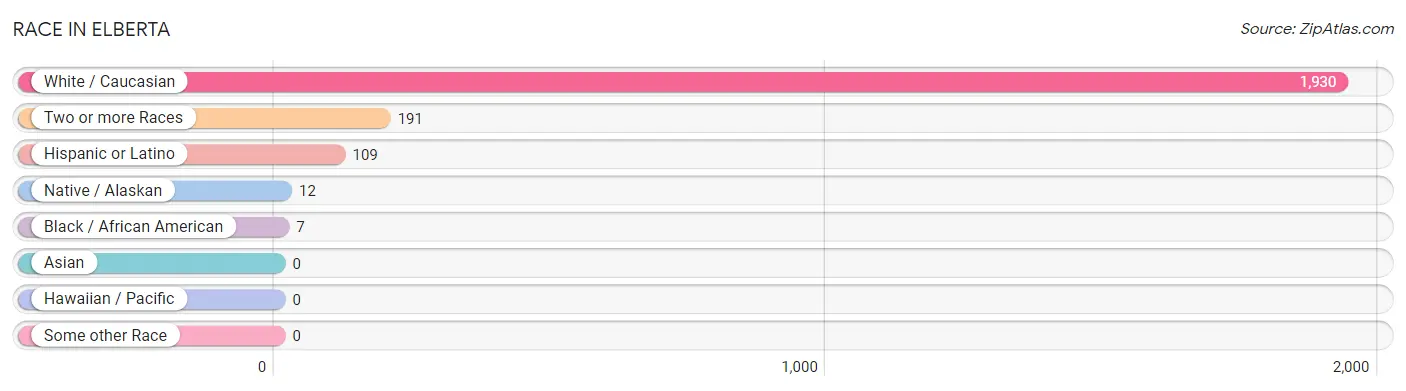
| Race | # Population | % Population |
| Asian | 0 | 0.0% |
| Black / African American | 7 | 0.3% |
| Hawaiian / Pacific | 0 | 0.0% |
| Hispanic or Latino | 109 | 5.1% |
| Native / Alaskan | 12 | 0.6% |
| White / Caucasian | 1,930 | 90.2% |
| Two or more Races | 191 | 8.9% |
| Some other Race | 0 | 0.0% |
| Total | 2,140 | 100.0% |
Ancestry in Elberta
The most populous ancestries reported in Elberta are American (579 | 27.1%), English (268 | 12.5%), German (264 | 12.3%), Irish (180 | 8.4%), and Central American (88 | 4.1%), together accounting for 64.4% of all Elberta residents.
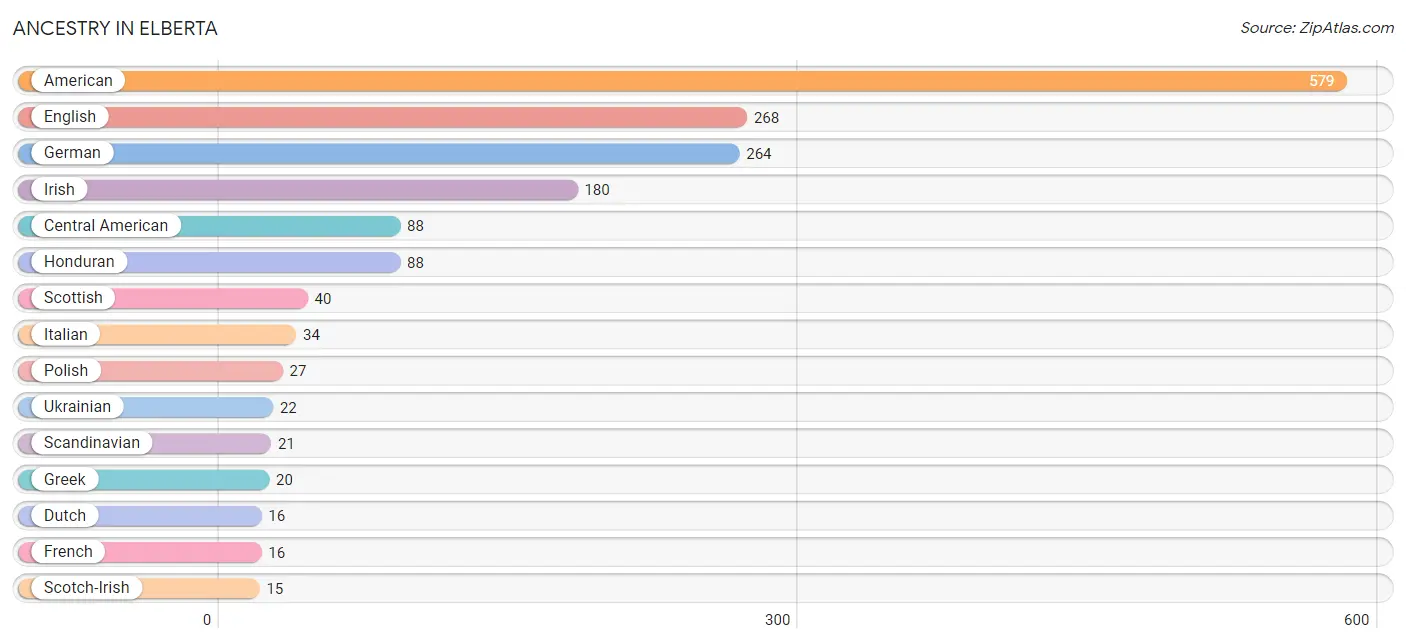
| Ancestry | # Population | % Population |
| American | 579 | 27.1% |
| Arab | 11 | 0.5% |
| Cajun | 3 | 0.1% |
| Central American | 88 | 4.1% |
| Cherokee | 8 | 0.4% |
| Choctaw | 3 | 0.1% |
| Creek | 1 | 0.1% |
| Danish | 14 | 0.6% |
| Dutch | 16 | 0.7% |
| English | 268 | 12.5% |
| European | 4 | 0.2% |
| French | 16 | 0.7% |
| German | 264 | 12.3% |
| Greek | 20 | 0.9% |
| Honduran | 88 | 4.1% |
| Hungarian | 4 | 0.2% |
| Irish | 180 | 8.4% |
| Italian | 34 | 1.6% |
| Lebanese | 11 | 0.5% |
| Mexican | 7 | 0.3% |
| Northern European | 4 | 0.2% |
| Norwegian | 2 | 0.1% |
| Polish | 27 | 1.3% |
| Puerto Rican | 14 | 0.6% |
| Scandinavian | 21 | 1.0% |
| Scotch-Irish | 15 | 0.7% |
| Scottish | 40 | 1.9% |
| Slavic | 3 | 0.1% |
| Swedish | 12 | 0.6% |
| Ukrainian | 22 | 1.0% |
| Welsh | 15 | 0.7% | View All 31 Rows |
Immigrants in Elberta
The most numerous immigrant groups reported in Elberta came from Central America (72 | 3.4%), Honduras (72 | 3.4%), Latin America (72 | 3.4%), Europe (28 | 1.3%), and Eastern Europe (22 | 1.0%), together accounting for 12.4% of all Elberta residents.
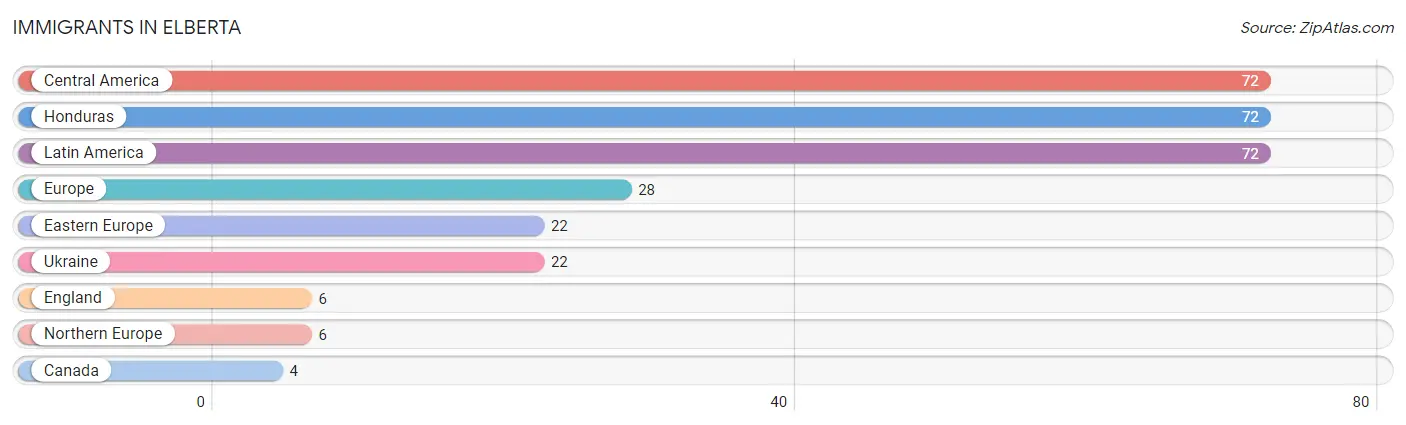
| Immigration Origin | # Population | % Population |
| Canada | 4 | 0.2% |
| Central America | 72 | 3.4% |
| Eastern Europe | 22 | 1.0% |
| England | 6 | 0.3% |
| Europe | 28 | 1.3% |
| Honduras | 72 | 3.4% |
| Latin America | 72 | 3.4% |
| Northern Europe | 6 | 0.3% |
| Ukraine | 22 | 1.0% | View All 9 Rows |
Sex and Age in Elberta
Sex and Age in Elberta
The most populous age groups in Elberta are 60 to 64 Years (164 | 14.7%) for men and 65 to 69 Years (99 | 9.7%) for women.
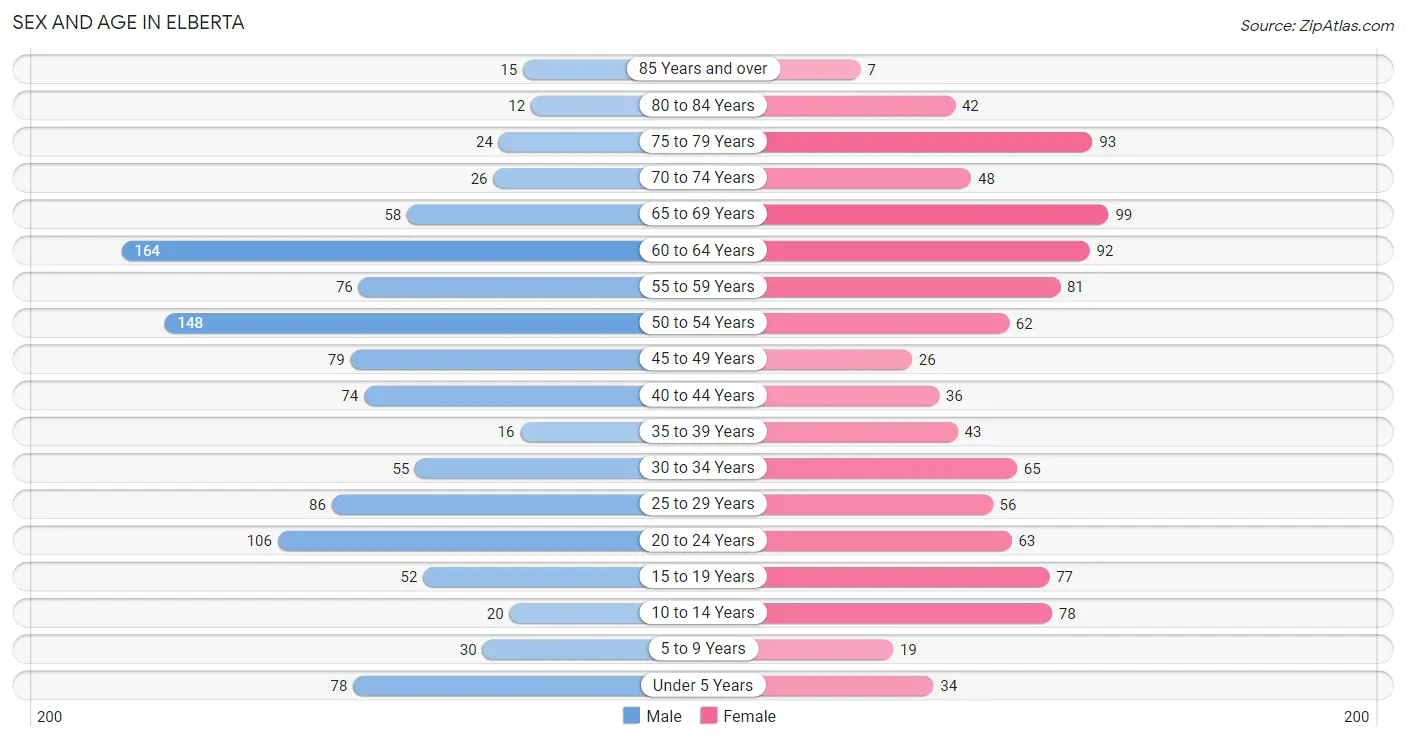
| Age Bracket | Male | Female |
| Under 5 Years | 78 (7.0%) | 34 (3.3%) |
| 5 to 9 Years | 30 (2.7%) | 19 (1.9%) |
| 10 to 14 Years | 20 (1.8%) | 78 (7.6%) |
| 15 to 19 Years | 52 (4.6%) | 77 (7.5%) |
| 20 to 24 Years | 106 (9.5%) | 63 (6.2%) |
| 25 to 29 Years | 86 (7.7%) | 56 (5.5%) |
| 30 to 34 Years | 55 (4.9%) | 65 (6.4%) |
| 35 to 39 Years | 16 (1.4%) | 43 (4.2%) |
| 40 to 44 Years | 74 (6.6%) | 36 (3.5%) |
| 45 to 49 Years | 79 (7.1%) | 26 (2.5%) |
| 50 to 54 Years | 148 (13.2%) | 62 (6.1%) |
| 55 to 59 Years | 76 (6.8%) | 81 (7.9%) |
| 60 to 64 Years | 164 (14.7%) | 92 (9.0%) |
| 65 to 69 Years | 58 (5.2%) | 99 (9.7%) |
| 70 to 74 Years | 26 (2.3%) | 48 (4.7%) |
| 75 to 79 Years | 24 (2.1%) | 93 (9.1%) |
| 80 to 84 Years | 12 (1.1%) | 42 (4.1%) |
| 85 Years and over | 15 (1.3%) | 7 (0.7%) |
| Total | 1,119 (100.0%) | 1,021 (100.0%) |
Families and Households in Elberta
Median Family Size in Elberta
The median family size in Elberta is 3.16 persons per family, with single male/father families (40 | 9.0%) accounting for the largest median family size of 4.25 persons per family. On the other hand, single female/mother families (128 | 28.8%) represent the smallest median family size with 3.04 persons per family.
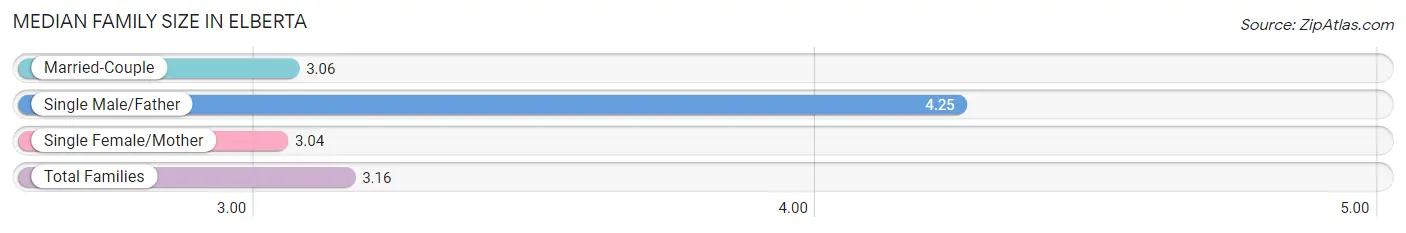
| Family Type | # Families | Family Size |
| Married-Couple | 277 (62.3%) | 3.06 |
| Single Male/Father | 40 (9.0%) | 4.25 |
| Single Female/Mother | 128 (28.8%) | 3.04 |
| Total Families | 445 (100.0%) | 3.16 |
Median Household Size in Elberta
The median household size in Elberta is 2.23 persons per household, with single male/father households (40 | 4.2%) accounting for the largest median household size of 4.78 persons per household. non-family households (516 | 53.7%) represent the smallest median household size with 1.32 persons per household.
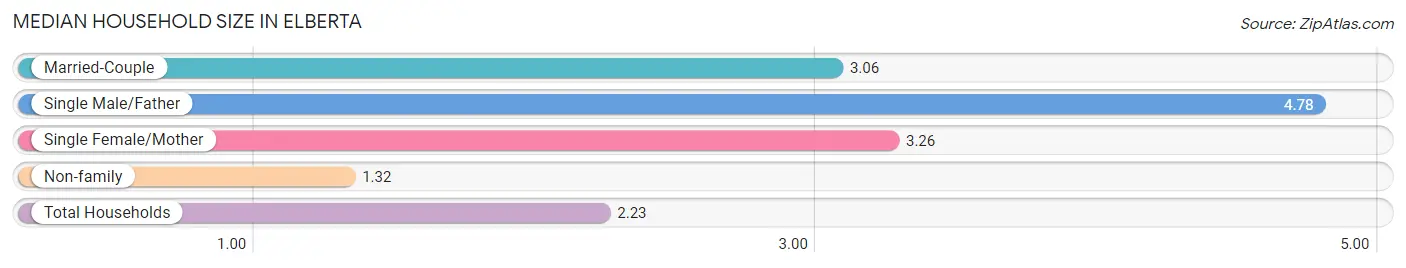
| Household Type | # Households | Household Size |
| Married-Couple | 277 (28.8%) | 3.06 |
| Single Male/Father | 40 (4.2%) | 4.78 |
| Single Female/Mother | 128 (13.3%) | 3.26 |
| Non-family | 516 (53.7%) | 1.32 |
| Total Households | 961 (100.0%) | 2.23 |
Household Size by Marriage Status in Elberta
Out of a total of 961 households in Elberta, 445 (46.3%) are family households, while 516 (53.7%) are nonfamily households. The most numerous type of family households are 2-person households, comprising 242, and the most common type of nonfamily households are 1-person households, comprising 346.
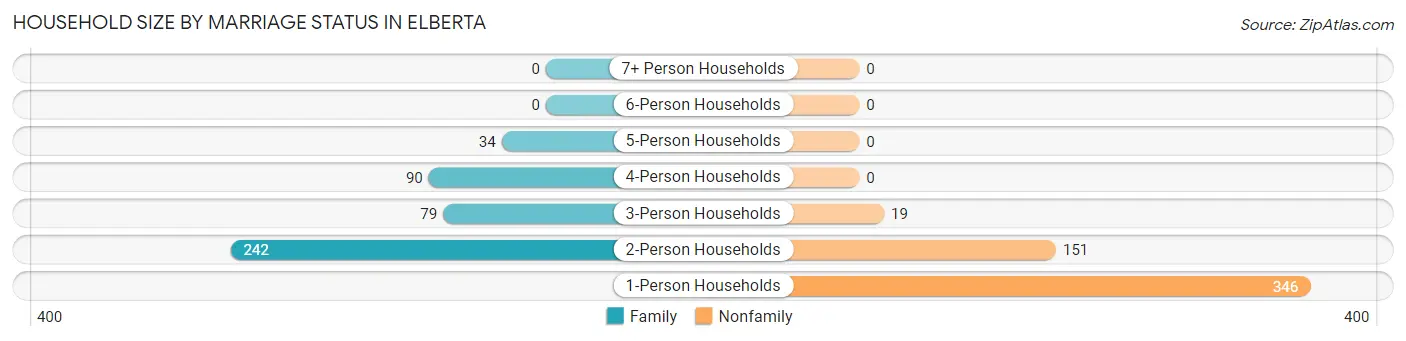
| Household Size | Family Households | Nonfamily Households |
| 1-Person Households | - | 346 (36.0%) |
| 2-Person Households | 242 (25.2%) | 151 (15.7%) |
| 3-Person Households | 79 (8.2%) | 19 (2.0%) |
| 4-Person Households | 90 (9.4%) | 0 (0.0%) |
| 5-Person Households | 34 (3.5%) | 0 (0.0%) |
| 6-Person Households | 0 (0.0%) | 0 (0.0%) |
| 7+ Person Households | 0 (0.0%) | 0 (0.0%) |
| Total | 445 (46.3%) | 516 (53.7%) |
Female Fertility in Elberta
Fertility by Age in Elberta
Average fertility rate in Elberta is 81.0 births per 1,000 women. Women in the age bracket of 20 to 34 years have the highest fertility rate with 174.0 births per 1,000 women. Women in the age bracket of 20 to 34 years acount for 100.0% of all women with births.
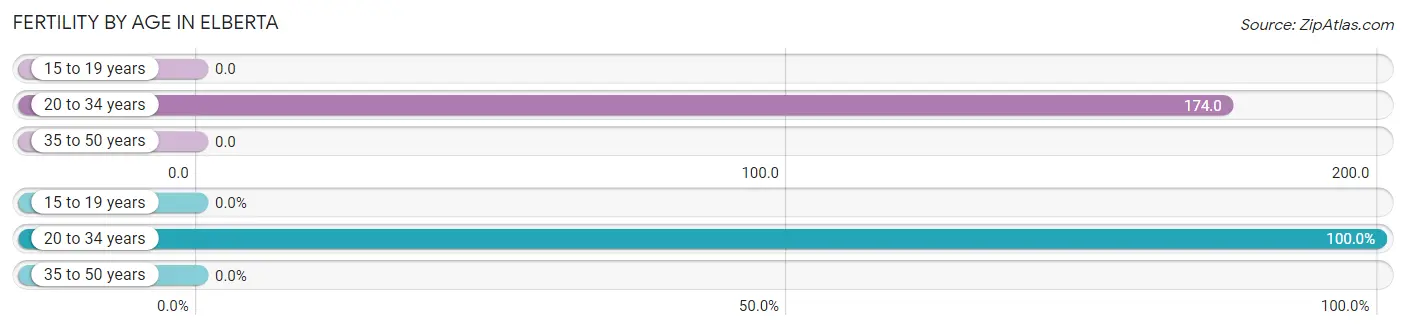
| Age Bracket | Women with Births | Births / 1,000 Women |
| 15 to 19 years | 0 (0.0%) | 0.0 |
| 20 to 34 years | 32 (100.0%) | 174.0 |
| 35 to 50 years | 0 (0.0%) | 0.0 |
| Total | 32 (100.0%) | 81.0 |
Fertility by Age by Marriage Status in Elberta
28.1% of women with births (32) in Elberta are married. The highest percentage of unmarried women with births falls into 20 to 34 years age bracket with 71.9% of them unmarried at the time of birth, while the lowest percentage of unmarried women with births belong to 20 to 34 years age bracket with 71.9% of them unmarried.
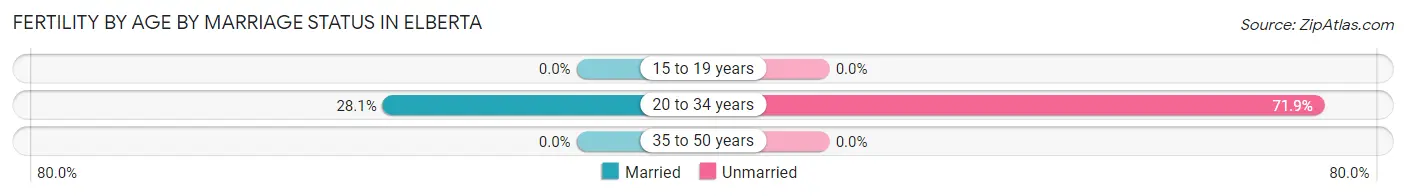
| Age Bracket | Married | Unmarried |
| 15 to 19 years | 0 (0.0%) | 0 (0.0%) |
| 20 to 34 years | 9 (28.1%) | 23 (71.9%) |
| 35 to 50 years | 0 (0.0%) | 0 (0.0%) |
| Total | 9 (28.1%) | 23 (71.9%) |
Fertility by Education in Elberta
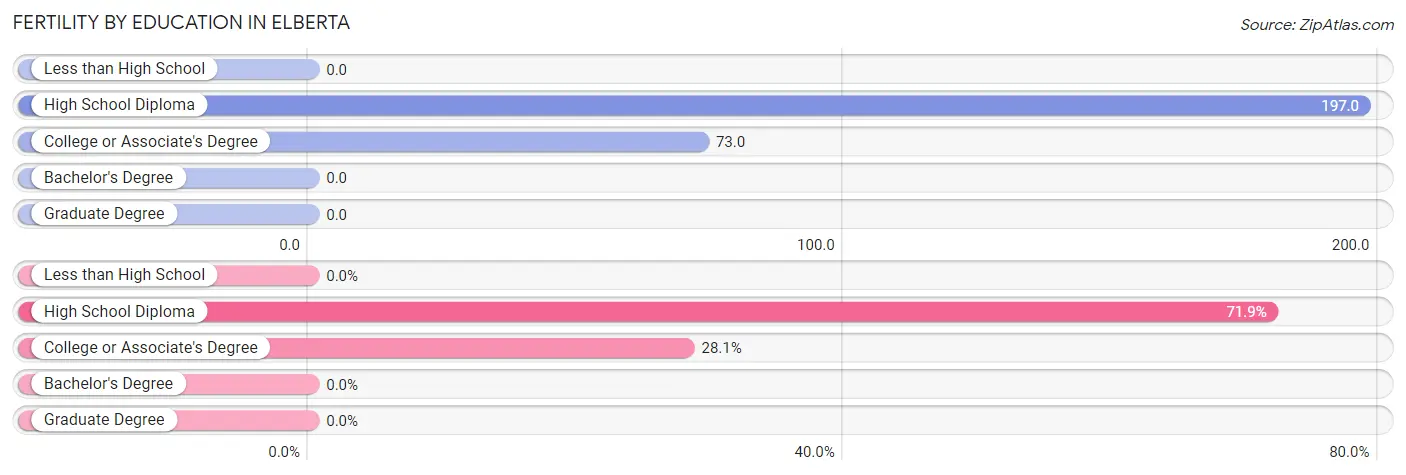
| Educational Attainment | Women with Births | Births / 1,000 Women |
| Less than High School | 0 (0.0%) | 0.0 |
| High School Diploma | 23 (71.9%) | 197.0 |
| College or Associate's Degree | 9 (28.1%) | 73.0 |
| Bachelor's Degree | 0 (0.0%) | 0.0 |
| Graduate Degree | 0 (0.0%) | 0.0 |
| Total | 32 (100.0%) | 81.0 |
Fertility by Education by Marriage Status in Elberta
71.9% of women with births in Elberta are unmarried. Women with the educational attainment of college or associate's degree are most likely to be married with 100.0% of them married at childbirth, while women with the educational attainment of high school diploma are least likely to be married with 100.0% of them unmarried at childbirth.
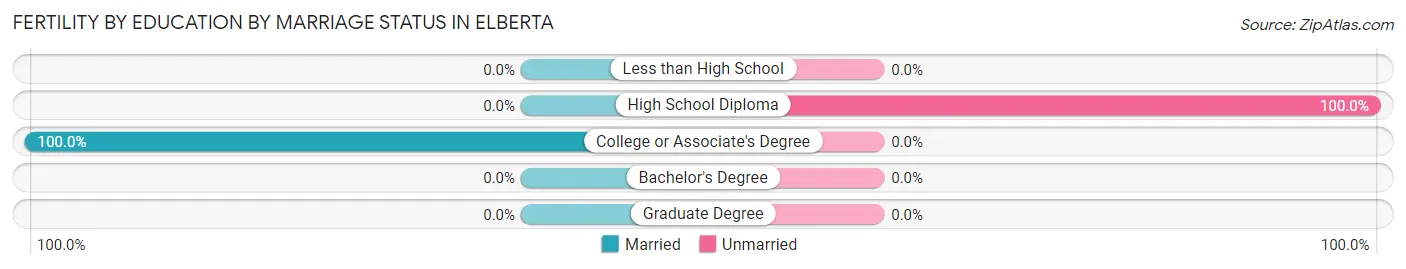
| Educational Attainment | Married | Unmarried |
| Less than High School | 0 (0.0%) | 0 (0.0%) |
| High School Diploma | 0 (0.0%) | 23 (100.0%) |
| College or Associate's Degree | 9 (100.0%) | 0 (0.0%) |
| Bachelor's Degree | 0 (0.0%) | 0 (0.0%) |
| Graduate Degree | 0 (0.0%) | 0 (0.0%) |
| Total | 9 (28.1%) | 23 (71.9%) |
Employment Characteristics in Elberta
Employment by Class of Employer in Elberta
Among the 1,056 employed individuals in Elberta, private company employees (847 | 80.2%), local government employees (64 | 6.1%), and self-employed (incorporated) (55 | 5.2%) make up the most common classes of employment.
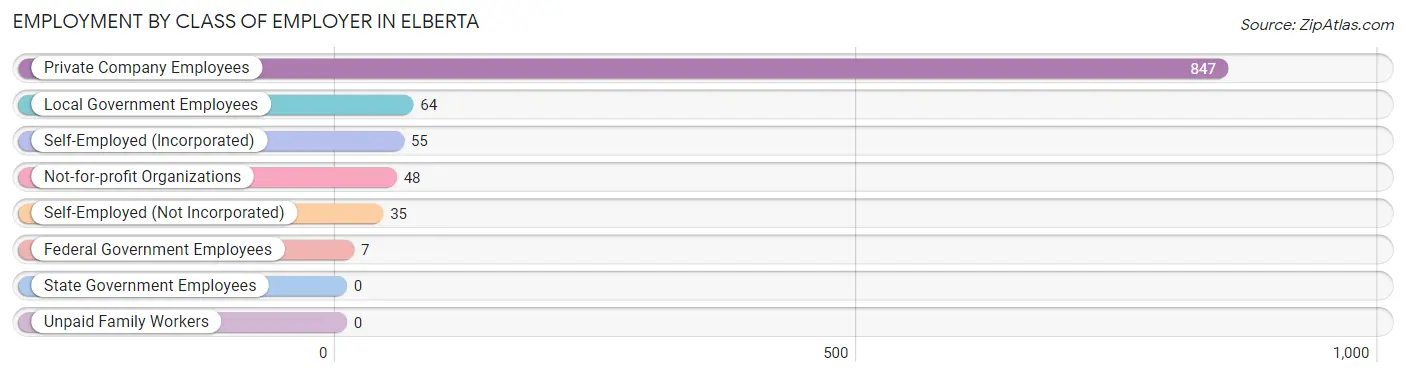
| Employer Class | # Employees | % Employees |
| Private Company Employees | 847 | 80.2% |
| Self-Employed (Incorporated) | 55 | 5.2% |
| Self-Employed (Not Incorporated) | 35 | 3.3% |
| Not-for-profit Organizations | 48 | 4.5% |
| Local Government Employees | 64 | 6.1% |
| State Government Employees | 0 | 0.0% |
| Federal Government Employees | 7 | 0.7% |
| Unpaid Family Workers | 0 | 0.0% |
| Total | 1,056 | 100.0% |
Employment Status by Age in Elberta
According to the labor force statistics for Elberta, out of the total population over 16 years of age (1,861), 59.8% or 1,113 individuals are in the labor force, with 4.2% or 47 of them unemployed. The age group with the highest labor force participation rate is 45 to 54 years, with 81.3% or 256 individuals in the labor force. Within the labor force, the 35 to 44 years age range has the highest percentage of unemployed individuals, with 19.4% or 26 of them being unemployed.
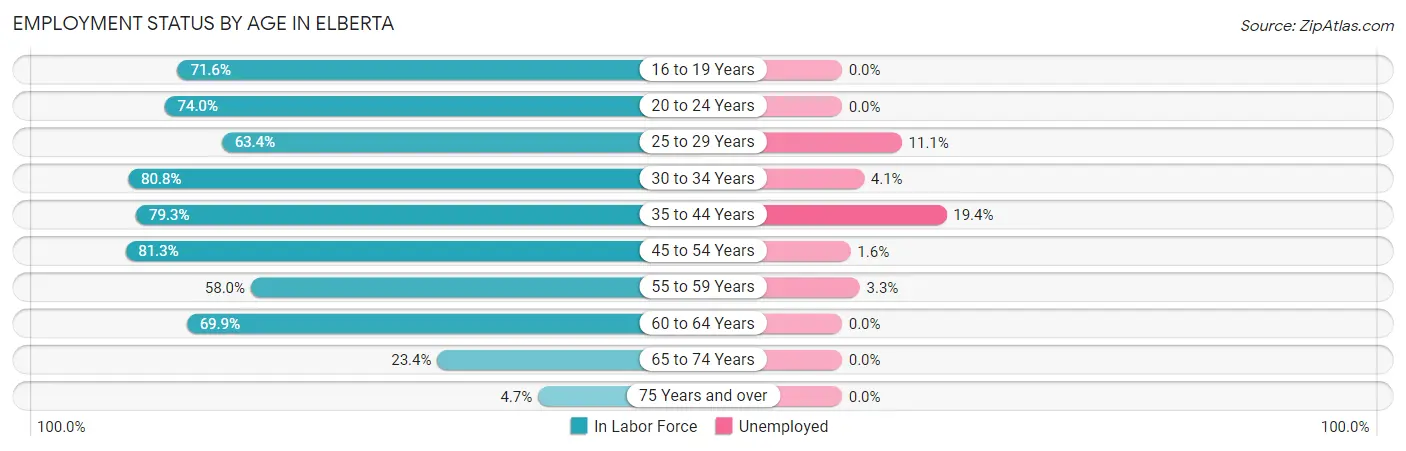
| Age Bracket | In Labor Force | Unemployed |
| 16 to 19 Years | 78 (71.6%) | 0 (0.0%) |
| 20 to 24 Years | 125 (74.0%) | 0 (0.0%) |
| 25 to 29 Years | 90 (63.4%) | 10 (11.1%) |
| 30 to 34 Years | 97 (80.8%) | 4 (4.1%) |
| 35 to 44 Years | 134 (79.3%) | 26 (19.4%) |
| 45 to 54 Years | 256 (81.3%) | 4 (1.6%) |
| 55 to 59 Years | 91 (58.0%) | 3 (3.3%) |
| 60 to 64 Years | 179 (69.9%) | 0 (0.0%) |
| 65 to 74 Years | 54 (23.4%) | 0 (0.0%) |
| 75 Years and over | 9 (4.7%) | 0 (0.0%) |
| Total | 1,113 (59.8%) | 47 (4.2%) |
Employment Status by Educational Attainment in Elberta
According to labor force statistics for Elberta, 73.1% of individuals (847) out of the total population between 25 and 64 years of age (1,159) are in the labor force, with 5.5% or 47 of them being unemployed. The group with the highest labor force participation rate are those with the educational attainment of bachelor's degree or higher, with 86.2% or 169 individuals in the labor force. Within the labor force, individuals with high school diploma education have the highest percentage of unemployment, with 11.2% or 38 of them being unemployed.
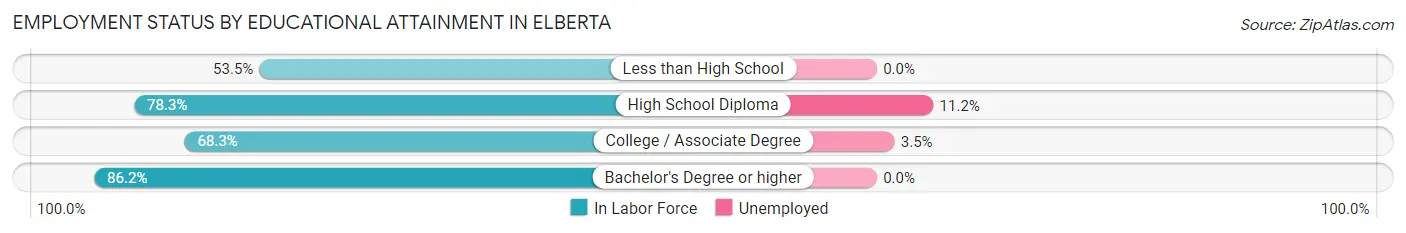
| Educational Attainment | In Labor Force | Unemployed |
| Less than High School | 83 (53.5%) | 0 (0.0%) |
| High School Diploma | 339 (78.3%) | 48 (11.2%) |
| College / Associate Degree | 256 (68.3%) | 13 (3.5%) |
| Bachelor's Degree or higher | 169 (86.2%) | 0 (0.0%) |
| Total | 847 (73.1%) | 64 (5.5%) |
Employment Occupations by Sex in Elberta
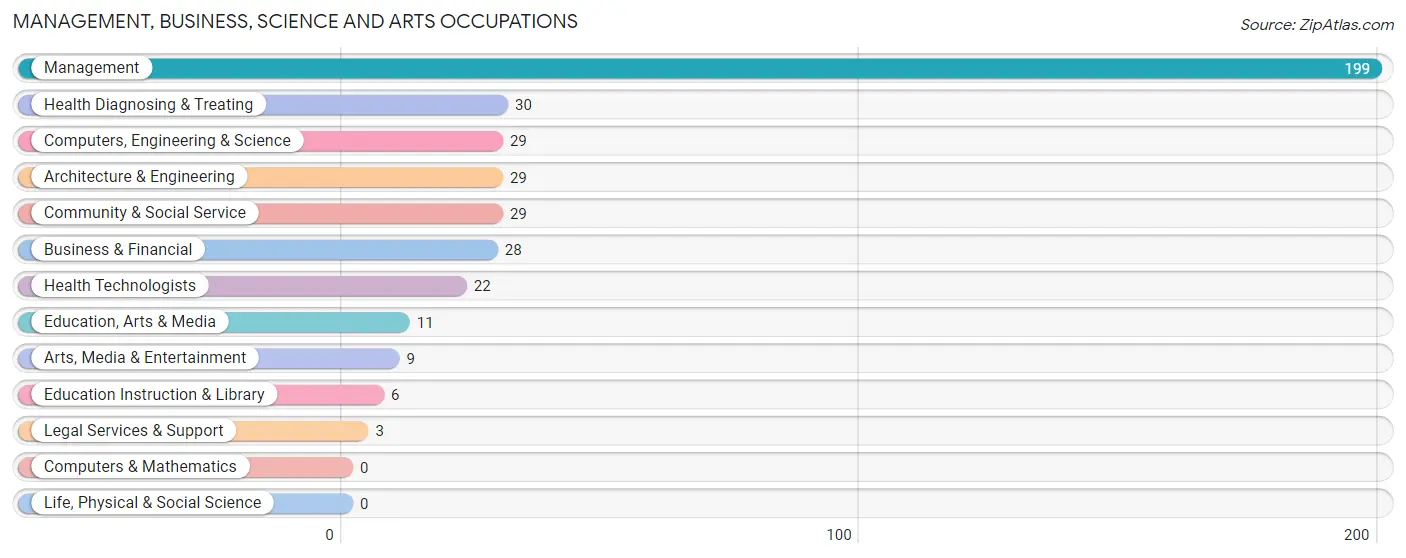
Management, Business, Science and Arts Occupations
The most common Management, Business, Science and Arts occupations in Elberta are Management (199 | 18.7%), Health Diagnosing & Treating (30 | 2.8%), Computers, Engineering & Science (29 | 2.7%), Architecture & Engineering (29 | 2.7%), and Community & Social Service (29 | 2.7%).
Management, Business, Science and Arts Occupations by Sex
Within the Management, Business, Science and Arts occupations in Elberta, the most male-oriented occupations are Computers, Engineering & Science (100.0%), Architecture & Engineering (100.0%), and Management (84.4%), while the most female-oriented occupations are Education, Arts & Media (100.0%), Legal Services & Support (100.0%), and Arts, Media & Entertainment (100.0%).
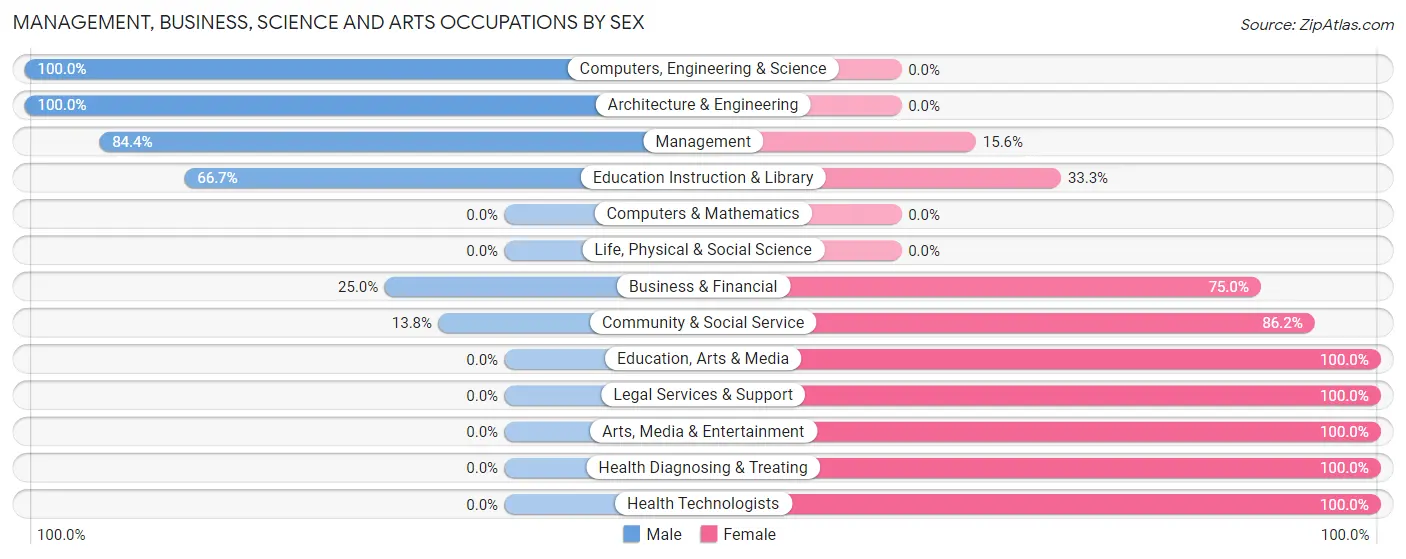
| Occupation | Male | Female |
| Management | 168 (84.4%) | 31 (15.6%) |
| Business & Financial | 7 (25.0%) | 21 (75.0%) |
| Computers, Engineering & Science | 29 (100.0%) | 0 (0.0%) |
| Computers & Mathematics | 0 (0.0%) | 0 (0.0%) |
| Architecture & Engineering | 29 (100.0%) | 0 (0.0%) |
| Life, Physical & Social Science | 0 (0.0%) | 0 (0.0%) |
| Community & Social Service | 4 (13.8%) | 25 (86.2%) |
| Education, Arts & Media | 0 (0.0%) | 11 (100.0%) |
| Legal Services & Support | 0 (0.0%) | 3 (100.0%) |
| Education Instruction & Library | 4 (66.7%) | 2 (33.3%) |
| Arts, Media & Entertainment | 0 (0.0%) | 9 (100.0%) |
| Health Diagnosing & Treating | 0 (0.0%) | 30 (100.0%) |
| Health Technologists | 0 (0.0%) | 22 (100.0%) |
| Total (Category) | 208 (66.0%) | 107 (34.0%) |
| Total (Overall) | 685 (64.3%) | 381 (35.7%) |
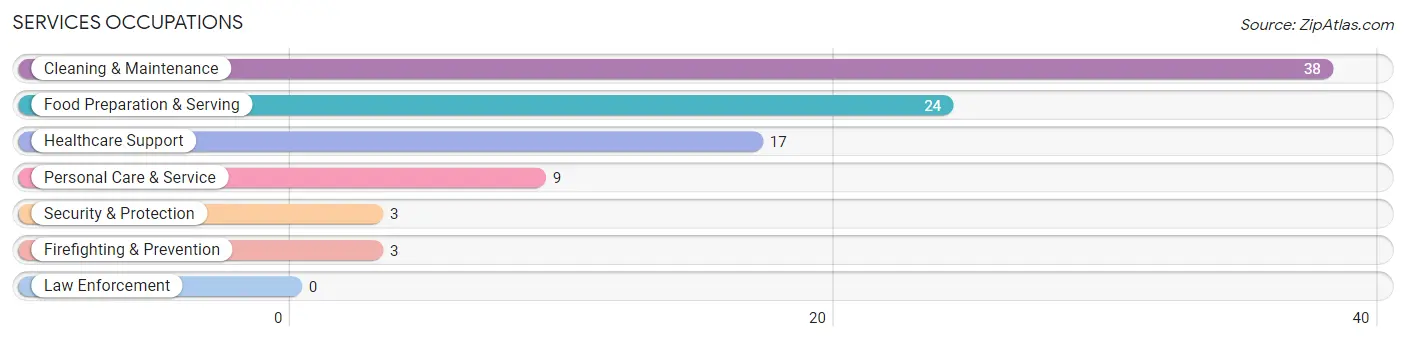
Services Occupations
The most common Services occupations in Elberta are Cleaning & Maintenance (38 | 3.6%), Food Preparation & Serving (24 | 2.2%), Healthcare Support (17 | 1.6%), Personal Care & Service (9 | 0.8%), and Security & Protection (3 | 0.3%).
Services Occupations by Sex
Within the Services occupations in Elberta, the most male-oriented occupations are Security & Protection (100.0%), Firefighting & Prevention (100.0%), and Cleaning & Maintenance (78.9%), while the most female-oriented occupations are Healthcare Support (100.0%), Food Preparation & Serving (100.0%), and Personal Care & Service (100.0%).
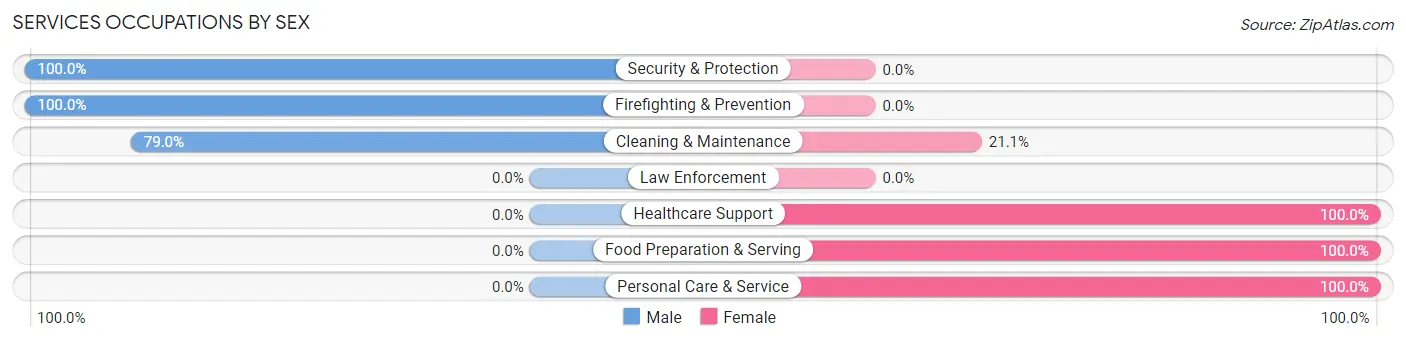
| Occupation | Male | Female |
| Healthcare Support | 0 (0.0%) | 17 (100.0%) |
| Security & Protection | 3 (100.0%) | 0 (0.0%) |
| Firefighting & Prevention | 3 (100.0%) | 0 (0.0%) |
| Law Enforcement | 0 (0.0%) | 0 (0.0%) |
| Food Preparation & Serving | 0 (0.0%) | 24 (100.0%) |
| Cleaning & Maintenance | 30 (78.9%) | 8 (21.0%) |
| Personal Care & Service | 0 (0.0%) | 9 (100.0%) |
| Total (Category) | 33 (36.3%) | 58 (63.7%) |
| Total (Overall) | 685 (64.3%) | 381 (35.7%) |
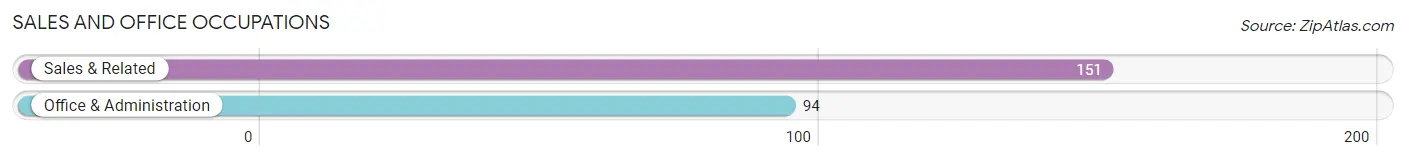
Sales and Office Occupations
The most common Sales and Office occupations in Elberta are Sales & Related (151 | 14.2%), and Office & Administration (94 | 8.8%).
Sales and Office Occupations by Sex
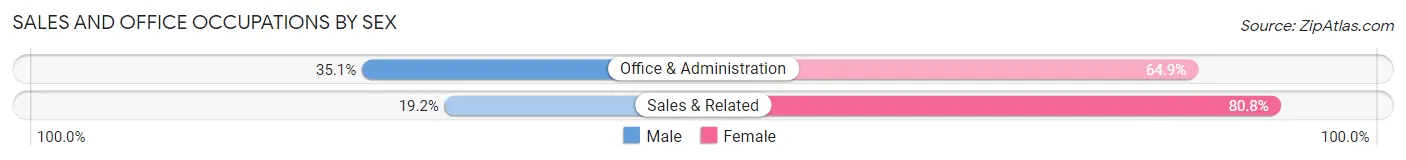
| Occupation | Male | Female |
| Sales & Related | 29 (19.2%) | 122 (80.8%) |
| Office & Administration | 33 (35.1%) | 61 (64.9%) |
| Total (Category) | 62 (25.3%) | 183 (74.7%) |
| Total (Overall) | 685 (64.3%) | 381 (35.7%) |
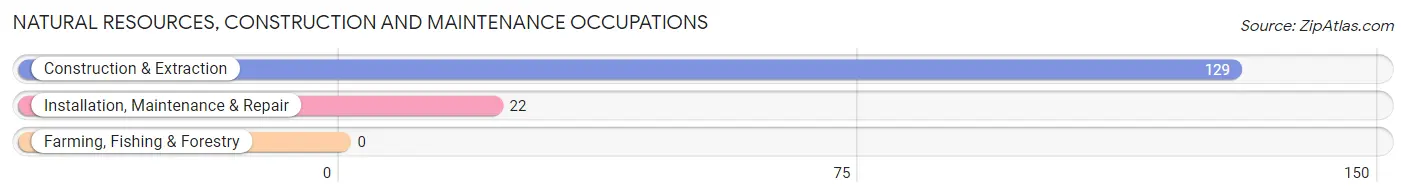
Natural Resources, Construction and Maintenance Occupations
The most common Natural Resources, Construction and Maintenance occupations in Elberta are Construction & Extraction (129 | 12.1%), and Installation, Maintenance & Repair (22 | 2.1%).
Natural Resources, Construction and Maintenance Occupations by Sex
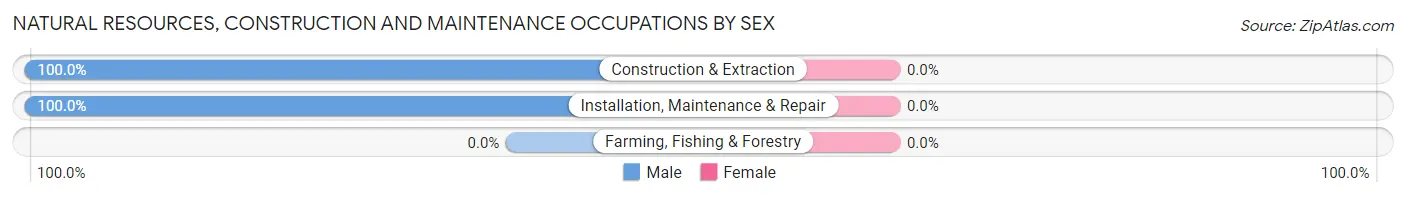
| Occupation | Male | Female |
| Farming, Fishing & Forestry | 0 (0.0%) | 0 (0.0%) |
| Construction & Extraction | 129 (100.0%) | 0 (0.0%) |
| Installation, Maintenance & Repair | 22 (100.0%) | 0 (0.0%) |
| Total (Category) | 151 (100.0%) | 0 (0.0%) |
| Total (Overall) | 685 (64.3%) | 381 (35.7%) |
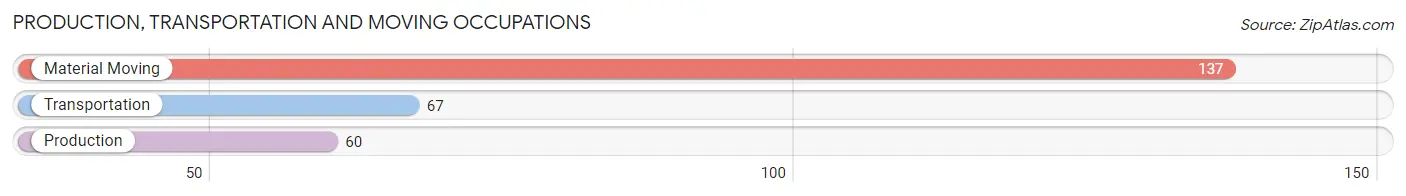
Production, Transportation and Moving Occupations
The most common Production, Transportation and Moving occupations in Elberta are Material Moving (137 | 12.9%), Transportation (67 | 6.3%), and Production (60 | 5.6%).
Production, Transportation and Moving Occupations by Sex
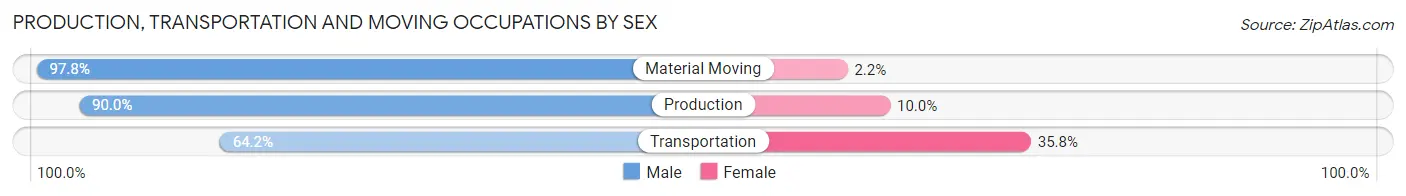
| Occupation | Male | Female |
| Production | 54 (90.0%) | 6 (10.0%) |
| Transportation | 43 (64.2%) | 24 (35.8%) |
| Material Moving | 134 (97.8%) | 3 (2.2%) |
| Total (Category) | 231 (87.5%) | 33 (12.5%) |
| Total (Overall) | 685 (64.3%) | 381 (35.7%) |
Employment Industries by Sex in Elberta
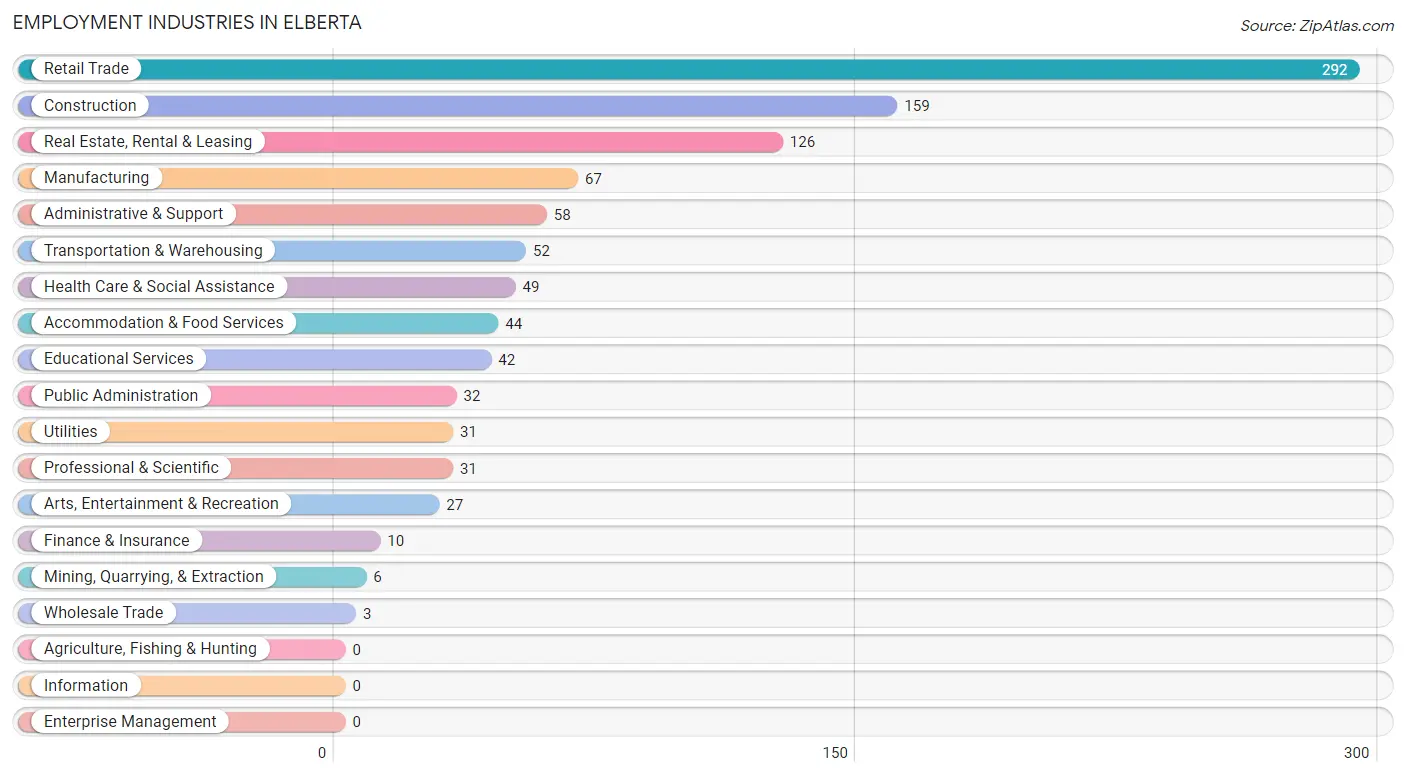
Employment Industries in Elberta
The major employment industries in Elberta include Retail Trade (292 | 27.4%), Construction (159 | 14.9%), Real Estate, Rental & Leasing (126 | 11.8%), Manufacturing (67 | 6.3%), and Administrative & Support (58 | 5.4%).
Employment Industries by Sex in Elberta
The Elberta industries that see more men than women are Mining, Quarrying, & Extraction (100.0%), Wholesale Trade (100.0%), and Utilities (100.0%), whereas the industries that tend to have a higher number of women are Finance & Insurance (100.0%), Health Care & Social Assistance (100.0%), and Educational Services (83.3%).
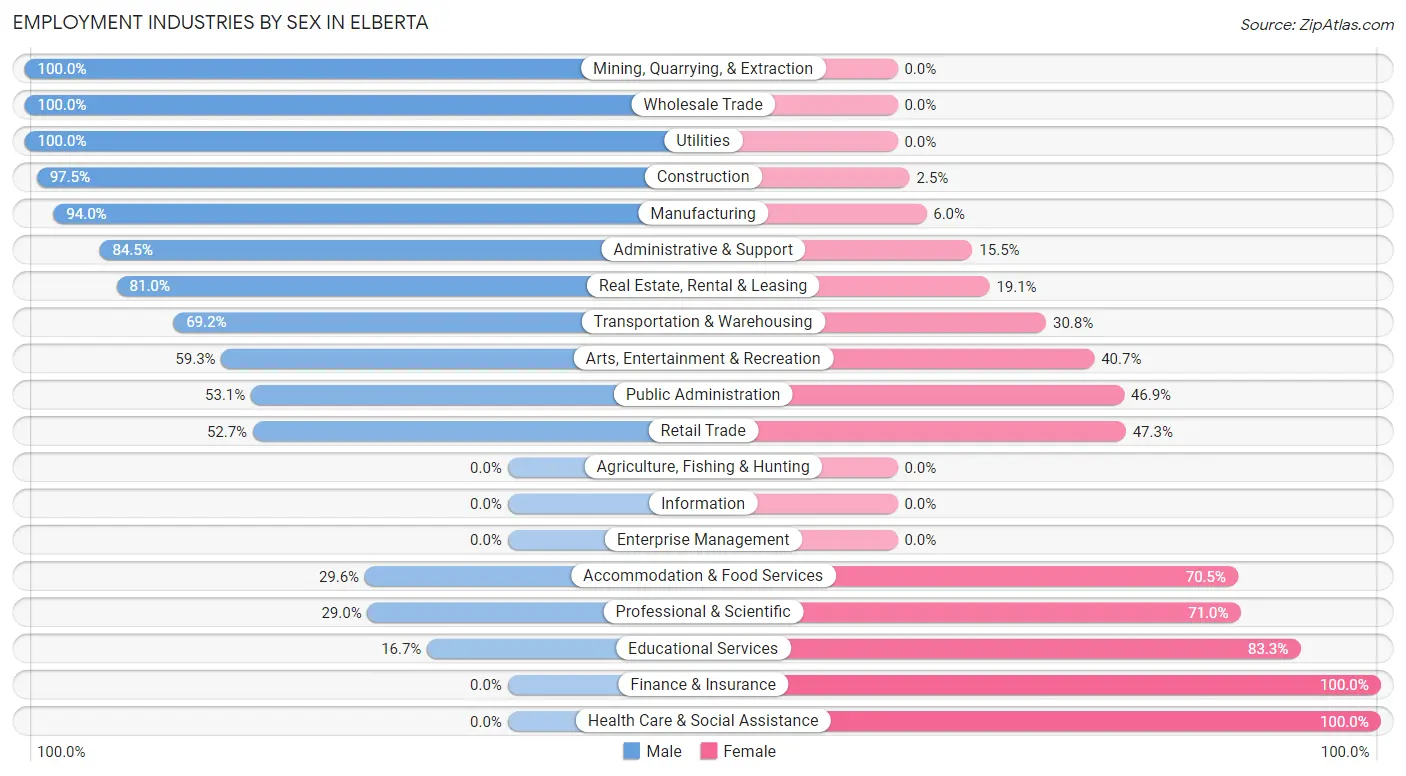
| Industry | Male | Female |
| Agriculture, Fishing & Hunting | 0 (0.0%) | 0 (0.0%) |
| Mining, Quarrying, & Extraction | 6 (100.0%) | 0 (0.0%) |
| Construction | 155 (97.5%) | 4 (2.5%) |
| Manufacturing | 63 (94.0%) | 4 (6.0%) |
| Wholesale Trade | 3 (100.0%) | 0 (0.0%) |
| Retail Trade | 154 (52.7%) | 138 (47.3%) |
| Transportation & Warehousing | 36 (69.2%) | 16 (30.8%) |
| Utilities | 31 (100.0%) | 0 (0.0%) |
| Information | 0 (0.0%) | 0 (0.0%) |
| Finance & Insurance | 0 (0.0%) | 10 (100.0%) |
| Real Estate, Rental & Leasing | 102 (80.9%) | 24 (19.1%) |
| Professional & Scientific | 9 (29.0%) | 22 (71.0%) |
| Enterprise Management | 0 (0.0%) | 0 (0.0%) |
| Administrative & Support | 49 (84.5%) | 9 (15.5%) |
| Educational Services | 7 (16.7%) | 35 (83.3%) |
| Health Care & Social Assistance | 0 (0.0%) | 49 (100.0%) |
| Arts, Entertainment & Recreation | 16 (59.3%) | 11 (40.7%) |
| Accommodation & Food Services | 13 (29.5%) | 31 (70.5%) |
| Public Administration | 17 (53.1%) | 15 (46.9%) |
| Total | 685 (64.3%) | 381 (35.7%) |
Education in Elberta
School Enrollment in Elberta
The most common levels of schooling among the 295 students in Elberta are middle school (89 | 30.2%), nursery / preschool (63 | 21.4%), and elementary school (56 | 19.0%).
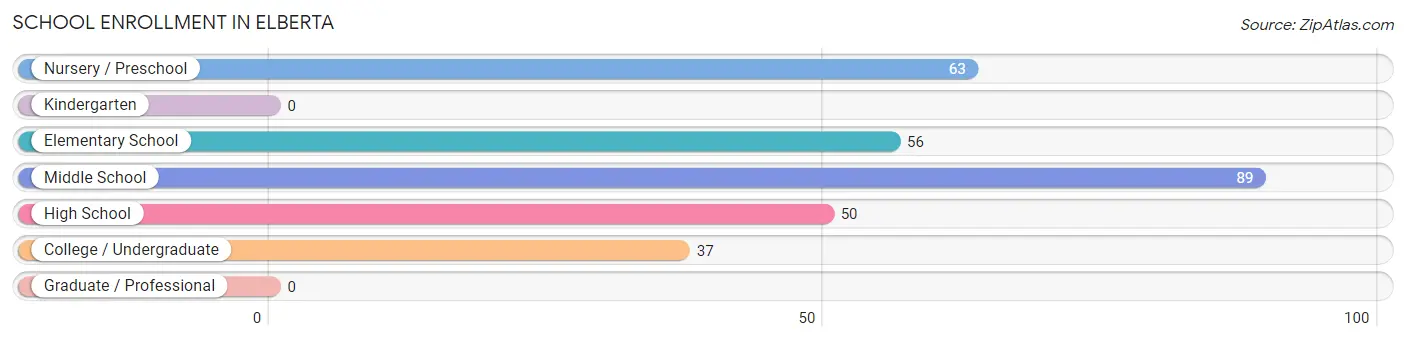
| School Level | # Students | % Students |
| Nursery / Preschool | 63 | 21.4% |
| Kindergarten | 0 | 0.0% |
| Elementary School | 56 | 19.0% |
| Middle School | 89 | 30.2% |
| High School | 50 | 17.0% |
| College / Undergraduate | 37 | 12.5% |
| Graduate / Professional | 0 | 0.0% |
| Total | 295 | 100.0% |
School Enrollment by Age by Funding Source in Elberta
Out of a total of 295 students who are enrolled in schools in Elberta, 35 (11.9%) attend a private institution, while the remaining 260 (88.1%) are enrolled in public schools. The age group of 18 to 19 year olds has the highest likelihood of being enrolled in private schools, with 9 (75.0% in the age bracket) enrolled. Conversely, the age group of 3 to 4 year olds has the lowest likelihood of being enrolled in a private school, with 61 (100.0% in the age bracket) attending a public institution.
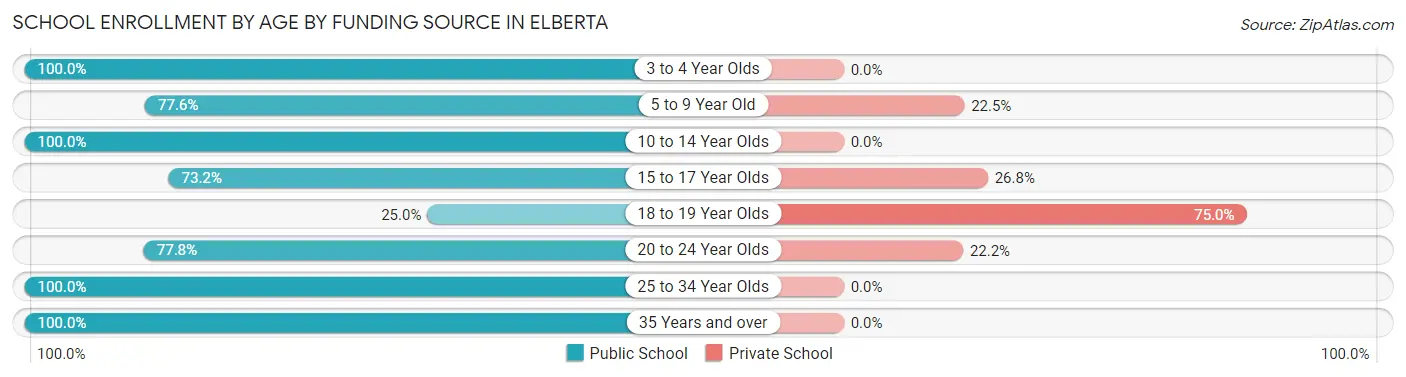
| Age Bracket | Public School | Private School |
| 3 to 4 Year Olds | 61 (100.0%) | 0 (0.0%) |
| 5 to 9 Year Old | 38 (77.5%) | 11 (22.5%) |
| 10 to 14 Year Olds | 98 (100.0%) | 0 (0.0%) |
| 15 to 17 Year Olds | 30 (73.2%) | 11 (26.8%) |
| 18 to 19 Year Olds | 3 (25.0%) | 9 (75.0%) |
| 20 to 24 Year Olds | 14 (77.8%) | 4 (22.2%) |
| 25 to 34 Year Olds | 6 (100.0%) | 0 (0.0%) |
| 35 Years and over | 10 (100.0%) | 0 (0.0%) |
| Total | 260 (88.1%) | 35 (11.9%) |
Educational Attainment by Field of Study in Elberta
Business (75 | 21.4%), education (53 | 15.1%), liberal arts & history (50 | 14.3%), science & technology (40 | 11.4%), and arts & humanities (37 | 10.6%) are the most common fields of study among 350 individuals in Elberta who have obtained a bachelor's degree or higher.
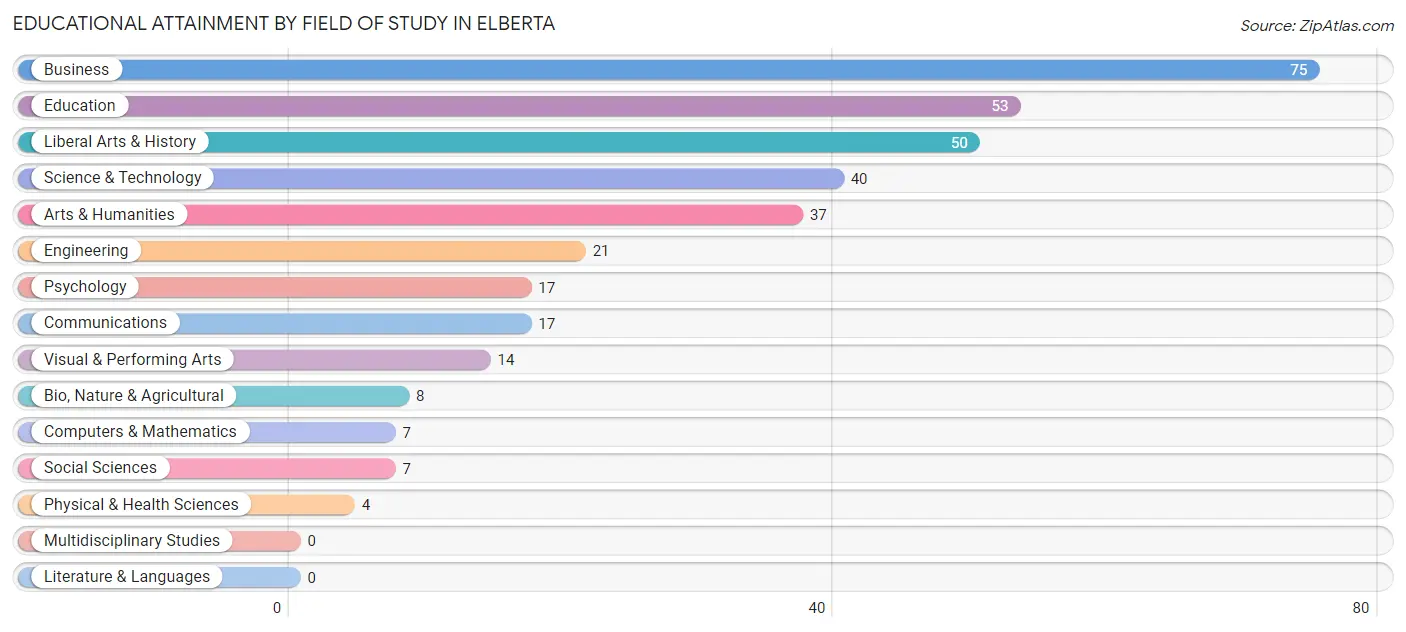
| Field of Study | # Graduates | % Graduates |
| Computers & Mathematics | 7 | 2.0% |
| Bio, Nature & Agricultural | 8 | 2.3% |
| Physical & Health Sciences | 4 | 1.1% |
| Psychology | 17 | 4.9% |
| Social Sciences | 7 | 2.0% |
| Engineering | 21 | 6.0% |
| Multidisciplinary Studies | 0 | 0.0% |
| Science & Technology | 40 | 11.4% |
| Business | 75 | 21.4% |
| Education | 53 | 15.1% |
| Literature & Languages | 0 | 0.0% |
| Liberal Arts & History | 50 | 14.3% |
| Visual & Performing Arts | 14 | 4.0% |
| Communications | 17 | 4.9% |
| Arts & Humanities | 37 | 10.6% |
| Total | 350 | 100.0% |
Transportation & Commute in Elberta
Vehicle Availability by Sex in Elberta
The most prevalent vehicle ownership categories in Elberta are males with 2 vehicles (483, accounting for 71.6%) and females with 2 vehicles (150, making up 126.8%).
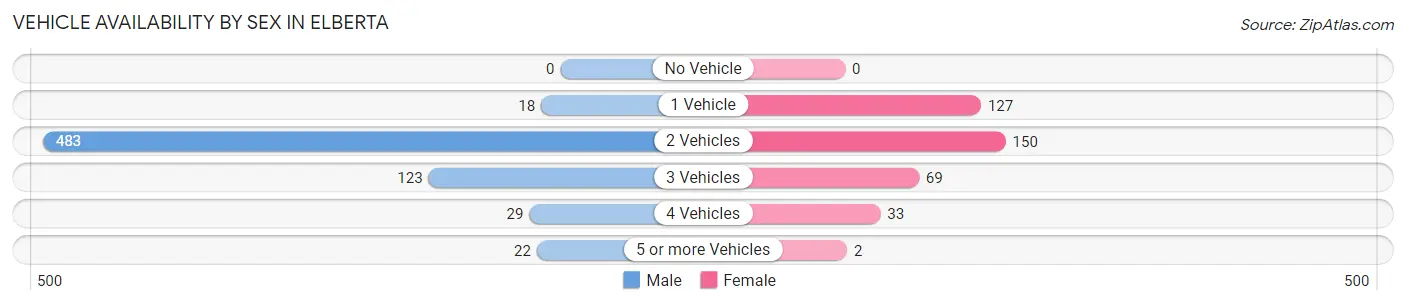
| Vehicles Available | Male | Female |
| No Vehicle | 0 (0.0%) | 0 (0.0%) |
| 1 Vehicle | 18 (2.7%) | 127 (33.3%) |
| 2 Vehicles | 483 (71.6%) | 150 (39.4%) |
| 3 Vehicles | 123 (18.2%) | 69 (18.1%) |
| 4 Vehicles | 29 (4.3%) | 33 (8.7%) |
| 5 or more Vehicles | 22 (3.3%) | 2 (0.5%) |
| Total | 675 (100.0%) | 381 (100.0%) |
Commute Time in Elberta
The most frequently occuring commute durations in Elberta are 30 to 34 minutes (315 commuters, 31.1%), 15 to 19 minutes (116 commuters, 11.5%), and 5 to 9 minutes (112 commuters, 11.1%).
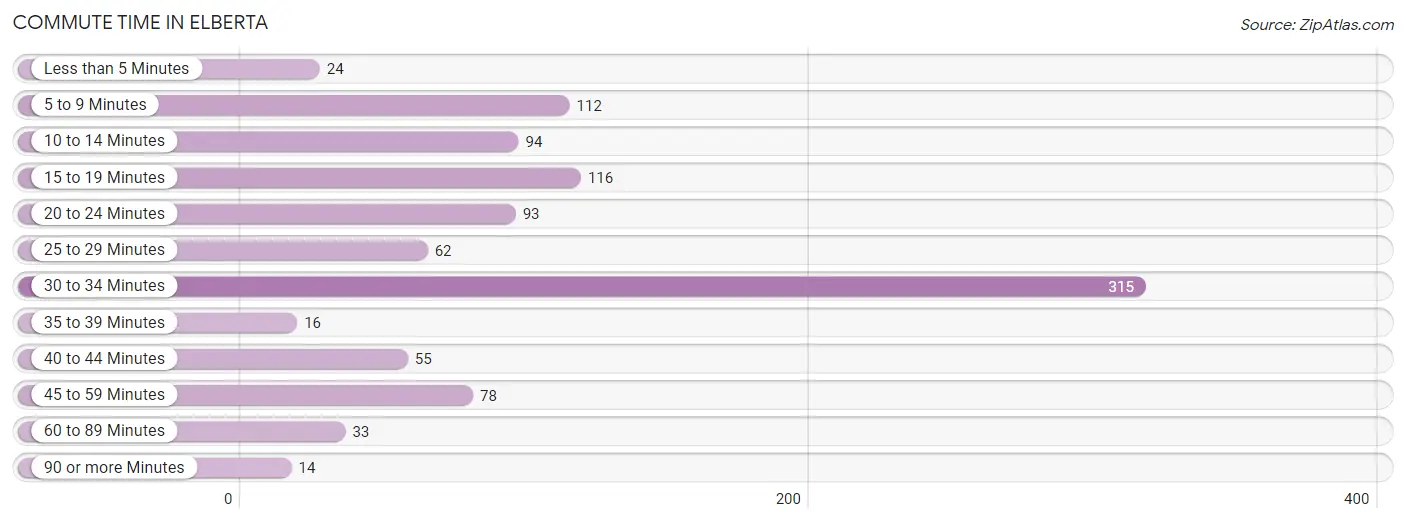
| Commute Time | # Commuters | % Commuters |
| Less than 5 Minutes | 24 | 2.4% |
| 5 to 9 Minutes | 112 | 11.1% |
| 10 to 14 Minutes | 94 | 9.3% |
| 15 to 19 Minutes | 116 | 11.5% |
| 20 to 24 Minutes | 93 | 9.2% |
| 25 to 29 Minutes | 62 | 6.1% |
| 30 to 34 Minutes | 315 | 31.1% |
| 35 to 39 Minutes | 16 | 1.6% |
| 40 to 44 Minutes | 55 | 5.4% |
| 45 to 59 Minutes | 78 | 7.7% |
| 60 to 89 Minutes | 33 | 3.3% |
| 90 or more Minutes | 14 | 1.4% |
Commute Time by Sex in Elberta
The most common commute times in Elberta are 30 to 34 minutes (261 commuters, 40.0%) for males and 15 to 19 minutes (77 commuters, 21.4%) for females.
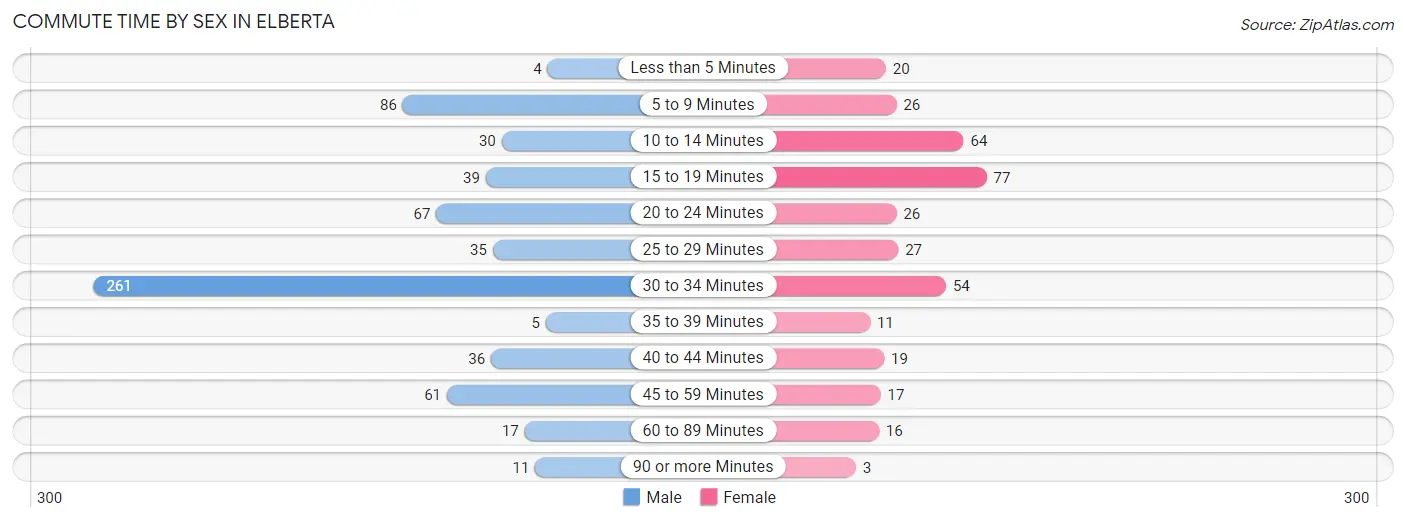
| Commute Time | Male | Female |
| Less than 5 Minutes | 4 (0.6%) | 20 (5.6%) |
| 5 to 9 Minutes | 86 (13.2%) | 26 (7.2%) |
| 10 to 14 Minutes | 30 (4.6%) | 64 (17.8%) |
| 15 to 19 Minutes | 39 (6.0%) | 77 (21.4%) |
| 20 to 24 Minutes | 67 (10.3%) | 26 (7.2%) |
| 25 to 29 Minutes | 35 (5.4%) | 27 (7.5%) |
| 30 to 34 Minutes | 261 (40.0%) | 54 (15.0%) |
| 35 to 39 Minutes | 5 (0.8%) | 11 (3.1%) |
| 40 to 44 Minutes | 36 (5.5%) | 19 (5.3%) |
| 45 to 59 Minutes | 61 (9.4%) | 17 (4.7%) |
| 60 to 89 Minutes | 17 (2.6%) | 16 (4.4%) |
| 90 or more Minutes | 11 (1.7%) | 3 (0.8%) |
Time of Departure to Work by Sex in Elberta
The most frequent times of departure to work in Elberta are 7:30 AM to 7:59 AM (137, 21.0%) for males and 9:00 AM to 9:59 AM (73, 20.3%) for females.
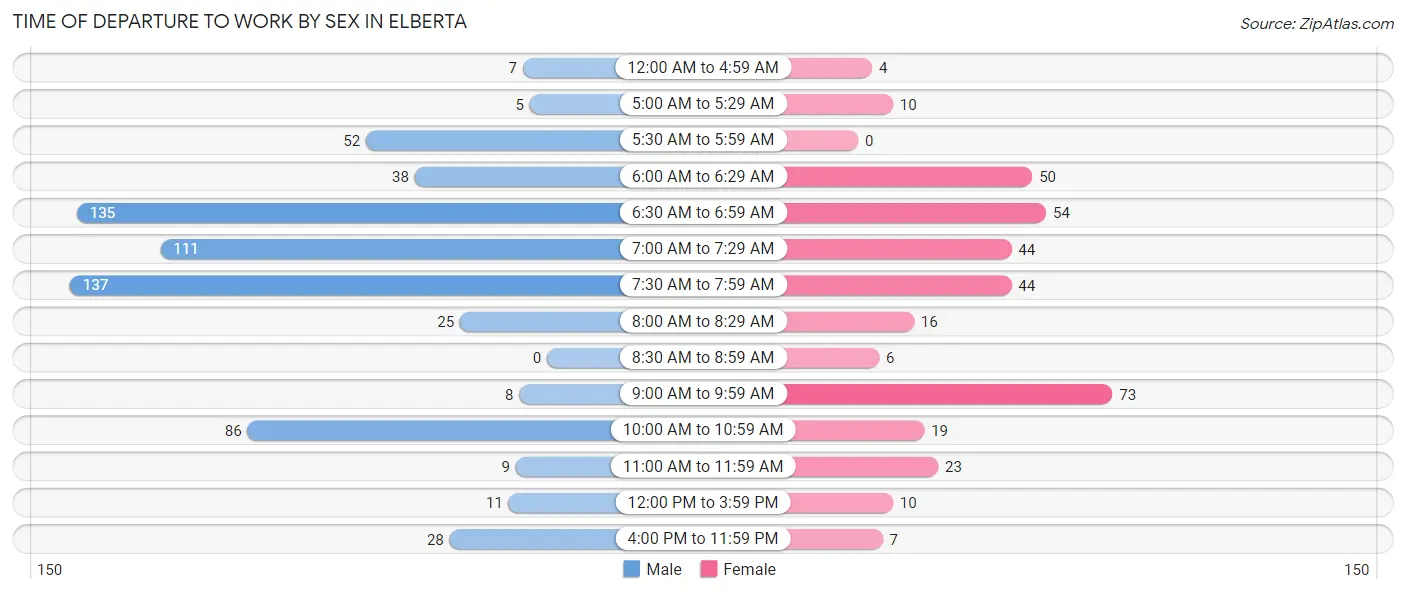
| Time of Departure | Male | Female |
| 12:00 AM to 4:59 AM | 7 (1.1%) | 4 (1.1%) |
| 5:00 AM to 5:29 AM | 5 (0.8%) | 10 (2.8%) |
| 5:30 AM to 5:59 AM | 52 (8.0%) | 0 (0.0%) |
| 6:00 AM to 6:29 AM | 38 (5.8%) | 50 (13.9%) |
| 6:30 AM to 6:59 AM | 135 (20.7%) | 54 (15.0%) |
| 7:00 AM to 7:29 AM | 111 (17.0%) | 44 (12.2%) |
| 7:30 AM to 7:59 AM | 137 (21.0%) | 44 (12.2%) |
| 8:00 AM to 8:29 AM | 25 (3.8%) | 16 (4.4%) |
| 8:30 AM to 8:59 AM | 0 (0.0%) | 6 (1.7%) |
| 9:00 AM to 9:59 AM | 8 (1.2%) | 73 (20.3%) |
| 10:00 AM to 10:59 AM | 86 (13.2%) | 19 (5.3%) |
| 11:00 AM to 11:59 AM | 9 (1.4%) | 23 (6.4%) |
| 12:00 PM to 3:59 PM | 11 (1.7%) | 10 (2.8%) |
| 4:00 PM to 11:59 PM | 28 (4.3%) | 7 (1.9%) |
| Total | 652 (100.0%) | 360 (100.0%) |
Housing Occupancy in Elberta
Occupancy by Ownership in Elberta
Of the total 961 dwellings in Elberta, owner-occupied units account for 620 (64.5%), while renter-occupied units make up 341 (35.5%).
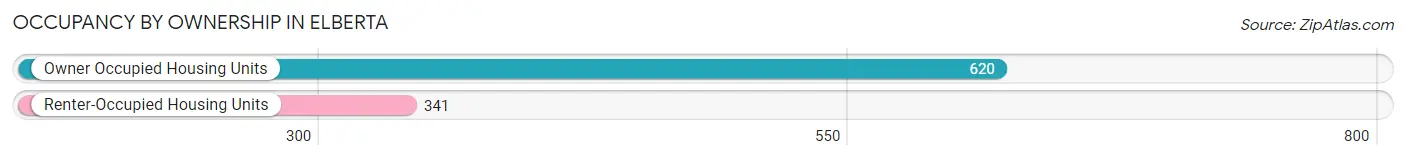
| Occupancy | # Housing Units | % Housing Units |
| Owner Occupied Housing Units | 620 | 64.5% |
| Renter-Occupied Housing Units | 341 | 35.5% |
| Total Occupied Housing Units | 961 | 100.0% |
Occupancy by Household Size in Elberta
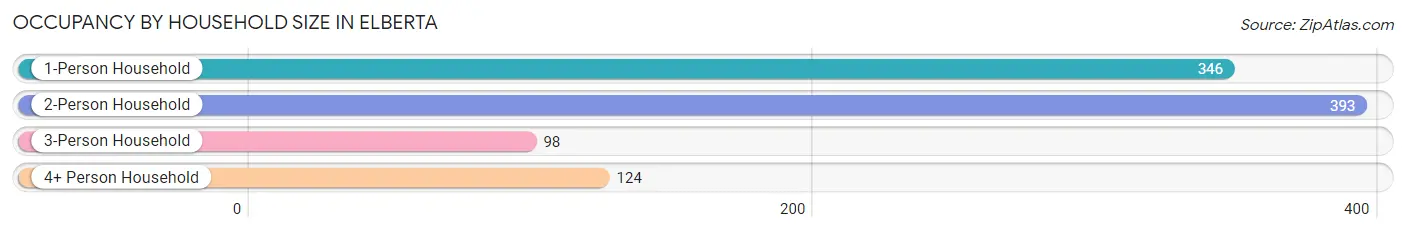
| Household Size | # Housing Units | % Housing Units |
| 1-Person Household | 346 | 36.0% |
| 2-Person Household | 393 | 40.9% |
| 3-Person Household | 98 | 10.2% |
| 4+ Person Household | 124 | 12.9% |
| Total Housing Units | 961 | 100.0% |
Occupancy by Ownership by Household Size in Elberta
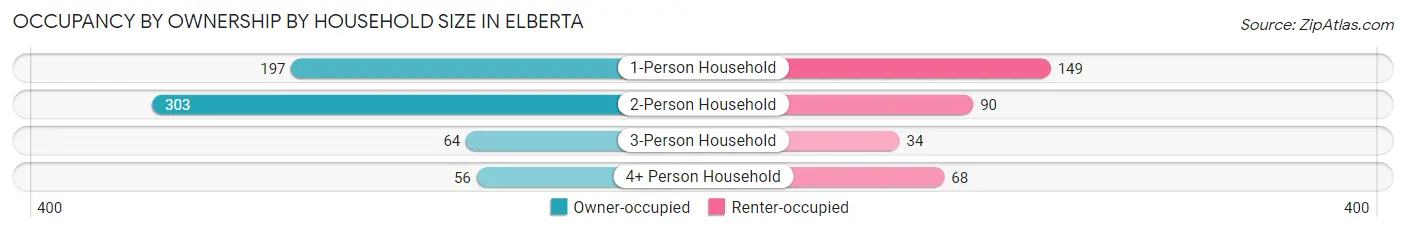
| Household Size | Owner-occupied | Renter-occupied |
| 1-Person Household | 197 (56.9%) | 149 (43.1%) |
| 2-Person Household | 303 (77.1%) | 90 (22.9%) |
| 3-Person Household | 64 (65.3%) | 34 (34.7%) |
| 4+ Person Household | 56 (45.2%) | 68 (54.8%) |
| Total Housing Units | 620 (64.5%) | 341 (35.5%) |
Occupancy by Educational Attainment in Elberta
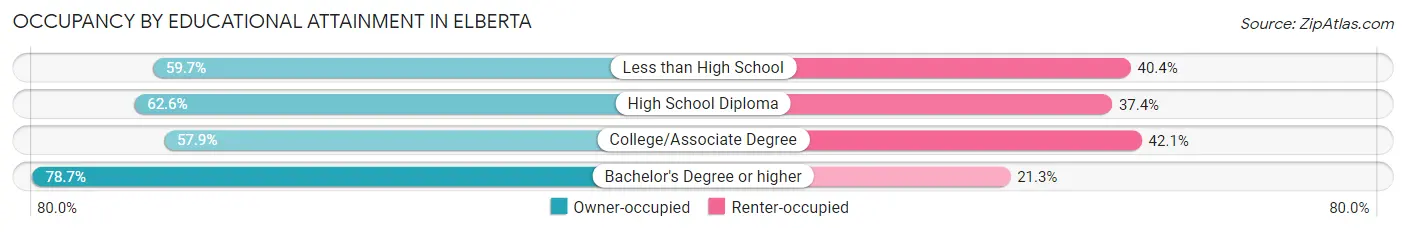
| Household Size | Owner-occupied | Renter-occupied |
| Less than High School | 68 (59.7%) | 46 (40.4%) |
| High School Diploma | 246 (62.6%) | 147 (37.4%) |
| College/Associate Degree | 143 (57.9%) | 104 (42.1%) |
| Bachelor's Degree or higher | 163 (78.7%) | 44 (21.3%) |
Occupancy by Age of Householder in Elberta
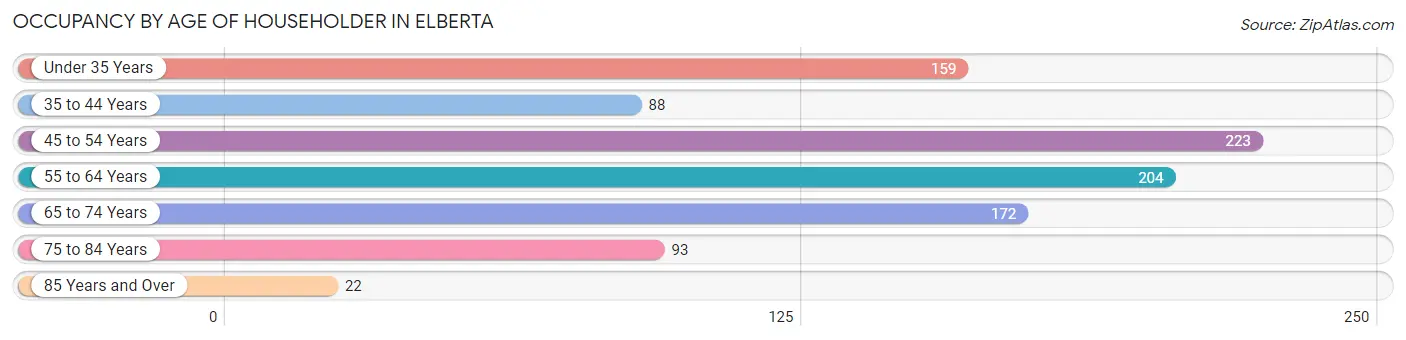
| Age Bracket | # Households | % Households |
| Under 35 Years | 159 | 16.6% |
| 35 to 44 Years | 88 | 9.2% |
| 45 to 54 Years | 223 | 23.2% |
| 55 to 64 Years | 204 | 21.2% |
| 65 to 74 Years | 172 | 17.9% |
| 75 to 84 Years | 93 | 9.7% |
| 85 Years and Over | 22 | 2.3% |
| Total | 961 | 100.0% |
Housing Finances in Elberta
Median Income by Occupancy in Elberta
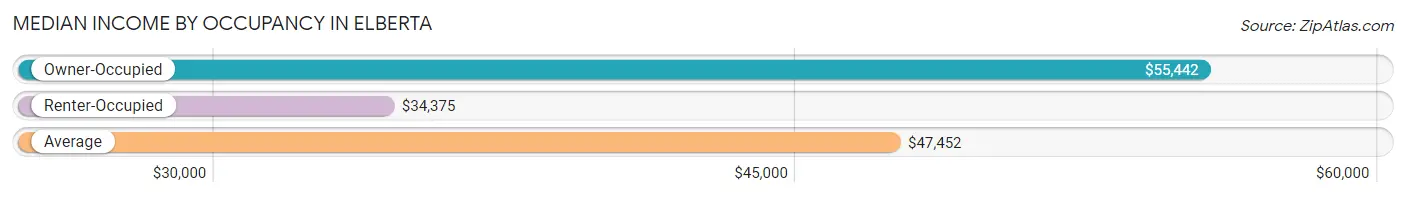
| Occupancy Type | # Households | Median Income |
| Owner-Occupied | 620 (64.5%) | $55,442 |
| Renter-Occupied | 341 (35.5%) | $34,375 |
| Average | 961 (100.0%) | $47,452 |
Occupancy by Householder Income Bracket in Elberta
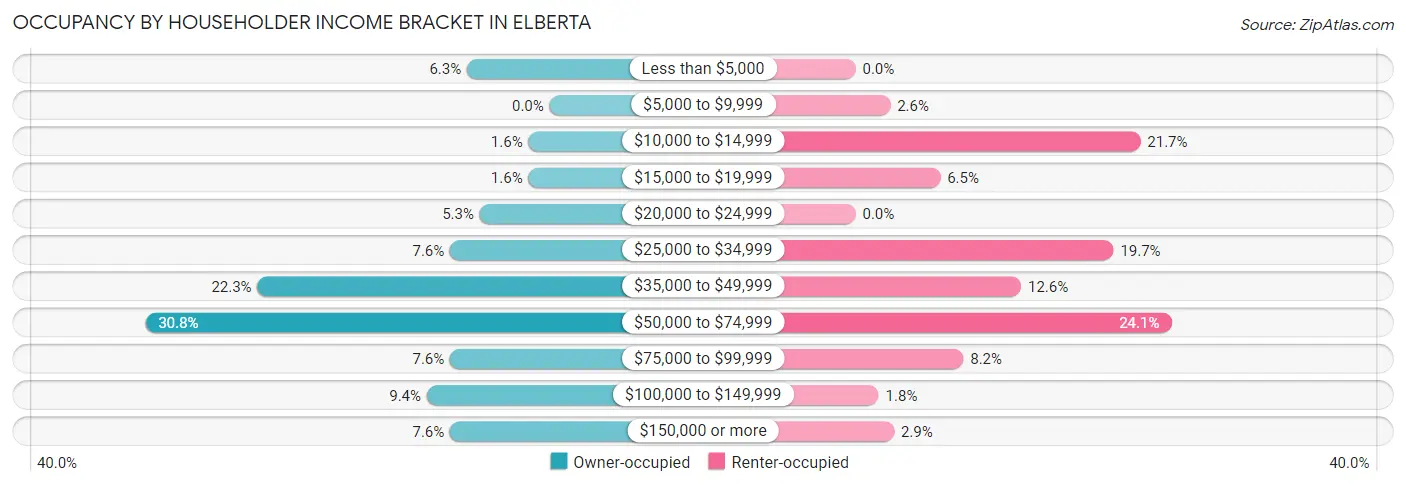
| Income Bracket | Owner-occupied | Renter-occupied |
| Less than $5,000 | 39 (6.3%) | 0 (0.0%) |
| $5,000 to $9,999 | 0 (0.0%) | 9 (2.6%) |
| $10,000 to $14,999 | 10 (1.6%) | 74 (21.7%) |
| $15,000 to $19,999 | 10 (1.6%) | 22 (6.5%) |
| $20,000 to $24,999 | 33 (5.3%) | 0 (0.0%) |
| $25,000 to $34,999 | 47 (7.6%) | 67 (19.7%) |
| $35,000 to $49,999 | 138 (22.3%) | 43 (12.6%) |
| $50,000 to $74,999 | 191 (30.8%) | 82 (24.0%) |
| $75,000 to $99,999 | 47 (7.6%) | 28 (8.2%) |
| $100,000 to $149,999 | 58 (9.3%) | 6 (1.8%) |
| $150,000 or more | 47 (7.6%) | 10 (2.9%) |
| Total | 620 (100.0%) | 341 (100.0%) |
Monthly Housing Cost Tiers in Elberta
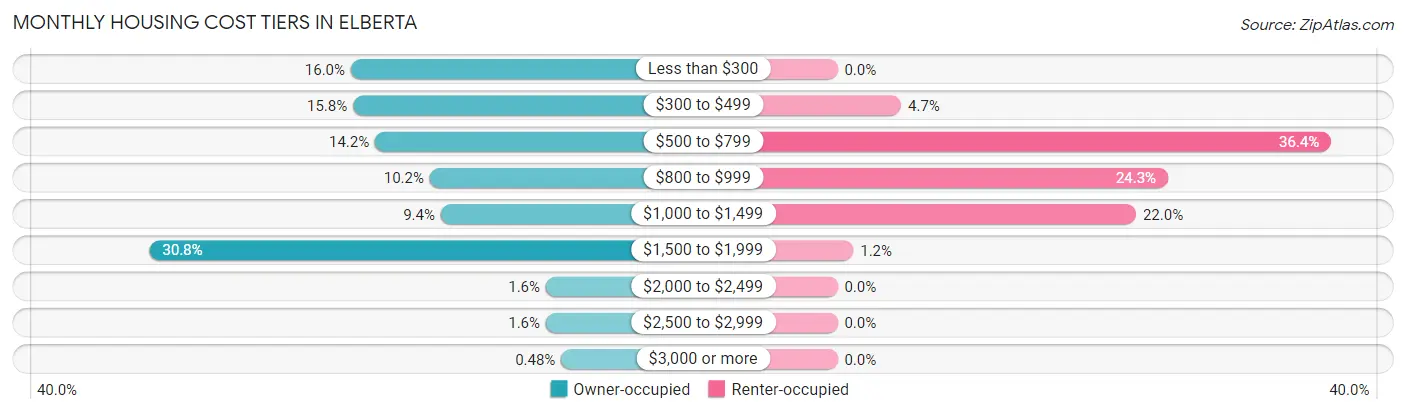
| Monthly Cost | Owner-occupied | Renter-occupied |
| Less than $300 | 99 (16.0%) | 0 (0.0%) |
| $300 to $499 | 98 (15.8%) | 16 (4.7%) |
| $500 to $799 | 88 (14.2%) | 124 (36.4%) |
| $800 to $999 | 63 (10.2%) | 83 (24.3%) |
| $1,000 to $1,499 | 58 (9.3%) | 75 (22.0%) |
| $1,500 to $1,999 | 191 (30.8%) | 4 (1.2%) |
| $2,000 to $2,499 | 10 (1.6%) | 0 (0.0%) |
| $2,500 to $2,999 | 10 (1.6%) | 0 (0.0%) |
| $3,000 or more | 3 (0.5%) | 0 (0.0%) |
| Total | 620 (100.0%) | 341 (100.0%) |
Physical Housing Characteristics in Elberta
Housing Structures in Elberta
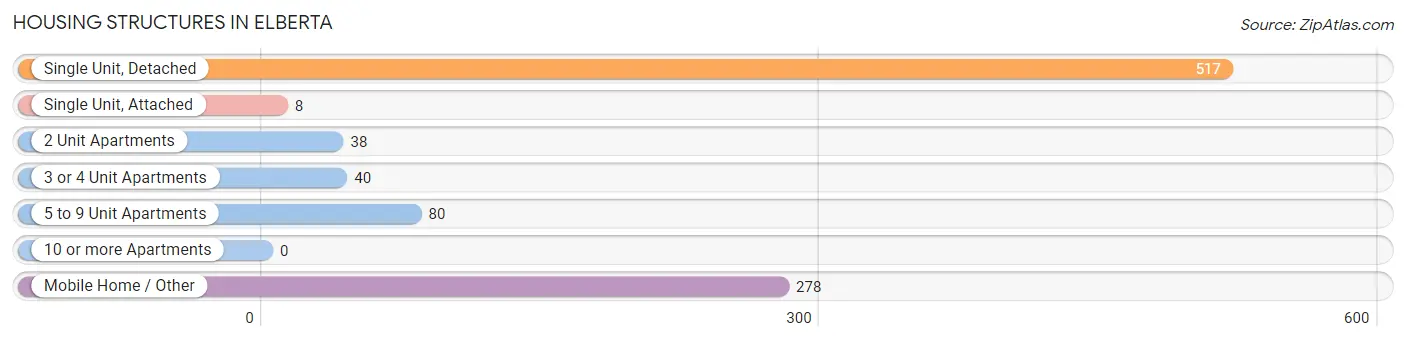
| Structure Type | # Housing Units | % Housing Units |
| Single Unit, Detached | 517 | 53.8% |
| Single Unit, Attached | 8 | 0.8% |
| 2 Unit Apartments | 38 | 4.0% |
| 3 or 4 Unit Apartments | 40 | 4.2% |
| 5 to 9 Unit Apartments | 80 | 8.3% |
| 10 or more Apartments | 0 | 0.0% |
| Mobile Home / Other | 278 | 28.9% |
| Total | 961 | 100.0% |
Housing Structures by Occupancy in Elberta
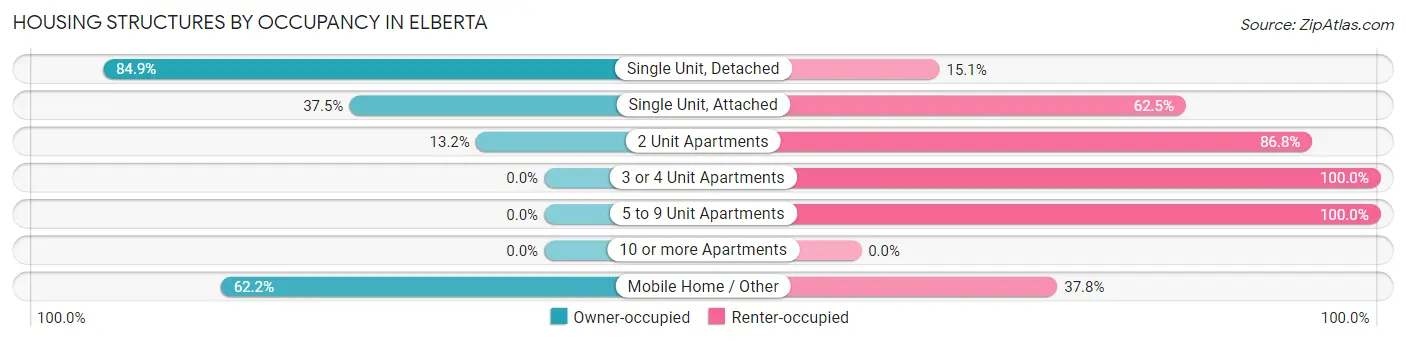
| Structure Type | Owner-occupied | Renter-occupied |
| Single Unit, Detached | 439 (84.9%) | 78 (15.1%) |
| Single Unit, Attached | 3 (37.5%) | 5 (62.5%) |
| 2 Unit Apartments | 5 (13.2%) | 33 (86.8%) |
| 3 or 4 Unit Apartments | 0 (0.0%) | 40 (100.0%) |
| 5 to 9 Unit Apartments | 0 (0.0%) | 80 (100.0%) |
| 10 or more Apartments | 0 (0.0%) | 0 (0.0%) |
| Mobile Home / Other | 173 (62.2%) | 105 (37.8%) |
| Total | 620 (64.5%) | 341 (35.5%) |
Housing Structures by Number of Rooms in Elberta
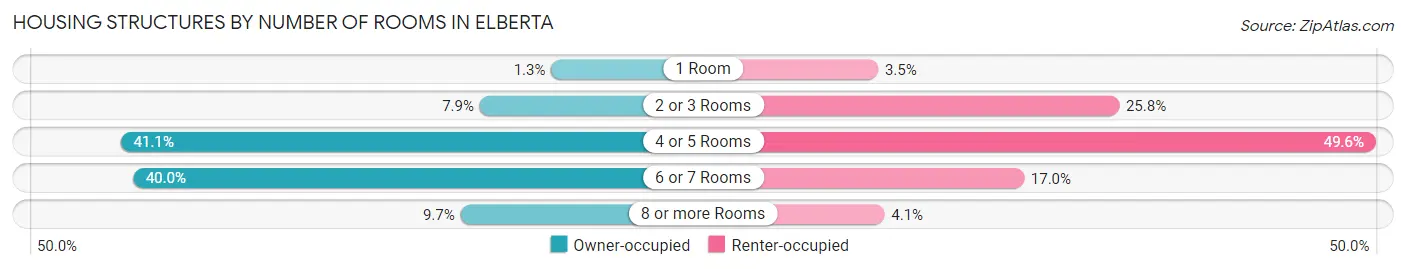
| Number of Rooms | Owner-occupied | Renter-occupied |
| 1 Room | 8 (1.3%) | 12 (3.5%) |
| 2 or 3 Rooms | 49 (7.9%) | 88 (25.8%) |
| 4 or 5 Rooms | 255 (41.1%) | 169 (49.6%) |
| 6 or 7 Rooms | 248 (40.0%) | 58 (17.0%) |
| 8 or more Rooms | 60 (9.7%) | 14 (4.1%) |
| Total | 620 (100.0%) | 341 (100.0%) |
Housing Structure by Heating Type in Elberta
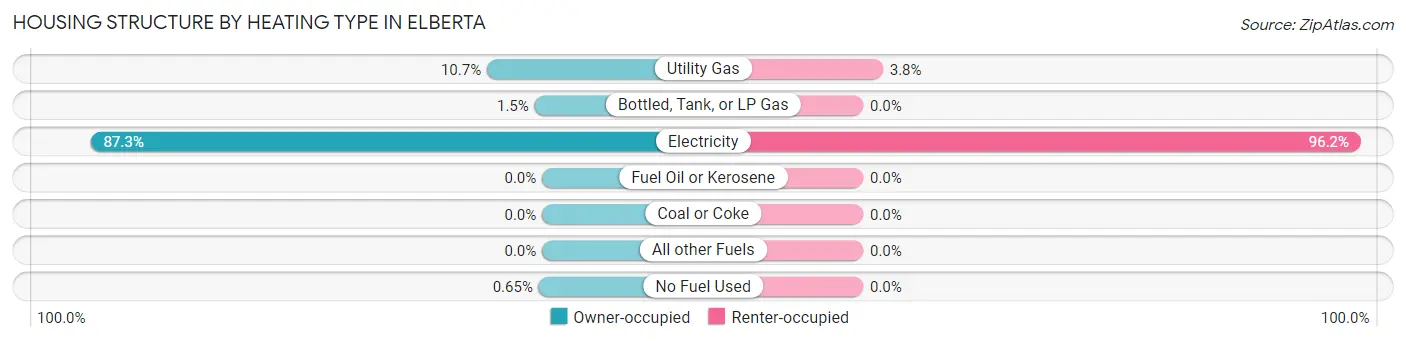
| Heating Type | Owner-occupied | Renter-occupied |
| Utility Gas | 66 (10.6%) | 13 (3.8%) |
| Bottled, Tank, or LP Gas | 9 (1.5%) | 0 (0.0%) |
| Electricity | 541 (87.3%) | 328 (96.2%) |
| Fuel Oil or Kerosene | 0 (0.0%) | 0 (0.0%) |
| Coal or Coke | 0 (0.0%) | 0 (0.0%) |
| All other Fuels | 0 (0.0%) | 0 (0.0%) |
| No Fuel Used | 4 (0.6%) | 0 (0.0%) |
| Total | 620 (100.0%) | 341 (100.0%) |
Household Vehicle Usage in Elberta
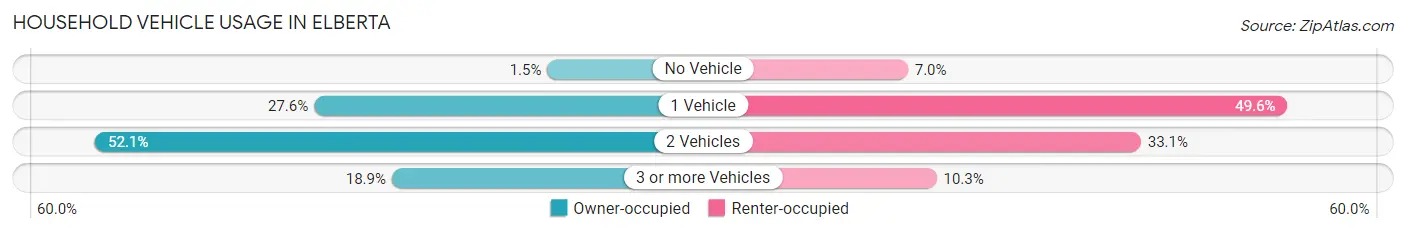
| Vehicles per Household | Owner-occupied | Renter-occupied |
| No Vehicle | 9 (1.5%) | 24 (7.0%) |
| 1 Vehicle | 171 (27.6%) | 169 (49.6%) |
| 2 Vehicles | 323 (52.1%) | 113 (33.1%) |
| 3 or more Vehicles | 117 (18.9%) | 35 (10.3%) |
| Total | 620 (100.0%) | 341 (100.0%) |
Real Estate & Mortgages in Elberta
Real Estate and Mortgage Overview in Elberta
| Characteristic | Without Mortgage | With Mortgage |
| Housing Units | 233 | 387 |
| Median Property Value | $119,500 | $215,800 |
| Median Household Income | $45,859 | $37 |
| Monthly Housing Costs | $354 | $3 |
| Real Estate Taxes | $446 | $57 |
Property Value by Mortgage Status in Elberta
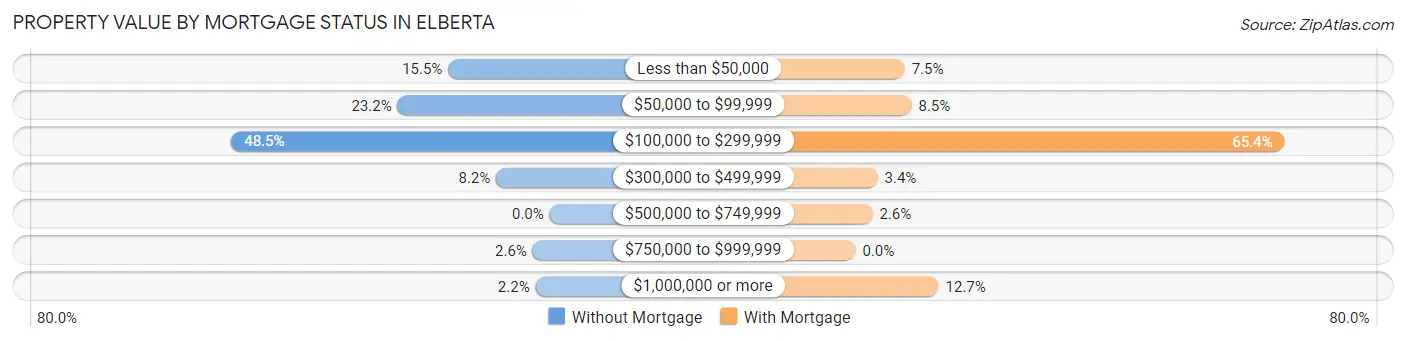
| Property Value | Without Mortgage | With Mortgage |
| Less than $50,000 | 36 (15.4%) | 29 (7.5%) |
| $50,000 to $99,999 | 54 (23.2%) | 33 (8.5%) |
| $100,000 to $299,999 | 113 (48.5%) | 253 (65.4%) |
| $300,000 to $499,999 | 19 (8.2%) | 13 (3.4%) |
| $500,000 to $749,999 | 0 (0.0%) | 10 (2.6%) |
| $750,000 to $999,999 | 6 (2.6%) | 0 (0.0%) |
| $1,000,000 or more | 5 (2.1%) | 49 (12.7%) |
| Total | 233 (100.0%) | 387 (100.0%) |
Household Income by Mortgage Status in Elberta
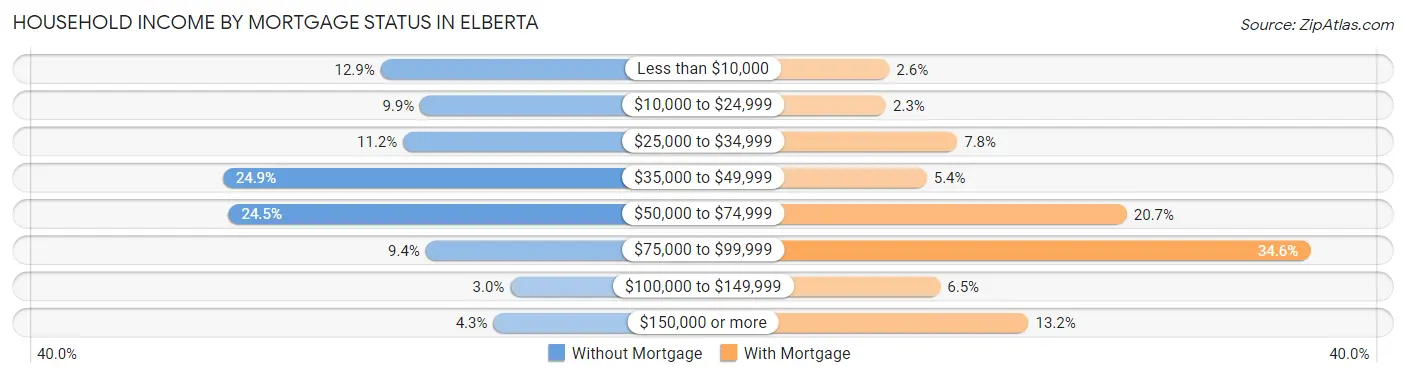
| Household Income | Without Mortgage | With Mortgage |
| Less than $10,000 | 30 (12.9%) | 10 (2.6%) |
| $10,000 to $24,999 | 23 (9.9%) | 9 (2.3%) |
| $25,000 to $34,999 | 26 (11.2%) | 30 (7.7%) |
| $35,000 to $49,999 | 58 (24.9%) | 21 (5.4%) |
| $50,000 to $74,999 | 57 (24.5%) | 80 (20.7%) |
| $75,000 to $99,999 | 22 (9.4%) | 134 (34.6%) |
| $100,000 to $149,999 | 7 (3.0%) | 25 (6.5%) |
| $150,000 or more | 10 (4.3%) | 51 (13.2%) |
| Total | 233 (100.0%) | 387 (100.0%) |
Property Value to Household Income Ratio in Elberta
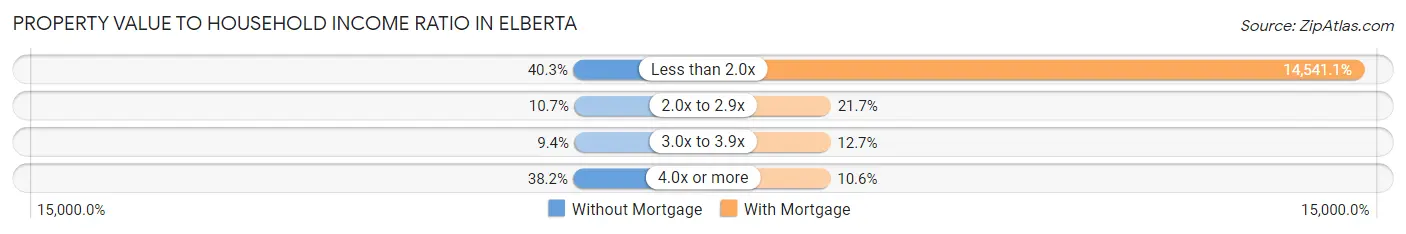
| Value-to-Income Ratio | Without Mortgage | With Mortgage |
| Less than 2.0x | 94 (40.3%) | 56,274 (14,541.1%) |
| 2.0x to 2.9x | 25 (10.7%) | 84 (21.7%) |
| 3.0x to 3.9x | 22 (9.4%) | 49 (12.7%) |
| 4.0x or more | 89 (38.2%) | 41 (10.6%) |
| Total | 233 (100.0%) | 387 (100.0%) |
Real Estate Taxes by Mortgage Status in Elberta
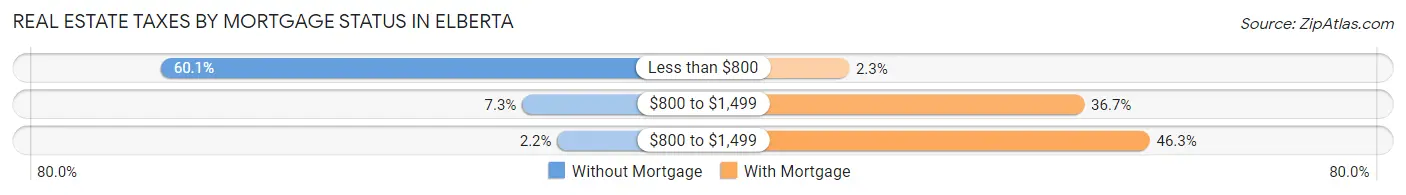
| Property Taxes | Without Mortgage | With Mortgage |
| Less than $800 | 140 (60.1%) | 9 (2.3%) |
| $800 to $1,499 | 17 (7.3%) | 142 (36.7%) |
| $800 to $1,499 | 5 (2.1%) | 179 (46.3%) |
| Total | 233 (100.0%) | 387 (100.0%) |
Health & Disability in Elberta
Health Insurance Coverage by Age in Elberta
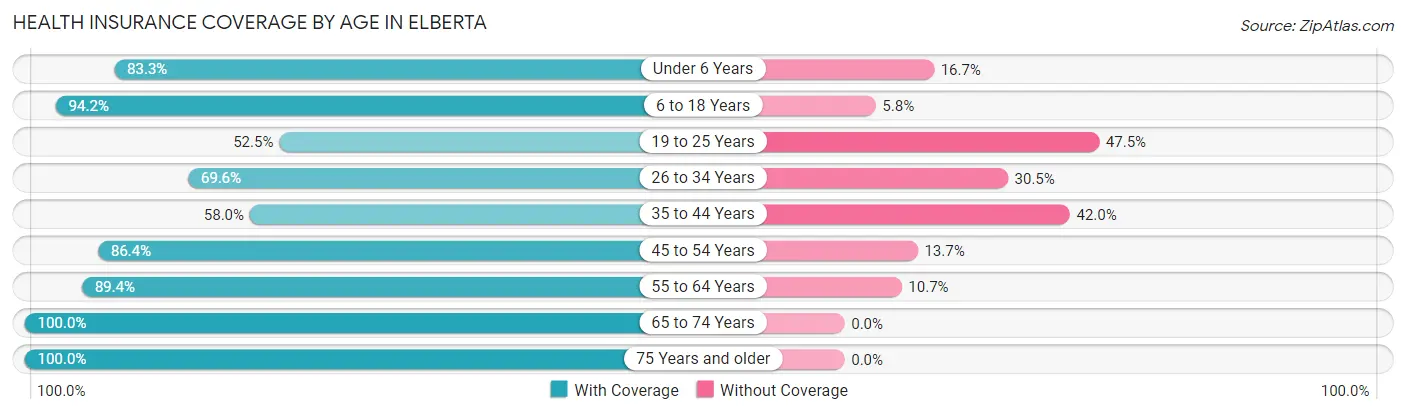
| Age Bracket | With Coverage | Without Coverage |
| Under 6 Years | 95 (83.3%) | 19 (16.7%) |
| 6 to 18 Years | 211 (94.2%) | 13 (5.8%) |
| 19 to 25 Years | 125 (52.5%) | 113 (47.5%) |
| 26 to 34 Years | 169 (69.6%) | 74 (30.4%) |
| 35 to 44 Years | 98 (58.0%) | 71 (42.0%) |
| 45 to 54 Years | 272 (86.4%) | 43 (13.7%) |
| 55 to 64 Years | 369 (89.3%) | 44 (10.6%) |
| 65 to 74 Years | 231 (100.0%) | 0 (0.0%) |
| 75 Years and older | 193 (100.0%) | 0 (0.0%) |
| Total | 1,763 (82.4%) | 377 (17.6%) |
Health Insurance Coverage by Citizenship Status in Elberta
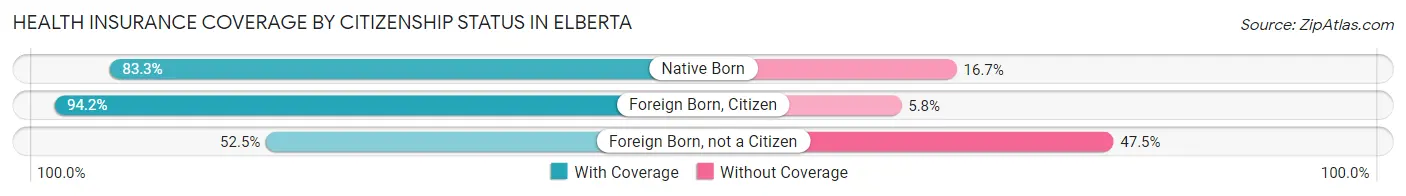
| Citizenship Status | With Coverage | Without Coverage |
| Native Born | 95 (83.3%) | 19 (16.7%) |
| Foreign Born, Citizen | 211 (94.2%) | 13 (5.8%) |
| Foreign Born, not a Citizen | 125 (52.5%) | 113 (47.5%) |
Health Insurance Coverage by Household Income in Elberta
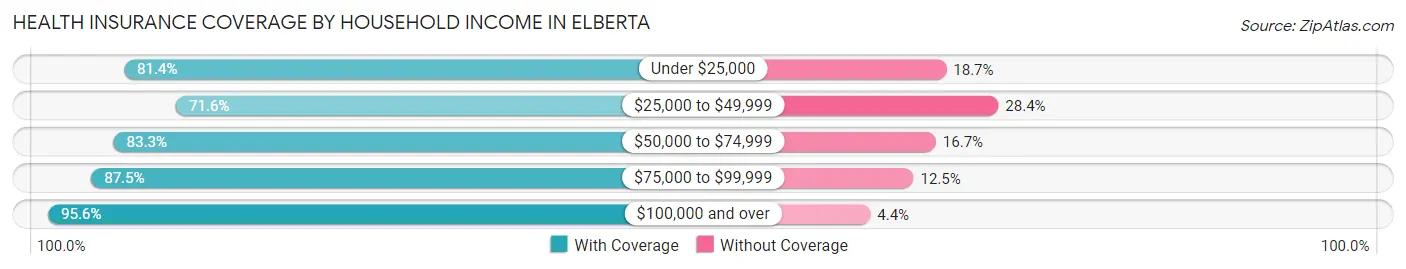
| Household Income | With Coverage | Without Coverage |
| Under $25,000 | 266 (81.4%) | 61 (18.6%) |
| $25,000 to $49,999 | 406 (71.6%) | 161 (28.4%) |
| $50,000 to $74,999 | 569 (83.3%) | 114 (16.7%) |
| $75,000 to $99,999 | 175 (87.5%) | 25 (12.5%) |
| $100,000 and over | 347 (95.6%) | 16 (4.4%) |
Public vs Private Health Insurance Coverage by Age in Elberta
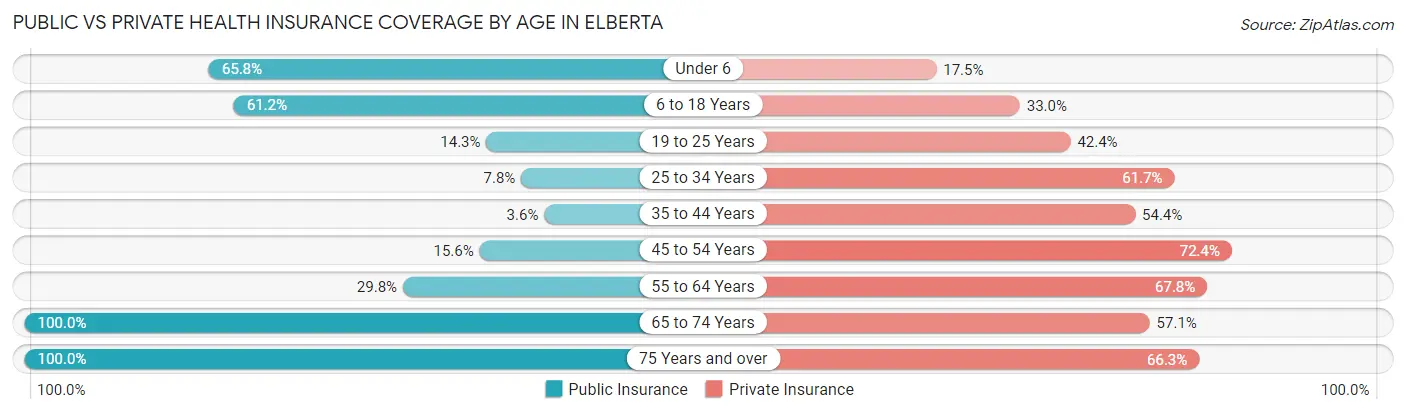
| Age Bracket | Public Insurance | Private Insurance |
| Under 6 | 75 (65.8%) | 20 (17.5%) |
| 6 to 18 Years | 137 (61.2%) | 74 (33.0%) |
| 19 to 25 Years | 34 (14.3%) | 101 (42.4%) |
| 25 to 34 Years | 19 (7.8%) | 150 (61.7%) |
| 35 to 44 Years | 6 (3.5%) | 92 (54.4%) |
| 45 to 54 Years | 49 (15.6%) | 228 (72.4%) |
| 55 to 64 Years | 123 (29.8%) | 280 (67.8%) |
| 65 to 74 Years | 231 (100.0%) | 132 (57.1%) |
| 75 Years and over | 193 (100.0%) | 128 (66.3%) |
| Total | 867 (40.5%) | 1,205 (56.3%) |
Disability Status by Sex by Age in Elberta
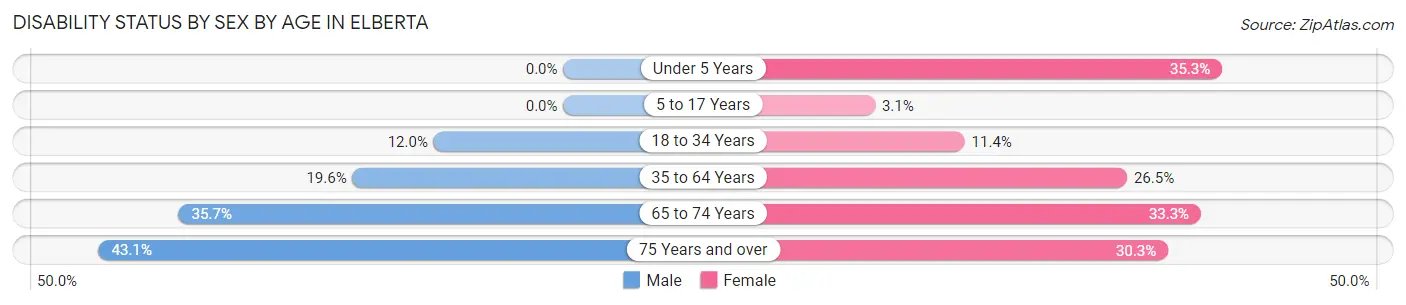
| Age Bracket | Male | Female |
| Under 5 Years | 0 (0.0%) | 12 (35.3%) |
| 5 to 17 Years | 0 (0.0%) | 4 (3.1%) |
| 18 to 34 Years | 35 (12.0%) | 26 (11.4%) |
| 35 to 64 Years | 109 (19.6%) | 90 (26.5%) |
| 65 to 74 Years | 30 (35.7%) | 49 (33.3%) |
| 75 Years and over | 22 (43.1%) | 43 (30.3%) |
Disability Class by Sex by Age in Elberta
Disability Class: Hearing Difficulty
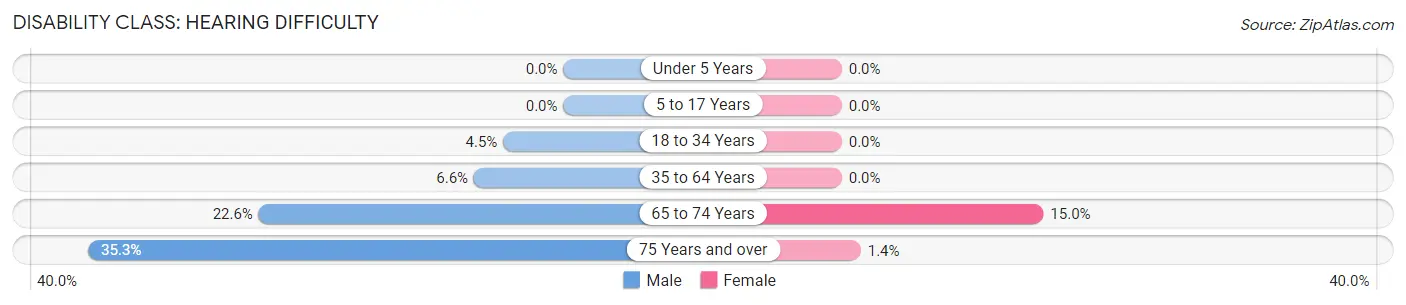
| Age Bracket | Male | Female |
| Under 5 Years | 0 (0.0%) | 0 (0.0%) |
| 5 to 17 Years | 0 (0.0%) | 0 (0.0%) |
| 18 to 34 Years | 13 (4.5%) | 0 (0.0%) |
| 35 to 64 Years | 37 (6.6%) | 0 (0.0%) |
| 65 to 74 Years | 19 (22.6%) | 22 (15.0%) |
| 75 Years and over | 18 (35.3%) | 2 (1.4%) |
Disability Class: Vision Difficulty
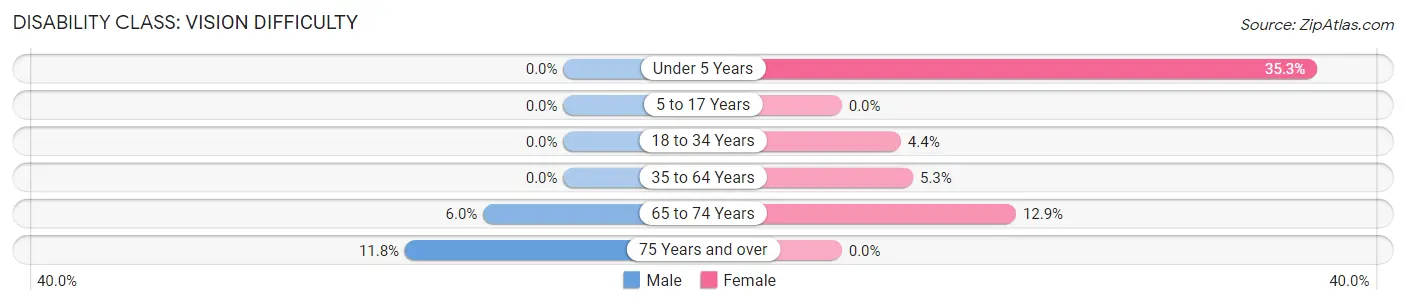
| Age Bracket | Male | Female |
| Under 5 Years | 0 (0.0%) | 12 (35.3%) |
| 5 to 17 Years | 0 (0.0%) | 0 (0.0%) |
| 18 to 34 Years | 0 (0.0%) | 10 (4.4%) |
| 35 to 64 Years | 0 (0.0%) | 18 (5.3%) |
| 65 to 74 Years | 5 (5.9%) | 19 (12.9%) |
| 75 Years and over | 6 (11.8%) | 0 (0.0%) |
Disability Class: Cognitive Difficulty
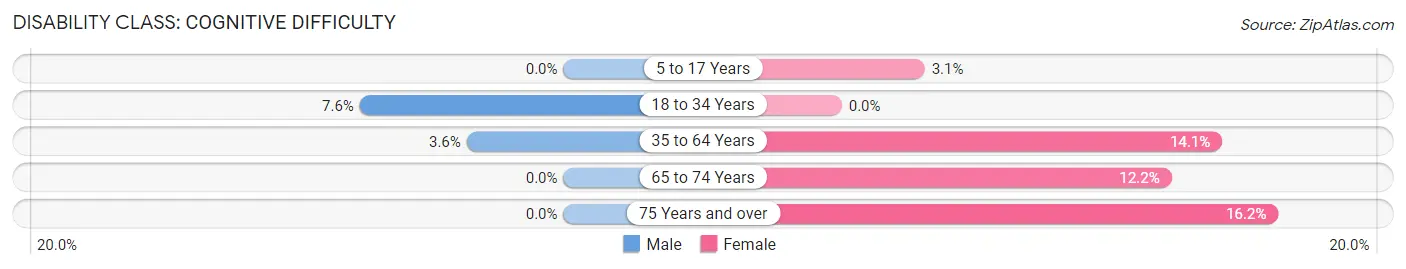
| Age Bracket | Male | Female |
| 5 to 17 Years | 0 (0.0%) | 4 (3.1%) |
| 18 to 34 Years | 22 (7.6%) | 0 (0.0%) |
| 35 to 64 Years | 20 (3.6%) | 48 (14.1%) |
| 65 to 74 Years | 0 (0.0%) | 18 (12.2%) |
| 75 Years and over | 0 (0.0%) | 23 (16.2%) |
Disability Class: Ambulatory Difficulty
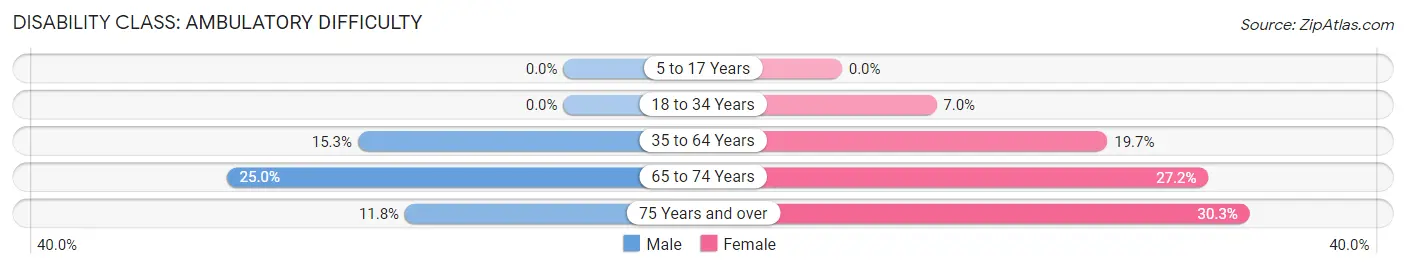
| Age Bracket | Male | Female |
| 5 to 17 Years | 0 (0.0%) | 0 (0.0%) |
| 18 to 34 Years | 0 (0.0%) | 16 (7.0%) |
| 35 to 64 Years | 85 (15.3%) | 67 (19.7%) |
| 65 to 74 Years | 21 (25.0%) | 40 (27.2%) |
| 75 Years and over | 6 (11.8%) | 43 (30.3%) |
Disability Class: Self-Care Difficulty
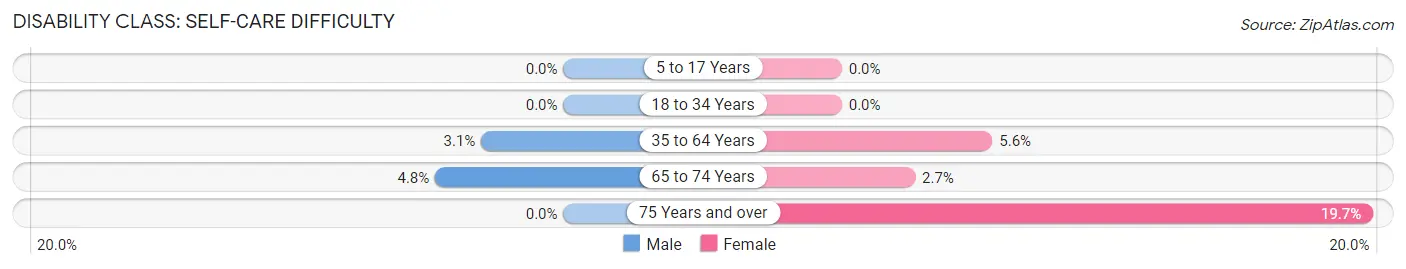
| Age Bracket | Male | Female |
| 5 to 17 Years | 0 (0.0%) | 0 (0.0%) |
| 18 to 34 Years | 0 (0.0%) | 0 (0.0%) |
| 35 to 64 Years | 17 (3.0%) | 19 (5.6%) |
| 65 to 74 Years | 4 (4.8%) | 4 (2.7%) |
| 75 Years and over | 0 (0.0%) | 28 (19.7%) |
Technology Access in Elberta
Computing Device Access in Elberta
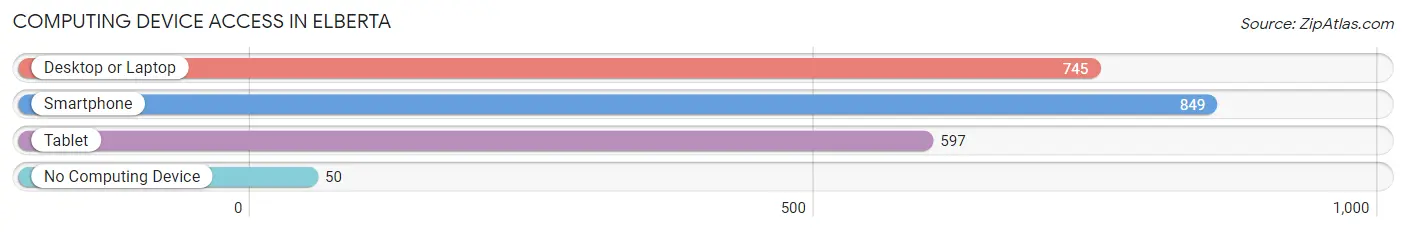
| Device Type | # Households | % Households |
| Desktop or Laptop | 745 | 77.5% |
| Smartphone | 849 | 88.3% |
| Tablet | 597 | 62.1% |
| No Computing Device | 50 | 5.2% |
| Total | 961 | 100.0% |
Internet Access in Elberta
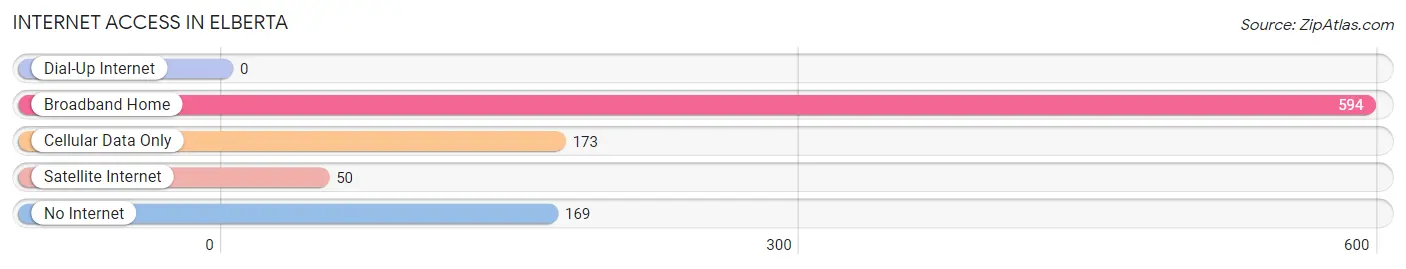
| Internet Type | # Households | % Households |
| Dial-Up Internet | 0 | 0.0% |
| Broadband Home | 594 | 61.8% |
| Cellular Data Only | 173 | 18.0% |
| Satellite Internet | 50 | 5.2% |
| No Internet | 169 | 17.6% |
| Total | 961 | 100.0% |
Elberta Summary
Elberta, Alabama is a small town located in Baldwin County, Alabama. It is situated on the western shore of Wolf Bay, a large bay of the Gulf of Mexico. The town was founded in 1887 and is named after Elberta, a variety of peach. The town has a population of 1,498 as of the 2010 census.
Geography
Elberta is located at 30°32'25" North, 87°37'17" West (30.540278, -87.621389). It is situated on the western shore of Wolf Bay, a large bay of the Gulf of Mexico. The town is located approximately 10 miles south of the city of Foley and 25 miles east of the city of Mobile.
The town has a total area of 1.3 square miles, all of which is land. The terrain is mostly flat with some rolling hills. The climate is humid subtropical, with hot, humid summers and mild winters.
History
Elberta was founded in 1887 by a group of German immigrants. The town was named after Elberta, a variety of peach. The town was incorporated in 1901.
In the early 1900s, Elberta was a thriving agricultural community. The town was known for its peach orchards and was home to several canneries. The town also had a thriving lumber industry.
In the 1950s, the town began to decline as the lumber industry moved away and the peach orchards were replaced by housing developments. The town has since become a bedroom community for the nearby cities of Foley and Mobile.
Economy
The economy of Elberta is largely based on tourism and retail. The town is home to several restaurants, shops, and other businesses. The town is also home to a number of small manufacturing companies.
The town is also home to a number of agricultural businesses, including peach orchards, vegetable farms, and nurseries.
Demographics
As of the 2010 census, Elberta had a population of 1,498. The racial makeup of the town was 94.2% White, 2.7% African American, 0.7% Native American, 0.3% Asian, 0.1% Pacific Islander, 0.7% from other races, and 1.2% from two or more races. Hispanic or Latino of any race were 2.3% of the population.
The median income for a household in Elberta was $37,500, and the median income for a family was $45,000. The per capita income for the town was $19,000. About 11.3% of families and 14.2% of the population were below the poverty line, including 18.2% of those under age 18 and 8.3% of those age 65 or over.
Common Questions
What is Per Capita Income in Elberta?
Per Capita income in Elberta is $27,418.
What is the Median Family Income in Elberta?
Median Family Income in Elberta is $55,625.
What is the Median Household income in Elberta?
Median Household Income in Elberta is $47,452.
What is Income or Wage Gap in Elberta?
Income or Wage Gap in Elberta is 44.6%.
Women in Elberta earn 55.4 cents for every dollar earned by a man.
What is Inequality or Gini Index in Elberta?
Inequality or Gini Index in Elberta is 0.42.
What is the Total Population of Elberta?
Total Population of Elberta is 2,140.
What is the Total Male Population of Elberta?
Total Male Population of Elberta is 1,119.
What is the Total Female Population of Elberta?
Total Female Population of Elberta is 1,021.
What is the Ratio of Males per 100 Females in Elberta?
There are 109.60 Males per 100 Females in Elberta.
What is the Ratio of Females per 100 Males in Elberta?
There are 91.24 Females per 100 Males in Elberta.
What is the Median Population Age in Elberta?
Median Population Age in Elberta is 49.2 Years.
What is the Average Family Size in Elberta
Average Family Size in Elberta is 3.2 People.
What is the Average Household Size in Elberta
Average Household Size in Elberta is 2.2 People.
How Large is the Labor Force in Elberta?
There are 1,113 People in the Labor Forcein in Elberta.
What is the Percentage of People in the Labor Force in Elberta?
59.8% of People are in the Labor Force in Elberta.
What is the Unemployment Rate in Elberta?
Unemployment Rate in Elberta is 4.2%.