Zip Codes with the Highest Percentage of Population with a Degree in Liberal Arts and History in Northport, AL
RELATED REPORTS & OPTIONS
Liberal Arts and History
Northport
Compare Zip Codes
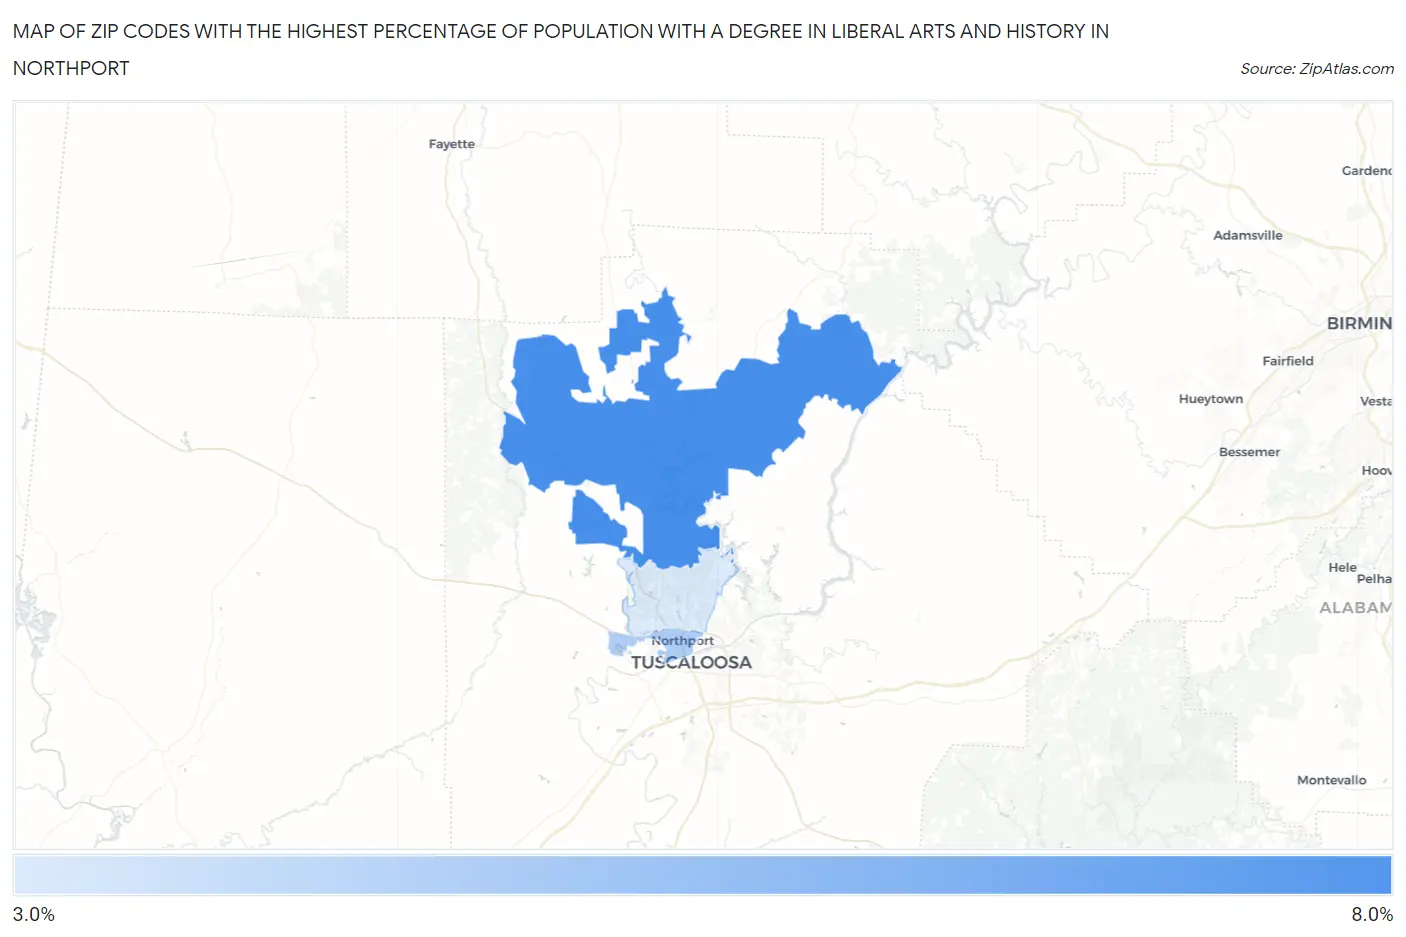
Map of Zip Codes with the Highest Percentage of Population with a Degree in Liberal Arts and History in Northport
3.3%
6.7%
Zip Codes with the Highest Percentage of Population with a Degree in Liberal Arts and History in Northport, AL
| Zip Code | % Graduates | vs State | vs National | |
| 1. | 35475 | 6.7% | 4.6%(+2.20)#123 | 4.9%(+1.88)#6,835 |
| 2. | 35476 | 4.4% | 4.6%(-0.176)#266 | 4.9%(-0.497)#13,373 |
| 3. | 35473 | 3.3% | 4.6%(-1.24)#322 | 4.9%(-1.56)#17,268 |
1
Common Questions
What are the Top Zip Codes with the Highest Percentage of Population with a Degree in Liberal Arts and History in Northport, AL?
Top Zip Codes with the Highest Percentage of Population with a Degree in Liberal Arts and History in Northport, AL are:
What zip code has the Highest Percentage of Population with a Degree in Liberal Arts and History in Northport, AL?
35475 has the Highest Percentage of Population with a Degree in Liberal Arts and History in Northport, AL with 6.7%.
What is the Percentage of Population with a Degree in Liberal Arts and History in Northport, AL?
Percentage of Population with a Degree in Liberal Arts and History in Northport is 3.5%.
What is the Percentage of Population with a Degree in Liberal Arts and History in Alabama?
Percentage of Population with a Degree in Liberal Arts and History in Alabama is 4.6%.
What is the Percentage of Population with a Degree in Liberal Arts and History in the United States?
Percentage of Population with a Degree in Liberal Arts and History in the United States is 4.9%.