Mosses, AL Map & Demographics
Mosses Map
Mosses Overview
$15,003
PER CAPITA INCOME
$31,574
AVG FAMILY INCOME
$28,100
AVG HOUSEHOLD INCOME
25.3%
WAGE / INCOME GAP [ % ]
74.7¢/ $1
WAGE / INCOME GAP [ $ ]
0.55
INEQUALITY / GINI INDEX
789
TOTAL POPULATION
355
MALE POPULATION
434
FEMALE POPULATION
81.80
MALES / 100 FEMALES
122.25
FEMALES / 100 MALES
36.3
MEDIAN AGE
4.2
AVG FAMILY SIZE
2.8
AVG HOUSEHOLD SIZE
252
LABOR FORCE [ PEOPLE ]
40.6%
PERCENT IN LABOR FORCE
8.2%
UNEMPLOYMENT RATE
Income in Mosses
Income Overview in Mosses
Per Capita Income in Mosses is $15,003, while median incomes of families and households are $31,574 and $28,100 respectively.
| Characteristic | Number | Measure |
| Per Capita Income | 789 | $15,003 |
| Median Family Income | 160 | $31,574 |
| Mean Family Income | 160 | $49,466 |
| Median Household Income | 280 | $28,100 |
| Mean Household Income | 280 | $35,408 |
| Income Deficit | 160 | $0 |
| Wage / Income Gap (%) | 789 | 25.28% |
| Wage / Income Gap ($) | 789 | 74.72¢ per $1 |
| Gini / Inequality Index | 789 | 0.55 |
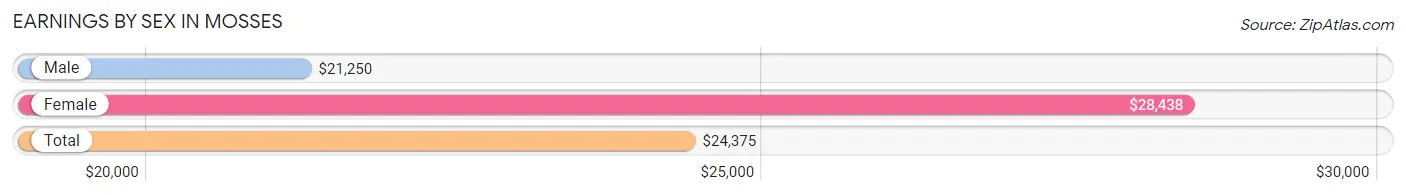
Earnings by Sex in Mosses
Average Earnings in Mosses are $24,375, $21,250 for men and $28,438 for women, a difference of 25.3%.
| Sex | Number | Average Earnings |
| Male | 116 (43.9%) | $21,250 |
| Female | 148 (56.1%) | $28,438 |
| Total | 264 (100.0%) | $24,375 |
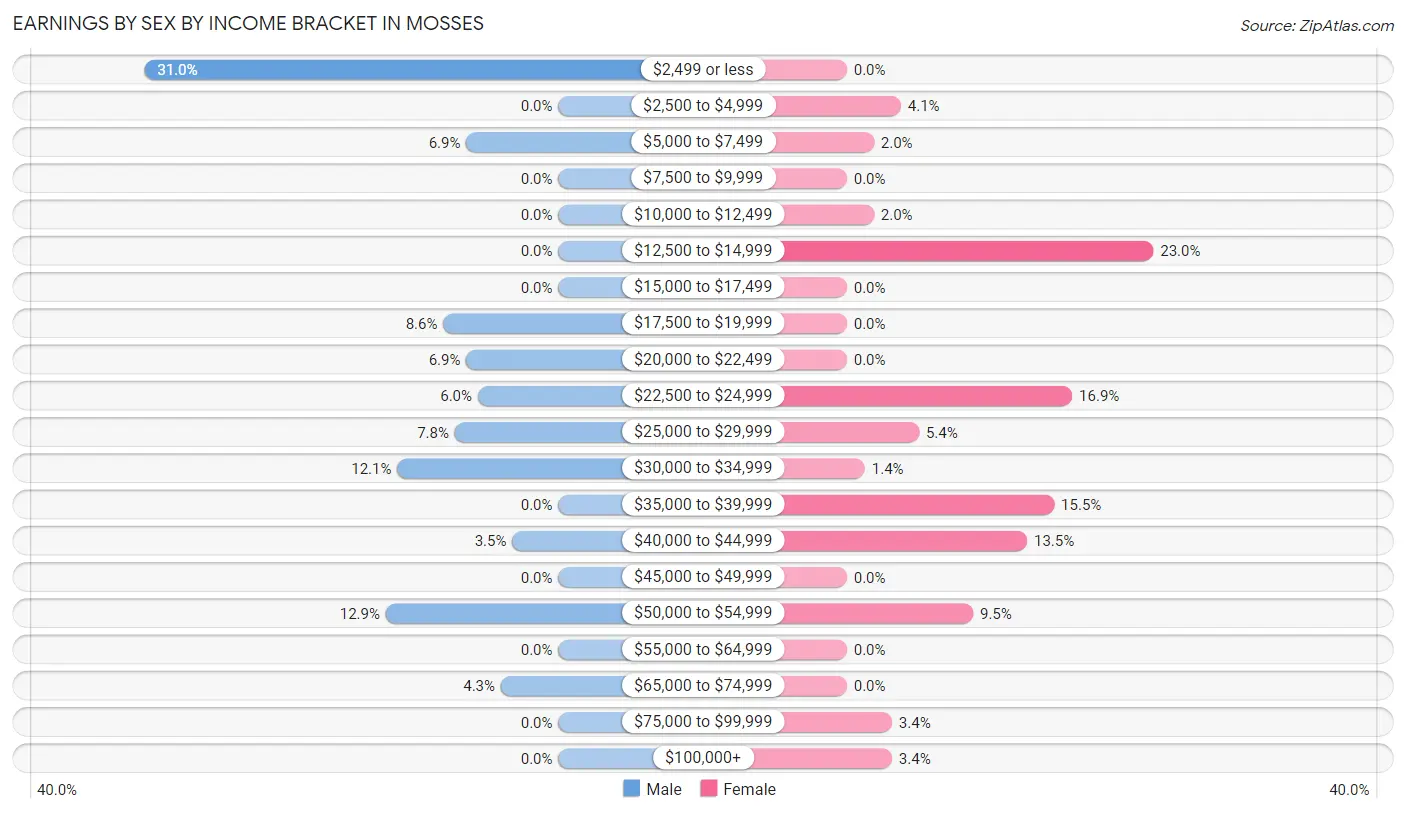
Earnings by Sex by Income Bracket in Mosses
The most common earnings brackets in Mosses are $2,499 or less for men (36 | 31.0%) and $12,500 to $14,999 for women (34 | 23.0%).
| Income | Male | Female |
| $2,499 or less | 36 (31.0%) | 0 (0.0%) |
| $2,500 to $4,999 | 0 (0.0%) | 6 (4.1%) |
| $5,000 to $7,499 | 8 (6.9%) | 3 (2.0%) |
| $7,500 to $9,999 | 0 (0.0%) | 0 (0.0%) |
| $10,000 to $12,499 | 0 (0.0%) | 3 (2.0%) |
| $12,500 to $14,999 | 0 (0.0%) | 34 (23.0%) |
| $15,000 to $17,499 | 0 (0.0%) | 0 (0.0%) |
| $17,500 to $19,999 | 10 (8.6%) | 0 (0.0%) |
| $20,000 to $22,499 | 8 (6.9%) | 0 (0.0%) |
| $22,500 to $24,999 | 7 (6.0%) | 25 (16.9%) |
| $25,000 to $29,999 | 9 (7.8%) | 8 (5.4%) |
| $30,000 to $34,999 | 14 (12.1%) | 2 (1.3%) |
| $35,000 to $39,999 | 0 (0.0%) | 23 (15.5%) |
| $40,000 to $44,999 | 4 (3.5%) | 20 (13.5%) |
| $45,000 to $49,999 | 0 (0.0%) | 0 (0.0%) |
| $50,000 to $54,999 | 15 (12.9%) | 14 (9.5%) |
| $55,000 to $64,999 | 0 (0.0%) | 0 (0.0%) |
| $65,000 to $74,999 | 5 (4.3%) | 0 (0.0%) |
| $75,000 to $99,999 | 0 (0.0%) | 5 (3.4%) |
| $100,000+ | 0 (0.0%) | 5 (3.4%) |
| Total | 116 (100.0%) | 148 (100.0%) |
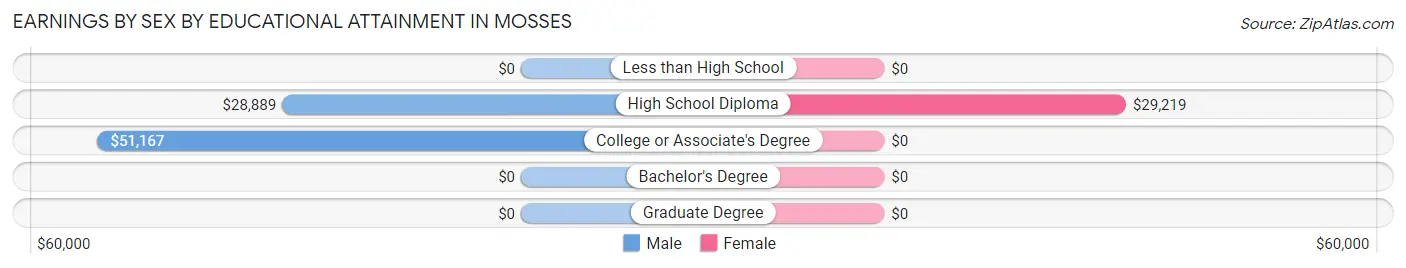
Earnings by Sex by Educational Attainment in Mosses
Average earnings in Mosses are $28,611 for men and $28,438 for women, a difference of 0.6%. Men with an educational attainment of college or associate's degree enjoy the highest average annual earnings of $51,167, while those with high school diploma education earn the least with $28,889. Women with an educational attainment of high school diploma earn the most with the average annual earnings of $29,219, while those with high school diploma education have the smallest earnings of $29,219.
| Educational Attainment | Male Income | Female Income |
| Less than High School | - | - |
| High School Diploma | $28,889 | $29,219 |
| College or Associate's Degree | $51,167 | $0 |
| Bachelor's Degree | - | - |
| Graduate Degree | - | - |
| Total | $28,611 | $28,438 |
Family Income in Mosses
Family Income Brackets in Mosses
According to the Mosses family income data, there are 43 families falling into the $25,000 to $34,999 income range, which is the most common income bracket and makes up 26.9% of all families.
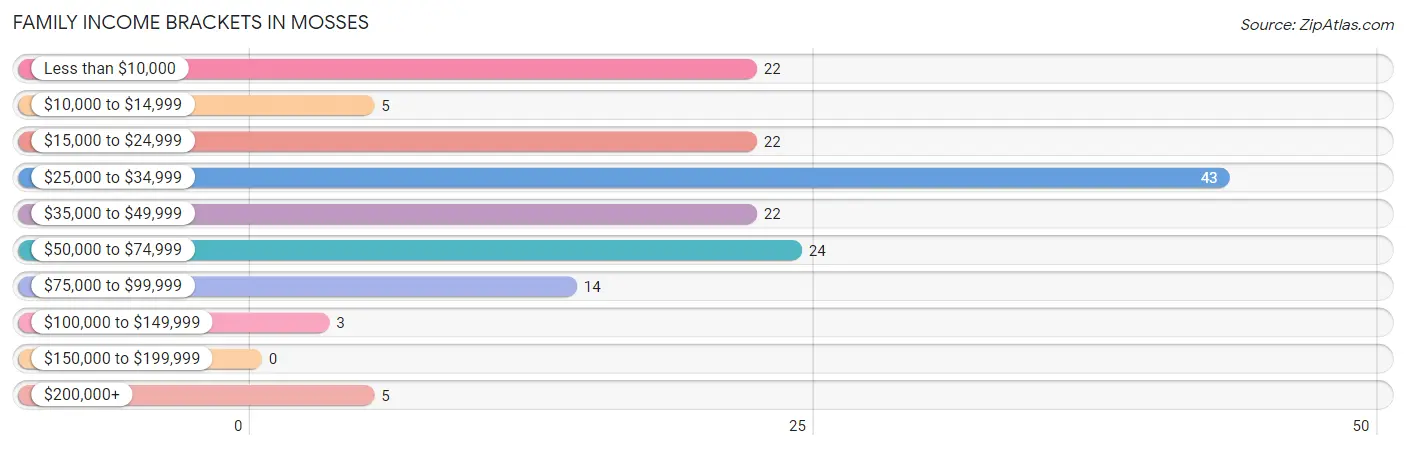
| Income Bracket | # Families | % Families |
| Less than $10,000 | 22 | 13.8% |
| $10,000 to $14,999 | 5 | 3.1% |
| $15,000 to $24,999 | 22 | 13.8% |
| $25,000 to $34,999 | 43 | 26.9% |
| $35,000 to $49,999 | 22 | 13.8% |
| $50,000 to $74,999 | 24 | 15.0% |
| $75,000 to $99,999 | 14 | 8.8% |
| $100,000 to $149,999 | 3 | 1.9% |
| $150,000 to $199,999 | 0 | 0.0% |
| $200,000+ | 5 | 3.1% |
Family Income by Famaliy Size in Mosses
3-person families (76 | 47.5%) account for the highest median family income in Mosses with $35,357 per family, while 2-person families (38 | 23.7%) have the highest median income of $15,178 per family member.
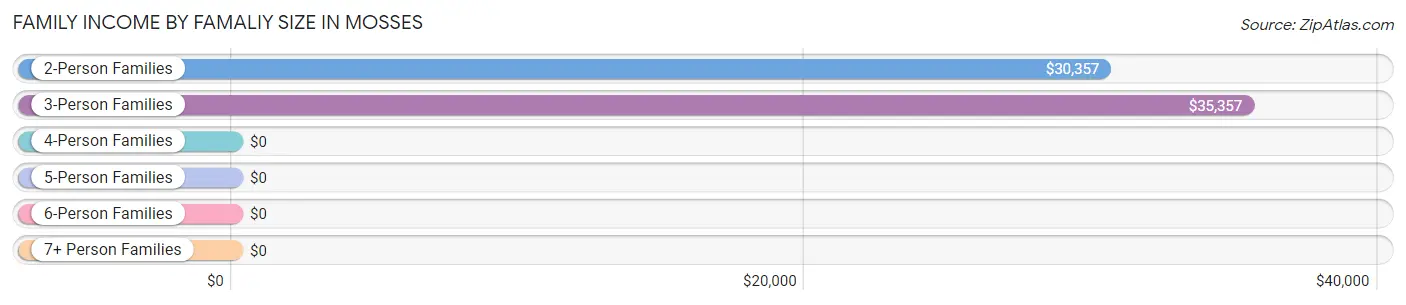
| Income Bracket | # Families | Median Income |
| 2-Person Families | 38 (23.7%) | $30,357 |
| 3-Person Families | 76 (47.5%) | $35,357 |
| 4-Person Families | 34 (21.2%) | $0 |
| 5-Person Families | 0 (0.0%) | $0 |
| 6-Person Families | 0 (0.0%) | $0 |
| 7+ Person Families | 12 (7.5%) | $0 |
| Total | 160 (100.0%) | $31,574 |
Family Income by Number of Earners in Mosses
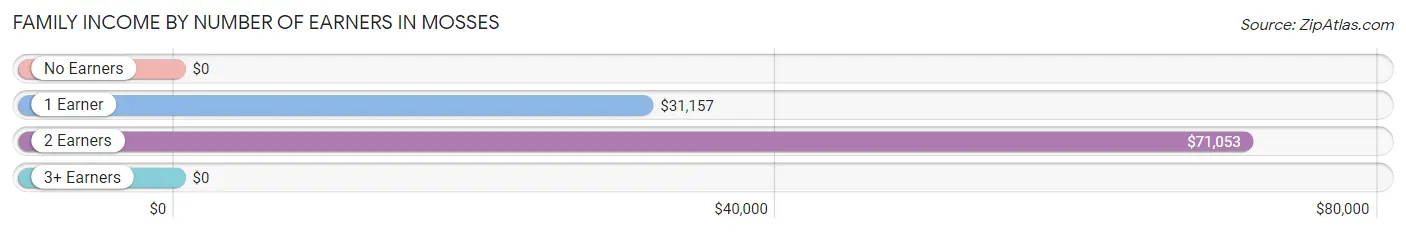
| Number of Earners | # Families | Median Income |
| No Earners | 29 (18.1%) | $0 |
| 1 Earner | 97 (60.6%) | $31,157 |
| 2 Earners | 34 (21.2%) | $71,053 |
| 3+ Earners | 0 (0.0%) | $0 |
| Total | 160 (100.0%) | $31,574 |
Household Income in Mosses
Household Income Brackets in Mosses
With 70 households falling in the category, the less than $10,000 income range is the most frequent in Mosses, accounting for 25.0% of all households.
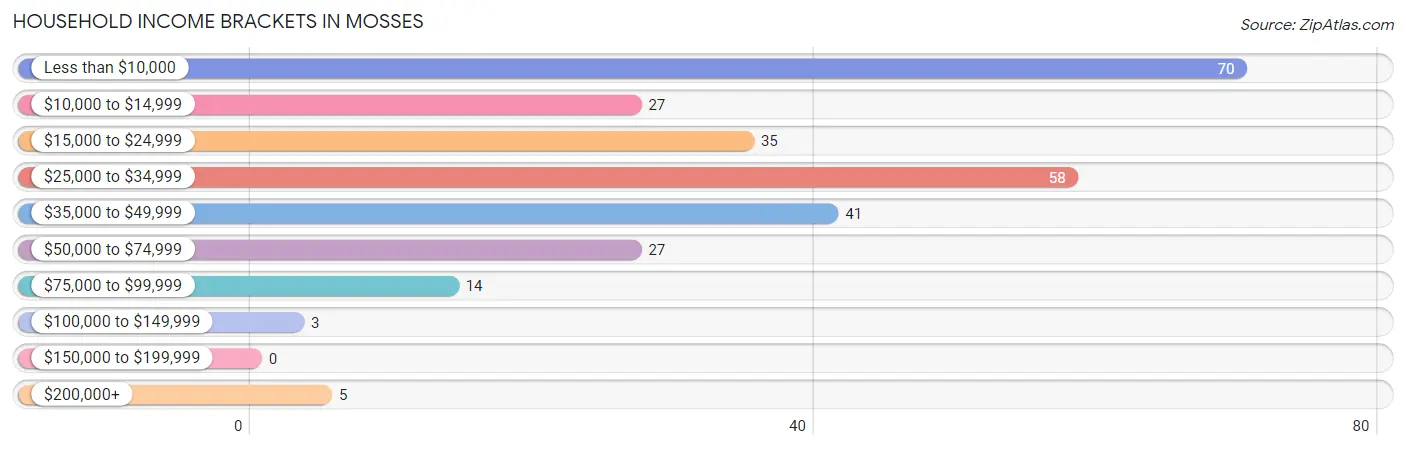
| Income Bracket | # Households | % Households |
| Less than $10,000 | 70 | 25.0% |
| $10,000 to $14,999 | 27 | 9.6% |
| $15,000 to $24,999 | 35 | 12.5% |
| $25,000 to $34,999 | 58 | 20.7% |
| $35,000 to $49,999 | 41 | 14.6% |
| $50,000 to $74,999 | 27 | 9.6% |
| $75,000 to $99,999 | 14 | 5.0% |
| $100,000 to $149,999 | 3 | 1.1% |
| $150,000 to $199,999 | 0 | 0.0% |
| $200,000+ | 5 | 1.8% |
Household Income by Householder Age in Mosses
The median household income in Mosses is $28,100, with the highest median household income of $30,714 found in the 25 to 44 years age bracket for the primary householder. A total of 80 households (28.6%) fall into this category. Meanwhile, the 15 to 24 years age bracket for the primary householder has the lowest median household income of $0, with 13 households (4.6%) in this group.
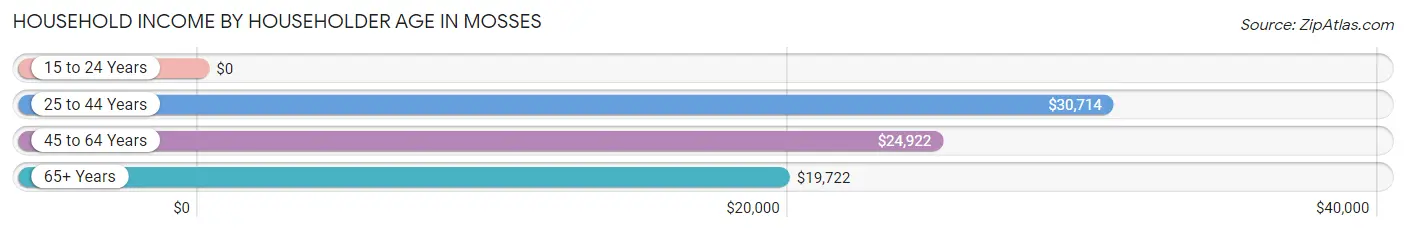
| Income Bracket | # Households | Median Income |
| 15 to 24 Years | 13 (4.6%) | $0 |
| 25 to 44 Years | 80 (28.6%) | $30,714 |
| 45 to 64 Years | 119 (42.5%) | $24,922 |
| 65+ Years | 68 (24.3%) | $19,722 |
| Total | 280 (100.0%) | $28,100 |
Poverty in Mosses
Income Below Poverty by Sex and Age in Mosses
With 37.8% poverty level for males and 47.9% for females among the residents of Mosses, 15 year old males and under 5 year old females are the most vulnerable to poverty, with 17 males (94.4%) and 9 females (100.0%) in their respective age groups living below the poverty level.
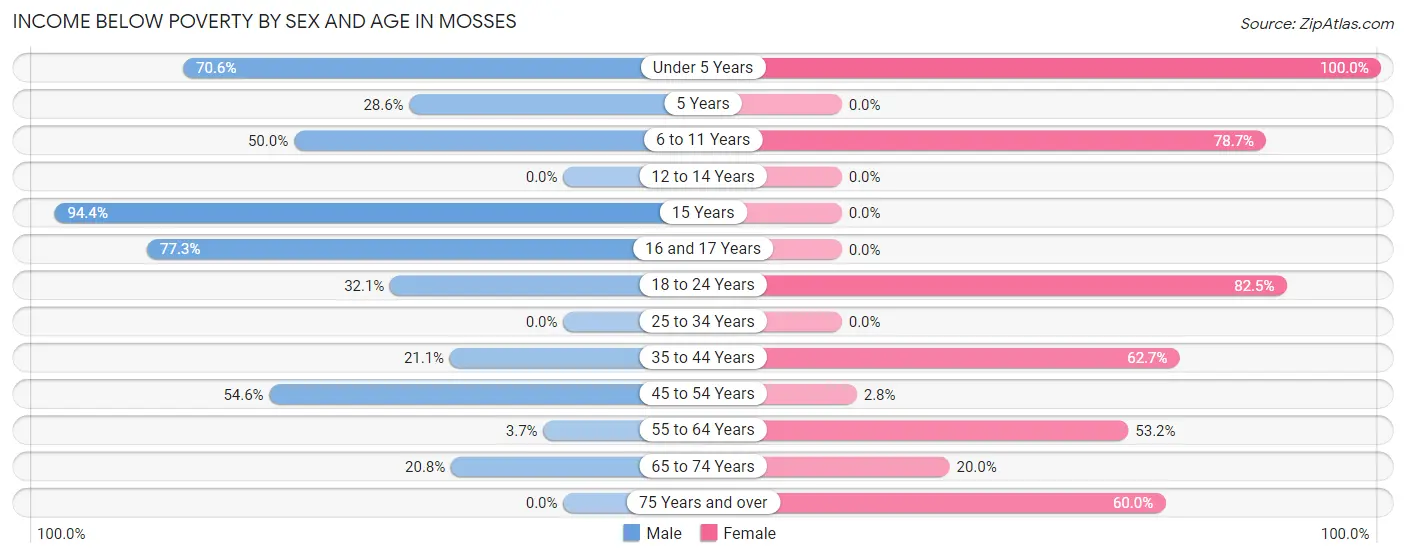
| Age Bracket | Male | Female |
| Under 5 Years | 24 (70.6%) | 9 (100.0%) |
| 5 Years | 2 (28.6%) | 0 (0.0%) |
| 6 to 11 Years | 8 (50.0%) | 37 (78.7%) |
| 12 to 14 Years | 0 (0.0%) | 0 (0.0%) |
| 15 Years | 17 (94.4%) | 0 (0.0%) |
| 16 and 17 Years | 17 (77.3%) | 0 (0.0%) |
| 18 to 24 Years | 18 (32.1%) | 66 (82.5%) |
| 25 to 34 Years | 0 (0.0%) | 0 (0.0%) |
| 35 to 44 Years | 12 (21.0%) | 52 (62.6%) |
| 45 to 54 Years | 30 (54.5%) | 1 (2.8%) |
| 55 to 64 Years | 1 (3.7%) | 25 (53.2%) |
| 65 to 74 Years | 5 (20.8%) | 6 (20.0%) |
| 75 Years and over | 0 (0.0%) | 12 (60.0%) |
| Total | 134 (37.8%) | 208 (47.9%) |
Income Above Poverty by Sex and Age in Mosses
According to the poverty statistics in Mosses, males aged 12 to 14 years and females aged 5 years are the age groups that are most secure financially, with 100.0% of males and 100.0% of females in these age groups living above the poverty line.
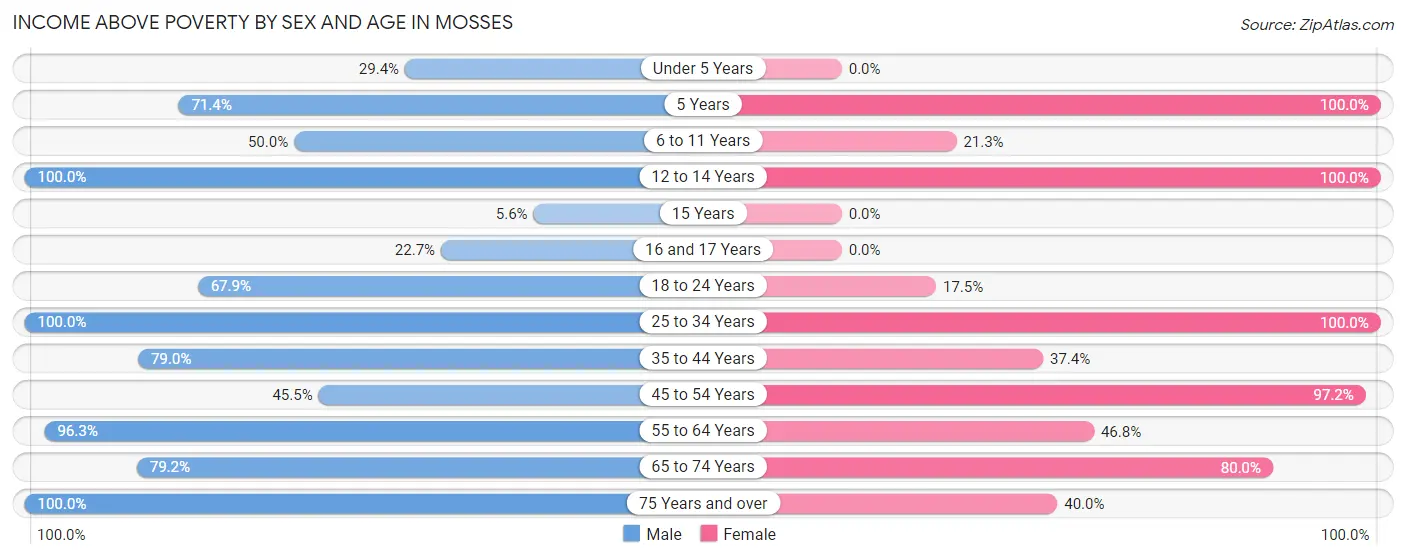
| Age Bracket | Male | Female |
| Under 5 Years | 10 (29.4%) | 0 (0.0%) |
| 5 Years | 5 (71.4%) | 19 (100.0%) |
| 6 to 11 Years | 8 (50.0%) | 10 (21.3%) |
| 12 to 14 Years | 2 (100.0%) | 17 (100.0%) |
| 15 Years | 1 (5.6%) | 0 (0.0%) |
| 16 and 17 Years | 5 (22.7%) | 0 (0.0%) |
| 18 to 24 Years | 38 (67.9%) | 14 (17.5%) |
| 25 to 34 Years | 20 (100.0%) | 46 (100.0%) |
| 35 to 44 Years | 45 (78.9%) | 31 (37.3%) |
| 45 to 54 Years | 25 (45.5%) | 35 (97.2%) |
| 55 to 64 Years | 26 (96.3%) | 22 (46.8%) |
| 65 to 74 Years | 19 (79.2%) | 24 (80.0%) |
| 75 Years and over | 17 (100.0%) | 8 (40.0%) |
| Total | 221 (62.3%) | 226 (52.1%) |
Income Below Poverty Among Married-Couple Families in Mosses
The poverty statistics for married-couple families in Mosses show that 2.0% or 1 of the total 51 families live below the poverty line. Families with no children have the highest poverty rate of 2.0%, comprising of 1 families. On the other hand, families with 1 or 2 children have the lowest poverty rate of 0.0%, which includes 0 families.
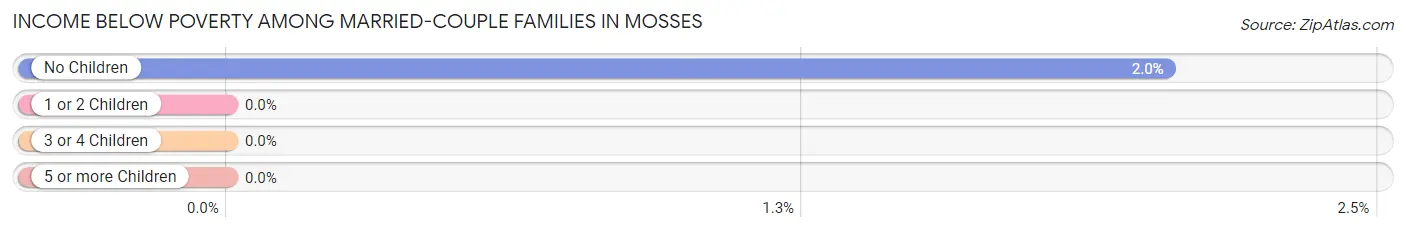
| Children | Above Poverty | Below Poverty |
| No Children | 48 (98.0%) | 1 (2.0%) |
| 1 or 2 Children | 2 (100.0%) | 0 (0.0%) |
| 3 or 4 Children | 0 (0.0%) | 0 (0.0%) |
| 5 or more Children | 0 (0.0%) | 0 (0.0%) |
| Total | 50 (98.0%) | 1 (2.0%) |
Income Below Poverty Among Single-Parent Households in Mosses
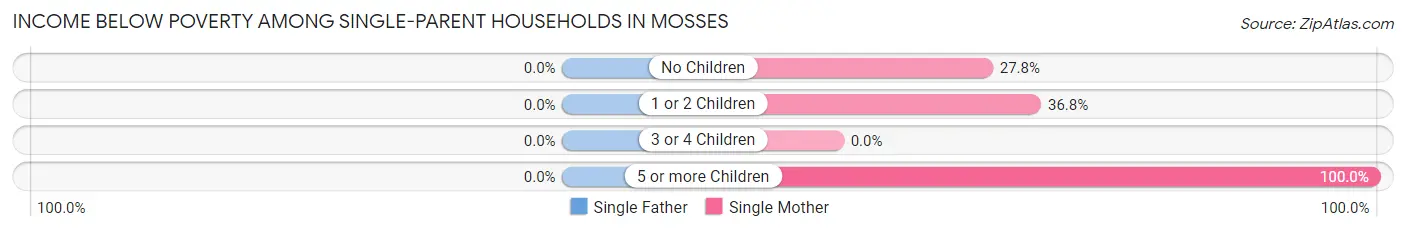
| Children | Single Father | Single Mother |
| No Children | 0 (0.0%) | 5 (27.8%) |
| 1 or 2 Children | 0 (0.0%) | 25 (36.8%) |
| 3 or 4 Children | 0 (0.0%) | 0 (0.0%) |
| 5 or more Children | 0 (0.0%) | 12 (100.0%) |
| Total | 0 (0.0%) | 42 (42.9%) |
Income Below Poverty Among Married-Couple vs Single-Parent Households in Mosses
The poverty data for Mosses shows that 1 of the married-couple family households (2.0%) and 42 of the single-parent households (38.5%) are living below the poverty level. Within the married-couple family households, those with no children have the highest poverty rate, with 1 households (2.0%) falling below the poverty line. Among the single-parent households, those with 5 or more children have the highest poverty rate, with 12 household (100.0%) living below poverty.
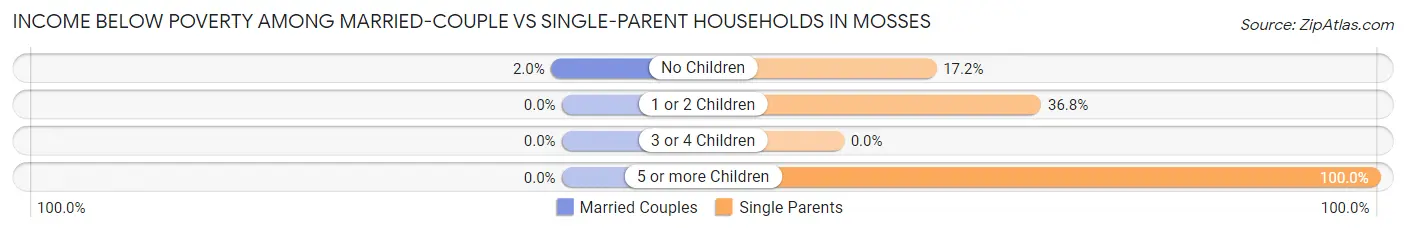
| Children | Married-Couple Families | Single-Parent Households |
| No Children | 1 (2.0%) | 5 (17.2%) |
| 1 or 2 Children | 0 (0.0%) | 25 (36.8%) |
| 3 or 4 Children | 0 (0.0%) | 0 (0.0%) |
| 5 or more Children | 0 (0.0%) | 12 (100.0%) |
| Total | 1 (2.0%) | 42 (38.5%) |
Race in Mosses
The most populous races in Mosses are , and Black / African American (789 | 100.0%).
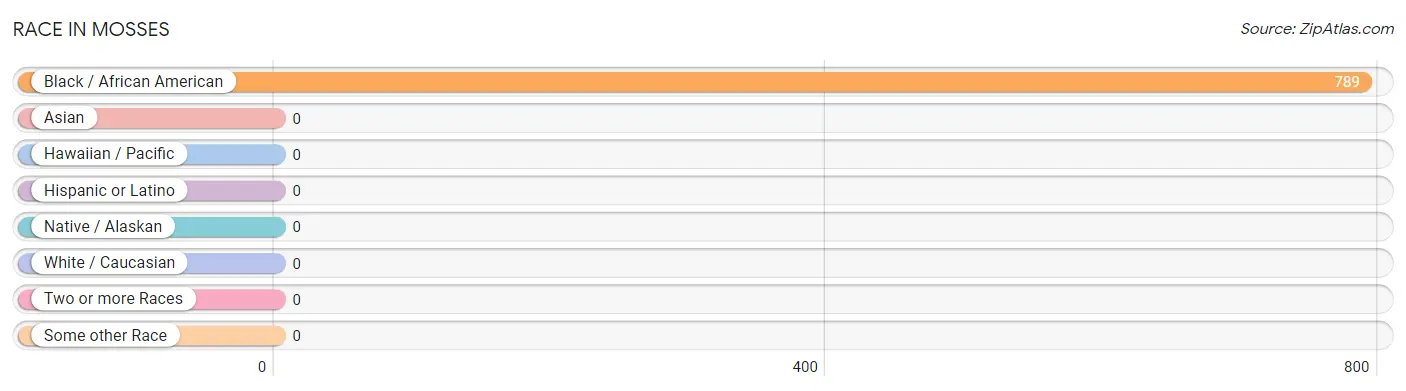
| Race | # Population | % Population |
| Asian | 0 | 0.0% |
| Black / African American | 789 | 100.0% |
| Hawaiian / Pacific | 0 | 0.0% |
| Hispanic or Latino | 0 | 0.0% |
| Native / Alaskan | 0 | 0.0% |
| White / Caucasian | 0 | 0.0% |
| Two or more Races | 0 | 0.0% |
| Some other Race | 0 | 0.0% |
| Total | 789 | 100.0% |
Ancestry in Mosses
The most populous ancestries reported in Mosses are , and American (80 | 10.1%), together accounting for 10.1% of all Mosses residents.

| Ancestry | # Population | % Population |
| American | 80 | 10.1% | View All 1 Rows |
Immigrants in Mosses

| Immigration Origin | # Population | % Population | View All 0 Rows |
Sex and Age in Mosses
Sex and Age in Mosses
The most populous age groups in Mosses are 15 to 19 Years (76 | 21.4%) for men and 10 to 14 Years (54 | 12.4%) for women.
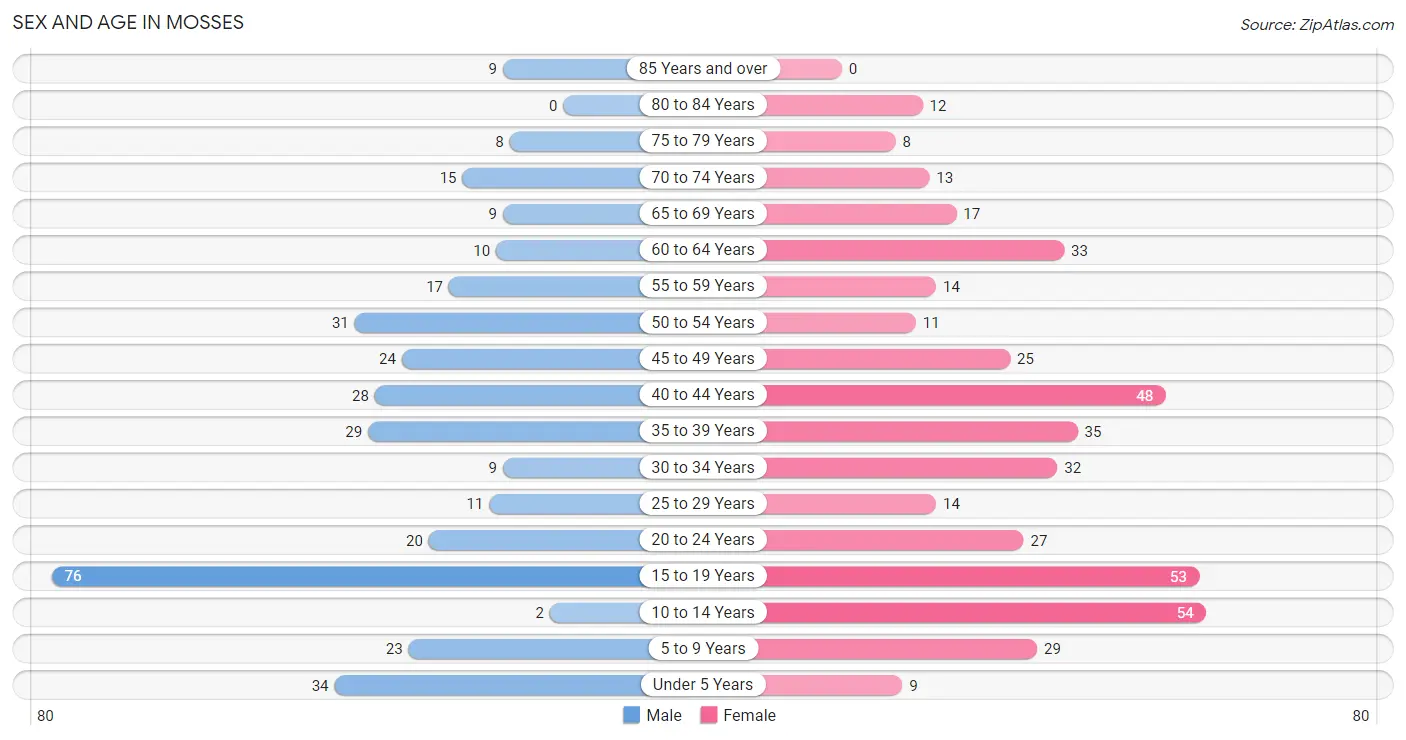
| Age Bracket | Male | Female |
| Under 5 Years | 34 (9.6%) | 9 (2.1%) |
| 5 to 9 Years | 23 (6.5%) | 29 (6.7%) |
| 10 to 14 Years | 2 (0.6%) | 54 (12.4%) |
| 15 to 19 Years | 76 (21.4%) | 53 (12.2%) |
| 20 to 24 Years | 20 (5.6%) | 27 (6.2%) |
| 25 to 29 Years | 11 (3.1%) | 14 (3.2%) |
| 30 to 34 Years | 9 (2.5%) | 32 (7.4%) |
| 35 to 39 Years | 29 (8.2%) | 35 (8.1%) |
| 40 to 44 Years | 28 (7.9%) | 48 (11.1%) |
| 45 to 49 Years | 24 (6.8%) | 25 (5.8%) |
| 50 to 54 Years | 31 (8.7%) | 11 (2.5%) |
| 55 to 59 Years | 17 (4.8%) | 14 (3.2%) |
| 60 to 64 Years | 10 (2.8%) | 33 (7.6%) |
| 65 to 69 Years | 9 (2.5%) | 17 (3.9%) |
| 70 to 74 Years | 15 (4.2%) | 13 (3.0%) |
| 75 to 79 Years | 8 (2.2%) | 8 (1.8%) |
| 80 to 84 Years | 0 (0.0%) | 12 (2.8%) |
| 85 Years and over | 9 (2.5%) | 0 (0.0%) |
| Total | 355 (100.0%) | 434 (100.0%) |
Families and Households in Mosses
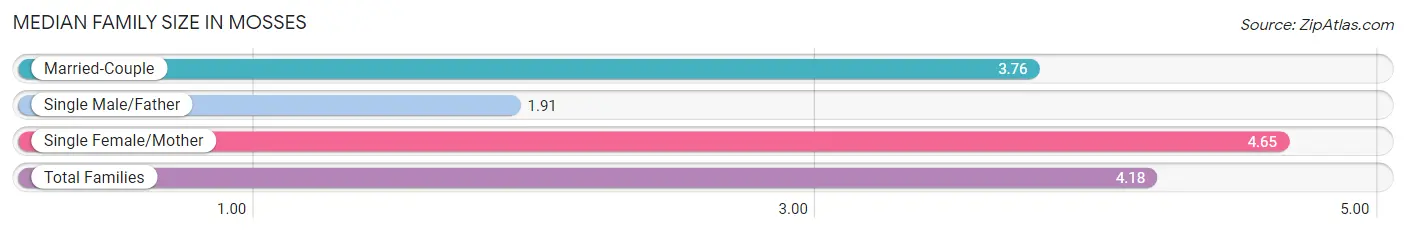
Median Family Size in Mosses
The median family size in Mosses is 4.18 persons per family, with single female/mother families (98 | 61.3%) accounting for the largest median family size of 4.65 persons per family. On the other hand, single male/father families (11 | 6.9%) represent the smallest median family size with 1.91 persons per family.
| Family Type | # Families | Family Size |
| Married-Couple | 51 (31.9%) | 3.76 |
| Single Male/Father | 11 (6.9%) | 1.91 |
| Single Female/Mother | 98 (61.3%) | 4.65 |
| Total Families | 160 (100.0%) | 4.18 |
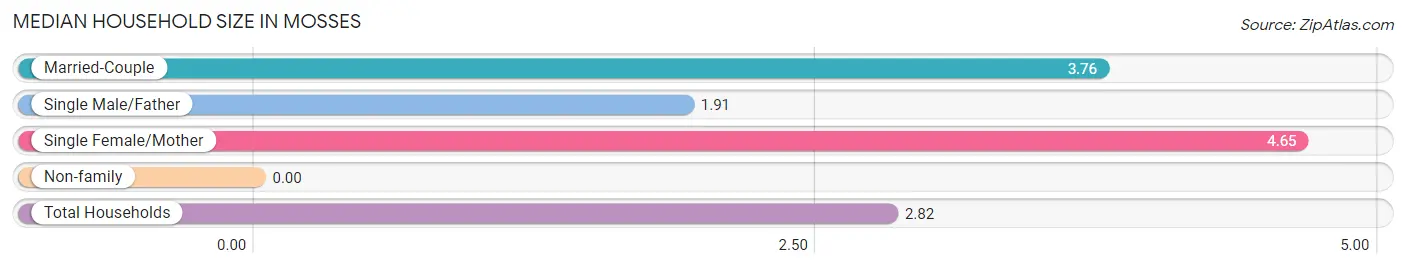
Median Household Size in Mosses
| Household Type | # Households | Household Size |
| Married-Couple | 51 (18.2%) | 3.76 |
| Single Male/Father | 11 (3.9%) | 1.91 |
| Single Female/Mother | 98 (35.0%) | 4.65 |
| Non-family | 120 (42.9%) | - |
| Total Households | 280 (100.0%) | 2.82 |
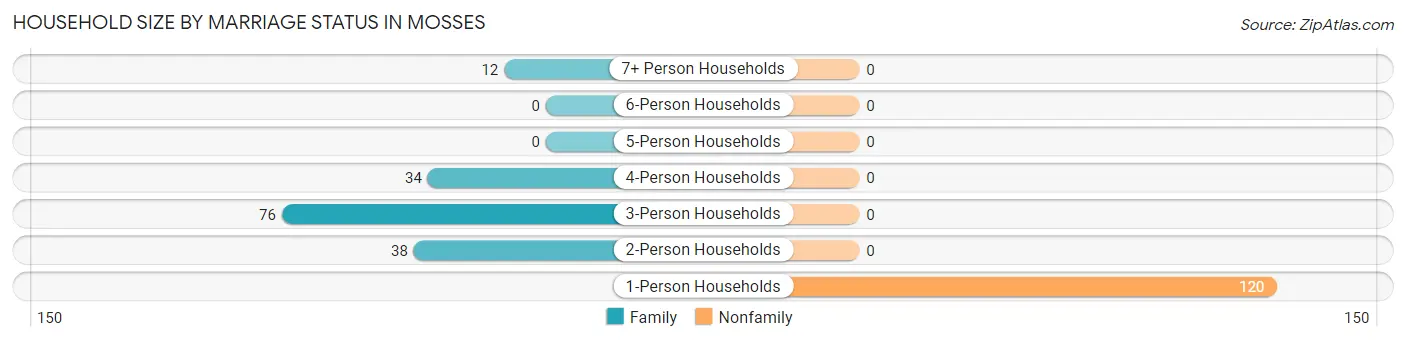
Household Size by Marriage Status in Mosses
Out of a total of 280 households in Mosses, 160 (57.1%) are family households, while 120 (42.9%) are nonfamily households. The most numerous type of family households are 3-person households, comprising 76, and the most common type of nonfamily households are 1-person households, comprising 120.
| Household Size | Family Households | Nonfamily Households |
| 1-Person Households | - | 120 (42.9%) |
| 2-Person Households | 38 (13.6%) | 0 (0.0%) |
| 3-Person Households | 76 (27.1%) | 0 (0.0%) |
| 4-Person Households | 34 (12.1%) | 0 (0.0%) |
| 5-Person Households | 0 (0.0%) | 0 (0.0%) |
| 6-Person Households | 0 (0.0%) | 0 (0.0%) |
| 7+ Person Households | 12 (4.3%) | 0 (0.0%) |
| Total | 160 (57.1%) | 120 (42.9%) |
Female Fertility in Mosses
Fertility by Age in Mosses
| Age Bracket | Women with Births | Births / 1,000 Women |
| 15 to 19 years | 0 (0.0%) | 0.0 |
| 20 to 34 years | 0 (0.0%) | 0.0 |
| 35 to 50 years | 0 (0.0%) | 0.0 |
| Total | 0 (0.0%) | 0.0 |
Fertility by Age by Marriage Status in Mosses
| Age Bracket | Married | Unmarried |
| 15 to 19 years | 0 (0.0%) | 0 (0.0%) |
| 20 to 34 years | 0 (0.0%) | 0 (0.0%) |
| 35 to 50 years | 0 (0.0%) | 0 (0.0%) |
| Total | 0 (0.0%) | 0 (0.0%) |
Fertility by Education in Mosses
| Educational Attainment | Women with Births | Births / 1,000 Women |
| Less than High School | 0 (0.0%) | 0.0 |
| High School Diploma | 0 (0.0%) | 0.0 |
| College or Associate's Degree | 0 (0.0%) | 0.0 |
| Bachelor's Degree | 0 (0.0%) | 0.0 |
| Graduate Degree | 0 (0.0%) | 0.0 |
| Total | 0 (0.0%) | 0.0 |
Fertility by Education by Marriage Status in Mosses
| Educational Attainment | Married | Unmarried |
| Less than High School | 0 (0.0%) | 0 (0.0%) |
| High School Diploma | 0 (0.0%) | 0 (0.0%) |
| College or Associate's Degree | 0 (0.0%) | 0 (0.0%) |
| Bachelor's Degree | 0 (0.0%) | 0 (0.0%) |
| Graduate Degree | 0 (0.0%) | 0 (0.0%) |
| Total | 0 (0.0%) | 0 (0.0%) |
Employment Characteristics in Mosses
Employment by Class of Employer in Mosses
Among the 214 employed individuals in Mosses, private company employees (180 | 84.1%), not-for-profit organizations (14 | 6.5%), and state government employees (8 | 3.7%) make up the most common classes of employment.
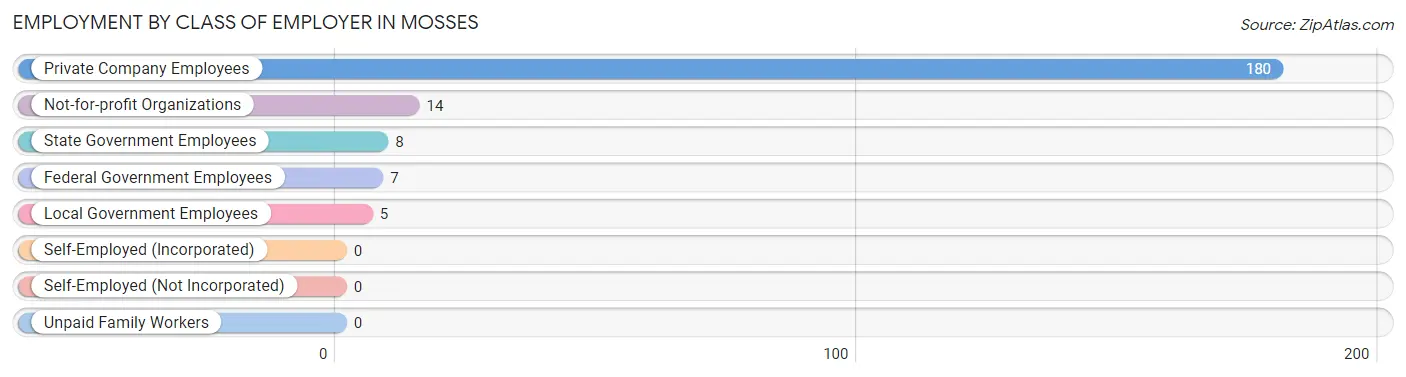
| Employer Class | # Employees | % Employees |
| Private Company Employees | 180 | 84.1% |
| Self-Employed (Incorporated) | 0 | 0.0% |
| Self-Employed (Not Incorporated) | 0 | 0.0% |
| Not-for-profit Organizations | 14 | 6.5% |
| Local Government Employees | 5 | 2.3% |
| State Government Employees | 8 | 3.7% |
| Federal Government Employees | 7 | 3.3% |
| Unpaid Family Workers | 0 | 0.0% |
| Total | 214 | 100.0% |
Employment Status by Age in Mosses
According to the labor force statistics for Mosses, out of the total population over 16 years of age (620), 40.6% or 252 individuals are in the labor force, with 8.2% or 21 of them unemployed. The age group with the highest labor force participation rate is 30 to 34 years, with 97.6% or 40 individuals in the labor force. Within the labor force, the 25 to 29 years age range has the highest percentage of unemployed individuals, with 77.8% or 14 of them being unemployed.
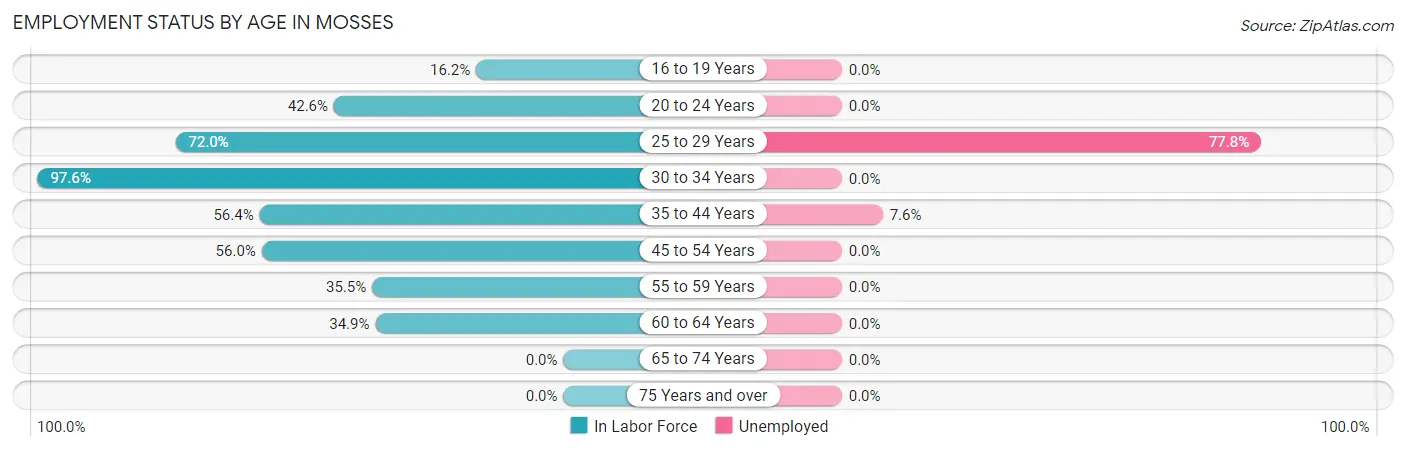
| Age Bracket | In Labor Force | Unemployed |
| 16 to 19 Years | 18 (16.2%) | 0 (0.0%) |
| 20 to 24 Years | 20 (42.6%) | 0 (0.0%) |
| 25 to 29 Years | 18 (72.0%) | 14 (77.8%) |
| 30 to 34 Years | 40 (97.6%) | 0 (0.0%) |
| 35 to 44 Years | 79 (56.4%) | 6 (7.6%) |
| 45 to 54 Years | 51 (56.0%) | 0 (0.0%) |
| 55 to 59 Years | 11 (35.5%) | 0 (0.0%) |
| 60 to 64 Years | 15 (34.9%) | 0 (0.0%) |
| 65 to 74 Years | 0 (0.0%) | 0 (0.0%) |
| 75 Years and over | 0 (0.0%) | 0 (0.0%) |
| Total | 252 (40.6%) | 21 (8.2%) |
Employment Status by Educational Attainment in Mosses
According to labor force statistics for Mosses, 57.7% of individuals (214) out of the total population between 25 and 64 years of age (371) are in the labor force, with 9.3% or 20 of them being unemployed. The group with the highest labor force participation rate are those with the educational attainment of high school diploma, with 69.5% or 137 individuals in the labor force. Within the labor force, individuals with high school diploma education have the highest percentage of unemployment, with 14.6% or 20 of them being unemployed.
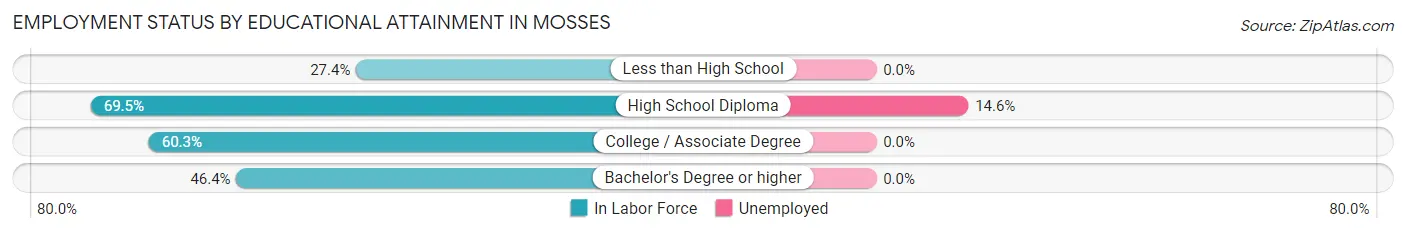
| Educational Attainment | In Labor Force | Unemployed |
| Less than High School | 20 (27.4%) | 0 (0.0%) |
| High School Diploma | 137 (69.5%) | 29 (14.6%) |
| College / Associate Degree | 44 (60.3%) | 0 (0.0%) |
| Bachelor's Degree or higher | 13 (46.4%) | 0 (0.0%) |
| Total | 214 (57.7%) | 35 (9.3%) |
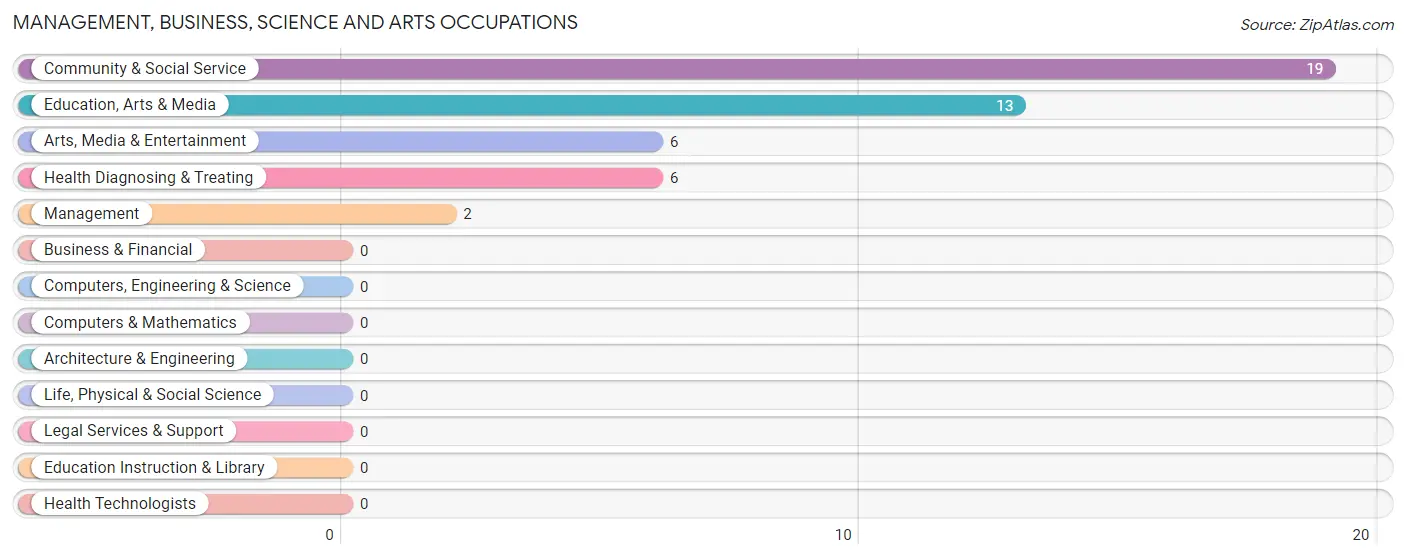
Employment Occupations by Sex in Mosses
Management, Business, Science and Arts Occupations
The most common Management, Business, Science and Arts occupations in Mosses are Community & Social Service (19 | 8.4%), Education, Arts & Media (13 | 5.8%), Arts, Media & Entertainment (6 | 2.7%), Health Diagnosing & Treating (6 | 2.7%), and Management (2 | 0.9%).
Management, Business, Science and Arts Occupations by Sex
Within the Management, Business, Science and Arts occupations in Mosses, the most male-oriented occupations are Arts, Media & Entertainment (100.0%), Community & Social Service (73.7%), and Education, Arts & Media (61.5%), while the most female-oriented occupations are Management (100.0%), Health Diagnosing & Treating (100.0%), and Education, Arts & Media (38.5%).
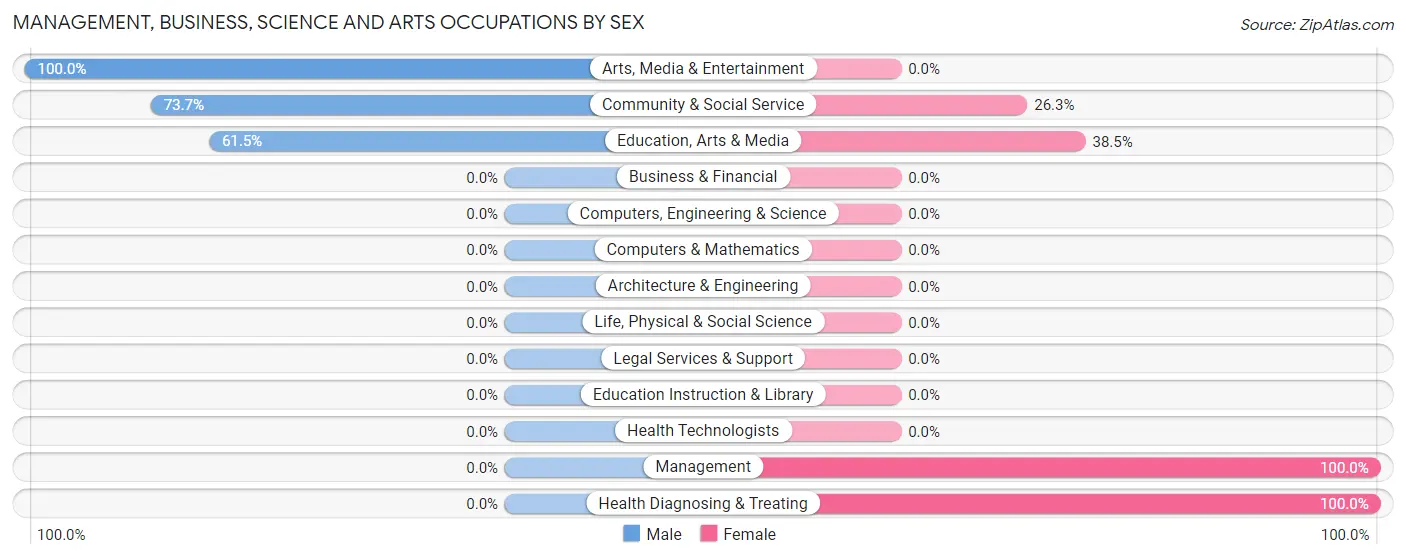
| Occupation | Male | Female |
| Management | 0 (0.0%) | 2 (100.0%) |
| Business & Financial | 0 (0.0%) | 0 (0.0%) |
| Computers, Engineering & Science | 0 (0.0%) | 0 (0.0%) |
| Computers & Mathematics | 0 (0.0%) | 0 (0.0%) |
| Architecture & Engineering | 0 (0.0%) | 0 (0.0%) |
| Life, Physical & Social Science | 0 (0.0%) | 0 (0.0%) |
| Community & Social Service | 14 (73.7%) | 5 (26.3%) |
| Education, Arts & Media | 8 (61.5%) | 5 (38.5%) |
| Legal Services & Support | 0 (0.0%) | 0 (0.0%) |
| Education Instruction & Library | 0 (0.0%) | 0 (0.0%) |
| Arts, Media & Entertainment | 6 (100.0%) | 0 (0.0%) |
| Health Diagnosing & Treating | 0 (0.0%) | 6 (100.0%) |
| Health Technologists | 0 (0.0%) | 0 (0.0%) |
| Total (Category) | 14 (51.8%) | 13 (48.1%) |
| Total (Overall) | 91 (40.4%) | 134 (59.6%) |
Services Occupations
The most common Services occupations in Mosses are , and Healthcare Support (8 | 3.6%).
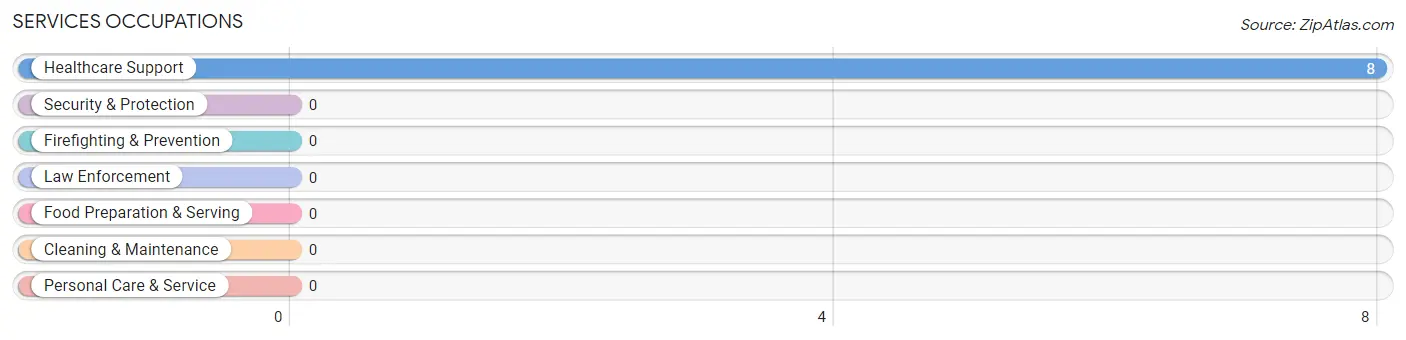
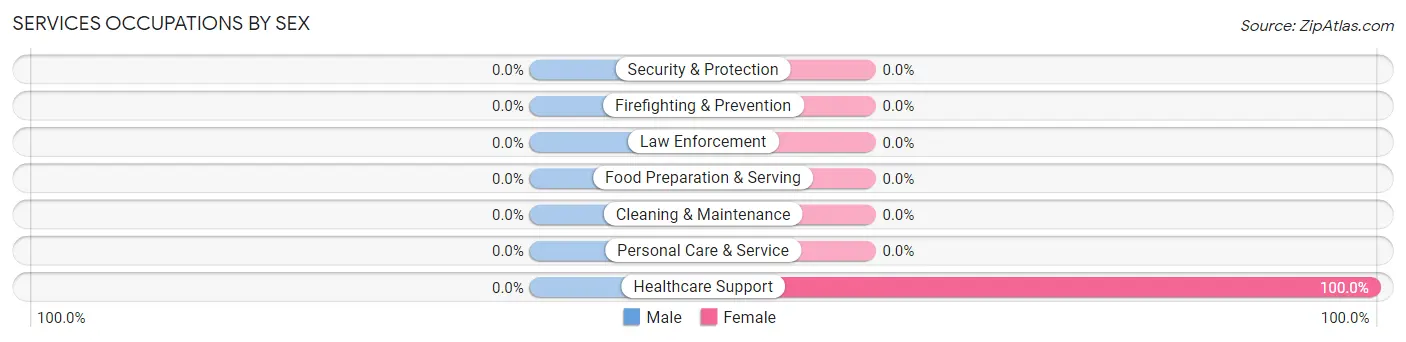
Services Occupations by Sex
| Occupation | Male | Female |
| Healthcare Support | 0 (0.0%) | 8 (100.0%) |
| Security & Protection | 0 (0.0%) | 0 (0.0%) |
| Firefighting & Prevention | 0 (0.0%) | 0 (0.0%) |
| Law Enforcement | 0 (0.0%) | 0 (0.0%) |
| Food Preparation & Serving | 0 (0.0%) | 0 (0.0%) |
| Cleaning & Maintenance | 0 (0.0%) | 0 (0.0%) |
| Personal Care & Service | 0 (0.0%) | 0 (0.0%) |
| Total (Category) | 0 (0.0%) | 8 (100.0%) |
| Total (Overall) | 91 (40.4%) | 134 (59.6%) |
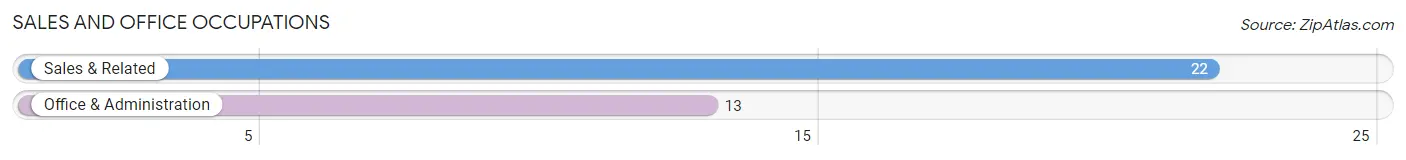
Sales and Office Occupations
The most common Sales and Office occupations in Mosses are Sales & Related (22 | 9.8%), and Office & Administration (13 | 5.8%).
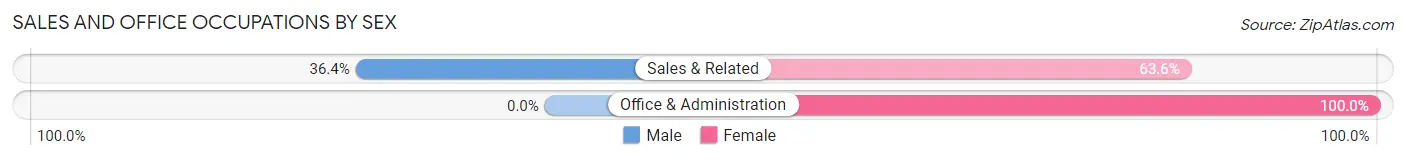
Sales and Office Occupations by Sex
| Occupation | Male | Female |
| Sales & Related | 8 (36.4%) | 14 (63.6%) |
| Office & Administration | 0 (0.0%) | 13 (100.0%) |
| Total (Category) | 8 (22.9%) | 27 (77.1%) |
| Total (Overall) | 91 (40.4%) | 134 (59.6%) |
Natural Resources, Construction and Maintenance Occupations
The most common Natural Resources, Construction and Maintenance occupations in Mosses are Farming, Fishing & Forestry (15 | 6.7%), Construction & Extraction (13 | 5.8%), and Installation, Maintenance & Repair (1 | 0.4%).
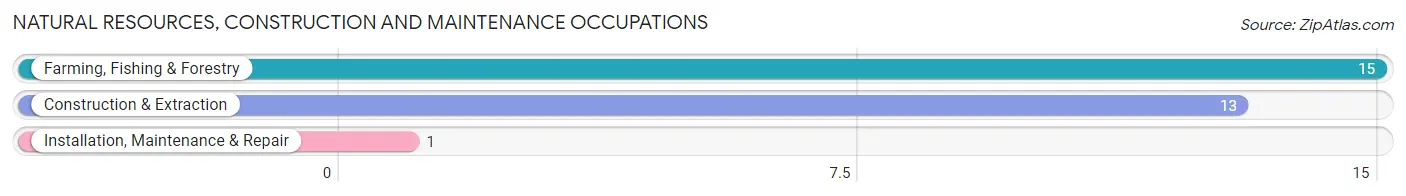
Natural Resources, Construction and Maintenance Occupations by Sex
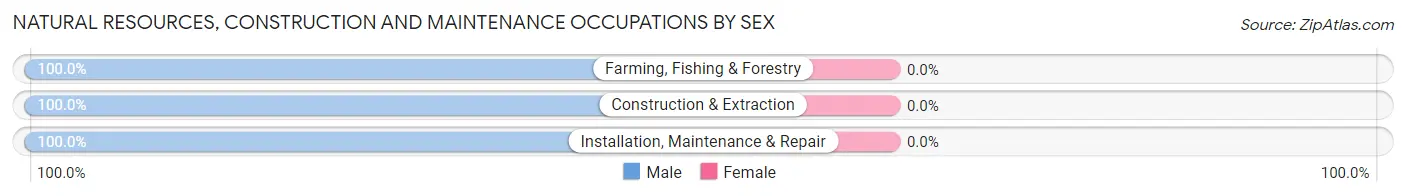
| Occupation | Male | Female |
| Farming, Fishing & Forestry | 15 (100.0%) | 0 (0.0%) |
| Construction & Extraction | 13 (100.0%) | 0 (0.0%) |
| Installation, Maintenance & Repair | 1 (100.0%) | 0 (0.0%) |
| Total (Category) | 29 (100.0%) | 0 (0.0%) |
| Total (Overall) | 91 (40.4%) | 134 (59.6%) |
Production, Transportation and Moving Occupations
The most common Production, Transportation and Moving occupations in Mosses are Production (88 | 39.1%), Material Moving (34 | 15.1%), and Transportation (4 | 1.8%).
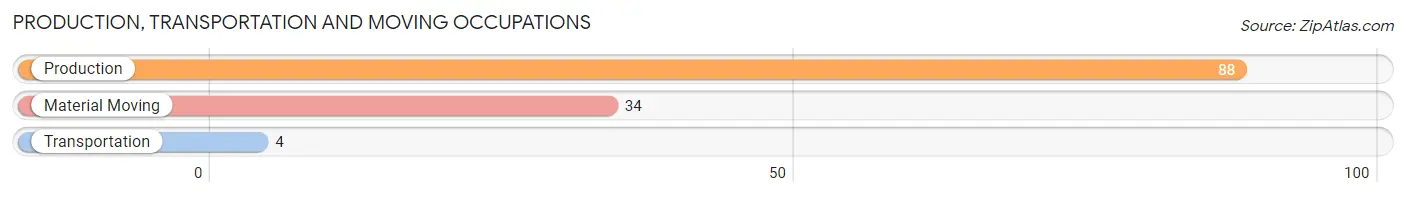
Production, Transportation and Moving Occupations by Sex
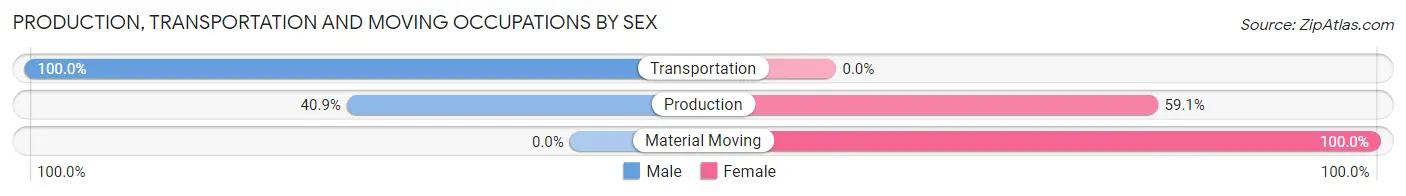
| Occupation | Male | Female |
| Production | 36 (40.9%) | 52 (59.1%) |
| Transportation | 4 (100.0%) | 0 (0.0%) |
| Material Moving | 0 (0.0%) | 34 (100.0%) |
| Total (Category) | 40 (31.8%) | 86 (68.2%) |
| Total (Overall) | 91 (40.4%) | 134 (59.6%) |
Employment Industries by Sex in Mosses
Employment Industries in Mosses
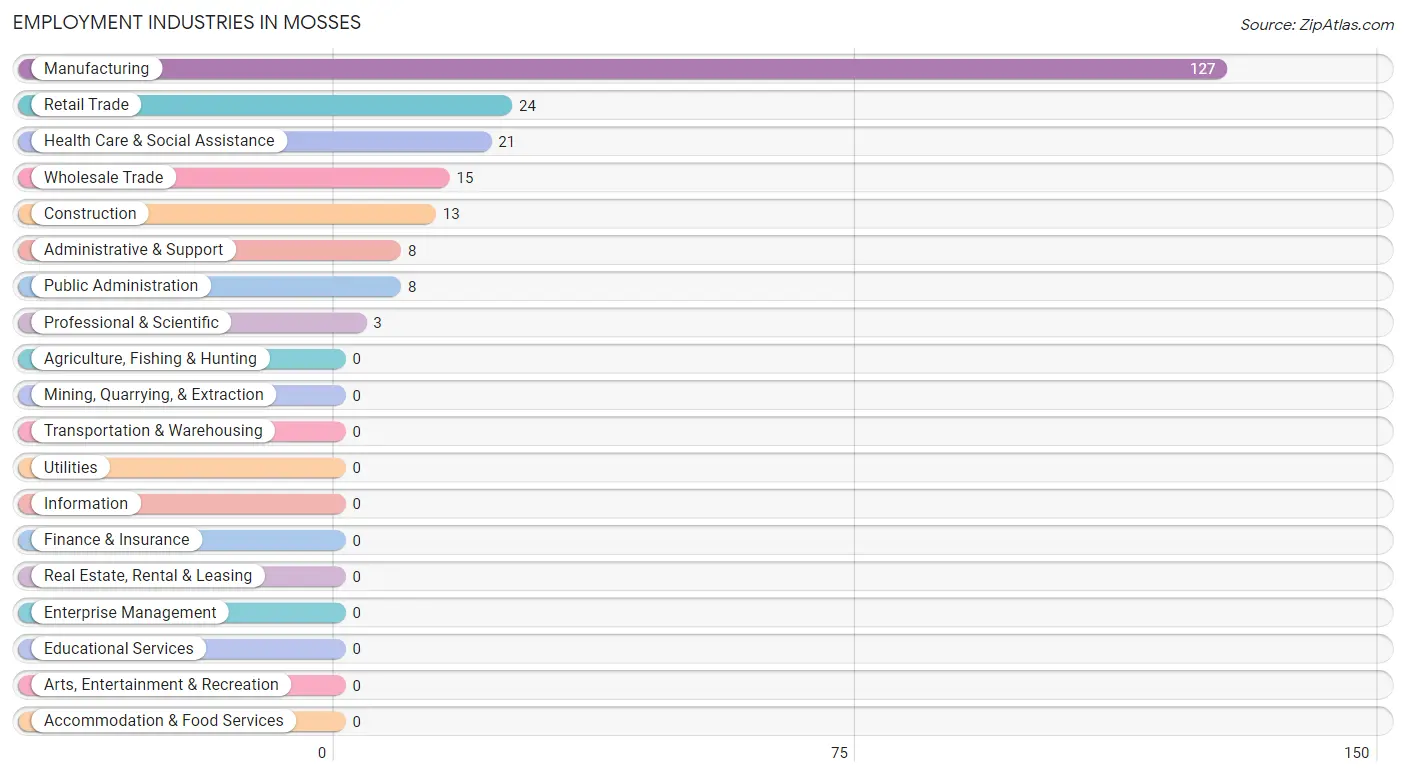
The major employment industries in Mosses include Manufacturing (127 | 56.4%), Retail Trade (24 | 10.7%), Health Care & Social Assistance (21 | 9.3%), Wholesale Trade (15 | 6.7%), and Construction (13 | 5.8%).
Employment Industries by Sex in Mosses
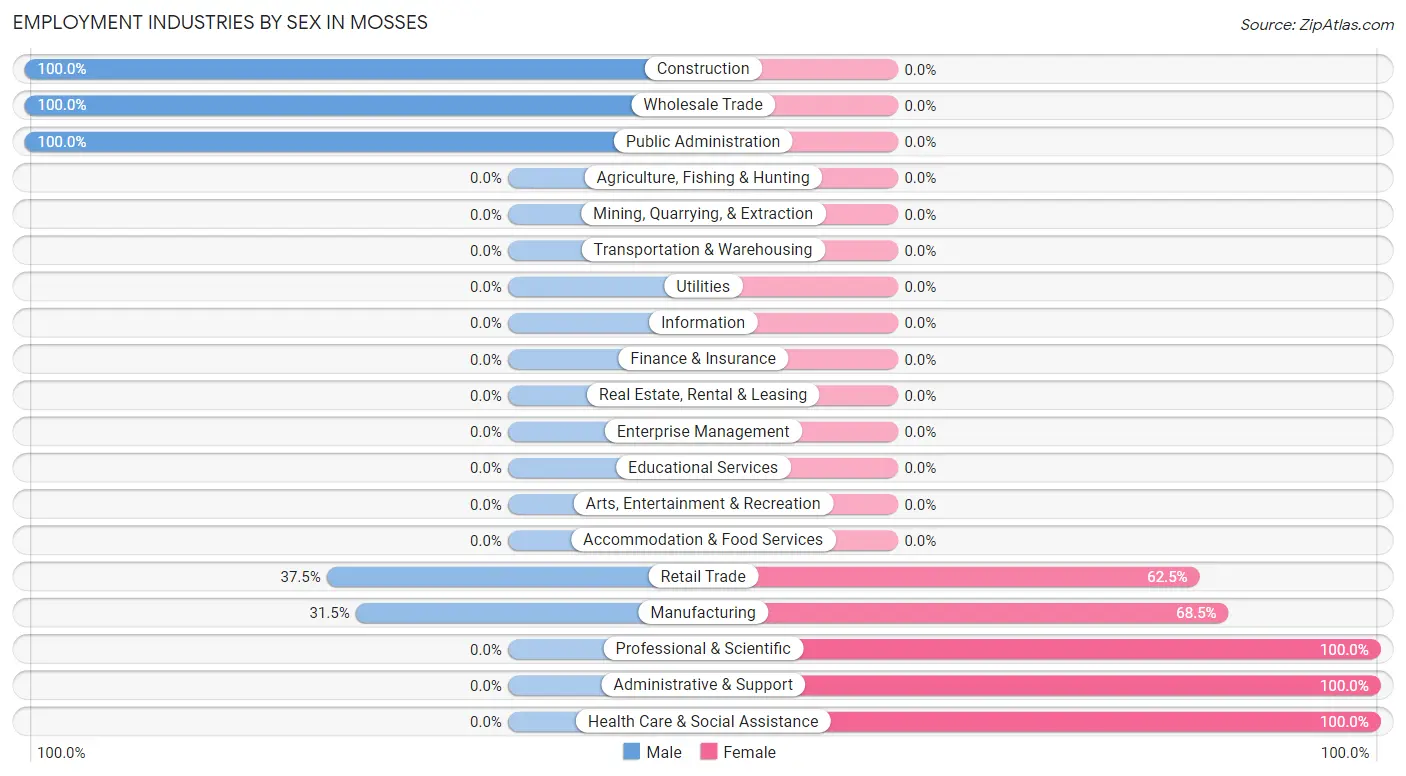
The Mosses industries that see more men than women are Construction (100.0%), Wholesale Trade (100.0%), and Public Administration (100.0%), whereas the industries that tend to have a higher number of women are Professional & Scientific (100.0%), Administrative & Support (100.0%), and Health Care & Social Assistance (100.0%).
| Industry | Male | Female |
| Agriculture, Fishing & Hunting | 0 (0.0%) | 0 (0.0%) |
| Mining, Quarrying, & Extraction | 0 (0.0%) | 0 (0.0%) |
| Construction | 13 (100.0%) | 0 (0.0%) |
| Manufacturing | 40 (31.5%) | 87 (68.5%) |
| Wholesale Trade | 15 (100.0%) | 0 (0.0%) |
| Retail Trade | 9 (37.5%) | 15 (62.5%) |
| Transportation & Warehousing | 0 (0.0%) | 0 (0.0%) |
| Utilities | 0 (0.0%) | 0 (0.0%) |
| Information | 0 (0.0%) | 0 (0.0%) |
| Finance & Insurance | 0 (0.0%) | 0 (0.0%) |
| Real Estate, Rental & Leasing | 0 (0.0%) | 0 (0.0%) |
| Professional & Scientific | 0 (0.0%) | 3 (100.0%) |
| Enterprise Management | 0 (0.0%) | 0 (0.0%) |
| Administrative & Support | 0 (0.0%) | 8 (100.0%) |
| Educational Services | 0 (0.0%) | 0 (0.0%) |
| Health Care & Social Assistance | 0 (0.0%) | 21 (100.0%) |
| Arts, Entertainment & Recreation | 0 (0.0%) | 0 (0.0%) |
| Accommodation & Food Services | 0 (0.0%) | 0 (0.0%) |
| Public Administration | 8 (100.0%) | 0 (0.0%) |
| Total | 91 (40.4%) | 134 (59.6%) |
Education in Mosses
School Enrollment in Mosses
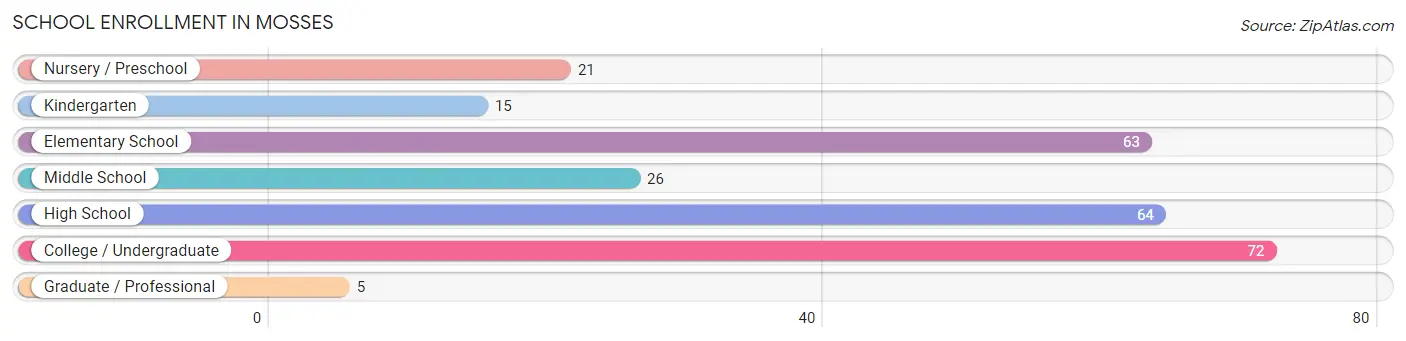
The most common levels of schooling among the 266 students in Mosses are college / undergraduate (72 | 27.1%), high school (64 | 24.1%), and elementary school (63 | 23.7%).
| School Level | # Students | % Students |
| Nursery / Preschool | 21 | 7.9% |
| Kindergarten | 15 | 5.6% |
| Elementary School | 63 | 23.7% |
| Middle School | 26 | 9.8% |
| High School | 64 | 24.1% |
| College / Undergraduate | 72 | 27.1% |
| Graduate / Professional | 5 | 1.9% |
| Total | 266 | 100.0% |
School Enrollment by Age by Funding Source in Mosses
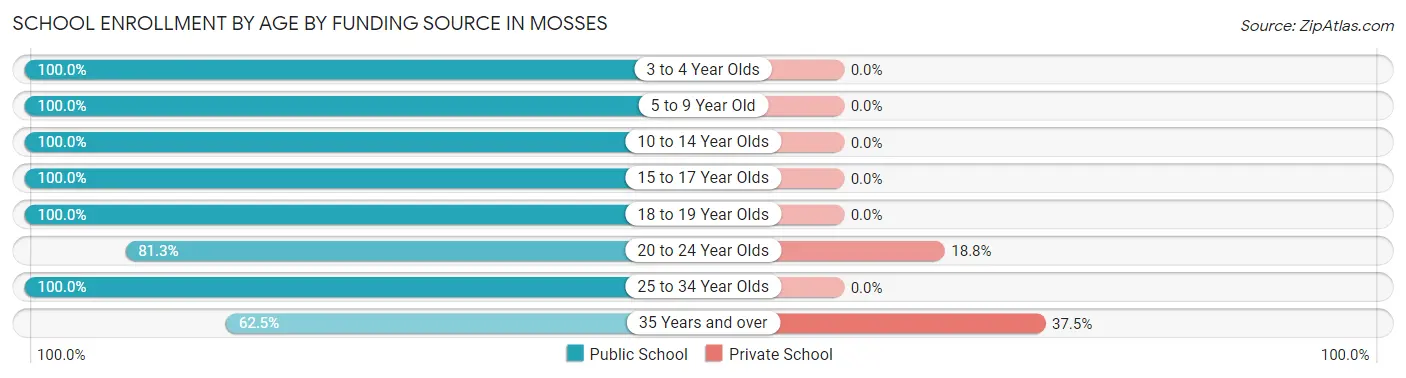
Out of a total of 266 students who are enrolled in schools in Mosses, 6 (2.3%) attend a private institution, while the remaining 260 (97.7%) are enrolled in public schools. The age group of 35 years and over has the highest likelihood of being enrolled in private schools, with 3 (37.5% in the age bracket) enrolled. Conversely, the age group of 3 to 4 year olds has the lowest likelihood of being enrolled in a private school, with 10 (100.0% in the age bracket) attending a public institution.
| Age Bracket | Public School | Private School |
| 3 to 4 Year Olds | 10 (100.0%) | 0 (0.0%) |
| 5 to 9 Year Old | 52 (100.0%) | 0 (0.0%) |
| 10 to 14 Year Olds | 56 (100.0%) | 0 (0.0%) |
| 15 to 17 Year Olds | 40 (100.0%) | 0 (0.0%) |
| 18 to 19 Year Olds | 71 (100.0%) | 0 (0.0%) |
| 20 to 24 Year Olds | 13 (81.2%) | 3 (18.8%) |
| 25 to 34 Year Olds | 13 (100.0%) | 0 (0.0%) |
| 35 Years and over | 5 (62.5%) | 3 (37.5%) |
| Total | 260 (97.7%) | 6 (2.3%) |
Educational Attainment by Field of Study in Mosses
Psychology (20 | 41.7%), social sciences (12 | 25.0%), education (9 | 18.8%), business (5 | 10.4%), and arts & humanities (2 | 4.2%) are the most common fields of study among 48 individuals in Mosses who have obtained a bachelor's degree or higher.
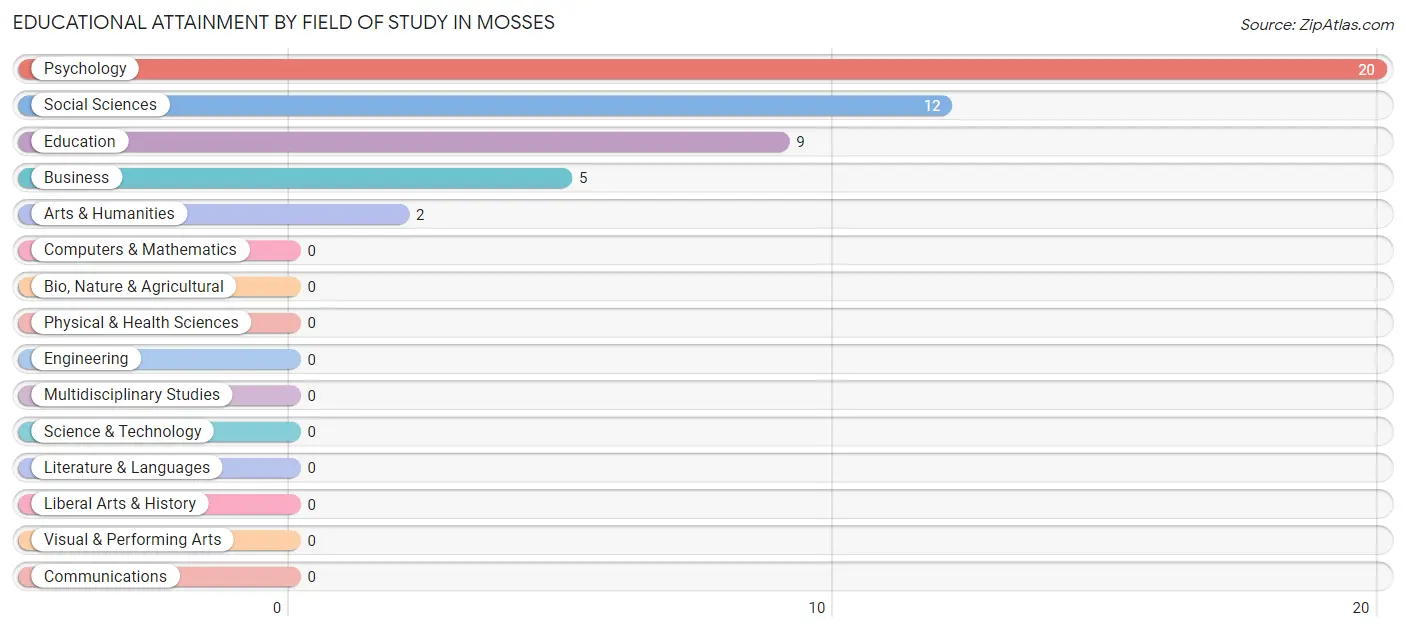
| Field of Study | # Graduates | % Graduates |
| Computers & Mathematics | 0 | 0.0% |
| Bio, Nature & Agricultural | 0 | 0.0% |
| Physical & Health Sciences | 0 | 0.0% |
| Psychology | 20 | 41.7% |
| Social Sciences | 12 | 25.0% |
| Engineering | 0 | 0.0% |
| Multidisciplinary Studies | 0 | 0.0% |
| Science & Technology | 0 | 0.0% |
| Business | 5 | 10.4% |
| Education | 9 | 18.8% |
| Literature & Languages | 0 | 0.0% |
| Liberal Arts & History | 0 | 0.0% |
| Visual & Performing Arts | 0 | 0.0% |
| Communications | 0 | 0.0% |
| Arts & Humanities | 2 | 4.2% |
| Total | 48 | 100.0% |
Transportation & Commute in Mosses
Vehicle Availability by Sex in Mosses
The most prevalent vehicle ownership categories in Mosses are males with 2 vehicles (40, accounting for 50.0%) and females with 2 vehicles (69, making up 29.8%).
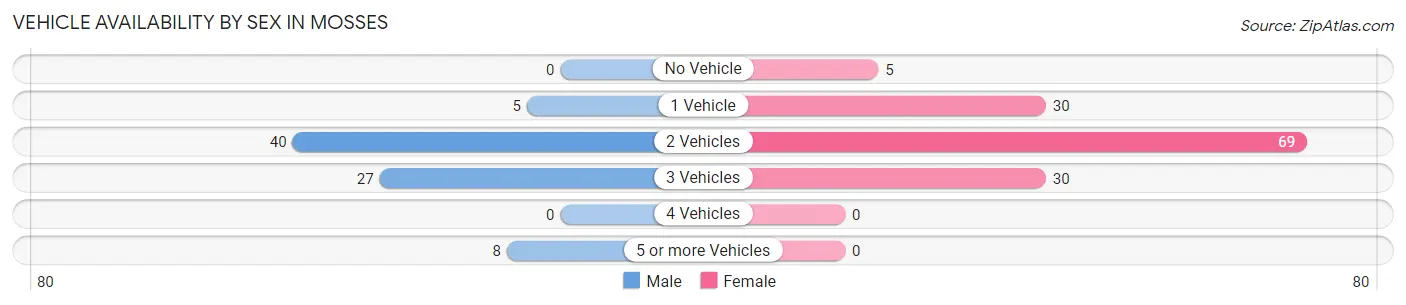
| Vehicles Available | Male | Female |
| No Vehicle | 0 (0.0%) | 5 (3.7%) |
| 1 Vehicle | 5 (6.2%) | 30 (22.4%) |
| 2 Vehicles | 40 (50.0%) | 69 (51.5%) |
| 3 Vehicles | 27 (33.8%) | 30 (22.4%) |
| 4 Vehicles | 0 (0.0%) | 0 (0.0%) |
| 5 or more Vehicles | 8 (10.0%) | 0 (0.0%) |
| Total | 80 (100.0%) | 134 (100.0%) |
Commute Time in Mosses
The most frequently occuring commute durations in Mosses are 30 to 34 minutes (66 commuters, 31.3%), 15 to 19 minutes (45 commuters, 21.3%), and 45 to 59 minutes (39 commuters, 18.5%).
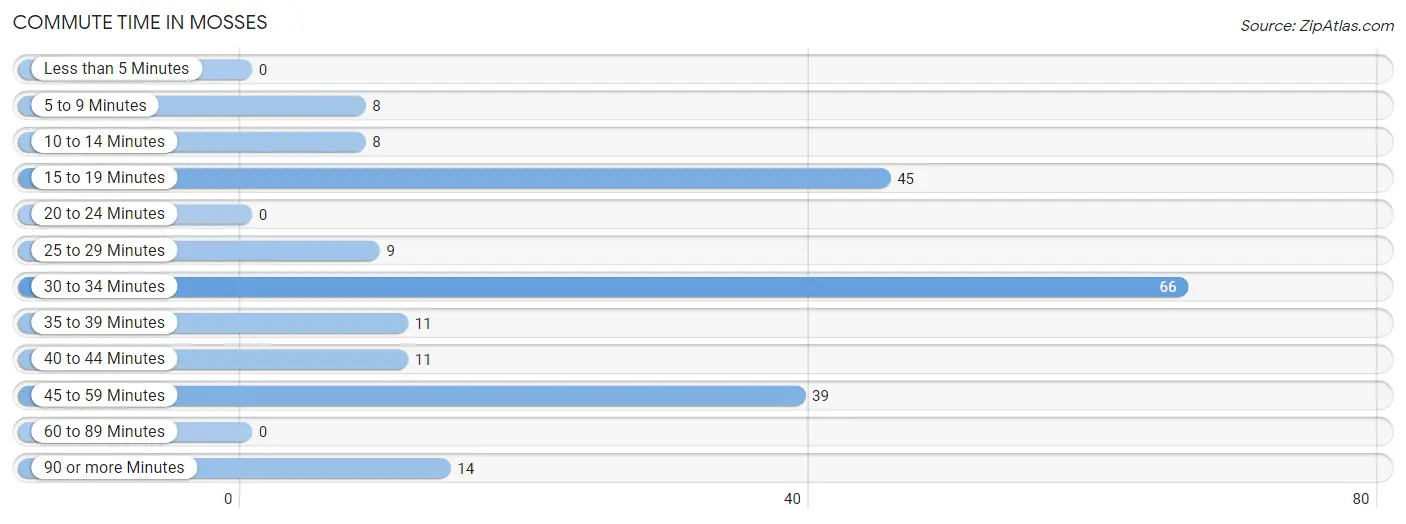
| Commute Time | # Commuters | % Commuters |
| Less than 5 Minutes | 0 | 0.0% |
| 5 to 9 Minutes | 8 | 3.8% |
| 10 to 14 Minutes | 8 | 3.8% |
| 15 to 19 Minutes | 45 | 21.3% |
| 20 to 24 Minutes | 0 | 0.0% |
| 25 to 29 Minutes | 9 | 4.3% |
| 30 to 34 Minutes | 66 | 31.3% |
| 35 to 39 Minutes | 11 | 5.2% |
| 40 to 44 Minutes | 11 | 5.2% |
| 45 to 59 Minutes | 39 | 18.5% |
| 60 to 89 Minutes | 0 | 0.0% |
| 90 or more Minutes | 14 | 6.6% |
Commute Time by Sex in Mosses
The most common commute times in Mosses are 45 to 59 minutes (32 commuters, 40.0%) for males and 15 to 19 minutes (45 commuters, 34.4%) for females.
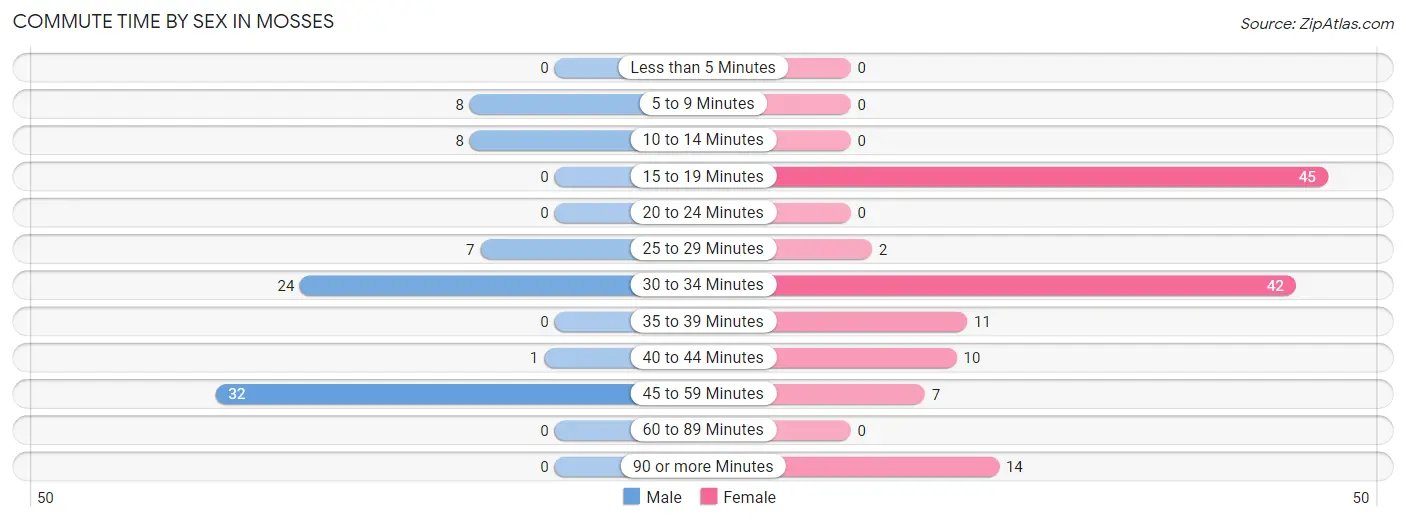
| Commute Time | Male | Female |
| Less than 5 Minutes | 0 (0.0%) | 0 (0.0%) |
| 5 to 9 Minutes | 8 (10.0%) | 0 (0.0%) |
| 10 to 14 Minutes | 8 (10.0%) | 0 (0.0%) |
| 15 to 19 Minutes | 0 (0.0%) | 45 (34.4%) |
| 20 to 24 Minutes | 0 (0.0%) | 0 (0.0%) |
| 25 to 29 Minutes | 7 (8.7%) | 2 (1.5%) |
| 30 to 34 Minutes | 24 (30.0%) | 42 (32.1%) |
| 35 to 39 Minutes | 0 (0.0%) | 11 (8.4%) |
| 40 to 44 Minutes | 1 (1.3%) | 10 (7.6%) |
| 45 to 59 Minutes | 32 (40.0%) | 7 (5.3%) |
| 60 to 89 Minutes | 0 (0.0%) | 0 (0.0%) |
| 90 or more Minutes | 0 (0.0%) | 14 (10.7%) |
Time of Departure to Work by Sex in Mosses
The most frequent times of departure to work in Mosses are 5:30 AM to 5:59 AM (24, 30.0%) for males and 6:30 AM to 6:59 AM (36, 27.5%) for females.
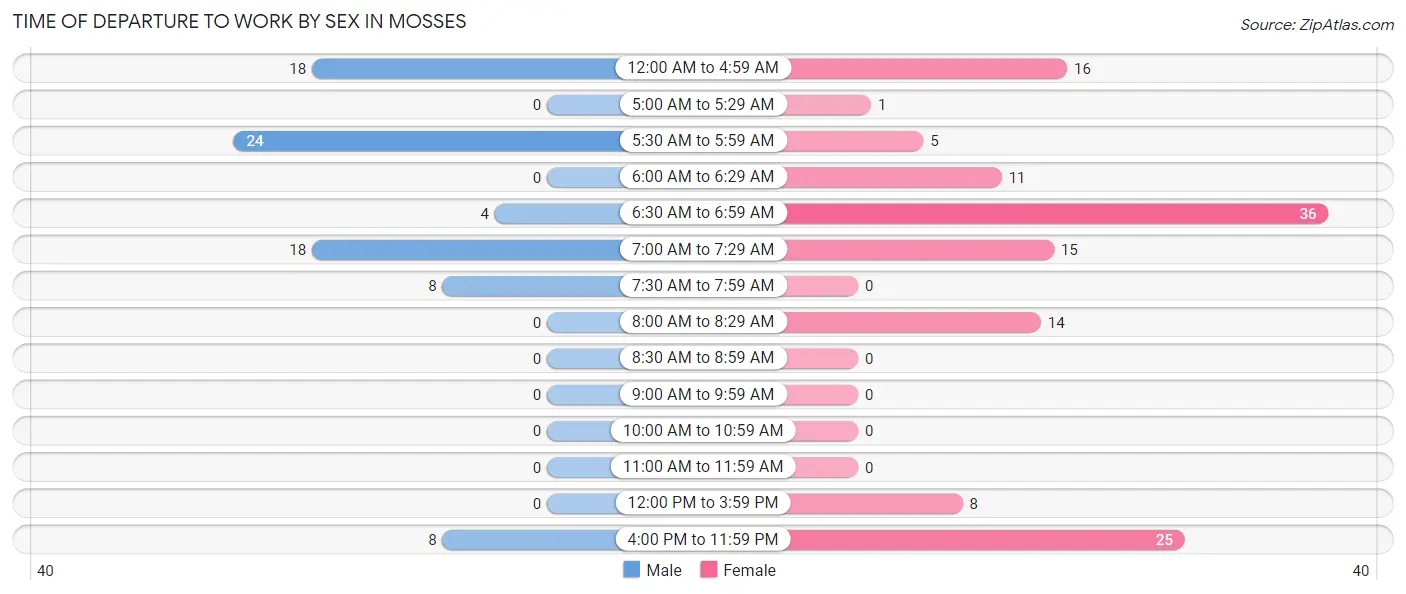
| Time of Departure | Male | Female |
| 12:00 AM to 4:59 AM | 18 (22.5%) | 16 (12.2%) |
| 5:00 AM to 5:29 AM | 0 (0.0%) | 1 (0.8%) |
| 5:30 AM to 5:59 AM | 24 (30.0%) | 5 (3.8%) |
| 6:00 AM to 6:29 AM | 0 (0.0%) | 11 (8.4%) |
| 6:30 AM to 6:59 AM | 4 (5.0%) | 36 (27.5%) |
| 7:00 AM to 7:29 AM | 18 (22.5%) | 15 (11.5%) |
| 7:30 AM to 7:59 AM | 8 (10.0%) | 0 (0.0%) |
| 8:00 AM to 8:29 AM | 0 (0.0%) | 14 (10.7%) |
| 8:30 AM to 8:59 AM | 0 (0.0%) | 0 (0.0%) |
| 9:00 AM to 9:59 AM | 0 (0.0%) | 0 (0.0%) |
| 10:00 AM to 10:59 AM | 0 (0.0%) | 0 (0.0%) |
| 11:00 AM to 11:59 AM | 0 (0.0%) | 0 (0.0%) |
| 12:00 PM to 3:59 PM | 0 (0.0%) | 8 (6.1%) |
| 4:00 PM to 11:59 PM | 8 (10.0%) | 25 (19.1%) |
| Total | 80 (100.0%) | 131 (100.0%) |
Housing Occupancy in Mosses
Occupancy by Ownership in Mosses
Of the total 280 dwellings in Mosses, owner-occupied units account for 176 (62.9%), while renter-occupied units make up 104 (37.1%).
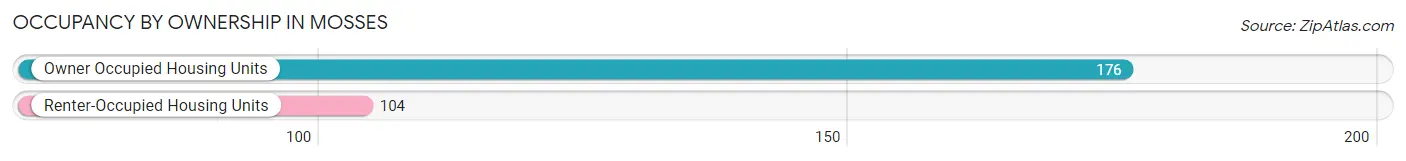
| Occupancy | # Housing Units | % Housing Units |
| Owner Occupied Housing Units | 176 | 62.9% |
| Renter-Occupied Housing Units | 104 | 37.1% |
| Total Occupied Housing Units | 280 | 100.0% |
Occupancy by Household Size in Mosses
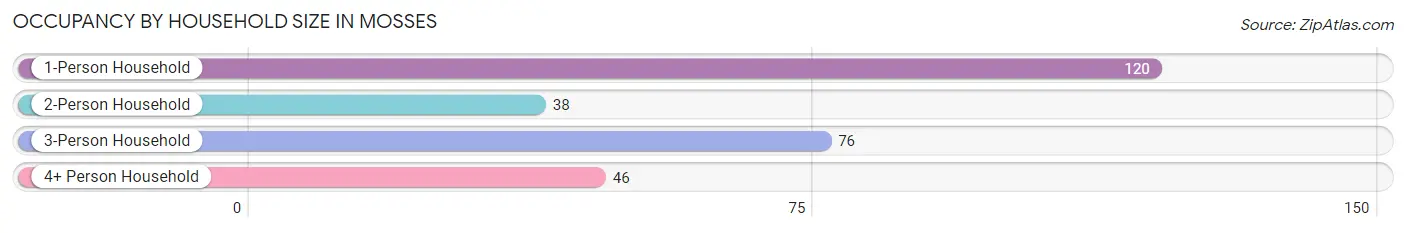
| Household Size | # Housing Units | % Housing Units |
| 1-Person Household | 120 | 42.9% |
| 2-Person Household | 38 | 13.6% |
| 3-Person Household | 76 | 27.1% |
| 4+ Person Household | 46 | 16.4% |
| Total Housing Units | 280 | 100.0% |
Occupancy by Ownership by Household Size in Mosses
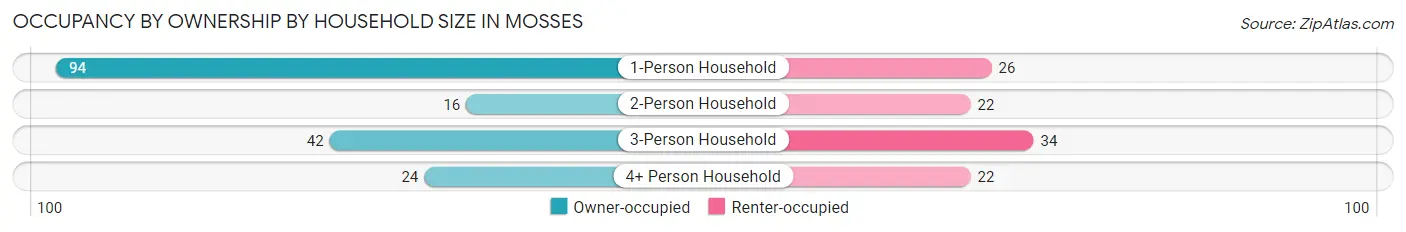
| Household Size | Owner-occupied | Renter-occupied |
| 1-Person Household | 94 (78.3%) | 26 (21.7%) |
| 2-Person Household | 16 (42.1%) | 22 (57.9%) |
| 3-Person Household | 42 (55.3%) | 34 (44.7%) |
| 4+ Person Household | 24 (52.2%) | 22 (47.8%) |
| Total Housing Units | 176 (62.9%) | 104 (37.1%) |
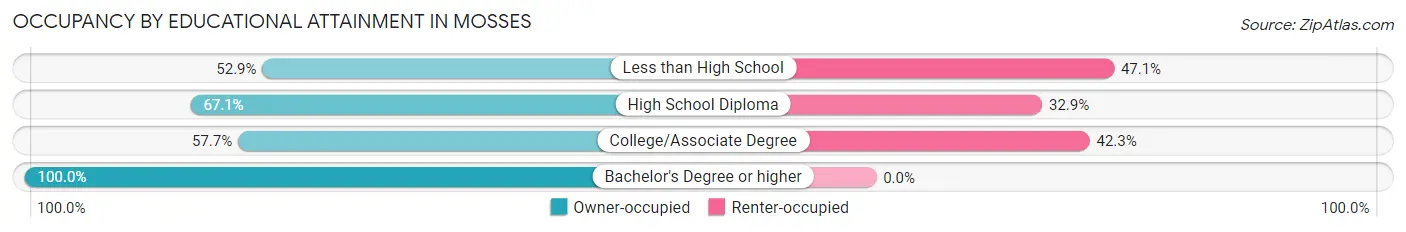
Occupancy by Educational Attainment in Mosses
| Household Size | Owner-occupied | Renter-occupied |
| Less than High School | 37 (52.9%) | 33 (47.1%) |
| High School Diploma | 100 (67.1%) | 49 (32.9%) |
| College/Associate Degree | 30 (57.7%) | 22 (42.3%) |
| Bachelor's Degree or higher | 9 (100.0%) | 0 (0.0%) |
Occupancy by Age of Householder in Mosses
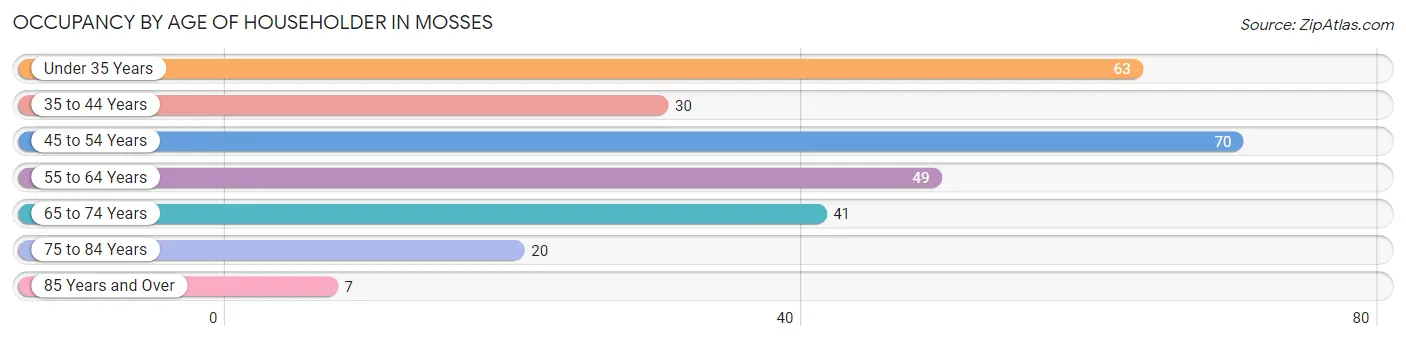
| Age Bracket | # Households | % Households |
| Under 35 Years | 63 | 22.5% |
| 35 to 44 Years | 30 | 10.7% |
| 45 to 54 Years | 70 | 25.0% |
| 55 to 64 Years | 49 | 17.5% |
| 65 to 74 Years | 41 | 14.6% |
| 75 to 84 Years | 20 | 7.1% |
| 85 Years and Over | 7 | 2.5% |
| Total | 280 | 100.0% |
Housing Finances in Mosses
Median Income by Occupancy in Mosses
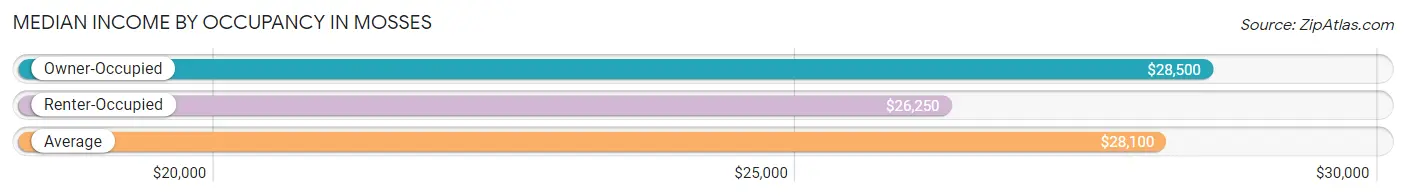
| Occupancy Type | # Households | Median Income |
| Owner-Occupied | 176 (62.9%) | $28,500 |
| Renter-Occupied | 104 (37.1%) | $26,250 |
| Average | 280 (100.0%) | $28,100 |
Occupancy by Householder Income Bracket in Mosses
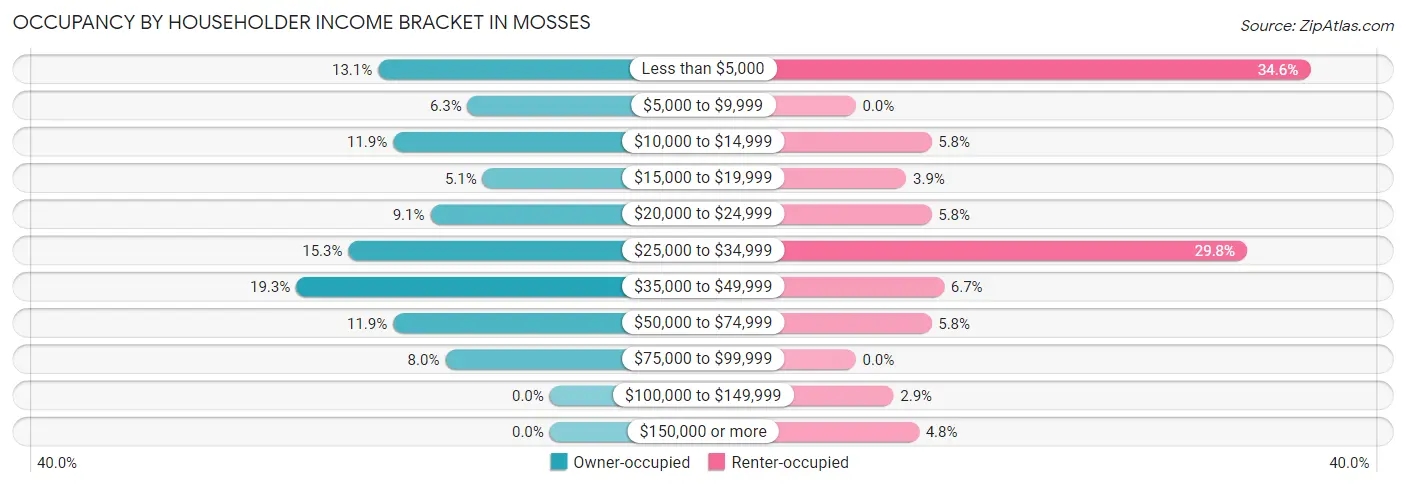
| Income Bracket | Owner-occupied | Renter-occupied |
| Less than $5,000 | 23 (13.1%) | 36 (34.6%) |
| $5,000 to $9,999 | 11 (6.2%) | 0 (0.0%) |
| $10,000 to $14,999 | 21 (11.9%) | 6 (5.8%) |
| $15,000 to $19,999 | 9 (5.1%) | 4 (3.8%) |
| $20,000 to $24,999 | 16 (9.1%) | 6 (5.8%) |
| $25,000 to $34,999 | 27 (15.3%) | 31 (29.8%) |
| $35,000 to $49,999 | 34 (19.3%) | 7 (6.7%) |
| $50,000 to $74,999 | 21 (11.9%) | 6 (5.8%) |
| $75,000 to $99,999 | 14 (8.0%) | 0 (0.0%) |
| $100,000 to $149,999 | 0 (0.0%) | 3 (2.9%) |
| $150,000 or more | 0 (0.0%) | 5 (4.8%) |
| Total | 176 (100.0%) | 104 (100.0%) |
Monthly Housing Cost Tiers in Mosses
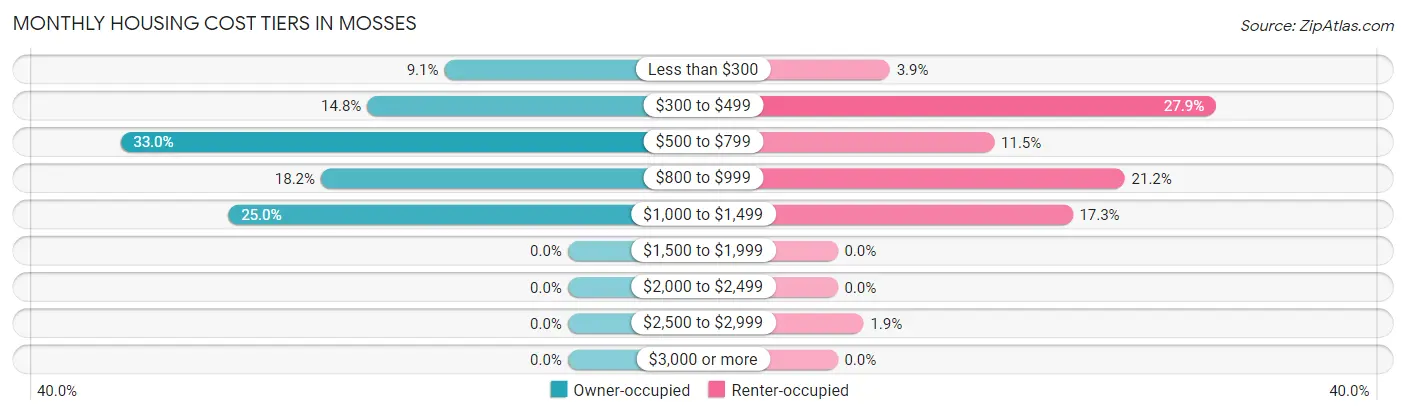
| Monthly Cost | Owner-occupied | Renter-occupied |
| Less than $300 | 16 (9.1%) | 4 (3.8%) |
| $300 to $499 | 26 (14.8%) | 29 (27.9%) |
| $500 to $799 | 58 (33.0%) | 12 (11.5%) |
| $800 to $999 | 32 (18.2%) | 22 (21.1%) |
| $1,000 to $1,499 | 44 (25.0%) | 18 (17.3%) |
| $1,500 to $1,999 | 0 (0.0%) | 0 (0.0%) |
| $2,000 to $2,499 | 0 (0.0%) | 0 (0.0%) |
| $2,500 to $2,999 | 0 (0.0%) | 2 (1.9%) |
| $3,000 or more | 0 (0.0%) | 0 (0.0%) |
| Total | 176 (100.0%) | 104 (100.0%) |
Physical Housing Characteristics in Mosses
Housing Structures in Mosses
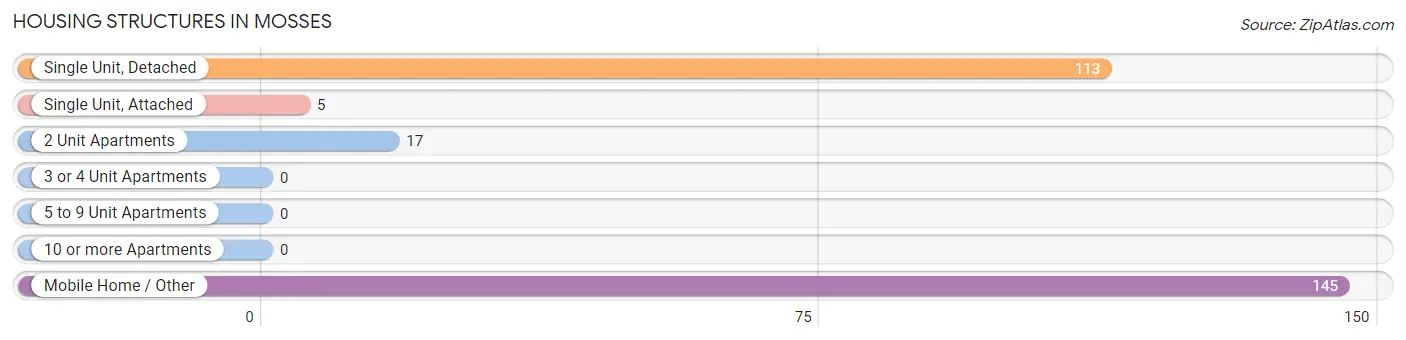
| Structure Type | # Housing Units | % Housing Units |
| Single Unit, Detached | 113 | 40.4% |
| Single Unit, Attached | 5 | 1.8% |
| 2 Unit Apartments | 17 | 6.1% |
| 3 or 4 Unit Apartments | 0 | 0.0% |
| 5 to 9 Unit Apartments | 0 | 0.0% |
| 10 or more Apartments | 0 | 0.0% |
| Mobile Home / Other | 145 | 51.8% |
| Total | 280 | 100.0% |
Housing Structures by Occupancy in Mosses
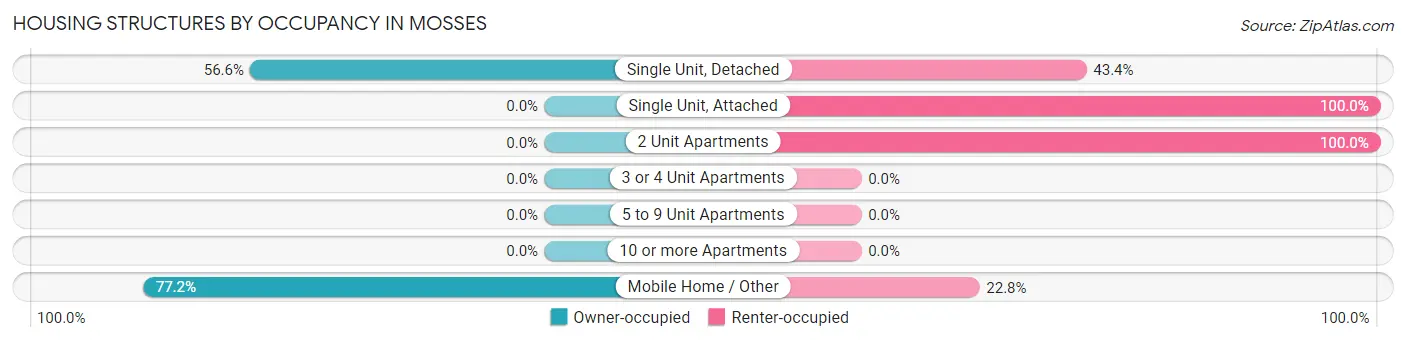
| Structure Type | Owner-occupied | Renter-occupied |
| Single Unit, Detached | 64 (56.6%) | 49 (43.4%) |
| Single Unit, Attached | 0 (0.0%) | 5 (100.0%) |
| 2 Unit Apartments | 0 (0.0%) | 17 (100.0%) |
| 3 or 4 Unit Apartments | 0 (0.0%) | 0 (0.0%) |
| 5 to 9 Unit Apartments | 0 (0.0%) | 0 (0.0%) |
| 10 or more Apartments | 0 (0.0%) | 0 (0.0%) |
| Mobile Home / Other | 112 (77.2%) | 33 (22.8%) |
| Total | 176 (62.9%) | 104 (37.1%) |
Housing Structures by Number of Rooms in Mosses
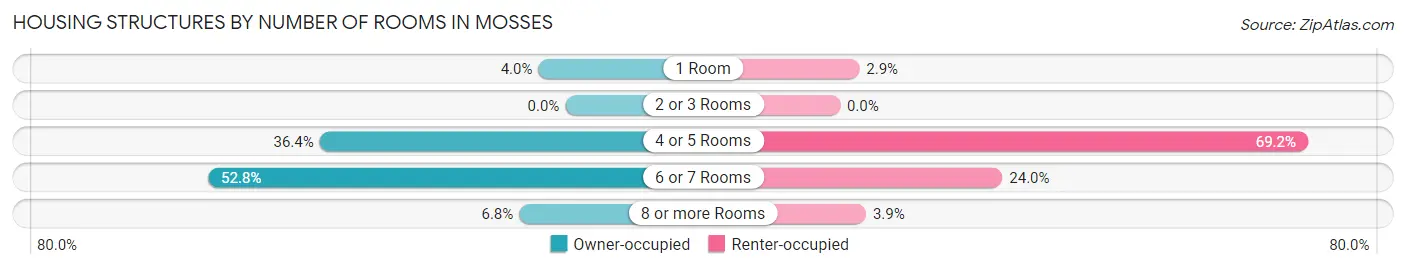
| Number of Rooms | Owner-occupied | Renter-occupied |
| 1 Room | 7 (4.0%) | 3 (2.9%) |
| 2 or 3 Rooms | 0 (0.0%) | 0 (0.0%) |
| 4 or 5 Rooms | 64 (36.4%) | 72 (69.2%) |
| 6 or 7 Rooms | 93 (52.8%) | 25 (24.0%) |
| 8 or more Rooms | 12 (6.8%) | 4 (3.8%) |
| Total | 176 (100.0%) | 104 (100.0%) |
Housing Structure by Heating Type in Mosses
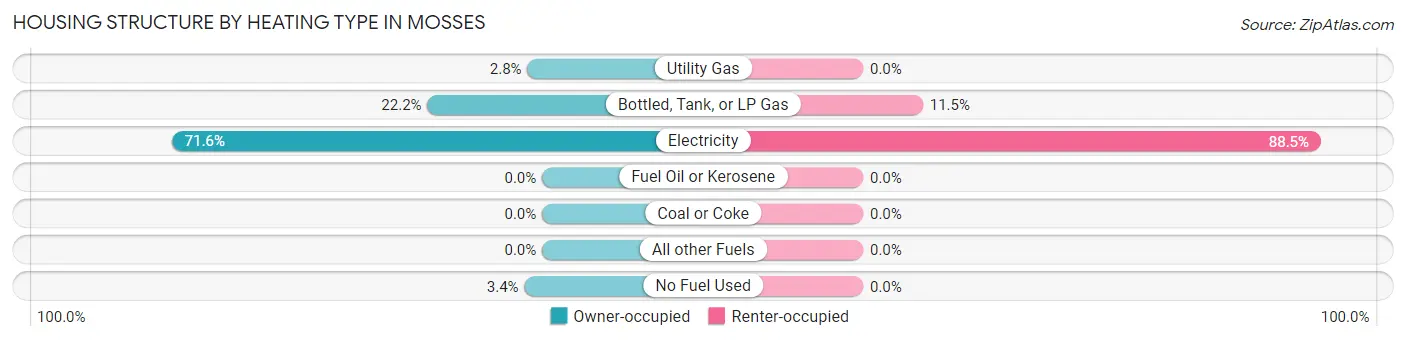
| Heating Type | Owner-occupied | Renter-occupied |
| Utility Gas | 5 (2.8%) | 0 (0.0%) |
| Bottled, Tank, or LP Gas | 39 (22.2%) | 12 (11.5%) |
| Electricity | 126 (71.6%) | 92 (88.5%) |
| Fuel Oil or Kerosene | 0 (0.0%) | 0 (0.0%) |
| Coal or Coke | 0 (0.0%) | 0 (0.0%) |
| All other Fuels | 0 (0.0%) | 0 (0.0%) |
| No Fuel Used | 6 (3.4%) | 0 (0.0%) |
| Total | 176 (100.0%) | 104 (100.0%) |
Household Vehicle Usage in Mosses
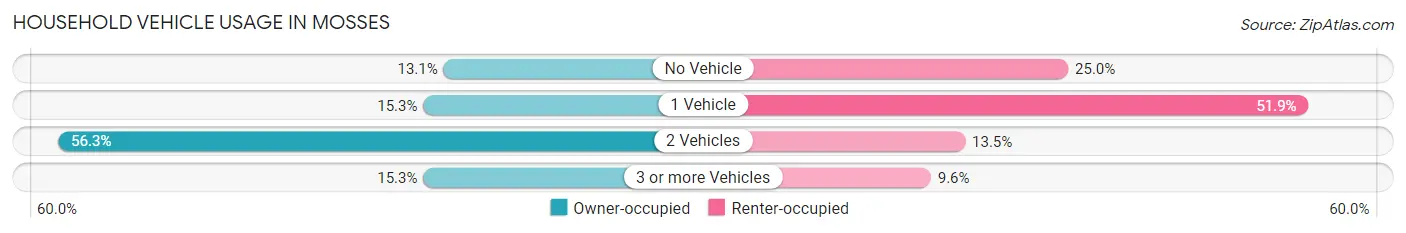
| Vehicles per Household | Owner-occupied | Renter-occupied |
| No Vehicle | 23 (13.1%) | 26 (25.0%) |
| 1 Vehicle | 27 (15.3%) | 54 (51.9%) |
| 2 Vehicles | 99 (56.2%) | 14 (13.5%) |
| 3 or more Vehicles | 27 (15.3%) | 10 (9.6%) |
| Total | 176 (100.0%) | 104 (100.0%) |
Real Estate & Mortgages in Mosses
Real Estate and Mortgage Overview in Mosses
| Characteristic | Without Mortgage | With Mortgage |
| Housing Units | 102 | 74 |
| Median Property Value | $62,800 | $48,900 |
| Median Household Income | $24,688 | $0 |
| Monthly Housing Costs | $560 | $0 |
| Real Estate Taxes | $224 | $31 |
Property Value by Mortgage Status in Mosses
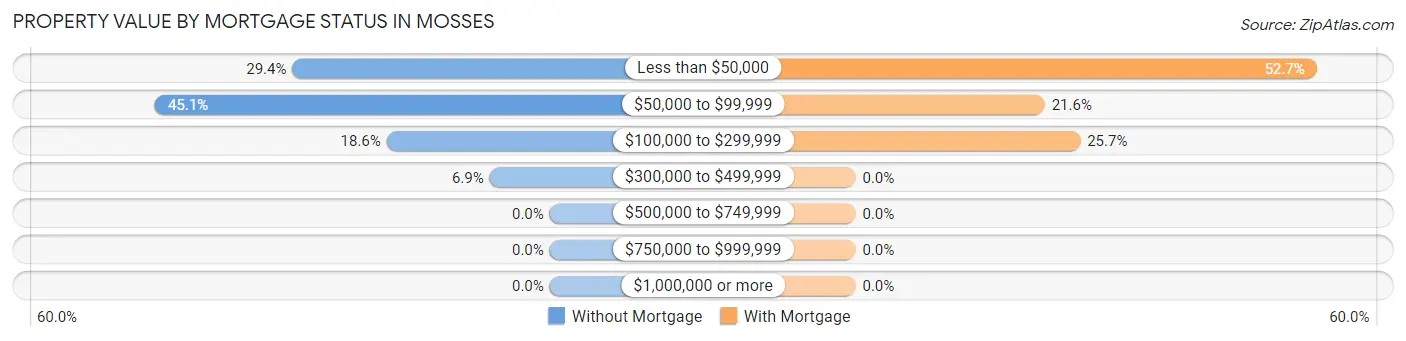
| Property Value | Without Mortgage | With Mortgage |
| Less than $50,000 | 30 (29.4%) | 39 (52.7%) |
| $50,000 to $99,999 | 46 (45.1%) | 16 (21.6%) |
| $100,000 to $299,999 | 19 (18.6%) | 19 (25.7%) |
| $300,000 to $499,999 | 7 (6.9%) | 0 (0.0%) |
| $500,000 to $749,999 | 0 (0.0%) | 0 (0.0%) |
| $750,000 to $999,999 | 0 (0.0%) | 0 (0.0%) |
| $1,000,000 or more | 0 (0.0%) | 0 (0.0%) |
| Total | 102 (100.0%) | 74 (100.0%) |
Household Income by Mortgage Status in Mosses
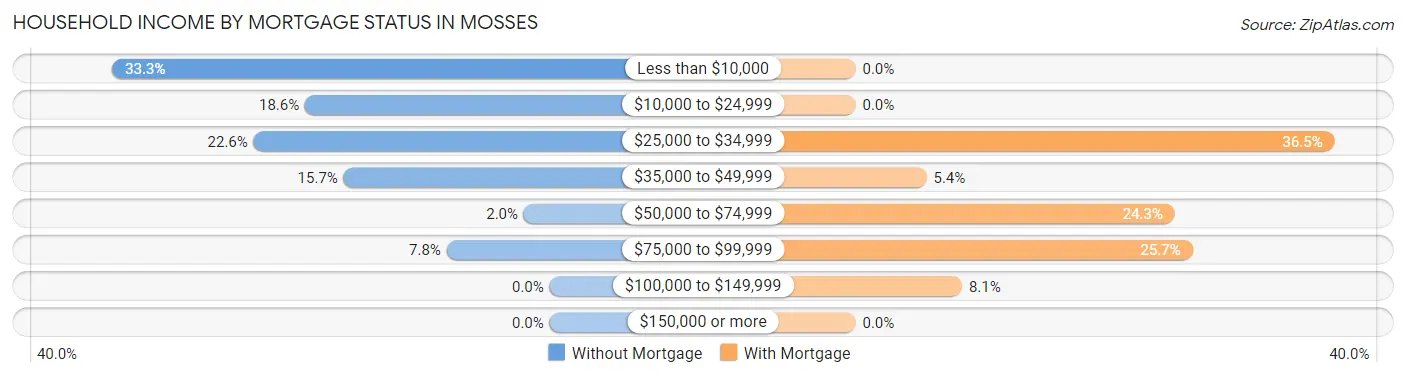
| Household Income | Without Mortgage | With Mortgage |
| Less than $10,000 | 34 (33.3%) | 0 (0.0%) |
| $10,000 to $24,999 | 19 (18.6%) | 0 (0.0%) |
| $25,000 to $34,999 | 23 (22.6%) | 27 (36.5%) |
| $35,000 to $49,999 | 16 (15.7%) | 4 (5.4%) |
| $50,000 to $74,999 | 2 (2.0%) | 18 (24.3%) |
| $75,000 to $99,999 | 8 (7.8%) | 19 (25.7%) |
| $100,000 to $149,999 | 0 (0.0%) | 6 (8.1%) |
| $150,000 or more | 0 (0.0%) | 0 (0.0%) |
| Total | 102 (100.0%) | 74 (100.0%) |
Property Value to Household Income Ratio in Mosses
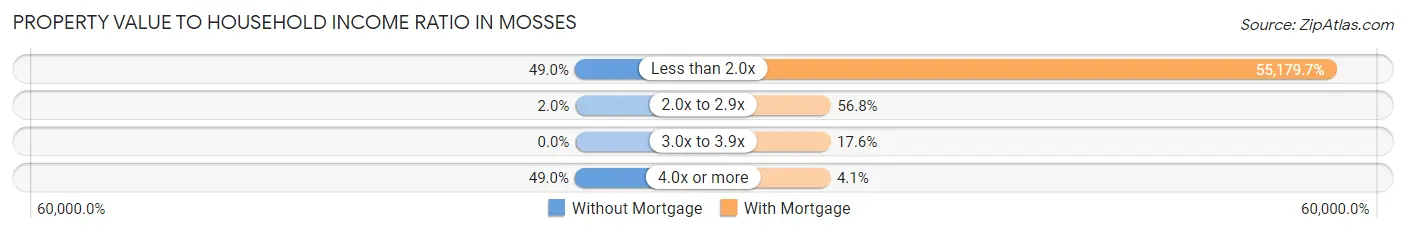
| Value-to-Income Ratio | Without Mortgage | With Mortgage |
| Less than 2.0x | 50 (49.0%) | 40,833 (55,179.7%) |
| 2.0x to 2.9x | 2 (2.0%) | 42 (56.8%) |
| 3.0x to 3.9x | 0 (0.0%) | 13 (17.6%) |
| 4.0x or more | 50 (49.0%) | 3 (4.1%) |
| Total | 102 (100.0%) | 74 (100.0%) |
Real Estate Taxes by Mortgage Status in Mosses
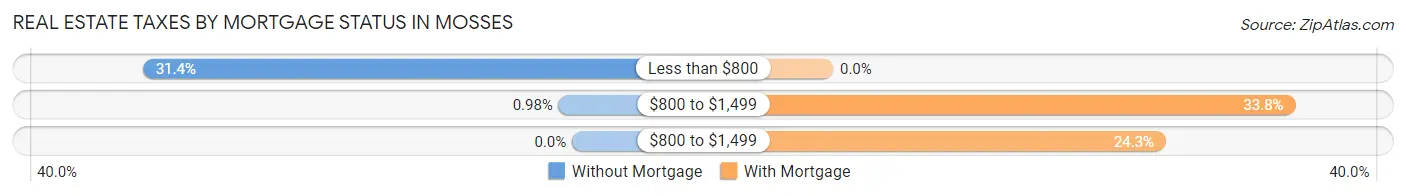
| Property Taxes | Without Mortgage | With Mortgage |
| Less than $800 | 32 (31.4%) | 0 (0.0%) |
| $800 to $1,499 | 1 (1.0%) | 25 (33.8%) |
| $800 to $1,499 | 0 (0.0%) | 18 (24.3%) |
| Total | 102 (100.0%) | 74 (100.0%) |
Health & Disability in Mosses
Health Insurance Coverage by Age in Mosses
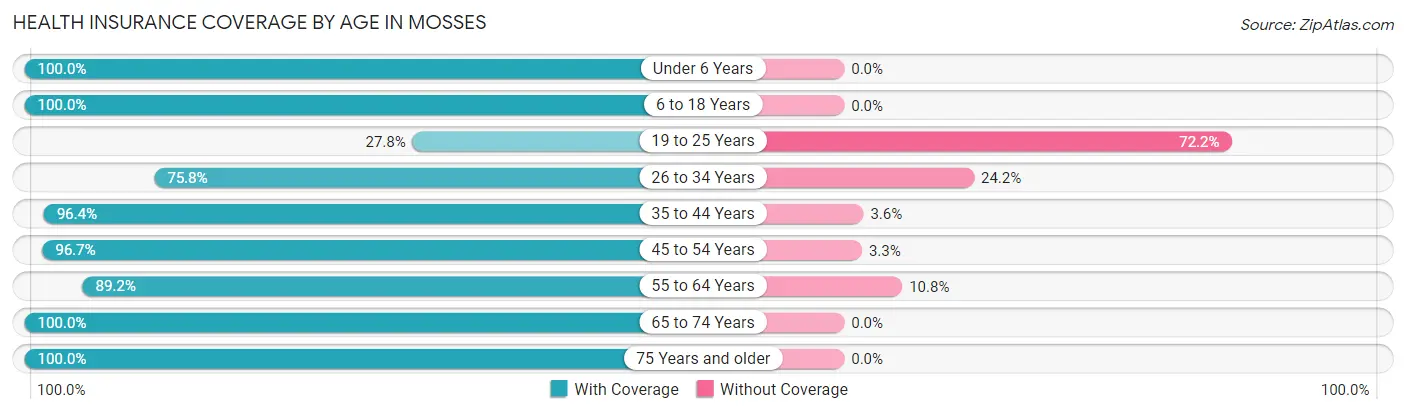
| Age Bracket | With Coverage | Without Coverage |
| Under 6 Years | 69 (100.0%) | 0 (0.0%) |
| 6 to 18 Years | 158 (100.0%) | 0 (0.0%) |
| 19 to 25 Years | 27 (27.8%) | 70 (72.2%) |
| 26 to 34 Years | 47 (75.8%) | 15 (24.2%) |
| 35 to 44 Years | 135 (96.4%) | 5 (3.6%) |
| 45 to 54 Years | 88 (96.7%) | 3 (3.3%) |
| 55 to 64 Years | 66 (89.2%) | 8 (10.8%) |
| 65 to 74 Years | 54 (100.0%) | 0 (0.0%) |
| 75 Years and older | 37 (100.0%) | 0 (0.0%) |
| Total | 681 (87.1%) | 101 (12.9%) |
Health Insurance Coverage by Citizenship Status in Mosses
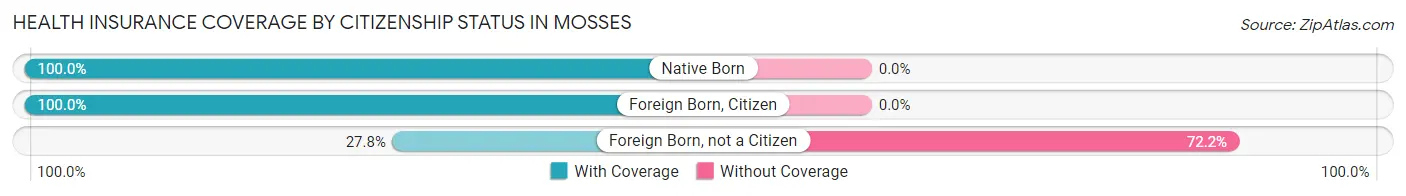
| Citizenship Status | With Coverage | Without Coverage |
| Native Born | 69 (100.0%) | 0 (0.0%) |
| Foreign Born, Citizen | 158 (100.0%) | 0 (0.0%) |
| Foreign Born, not a Citizen | 27 (27.8%) | 70 (72.2%) |
Health Insurance Coverage by Household Income in Mosses
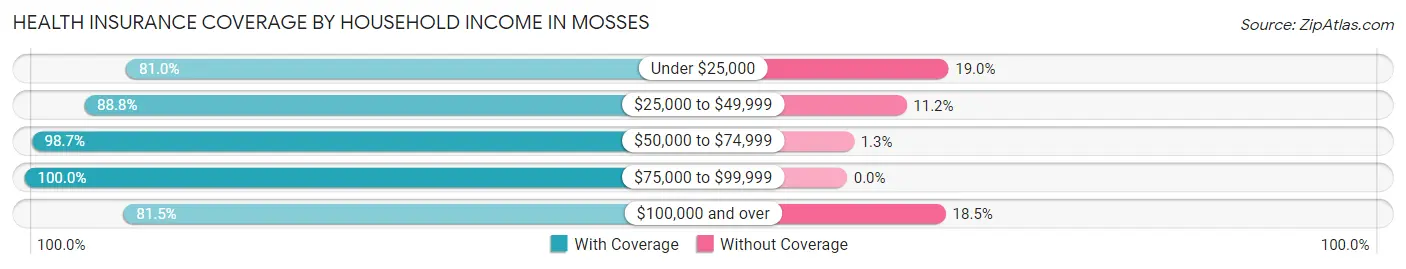
| Household Income | With Coverage | Without Coverage |
| Under $25,000 | 298 (81.0%) | 70 (19.0%) |
| $25,000 to $49,999 | 199 (88.8%) | 25 (11.2%) |
| $50,000 to $74,999 | 76 (98.7%) | 1 (1.3%) |
| $75,000 to $99,999 | 86 (100.0%) | 0 (0.0%) |
| $100,000 and over | 22 (81.5%) | 5 (18.5%) |
Public vs Private Health Insurance Coverage by Age in Mosses
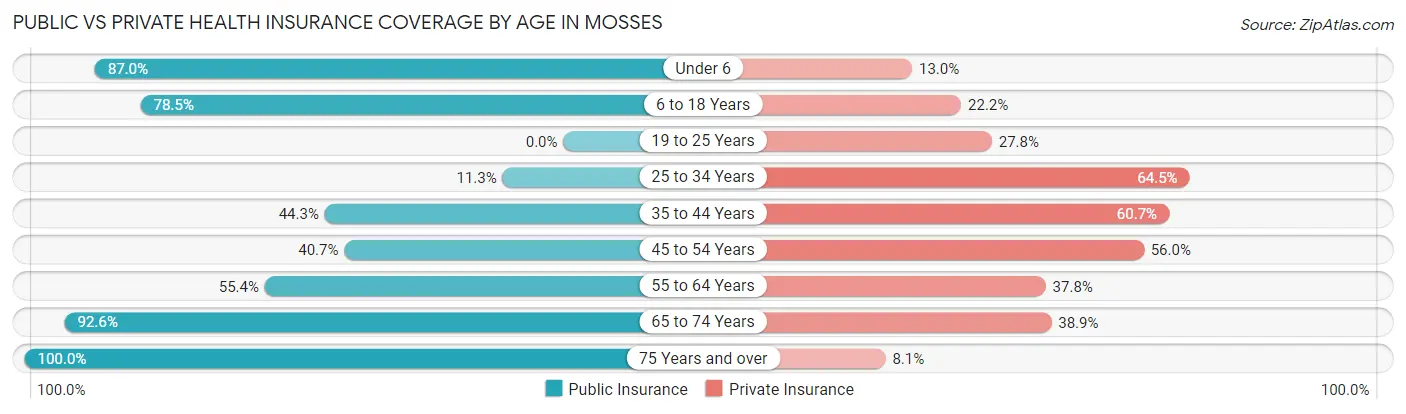
| Age Bracket | Public Insurance | Private Insurance |
| Under 6 | 60 (87.0%) | 9 (13.0%) |
| 6 to 18 Years | 124 (78.5%) | 35 (22.2%) |
| 19 to 25 Years | 0 (0.0%) | 27 (27.8%) |
| 25 to 34 Years | 7 (11.3%) | 40 (64.5%) |
| 35 to 44 Years | 62 (44.3%) | 85 (60.7%) |
| 45 to 54 Years | 37 (40.7%) | 51 (56.0%) |
| 55 to 64 Years | 41 (55.4%) | 28 (37.8%) |
| 65 to 74 Years | 50 (92.6%) | 21 (38.9%) |
| 75 Years and over | 37 (100.0%) | 3 (8.1%) |
| Total | 418 (53.4%) | 299 (38.2%) |
Disability Status by Sex by Age in Mosses
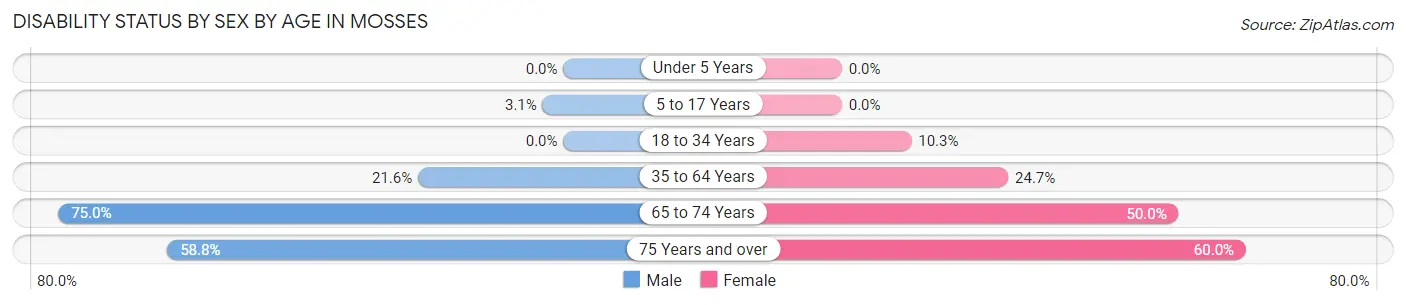
| Age Bracket | Male | Female |
| Under 5 Years | 0 (0.0%) | 0 (0.0%) |
| 5 to 17 Years | 2 (3.1%) | 0 (0.0%) |
| 18 to 34 Years | 0 (0.0%) | 13 (10.3%) |
| 35 to 64 Years | 30 (21.6%) | 41 (24.7%) |
| 65 to 74 Years | 18 (75.0%) | 15 (50.0%) |
| 75 Years and over | 10 (58.8%) | 12 (60.0%) |
Disability Class by Sex by Age in Mosses
Disability Class: Hearing Difficulty
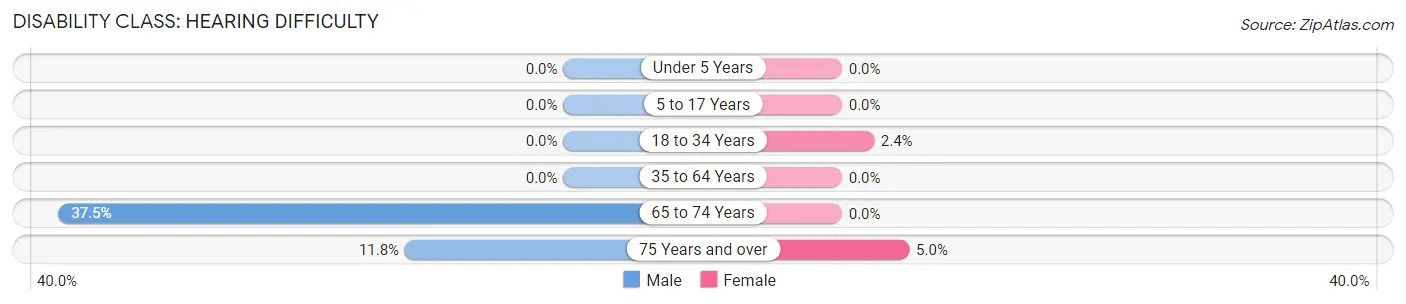
| Age Bracket | Male | Female |
| Under 5 Years | 0 (0.0%) | 0 (0.0%) |
| 5 to 17 Years | 0 (0.0%) | 0 (0.0%) |
| 18 to 34 Years | 0 (0.0%) | 3 (2.4%) |
| 35 to 64 Years | 0 (0.0%) | 0 (0.0%) |
| 65 to 74 Years | 9 (37.5%) | 0 (0.0%) |
| 75 Years and over | 2 (11.8%) | 1 (5.0%) |
Disability Class: Vision Difficulty
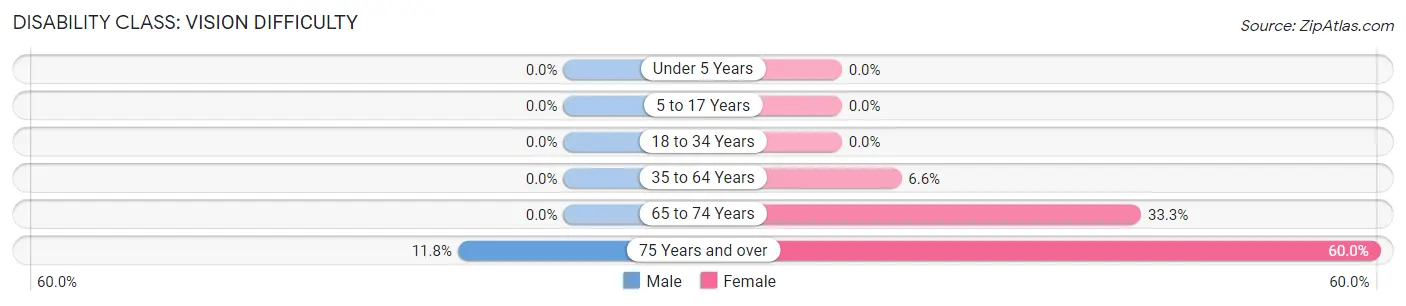
| Age Bracket | Male | Female |
| Under 5 Years | 0 (0.0%) | 0 (0.0%) |
| 5 to 17 Years | 0 (0.0%) | 0 (0.0%) |
| 18 to 34 Years | 0 (0.0%) | 0 (0.0%) |
| 35 to 64 Years | 0 (0.0%) | 11 (6.6%) |
| 65 to 74 Years | 0 (0.0%) | 10 (33.3%) |
| 75 Years and over | 2 (11.8%) | 12 (60.0%) |
Disability Class: Cognitive Difficulty
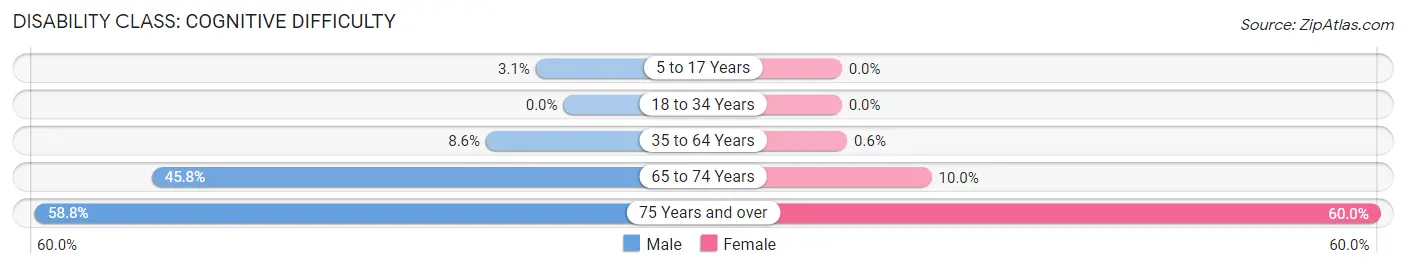
| Age Bracket | Male | Female |
| 5 to 17 Years | 2 (3.1%) | 0 (0.0%) |
| 18 to 34 Years | 0 (0.0%) | 0 (0.0%) |
| 35 to 64 Years | 12 (8.6%) | 1 (0.6%) |
| 65 to 74 Years | 11 (45.8%) | 3 (10.0%) |
| 75 Years and over | 10 (58.8%) | 12 (60.0%) |
Disability Class: Ambulatory Difficulty
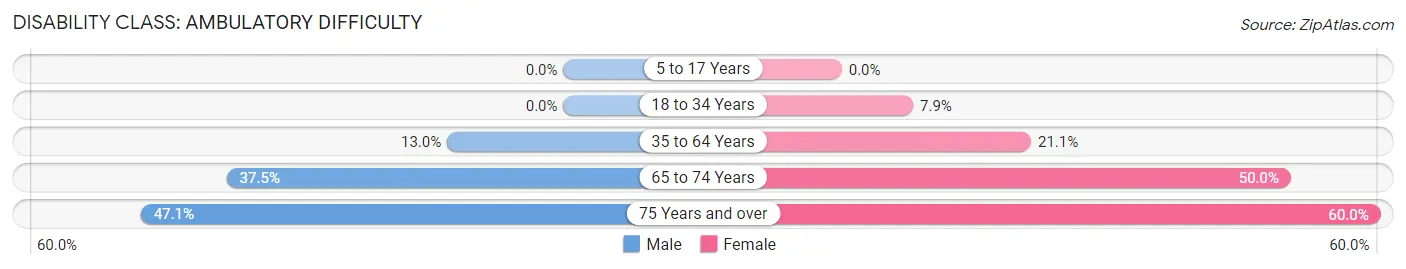
| Age Bracket | Male | Female |
| 5 to 17 Years | 0 (0.0%) | 0 (0.0%) |
| 18 to 34 Years | 0 (0.0%) | 10 (7.9%) |
| 35 to 64 Years | 18 (13.0%) | 35 (21.1%) |
| 65 to 74 Years | 9 (37.5%) | 15 (50.0%) |
| 75 Years and over | 8 (47.1%) | 12 (60.0%) |
Disability Class: Self-Care Difficulty
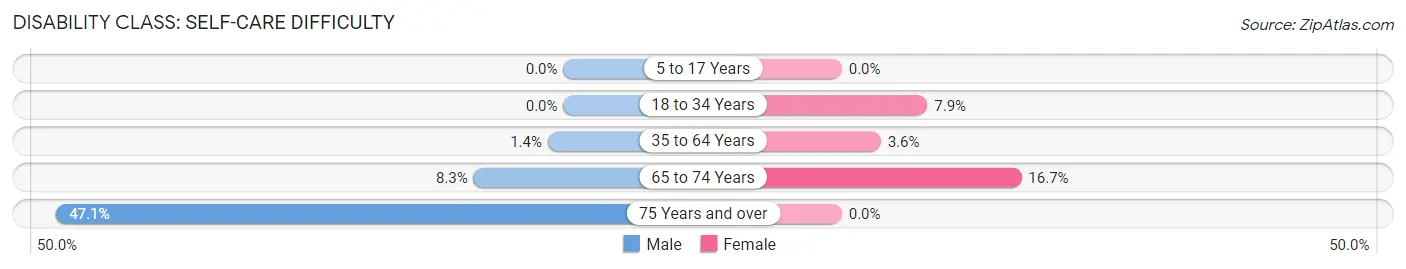
| Age Bracket | Male | Female |
| 5 to 17 Years | 0 (0.0%) | 0 (0.0%) |
| 18 to 34 Years | 0 (0.0%) | 10 (7.9%) |
| 35 to 64 Years | 2 (1.4%) | 6 (3.6%) |
| 65 to 74 Years | 2 (8.3%) | 5 (16.7%) |
| 75 Years and over | 8 (47.1%) | 0 (0.0%) |
Technology Access in Mosses
Computing Device Access in Mosses
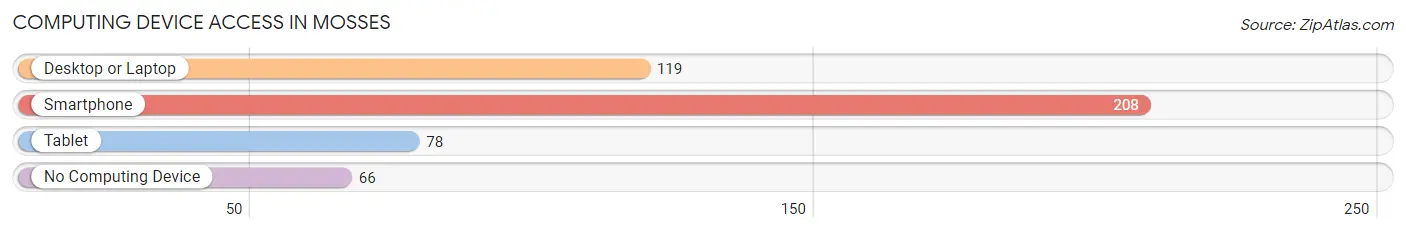
| Device Type | # Households | % Households |
| Desktop or Laptop | 119 | 42.5% |
| Smartphone | 208 | 74.3% |
| Tablet | 78 | 27.9% |
| No Computing Device | 66 | 23.6% |
| Total | 280 | 100.0% |
Internet Access in Mosses
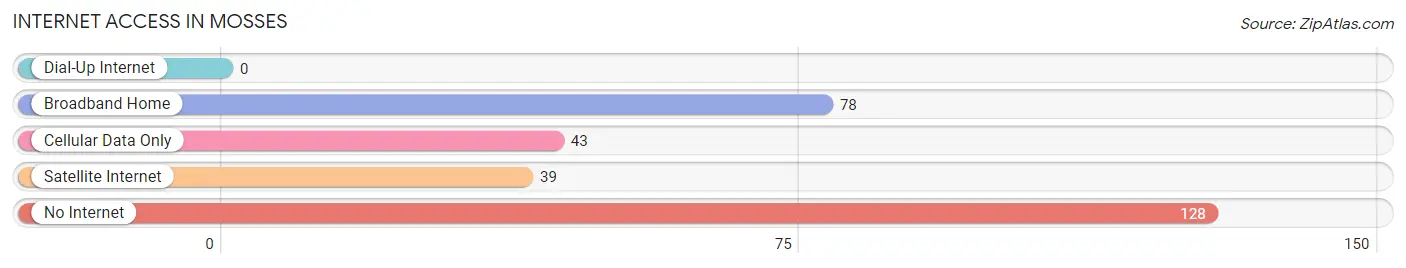
| Internet Type | # Households | % Households |
| Dial-Up Internet | 0 | 0.0% |
| Broadband Home | 78 | 27.9% |
| Cellular Data Only | 43 | 15.4% |
| Satellite Internet | 39 | 13.9% |
| No Internet | 128 | 45.7% |
| Total | 280 | 100.0% |
Mosses Summary
Mosses is a small town located in the southeastern corner of Alabama, in the county of Lowndes. It is situated on the banks of the Alabama River, and is part of the Montgomery metropolitan area. The town has a population of approximately 1,500 people, and is known for its rural charm and friendly atmosphere.
History
Mosses was founded in 1819 by a group of settlers from Georgia. The town was named after the nearby Mosses Creek, which was named after a local Native American chief. The town was originally a trading post, and the settlers quickly established a thriving agricultural community. The town was incorporated in 1837, and the first post office was established in 1845.
In the late 19th century, Mosses became a popular destination for wealthy families from the North, who built large homes in the area. The town also became a center for the timber industry, and several sawmills were built in the area.
Geography
Mosses is located in the southeastern corner of Alabama, in the county of Lowndes. The town is situated on the banks of the Alabama River, and is part of the Montgomery metropolitan area. The town is surrounded by rolling hills and forests, and is located approximately 30 miles from Montgomery.
Economy
Mosses is a small, rural town, and the economy is largely based on agriculture. The town is home to several farms, and the main crops grown in the area are cotton, corn, soybeans, and peanuts. The town also has a thriving timber industry, and several sawmills are located in the area.
In addition to agriculture and timber, Mosses is also home to several small businesses, including restaurants, shops, and other services. The town is also home to a small manufacturing plant, which produces a variety of products.
Demographics
As of the 2010 census, Mosses had a population of 1,500 people. The racial makeup of the town was 79.2% White, 18.2% African American, 0.7% Native American, 0.3% Asian, and 1.6% from other races. The median household income was $30,000, and the median family income was $35,000.
Mosses is a small, rural town, and the population is largely made up of families who have lived in the area for generations. The town is known for its friendly atmosphere, and the residents are proud of their small-town roots.
Common Questions
What is Per Capita Income in Mosses?
Per Capita income in Mosses is $15,003.
What is the Median Family Income in Mosses?
Median Family Income in Mosses is $31,574.
What is the Median Household income in Mosses?
Median Household Income in Mosses is $28,100.
What is Income or Wage Gap in Mosses?
Income or Wage Gap in Mosses is 25.3%.
Women in Mosses earn 74.7 cents for every dollar earned by a man.
What is Inequality or Gini Index in Mosses?
Inequality or Gini Index in Mosses is 0.55.
What is the Total Population of Mosses?
Total Population of Mosses is 789.
What is the Total Male Population of Mosses?
Total Male Population of Mosses is 355.
What is the Total Female Population of Mosses?
Total Female Population of Mosses is 434.
What is the Ratio of Males per 100 Females in Mosses?
There are 81.80 Males per 100 Females in Mosses.
What is the Ratio of Females per 100 Males in Mosses?
There are 122.25 Females per 100 Males in Mosses.
What is the Median Population Age in Mosses?
Median Population Age in Mosses is 36.3 Years.
What is the Average Family Size in Mosses
Average Family Size in Mosses is 4.2 People.
What is the Average Household Size in Mosses
Average Household Size in Mosses is 2.8 People.
How Large is the Labor Force in Mosses?
There are 252 People in the Labor Forcein in Mosses.
What is the Percentage of People in the Labor Force in Mosses?
40.6% of People are in the Labor Force in Mosses.
What is the Unemployment Rate in Mosses?
Unemployment Rate in Mosses is 8.2%.