Chunchula, AL Map & Demographics
Chunchula Map
Chunchula Overview
$22,139
PER CAPITA INCOME
$138,750
AVG FAMILY INCOME
0.45
INEQUALITY / GINI INDEX
152
TOTAL POPULATION
40
MALE POPULATION
112
FEMALE POPULATION
35.71
MALES / 100 FEMALES
280.00
FEMALES / 100 MALES
49.3
MEDIAN AGE
5.2
AVG FAMILY SIZE
3.6
AVG HOUSEHOLD SIZE
39
LABOR FORCE [ PEOPLE ]
32.8%
PERCENT IN LABOR FORCE
Chunchula Zip Codes
Chunchula Area Codes
Income in Chunchula
Income Overview in Chunchula
| Characteristic | Number | Measure |
| Per Capita Income | 152 | $22,139 |
| Median Family Income | 26 | $138,750 |
| Mean Family Income | 26 | $115,738 |
| Median Household Income | 42 | $0 |
| Mean Household Income | 42 | $77,755 |
| Income Deficit | 26 | $0 |
| Wage / Income Gap (%) | 152 | 0.00% |
| Wage / Income Gap ($) | 152 | 100.00¢ per $1 |
| Gini / Inequality Index | 152 | 0.45 |
Earnings by Sex in Chunchula
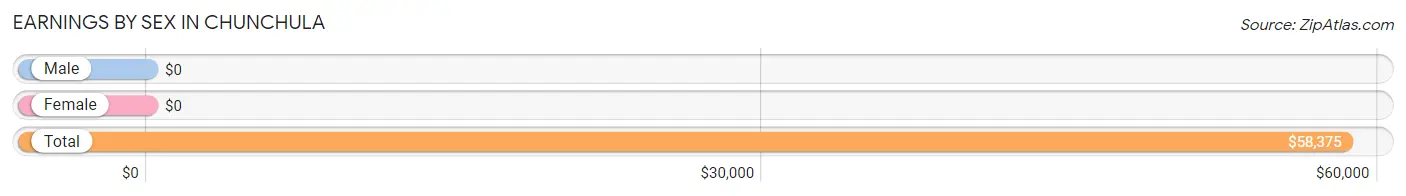
| Sex | Number | Average Earnings |
| Male | 29 (61.7%) | $0 |
| Female | 18 (38.3%) | $0 |
| Total | 47 (100.0%) | $58,375 |
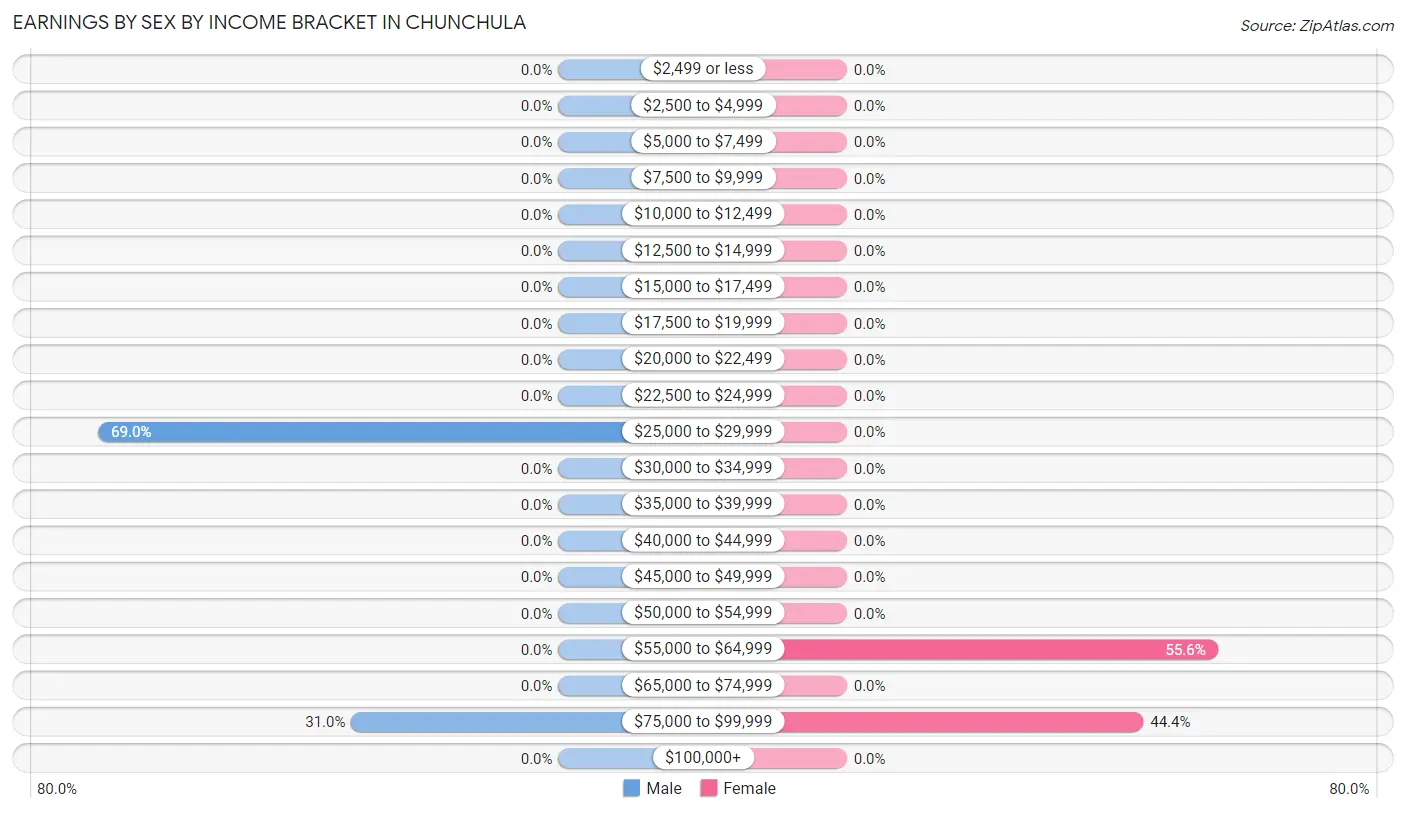
Earnings by Sex by Income Bracket in Chunchula
The most common earnings brackets in Chunchula are $25,000 to $29,999 for men (20 | 69.0%) and $55,000 to $64,999 for women (10 | 55.6%).
| Income | Male | Female |
| $2,499 or less | 0 (0.0%) | 0 (0.0%) |
| $2,500 to $4,999 | 0 (0.0%) | 0 (0.0%) |
| $5,000 to $7,499 | 0 (0.0%) | 0 (0.0%) |
| $7,500 to $9,999 | 0 (0.0%) | 0 (0.0%) |
| $10,000 to $12,499 | 0 (0.0%) | 0 (0.0%) |
| $12,500 to $14,999 | 0 (0.0%) | 0 (0.0%) |
| $15,000 to $17,499 | 0 (0.0%) | 0 (0.0%) |
| $17,500 to $19,999 | 0 (0.0%) | 0 (0.0%) |
| $20,000 to $22,499 | 0 (0.0%) | 0 (0.0%) |
| $22,500 to $24,999 | 0 (0.0%) | 0 (0.0%) |
| $25,000 to $29,999 | 20 (69.0%) | 0 (0.0%) |
| $30,000 to $34,999 | 0 (0.0%) | 0 (0.0%) |
| $35,000 to $39,999 | 0 (0.0%) | 0 (0.0%) |
| $40,000 to $44,999 | 0 (0.0%) | 0 (0.0%) |
| $45,000 to $49,999 | 0 (0.0%) | 0 (0.0%) |
| $50,000 to $54,999 | 0 (0.0%) | 0 (0.0%) |
| $55,000 to $64,999 | 0 (0.0%) | 10 (55.6%) |
| $65,000 to $74,999 | 0 (0.0%) | 0 (0.0%) |
| $75,000 to $99,999 | 9 (31.0%) | 8 (44.4%) |
| $100,000+ | 0 (0.0%) | 0 (0.0%) |
| Total | 29 (100.0%) | 18 (100.0%) |
Earnings by Sex by Educational Attainment in Chunchula
| Educational Attainment | Male Income | Female Income |
| Less than High School | - | - |
| High School Diploma | - | - |
| College or Associate's Degree | - | - |
| Bachelor's Degree | - | - |
| Graduate Degree | - | - |
| Total | - | - |
Family Income in Chunchula
Family Income Brackets in Chunchula
According to the Chunchula family income data, there are 10 families falling into the $100,000 to $149,999 income range, which is the most common income bracket and makes up 38.5% of all families.
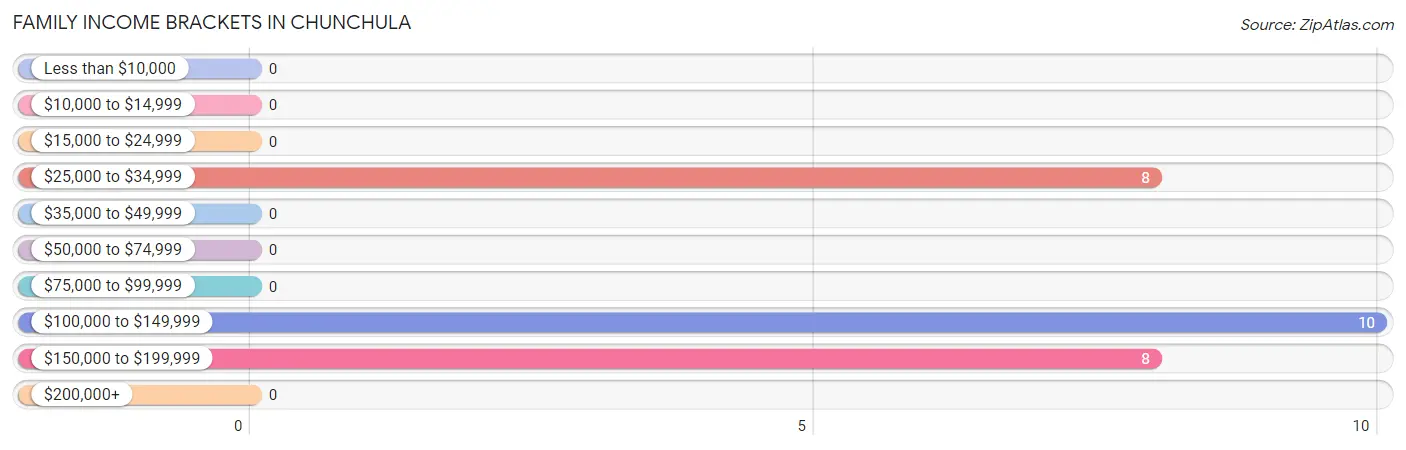
| Income Bracket | # Families | % Families |
| Less than $10,000 | 0 | 0.0% |
| $10,000 to $14,999 | 0 | 0.0% |
| $15,000 to $24,999 | 0 | 0.0% |
| $25,000 to $34,999 | 8 | 30.8% |
| $35,000 to $49,999 | 0 | 0.0% |
| $50,000 to $74,999 | 0 | 0.0% |
| $75,000 to $99,999 | 0 | 0.0% |
| $100,000 to $149,999 | 10 | 38.5% |
| $150,000 to $199,999 | 8 | 30.8% |
| $200,000+ | 0 | 0.0% |
Family Income by Famaliy Size in Chunchula
| Income Bracket | # Families | Median Income |
| 2-Person Families | 10 (38.5%) | $0 |
| 3-Person Families | 8 (30.8%) | $0 |
| 4-Person Families | 0 (0.0%) | $0 |
| 5-Person Families | 0 (0.0%) | $0 |
| 6-Person Families | 0 (0.0%) | $0 |
| 7+ Person Families | 8 (30.8%) | $0 |
| Total | 26 (100.0%) | $138,750 |
Family Income by Number of Earners in Chunchula
| Number of Earners | # Families | Median Income |
| No Earners | 8 (30.8%) | $0 |
| 1 Earner | 0 (0.0%) | $0 |
| 2 Earners | 10 (38.5%) | $0 |
| 3+ Earners | 8 (30.8%) | $0 |
| Total | 26 (100.0%) | $138,750 |
Household Income in Chunchula
Household Income Brackets in Chunchula
With 16 households falling in the category, the $15,000 to $24,999 income range is the most frequent in Chunchula, accounting for 38.1% of all households.
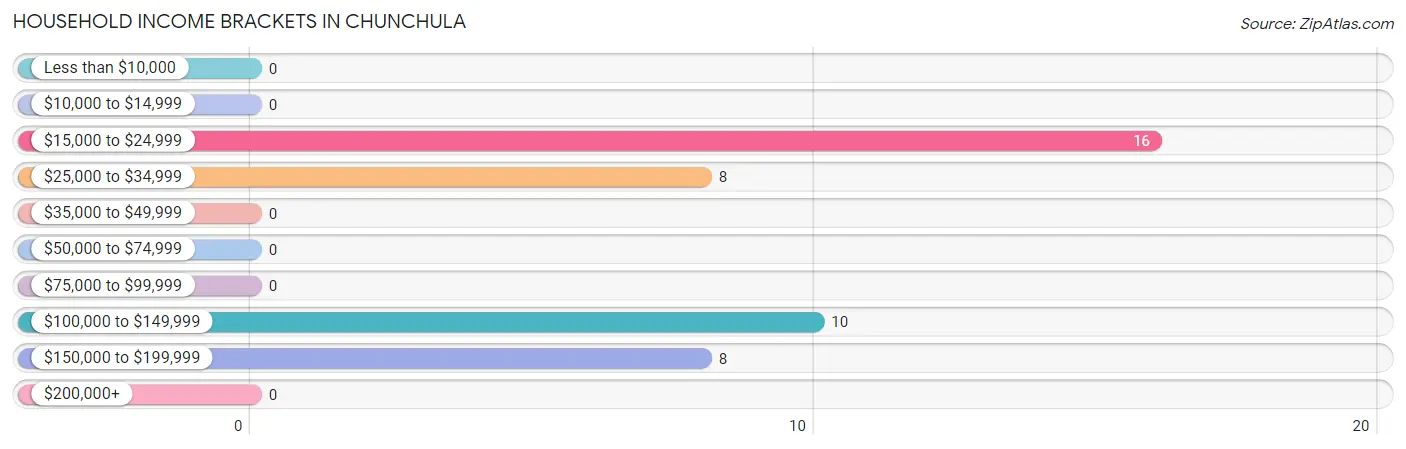
| Income Bracket | # Households | % Households |
| Less than $10,000 | 0 | 0.0% |
| $10,000 to $14,999 | 0 | 0.0% |
| $15,000 to $24,999 | 16 | 38.1% |
| $25,000 to $34,999 | 8 | 19.0% |
| $35,000 to $49,999 | 0 | 0.0% |
| $50,000 to $74,999 | 0 | 0.0% |
| $75,000 to $99,999 | 0 | 0.0% |
| $100,000 to $149,999 | 10 | 23.8% |
| $150,000 to $199,999 | 8 | 19.0% |
| $200,000+ | 0 | 0.0% |
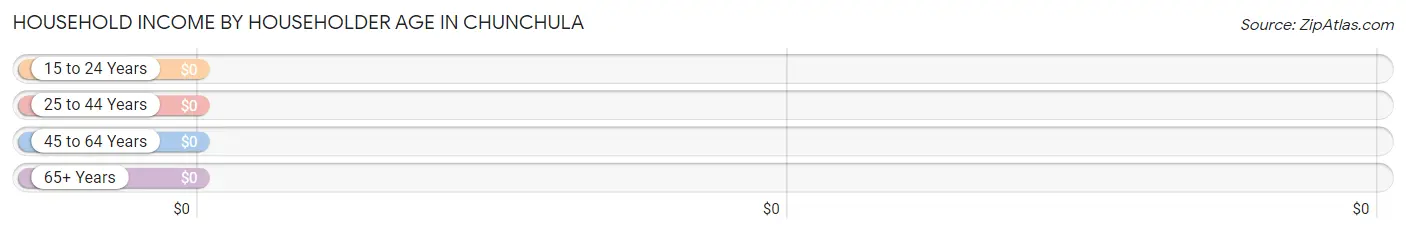
Household Income by Householder Age in Chunchula
| Income Bracket | # Households | Median Income |
| 15 to 24 Years | 0 (0.0%) | $0 |
| 25 to 44 Years | 0 (0.0%) | $0 |
| 45 to 64 Years | 18 (42.9%) | $0 |
| 65+ Years | 24 (57.1%) | $0 |
| Total | 42 (100.0%) | $0 |
Poverty in Chunchula
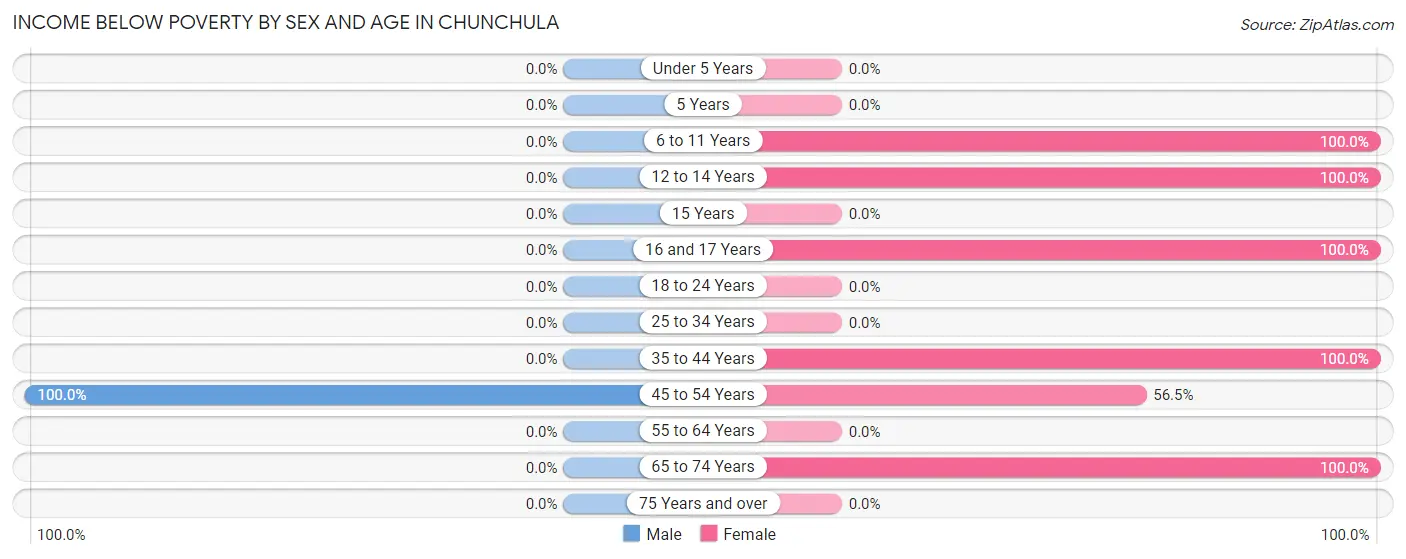
Income Below Poverty by Sex and Age in Chunchula
With 27.5% poverty level for males and 69.6% for females among the residents of Chunchula, 45 to 54 year old males and 6 to 11 year old females are the most vulnerable to poverty, with 11 males (100.0%) and 22 females (100.0%) in their respective age groups living below the poverty level.
| Age Bracket | Male | Female |
| Under 5 Years | 0 (0.0%) | 0 (0.0%) |
| 5 Years | 0 (0.0%) | 0 (0.0%) |
| 6 to 11 Years | 0 (0.0%) | 22 (100.0%) |
| 12 to 14 Years | 0 (0.0%) | 11 (100.0%) |
| 15 Years | 0 (0.0%) | 0 (0.0%) |
| 16 and 17 Years | 0 (0.0%) | 11 (100.0%) |
| 18 to 24 Years | 0 (0.0%) | 0 (0.0%) |
| 25 to 34 Years | 0 (0.0%) | 0 (0.0%) |
| 35 to 44 Years | 0 (0.0%) | 13 (100.0%) |
| 45 to 54 Years | 11 (100.0%) | 13 (56.5%) |
| 55 to 64 Years | 0 (0.0%) | 0 (0.0%) |
| 65 to 74 Years | 0 (0.0%) | 8 (100.0%) |
| 75 Years and over | 0 (0.0%) | 0 (0.0%) |
| Total | 11 (27.5%) | 78 (69.6%) |
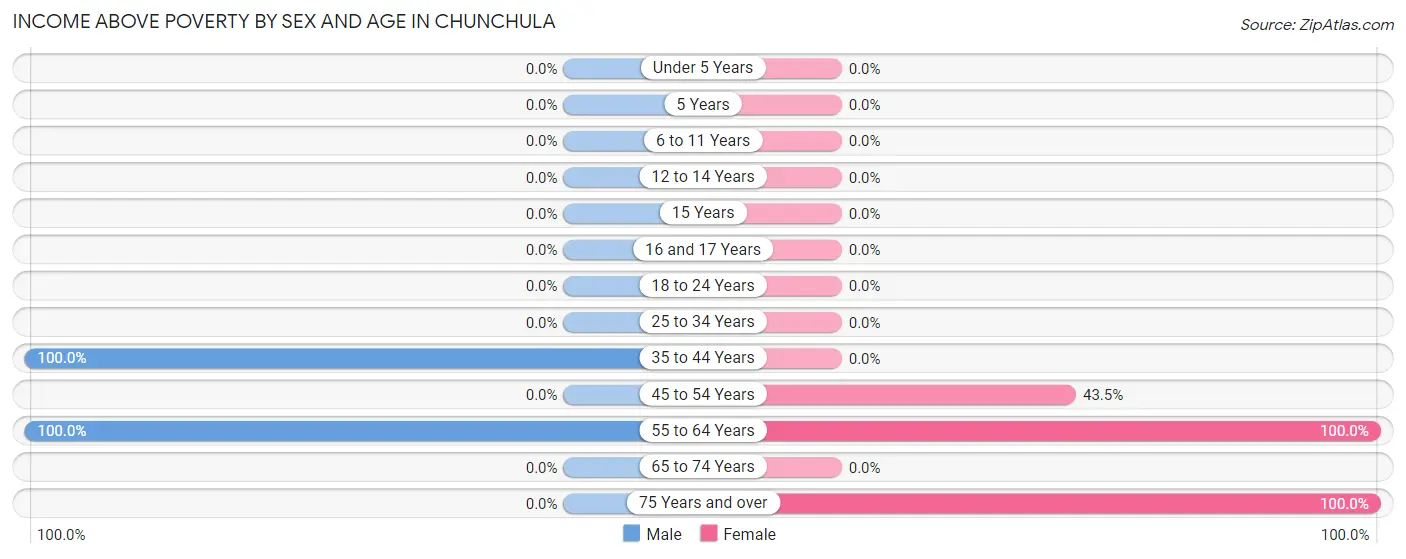
Income Above Poverty by Sex and Age in Chunchula
According to the poverty statistics in Chunchula, males aged 35 to 44 years and females aged 55 to 64 years are the age groups that are most secure financially, with 100.0% of males and 100.0% of females in these age groups living above the poverty line.
| Age Bracket | Male | Female |
| Under 5 Years | 0 (0.0%) | 0 (0.0%) |
| 5 Years | 0 (0.0%) | 0 (0.0%) |
| 6 to 11 Years | 0 (0.0%) | 0 (0.0%) |
| 12 to 14 Years | 0 (0.0%) | 0 (0.0%) |
| 15 Years | 0 (0.0%) | 0 (0.0%) |
| 16 and 17 Years | 0 (0.0%) | 0 (0.0%) |
| 18 to 24 Years | 0 (0.0%) | 0 (0.0%) |
| 25 to 34 Years | 0 (0.0%) | 0 (0.0%) |
| 35 to 44 Years | 12 (100.0%) | 0 (0.0%) |
| 45 to 54 Years | 0 (0.0%) | 10 (43.5%) |
| 55 to 64 Years | 17 (100.0%) | 8 (100.0%) |
| 65 to 74 Years | 0 (0.0%) | 0 (0.0%) |
| 75 Years and over | 0 (0.0%) | 16 (100.0%) |
| Total | 29 (72.5%) | 34 (30.4%) |
Income Below Poverty Among Married-Couple Families in Chunchula
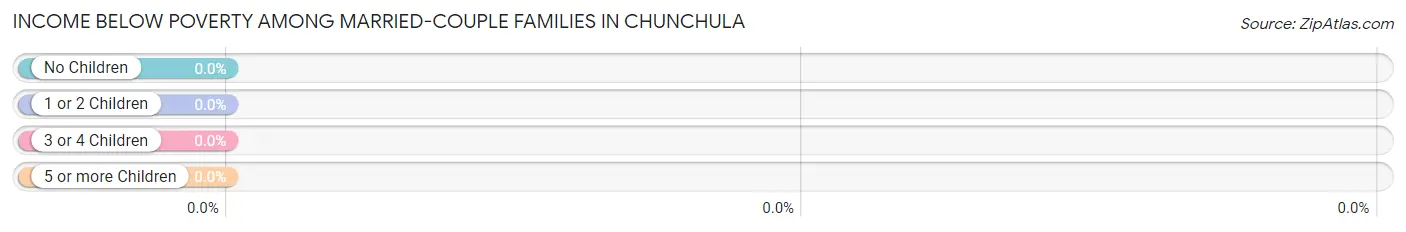
| Children | Above Poverty | Below Poverty |
| No Children | 18 (100.0%) | 0 (0.0%) |
| 1 or 2 Children | 0 (0.0%) | 0 (0.0%) |
| 3 or 4 Children | 0 (0.0%) | 0 (0.0%) |
| 5 or more Children | 0 (0.0%) | 0 (0.0%) |
| Total | 18 (100.0%) | 0 (0.0%) |
Income Below Poverty Among Single-Parent Households in Chunchula
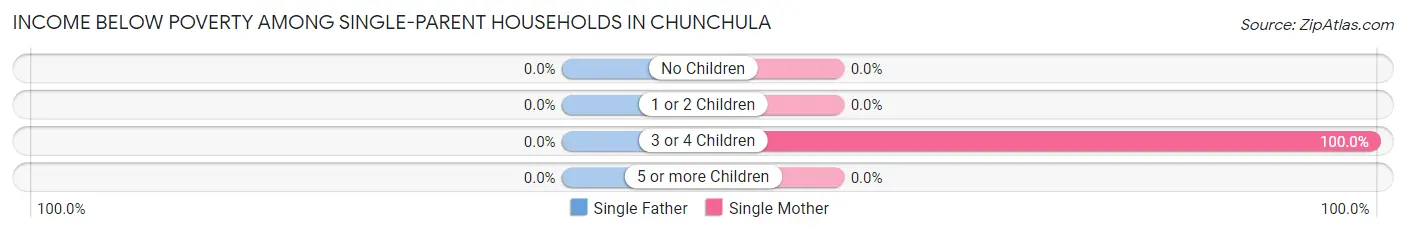
| Children | Single Father | Single Mother |
| No Children | 0 (0.0%) | 0 (0.0%) |
| 1 or 2 Children | 0 (0.0%) | 0 (0.0%) |
| 3 or 4 Children | 0 (0.0%) | 8 (100.0%) |
| 5 or more Children | 0 (0.0%) | 0 (0.0%) |
| Total | 0 (0.0%) | 8 (100.0%) |
Income Below Poverty Among Married-Couple vs Single-Parent Households in Chunchula
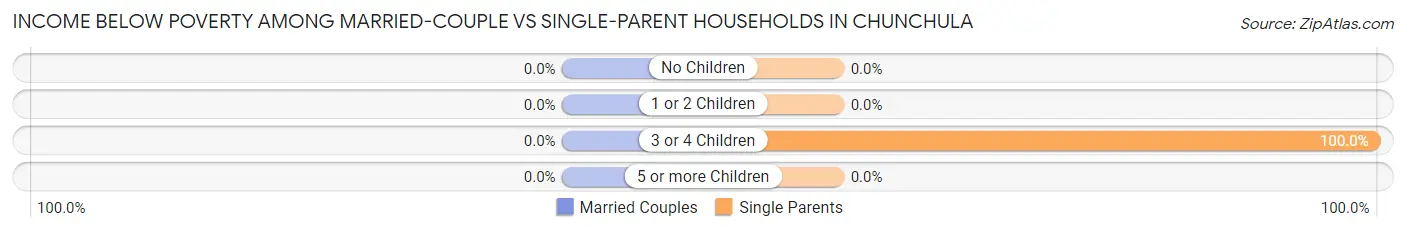
| Children | Married-Couple Families | Single-Parent Households |
| No Children | 0 (0.0%) | 0 (0.0%) |
| 1 or 2 Children | 0 (0.0%) | 0 (0.0%) |
| 3 or 4 Children | 0 (0.0%) | 8 (100.0%) |
| 5 or more Children | 0 (0.0%) | 0 (0.0%) |
| Total | 0 (0.0%) | 8 (100.0%) |
Race in Chunchula
The most populous races in Chunchula are Black / African American (105 | 69.1%), and White / Caucasian (47 | 30.9%).
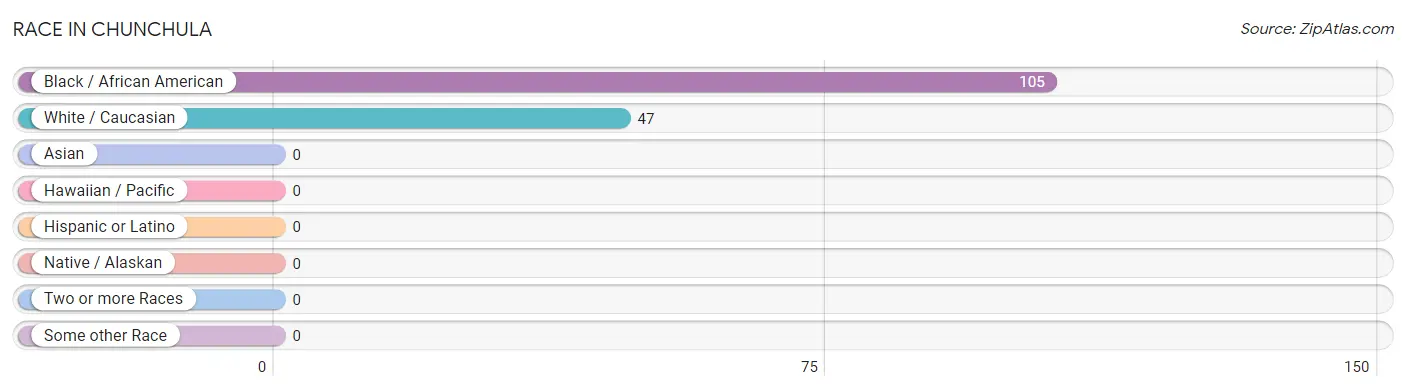
| Race | # Population | % Population |
| Asian | 0 | 0.0% |
| Black / African American | 105 | 69.1% |
| Hawaiian / Pacific | 0 | 0.0% |
| Hispanic or Latino | 0 | 0.0% |
| Native / Alaskan | 0 | 0.0% |
| White / Caucasian | 47 | 30.9% |
| Two or more Races | 0 | 0.0% |
| Some other Race | 0 | 0.0% |
| Total | 152 | 100.0% |
Ancestry in Chunchula
The most populous ancestries reported in Chunchula are English (16 | 10.5%), American (12 | 7.9%), African (8 | 5.3%), and Subsaharan African (8 | 5.3%), together accounting for 28.9% of all Chunchula residents.
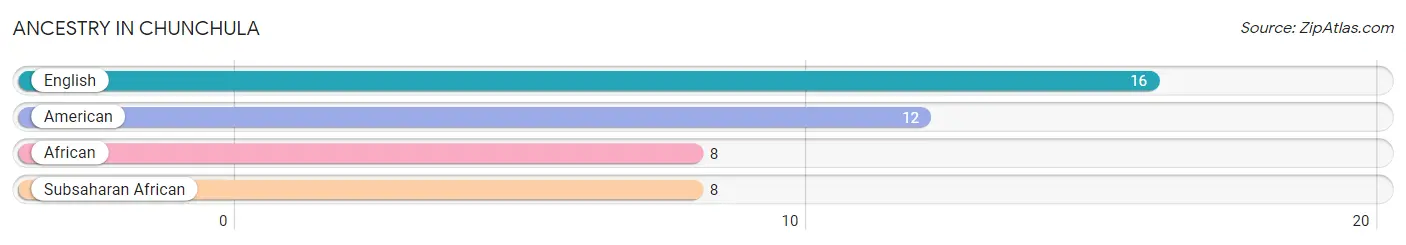
| Ancestry | # Population | % Population |
| African | 8 | 5.3% |
| American | 12 | 7.9% |
| English | 16 | 10.5% |
| Subsaharan African | 8 | 5.3% | View All 4 Rows |
Immigrants in Chunchula

| Immigration Origin | # Population | % Population | View All 0 Rows |
Sex and Age in Chunchula
Sex and Age in Chunchula
The most populous age groups in Chunchula are 35 to 39 Years (12 | 30.0%) for men and 45 to 49 Years (23 | 20.5%) for women.
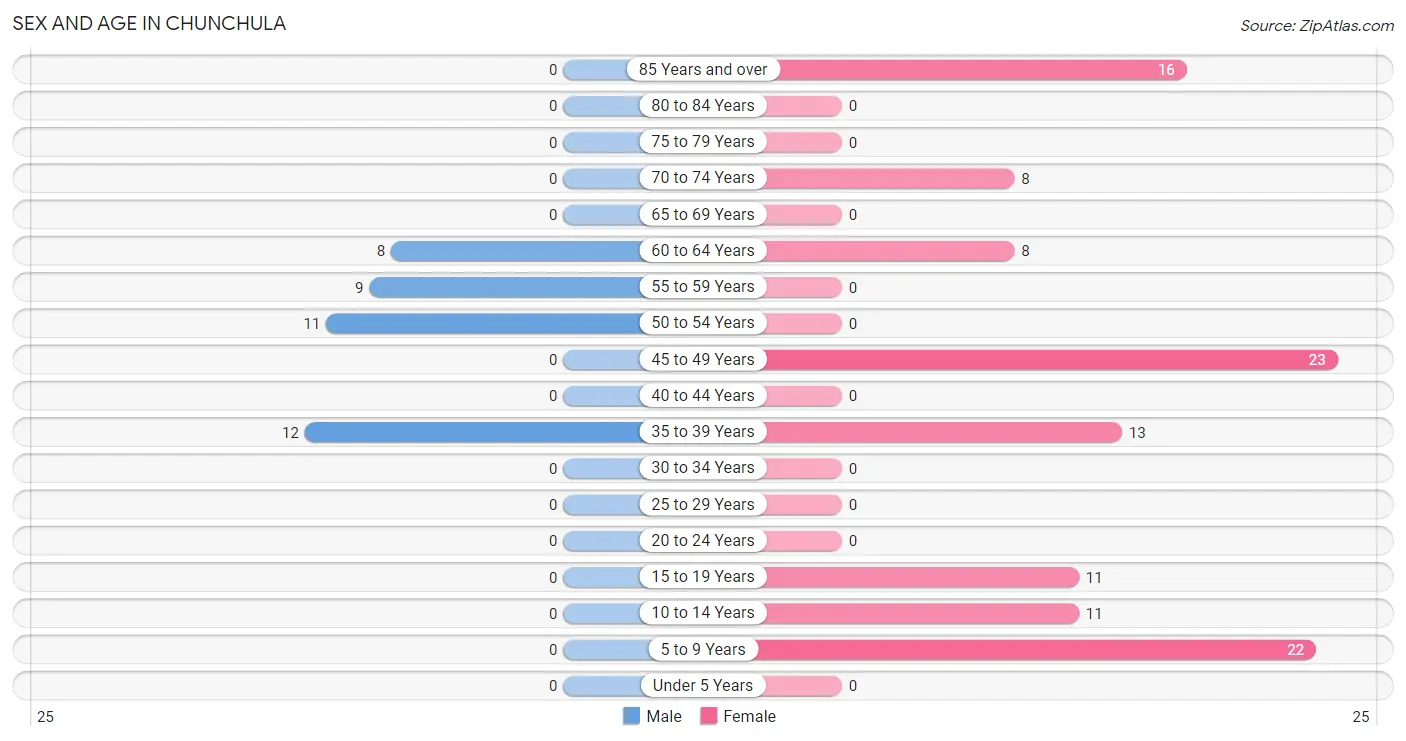
| Age Bracket | Male | Female |
| Under 5 Years | 0 (0.0%) | 0 (0.0%) |
| 5 to 9 Years | 0 (0.0%) | 22 (19.6%) |
| 10 to 14 Years | 0 (0.0%) | 11 (9.8%) |
| 15 to 19 Years | 0 (0.0%) | 11 (9.8%) |
| 20 to 24 Years | 0 (0.0%) | 0 (0.0%) |
| 25 to 29 Years | 0 (0.0%) | 0 (0.0%) |
| 30 to 34 Years | 0 (0.0%) | 0 (0.0%) |
| 35 to 39 Years | 12 (30.0%) | 13 (11.6%) |
| 40 to 44 Years | 0 (0.0%) | 0 (0.0%) |
| 45 to 49 Years | 0 (0.0%) | 23 (20.5%) |
| 50 to 54 Years | 11 (27.5%) | 0 (0.0%) |
| 55 to 59 Years | 9 (22.5%) | 0 (0.0%) |
| 60 to 64 Years | 8 (20.0%) | 8 (7.1%) |
| 65 to 69 Years | 0 (0.0%) | 0 (0.0%) |
| 70 to 74 Years | 0 (0.0%) | 8 (7.1%) |
| 75 to 79 Years | 0 (0.0%) | 0 (0.0%) |
| 80 to 84 Years | 0 (0.0%) | 0 (0.0%) |
| 85 Years and over | 0 (0.0%) | 16 (14.3%) |
| Total | 40 (100.0%) | 112 (100.0%) |
Families and Households in Chunchula
Median Family Size in Chunchula
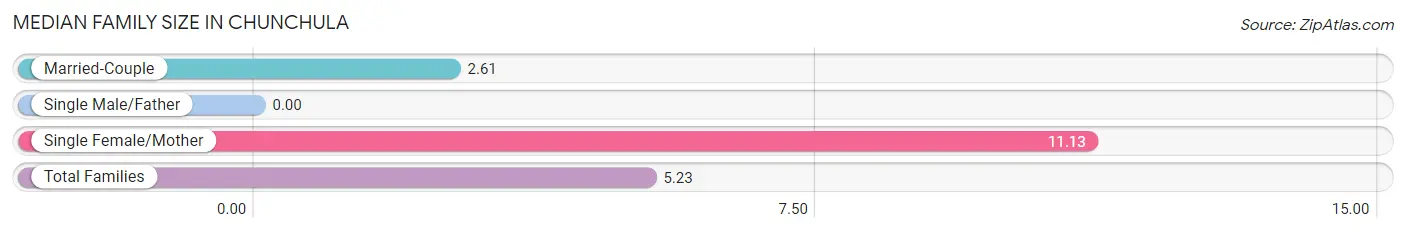
| Family Type | # Families | Family Size |
| Married-Couple | 18 (69.2%) | 2.61 |
| Single Male/Father | 0 (0.0%) | - |
| Single Female/Mother | 8 (30.8%) | 11.13 |
| Total Families | 26 (100.0%) | 5.23 |
Median Household Size in Chunchula
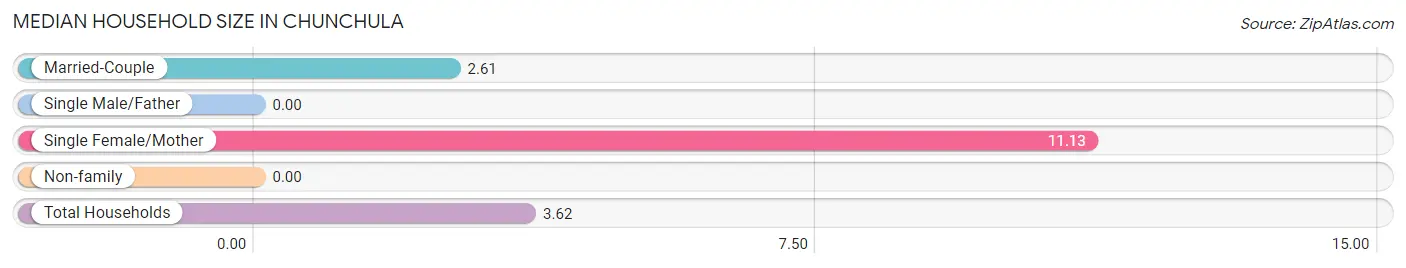
| Household Type | # Households | Household Size |
| Married-Couple | 18 (42.9%) | 2.61 |
| Single Male/Father | 0 (0.0%) | - |
| Single Female/Mother | 8 (19.1%) | 11.13 |
| Non-family | 16 (38.1%) | - |
| Total Households | 42 (100.0%) | 3.62 |
Household Size by Marriage Status in Chunchula
Out of a total of 42 households in Chunchula, 26 (61.9%) are family households, while 16 (38.1%) are nonfamily households. The most numerous type of family households are 2-person households, comprising 10, and the most common type of nonfamily households are 1-person households, comprising 16.
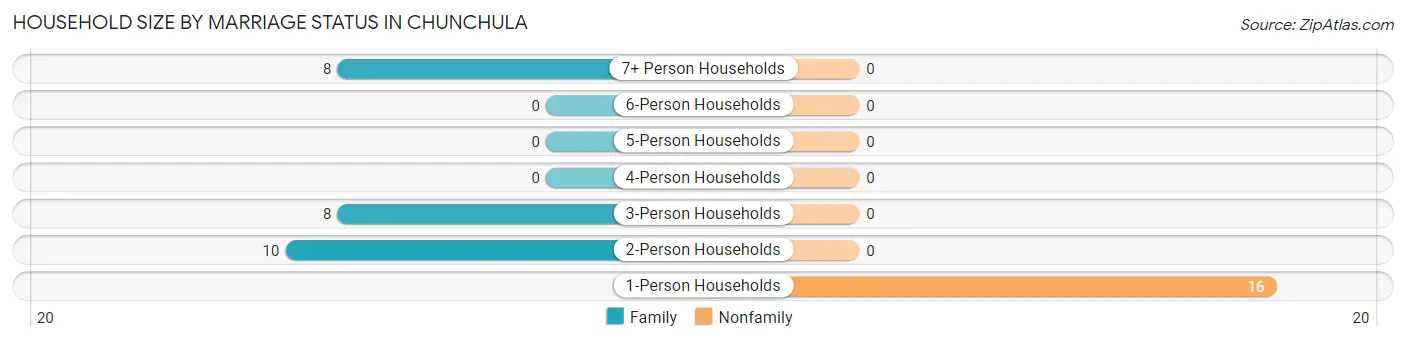
| Household Size | Family Households | Nonfamily Households |
| 1-Person Households | - | 16 (38.1%) |
| 2-Person Households | 10 (23.8%) | 0 (0.0%) |
| 3-Person Households | 8 (19.1%) | 0 (0.0%) |
| 4-Person Households | 0 (0.0%) | 0 (0.0%) |
| 5-Person Households | 0 (0.0%) | 0 (0.0%) |
| 6-Person Households | 0 (0.0%) | 0 (0.0%) |
| 7+ Person Households | 8 (19.1%) | 0 (0.0%) |
| Total | 26 (61.9%) | 16 (38.1%) |
Female Fertility in Chunchula
Fertility by Age in Chunchula
| Age Bracket | Women with Births | Births / 1,000 Women |
| 15 to 19 years | 0 (0.0%) | 0.0 |
| 20 to 34 years | 0 (0.0%) | 0.0 |
| 35 to 50 years | 0 (0.0%) | 0.0 |
| Total | 0 (0.0%) | 0.0 |
Fertility by Age by Marriage Status in Chunchula
| Age Bracket | Married | Unmarried |
| 15 to 19 years | 0 (0.0%) | 0 (0.0%) |
| 20 to 34 years | 0 (0.0%) | 0 (0.0%) |
| 35 to 50 years | 0 (0.0%) | 0 (0.0%) |
| Total | 0 (0.0%) | 0 (0.0%) |
Fertility by Education in Chunchula
| Educational Attainment | Women with Births | Births / 1,000 Women |
| Less than High School | 0 (0.0%) | 0.0 |
| High School Diploma | 0 (0.0%) | 0.0 |
| College or Associate's Degree | 0 (0.0%) | 0.0 |
| Bachelor's Degree | 0 (0.0%) | 0.0 |
| Graduate Degree | 0 (0.0%) | 0.0 |
| Total | 0 (0.0%) | 0.0 |
Fertility by Education by Marriage Status in Chunchula
| Educational Attainment | Married | Unmarried |
| Less than High School | 0 (0.0%) | 0 (0.0%) |
| High School Diploma | 0 (0.0%) | 0 (0.0%) |
| College or Associate's Degree | 0 (0.0%) | 0 (0.0%) |
| Bachelor's Degree | 0 (0.0%) | 0 (0.0%) |
| Graduate Degree | 0 (0.0%) | 0 (0.0%) |
| Total | 0 (0.0%) | 0 (0.0%) |
Employment Characteristics in Chunchula
Employment by Class of Employer in Chunchula
Among the 39 employed individuals in Chunchula, self-employed (incorporated) (19 | 48.7%), state government employees (12 | 30.8%), and local government employees (8 | 20.5%) make up the most common classes of employment.
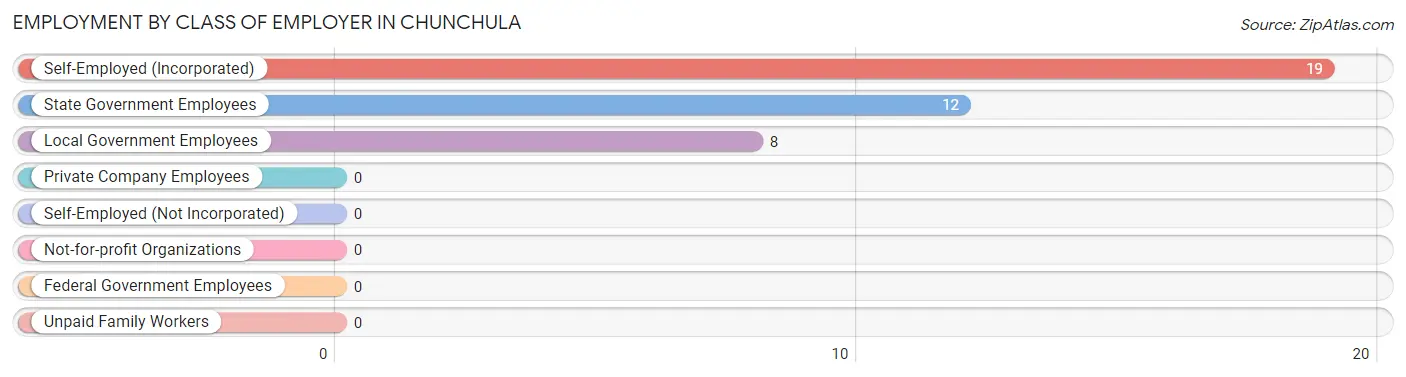
| Employer Class | # Employees | % Employees |
| Private Company Employees | 0 | 0.0% |
| Self-Employed (Incorporated) | 19 | 48.7% |
| Self-Employed (Not Incorporated) | 0 | 0.0% |
| Not-for-profit Organizations | 0 | 0.0% |
| Local Government Employees | 8 | 20.5% |
| State Government Employees | 12 | 30.8% |
| Federal Government Employees | 0 | 0.0% |
| Unpaid Family Workers | 0 | 0.0% |
| Total | 39 | 100.0% |
Employment Status by Age in Chunchula
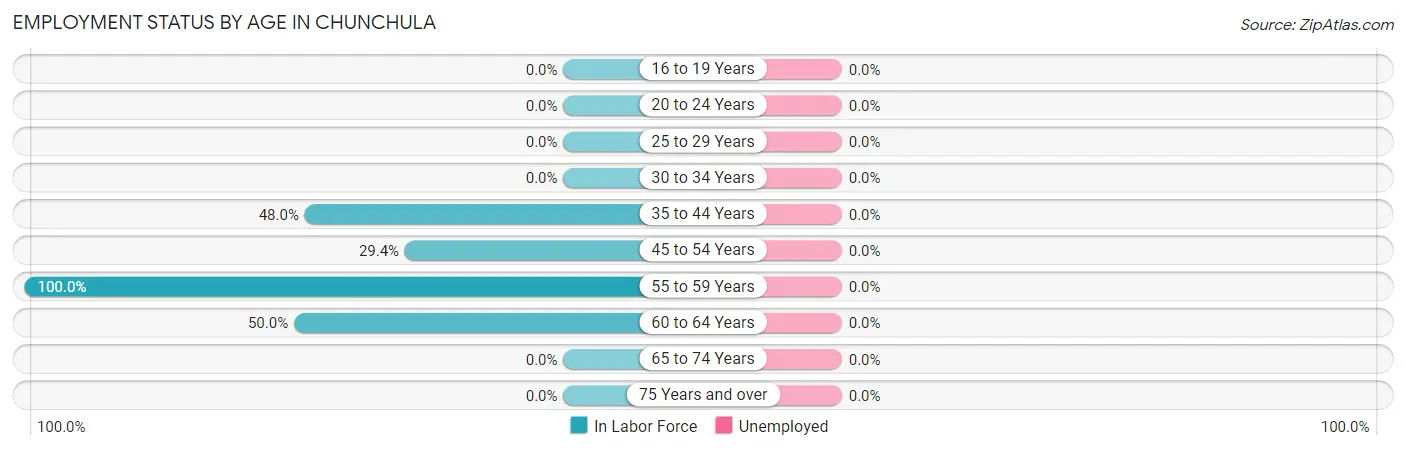
| Age Bracket | In Labor Force | Unemployed |
| 16 to 19 Years | 0 (0.0%) | 0 (0.0%) |
| 20 to 24 Years | 0 (0.0%) | 0 (0.0%) |
| 25 to 29 Years | 0 (0.0%) | 0 (0.0%) |
| 30 to 34 Years | 0 (0.0%) | 0 (0.0%) |
| 35 to 44 Years | 12 (48.0%) | 0 (0.0%) |
| 45 to 54 Years | 10 (29.4%) | 0 (0.0%) |
| 55 to 59 Years | 9 (100.0%) | 0 (0.0%) |
| 60 to 64 Years | 8 (50.0%) | 0 (0.0%) |
| 65 to 74 Years | 0 (0.0%) | 0 (0.0%) |
| 75 Years and over | 0 (0.0%) | 0 (0.0%) |
| Total | 39 (32.8%) | 0 (0.0%) |
Employment Status by Educational Attainment in Chunchula
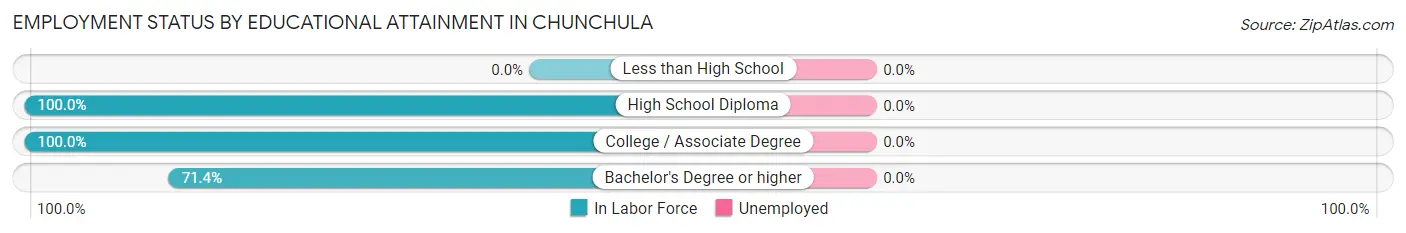
| Educational Attainment | In Labor Force | Unemployed |
| Less than High School | 0 (0.0%) | 0 (0.0%) |
| High School Diploma | 9 (100.0%) | 0 (0.0%) |
| College / Associate Degree | 10 (100.0%) | 0 (0.0%) |
| Bachelor's Degree or higher | 20 (71.4%) | 0 (0.0%) |
| Total | 39 (46.4%) | 0 (0.0%) |
Employment Occupations by Sex in Chunchula
Management, Business, Science and Arts Occupations
The most common Management, Business, Science and Arts occupations in Chunchula are Community & Social Service (12 | 30.8%), Education Instruction & Library (12 | 30.8%), and Management (8 | 20.5%).
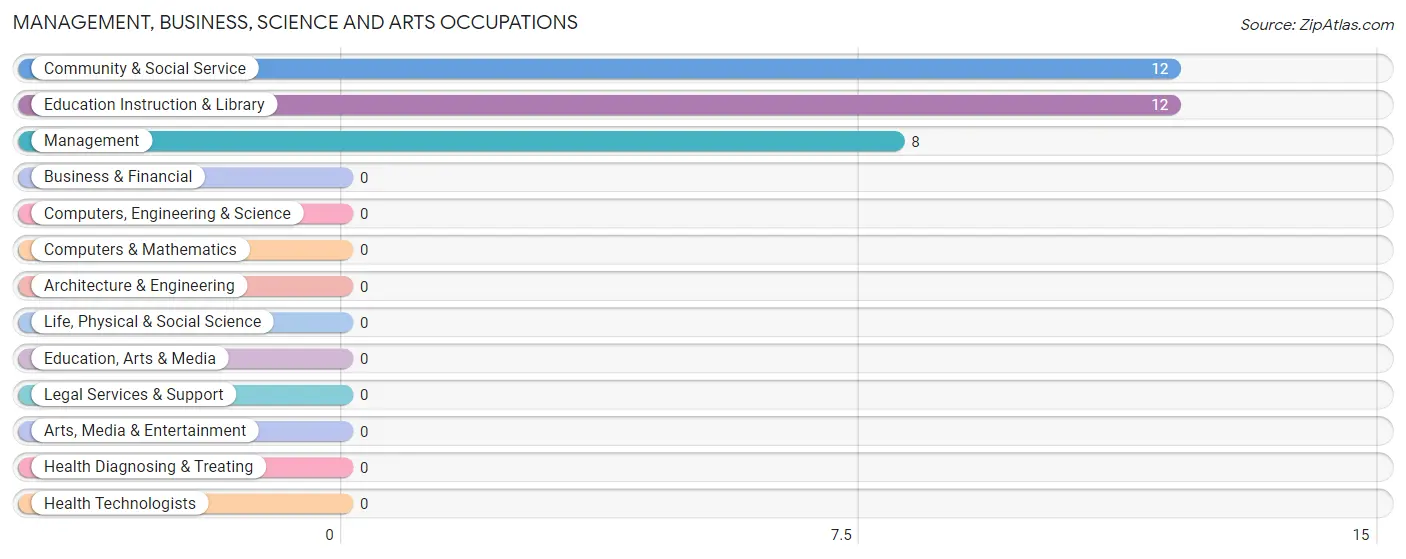
Management, Business, Science and Arts Occupations by Sex
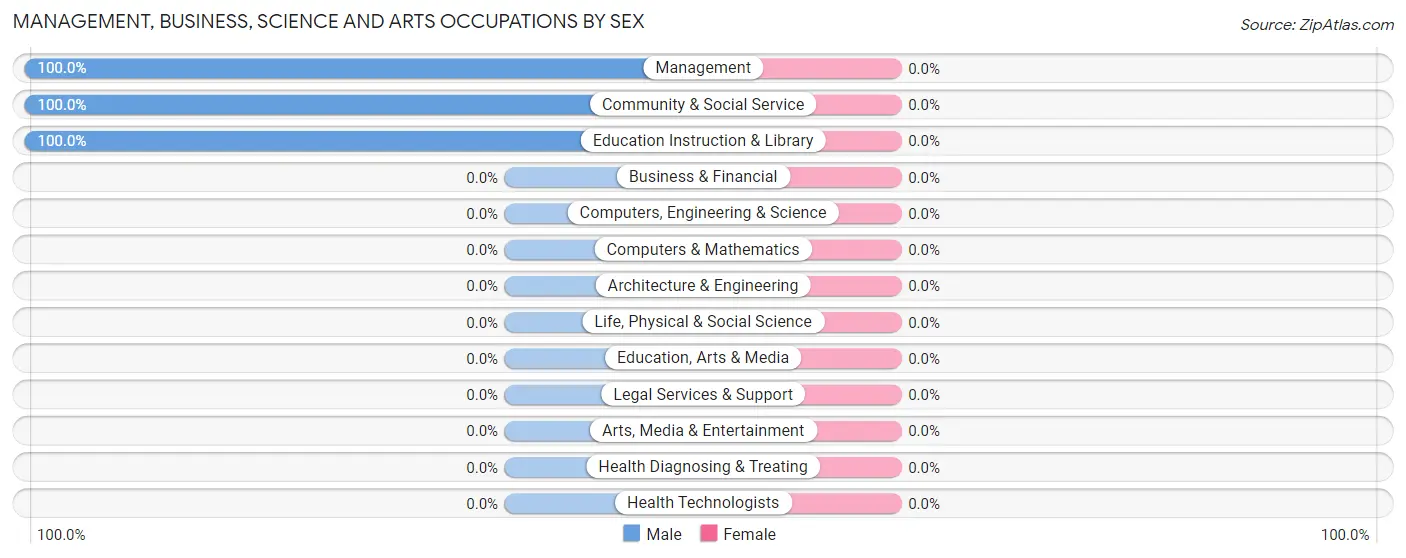
| Occupation | Male | Female |
| Management | 8 (100.0%) | 0 (0.0%) |
| Business & Financial | 0 (0.0%) | 0 (0.0%) |
| Computers, Engineering & Science | 0 (0.0%) | 0 (0.0%) |
| Computers & Mathematics | 0 (0.0%) | 0 (0.0%) |
| Architecture & Engineering | 0 (0.0%) | 0 (0.0%) |
| Life, Physical & Social Science | 0 (0.0%) | 0 (0.0%) |
| Community & Social Service | 12 (100.0%) | 0 (0.0%) |
| Education, Arts & Media | 0 (0.0%) | 0 (0.0%) |
| Legal Services & Support | 0 (0.0%) | 0 (0.0%) |
| Education Instruction & Library | 12 (100.0%) | 0 (0.0%) |
| Arts, Media & Entertainment | 0 (0.0%) | 0 (0.0%) |
| Health Diagnosing & Treating | 0 (0.0%) | 0 (0.0%) |
| Health Technologists | 0 (0.0%) | 0 (0.0%) |
| Total (Category) | 20 (100.0%) | 0 (0.0%) |
| Total (Overall) | 29 (74.4%) | 10 (25.6%) |
Services Occupations
Services Occupations by Sex
| Occupation | Male | Female |
| Healthcare Support | 0 (0.0%) | 0 (0.0%) |
| Security & Protection | 0 (0.0%) | 0 (0.0%) |
| Firefighting & Prevention | 0 (0.0%) | 0 (0.0%) |
| Law Enforcement | 0 (0.0%) | 0 (0.0%) |
| Food Preparation & Serving | 0 (0.0%) | 0 (0.0%) |
| Cleaning & Maintenance | 0 (0.0%) | 0 (0.0%) |
| Personal Care & Service | 0 (0.0%) | 0 (0.0%) |
| Total (Category) | 0 (0.0%) | 0 (0.0%) |
| Total (Overall) | 29 (74.4%) | 10 (25.6%) |
Sales and Office Occupations
The most common Sales and Office occupations in Chunchula are , and Office & Administration (10 | 25.6%).
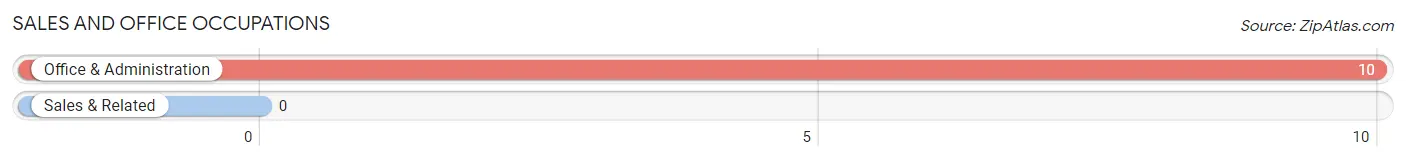
Sales and Office Occupations by Sex
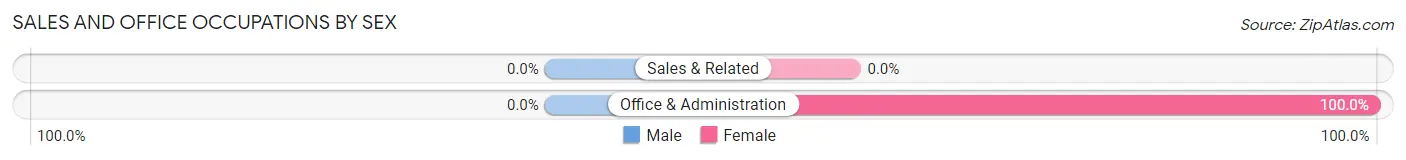
| Occupation | Male | Female |
| Sales & Related | 0 (0.0%) | 0 (0.0%) |
| Office & Administration | 0 (0.0%) | 10 (100.0%) |
| Total (Category) | 0 (0.0%) | 10 (100.0%) |
| Total (Overall) | 29 (74.4%) | 10 (25.6%) |
Natural Resources, Construction and Maintenance Occupations
The most common Natural Resources, Construction and Maintenance occupations in Chunchula are , and Installation, Maintenance & Repair (9 | 23.1%).
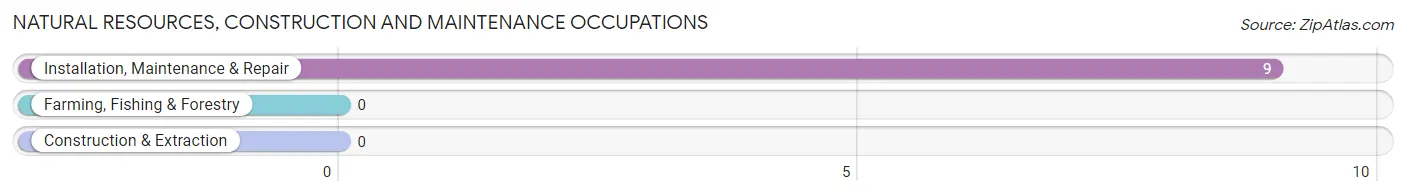
Natural Resources, Construction and Maintenance Occupations by Sex
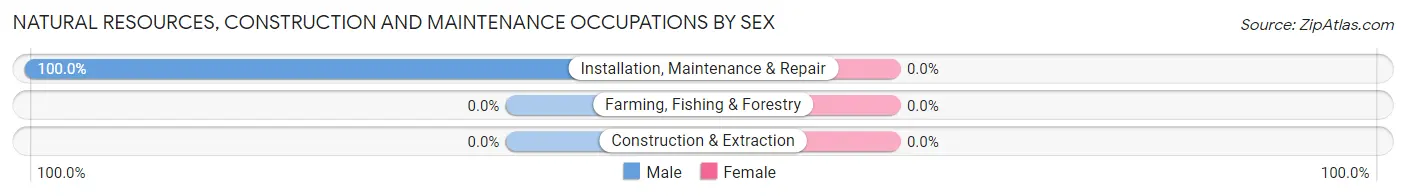
| Occupation | Male | Female |
| Farming, Fishing & Forestry | 0 (0.0%) | 0 (0.0%) |
| Construction & Extraction | 0 (0.0%) | 0 (0.0%) |
| Installation, Maintenance & Repair | 9 (100.0%) | 0 (0.0%) |
| Total (Category) | 9 (100.0%) | 0 (0.0%) |
| Total (Overall) | 29 (74.4%) | 10 (25.6%) |
Production, Transportation and Moving Occupations
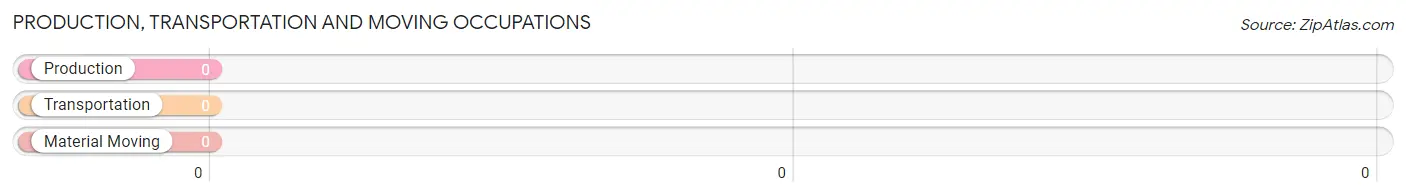
Production, Transportation and Moving Occupations by Sex
| Occupation | Male | Female |
| Production | 0 (0.0%) | 0 (0.0%) |
| Transportation | 0 (0.0%) | 0 (0.0%) |
| Material Moving | 0 (0.0%) | 0 (0.0%) |
| Total (Category) | 0 (0.0%) | 0 (0.0%) |
| Total (Overall) | 29 (74.4%) | 10 (25.6%) |
Employment Industries by Sex in Chunchula
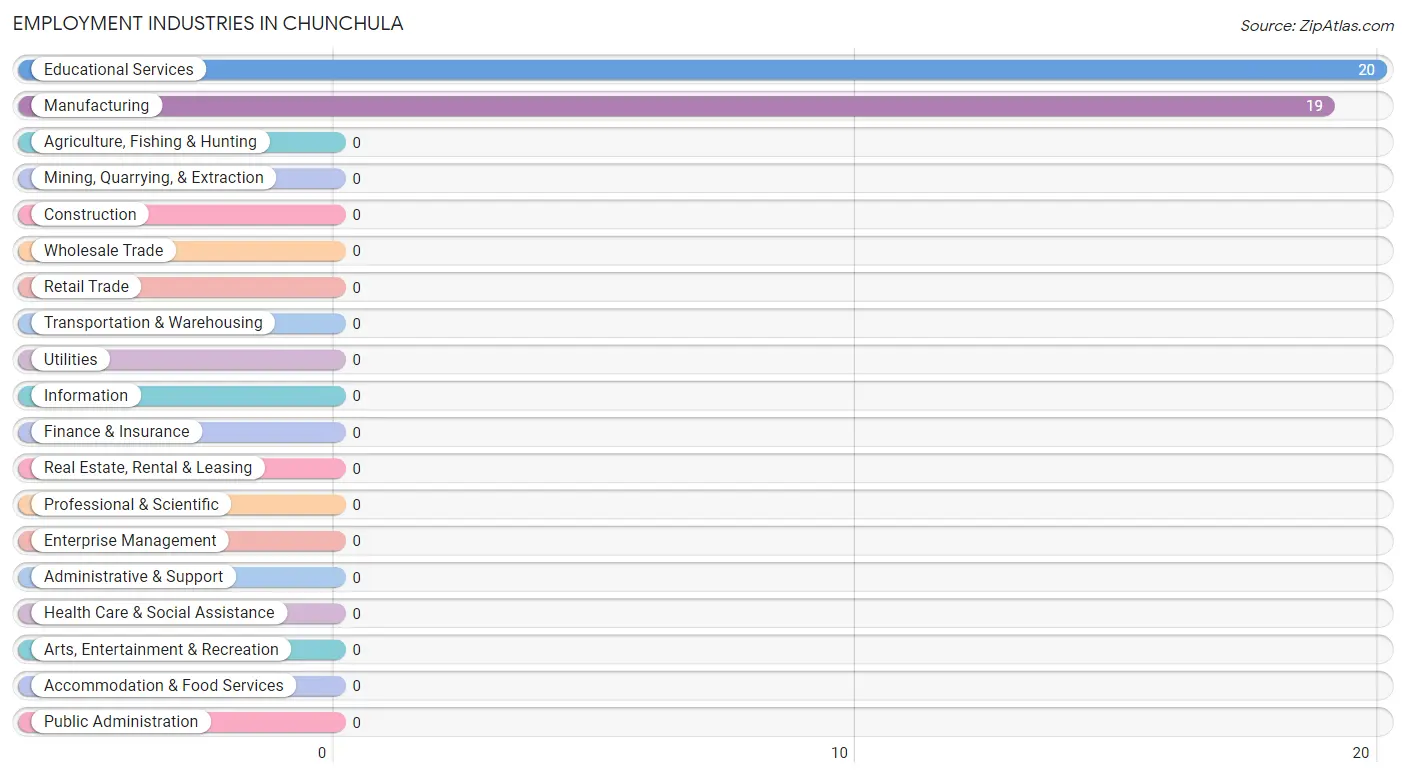
Employment Industries in Chunchula
The major employment industries in Chunchula include Educational Services (20 | 51.3%), and Manufacturing (19 | 48.7%).
Employment Industries by Sex in Chunchula
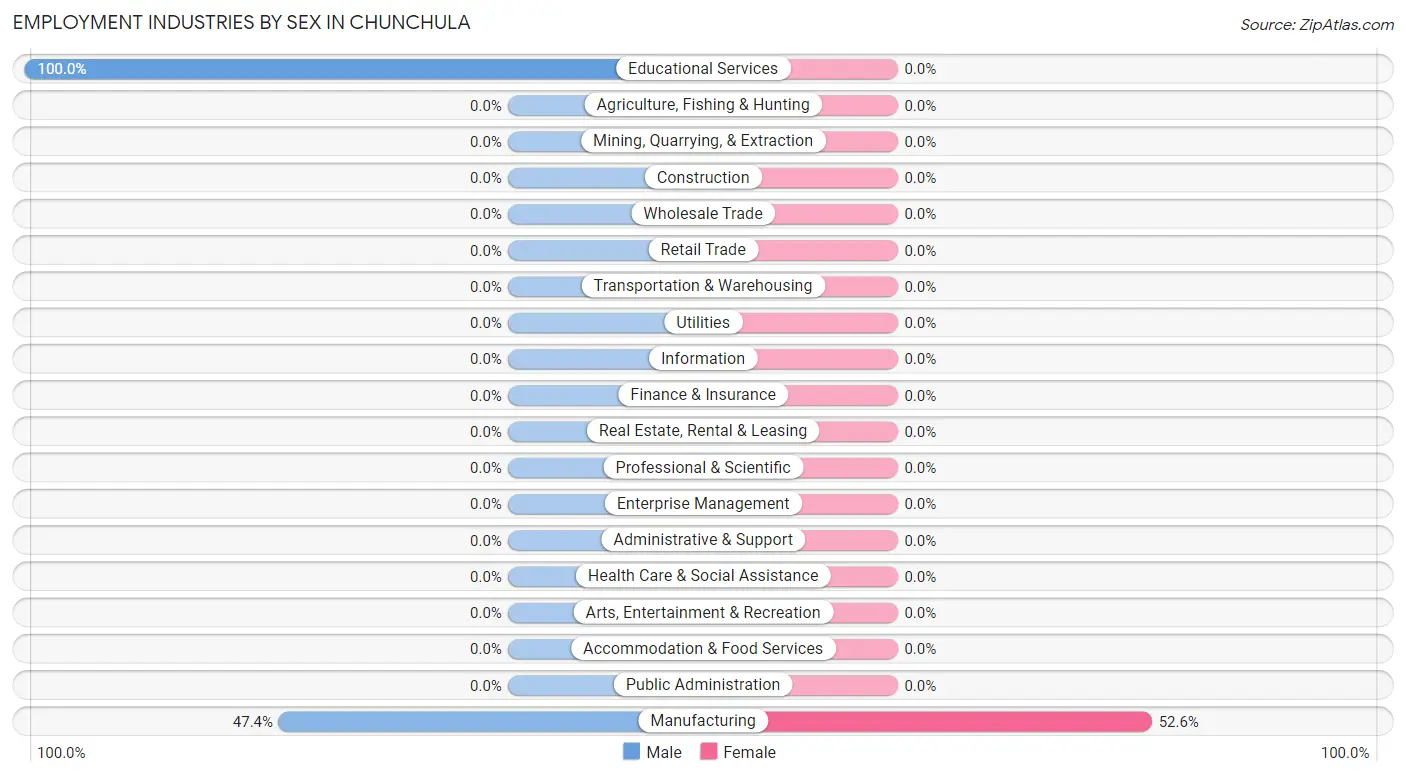
| Industry | Male | Female |
| Agriculture, Fishing & Hunting | 0 (0.0%) | 0 (0.0%) |
| Mining, Quarrying, & Extraction | 0 (0.0%) | 0 (0.0%) |
| Construction | 0 (0.0%) | 0 (0.0%) |
| Manufacturing | 9 (47.4%) | 10 (52.6%) |
| Wholesale Trade | 0 (0.0%) | 0 (0.0%) |
| Retail Trade | 0 (0.0%) | 0 (0.0%) |
| Transportation & Warehousing | 0 (0.0%) | 0 (0.0%) |
| Utilities | 0 (0.0%) | 0 (0.0%) |
| Information | 0 (0.0%) | 0 (0.0%) |
| Finance & Insurance | 0 (0.0%) | 0 (0.0%) |
| Real Estate, Rental & Leasing | 0 (0.0%) | 0 (0.0%) |
| Professional & Scientific | 0 (0.0%) | 0 (0.0%) |
| Enterprise Management | 0 (0.0%) | 0 (0.0%) |
| Administrative & Support | 0 (0.0%) | 0 (0.0%) |
| Educational Services | 20 (100.0%) | 0 (0.0%) |
| Health Care & Social Assistance | 0 (0.0%) | 0 (0.0%) |
| Arts, Entertainment & Recreation | 0 (0.0%) | 0 (0.0%) |
| Accommodation & Food Services | 0 (0.0%) | 0 (0.0%) |
| Public Administration | 0 (0.0%) | 0 (0.0%) |
| Total | 29 (74.4%) | 10 (25.6%) |
Education in Chunchula
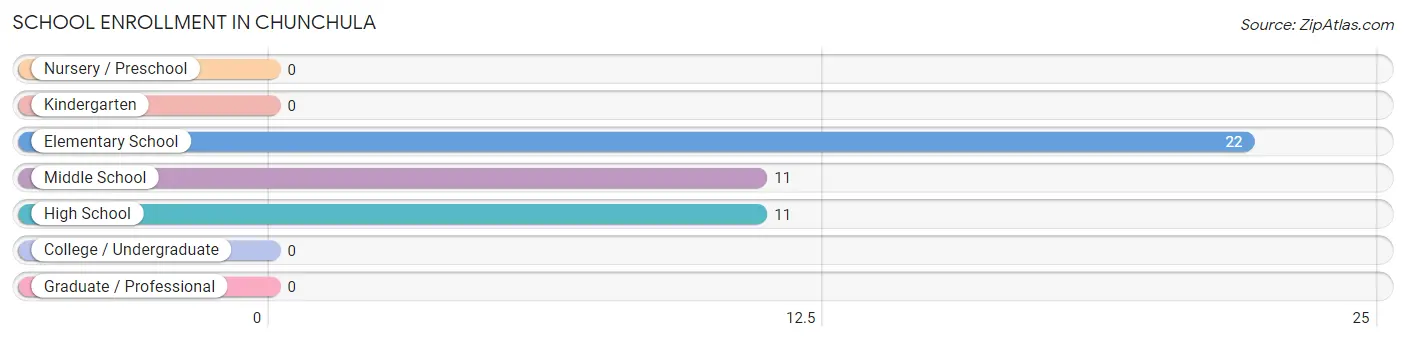
School Enrollment in Chunchula
The most common levels of schooling among the 44 students in Chunchula are elementary school (22 | 50.0%), middle school (11 | 25.0%), and high school (11 | 25.0%).
| School Level | # Students | % Students |
| Nursery / Preschool | 0 | 0.0% |
| Kindergarten | 0 | 0.0% |
| Elementary School | 22 | 50.0% |
| Middle School | 11 | 25.0% |
| High School | 11 | 25.0% |
| College / Undergraduate | 0 | 0.0% |
| Graduate / Professional | 0 | 0.0% |
| Total | 44 | 100.0% |
School Enrollment by Age by Funding Source in Chunchula
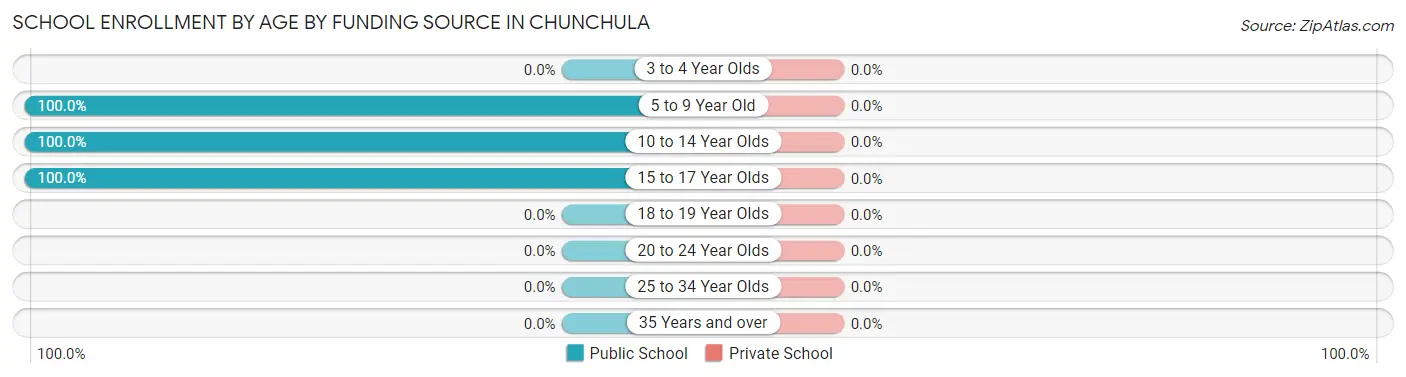
| Age Bracket | Public School | Private School |
| 3 to 4 Year Olds | 0 (0.0%) | 0 (0.0%) |
| 5 to 9 Year Old | 22 (100.0%) | 0 (0.0%) |
| 10 to 14 Year Olds | 11 (100.0%) | 0 (0.0%) |
| 15 to 17 Year Olds | 11 (100.0%) | 0 (0.0%) |
| 18 to 19 Year Olds | 0 (0.0%) | 0 (0.0%) |
| 20 to 24 Year Olds | 0 (0.0%) | 0 (0.0%) |
| 25 to 34 Year Olds | 0 (0.0%) | 0 (0.0%) |
| 35 Years and over | 0 (0.0%) | 0 (0.0%) |
| Total | 44 (100.0%) | 0 (0.0%) |
Educational Attainment by Field of Study in Chunchula
Science & technology (12 | 33.3%), bio, nature & agricultural (8 | 22.2%), physical & health sciences (8 | 22.2%), and engineering (8 | 22.2%) are the most common fields of study among 36 individuals in Chunchula who have obtained a bachelor's degree or higher.
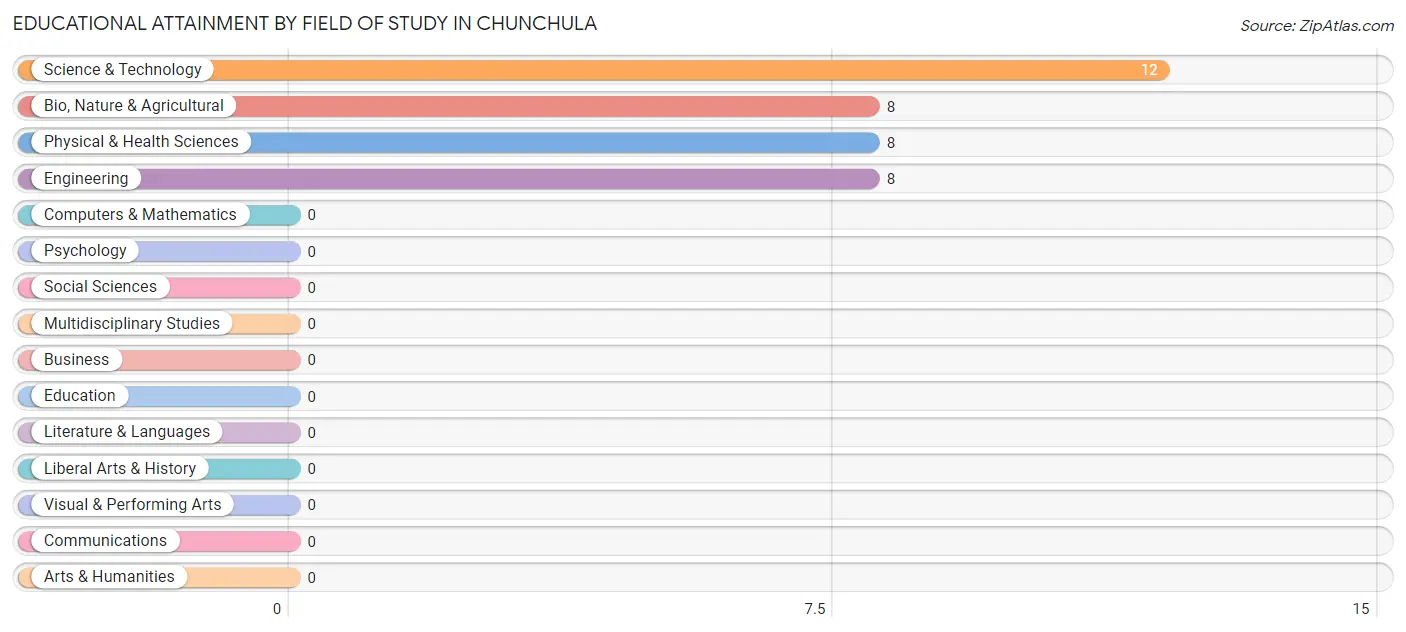
| Field of Study | # Graduates | % Graduates |
| Computers & Mathematics | 0 | 0.0% |
| Bio, Nature & Agricultural | 8 | 22.2% |
| Physical & Health Sciences | 8 | 22.2% |
| Psychology | 0 | 0.0% |
| Social Sciences | 0 | 0.0% |
| Engineering | 8 | 22.2% |
| Multidisciplinary Studies | 0 | 0.0% |
| Science & Technology | 12 | 33.3% |
| Business | 0 | 0.0% |
| Education | 0 | 0.0% |
| Literature & Languages | 0 | 0.0% |
| Liberal Arts & History | 0 | 0.0% |
| Visual & Performing Arts | 0 | 0.0% |
| Communications | 0 | 0.0% |
| Arts & Humanities | 0 | 0.0% |
| Total | 36 | 100.0% |
Transportation & Commute in Chunchula
Vehicle Availability by Sex in Chunchula
The most prevalent vehicle ownership categories in Chunchula are males with 4 vehicles (20, accounting for 69.0%) and females with 4 vehicles (0, making up 200.0%).
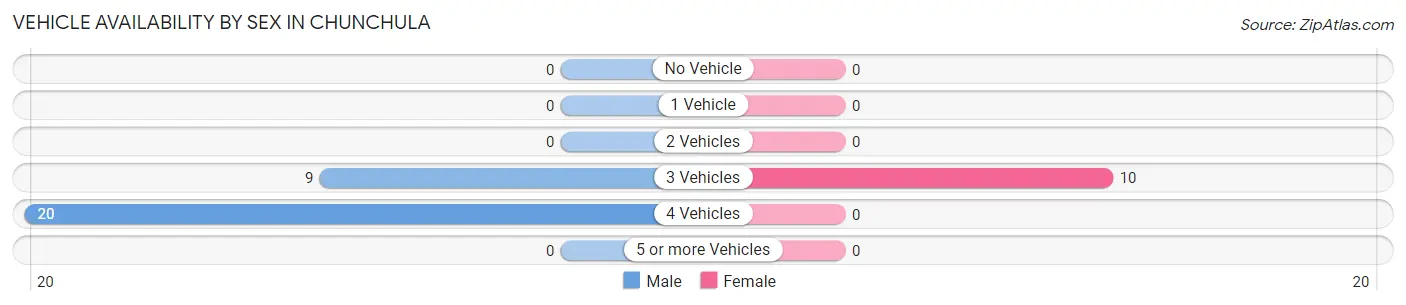
| Vehicles Available | Male | Female |
| No Vehicle | 0 (0.0%) | 0 (0.0%) |
| 1 Vehicle | 0 (0.0%) | 0 (0.0%) |
| 2 Vehicles | 0 (0.0%) | 0 (0.0%) |
| 3 Vehicles | 9 (31.0%) | 10 (100.0%) |
| 4 Vehicles | 20 (69.0%) | 0 (0.0%) |
| 5 or more Vehicles | 0 (0.0%) | 0 (0.0%) |
| Total | 29 (100.0%) | 10 (100.0%) |
Commute Time in Chunchula
The most frequently occuring commute durations in Chunchula are 20 to 24 minutes (20 commuters, 51.3%), 40 to 44 minutes (10 commuters, 25.6%), and 30 to 34 minutes (9 commuters, 23.1%).
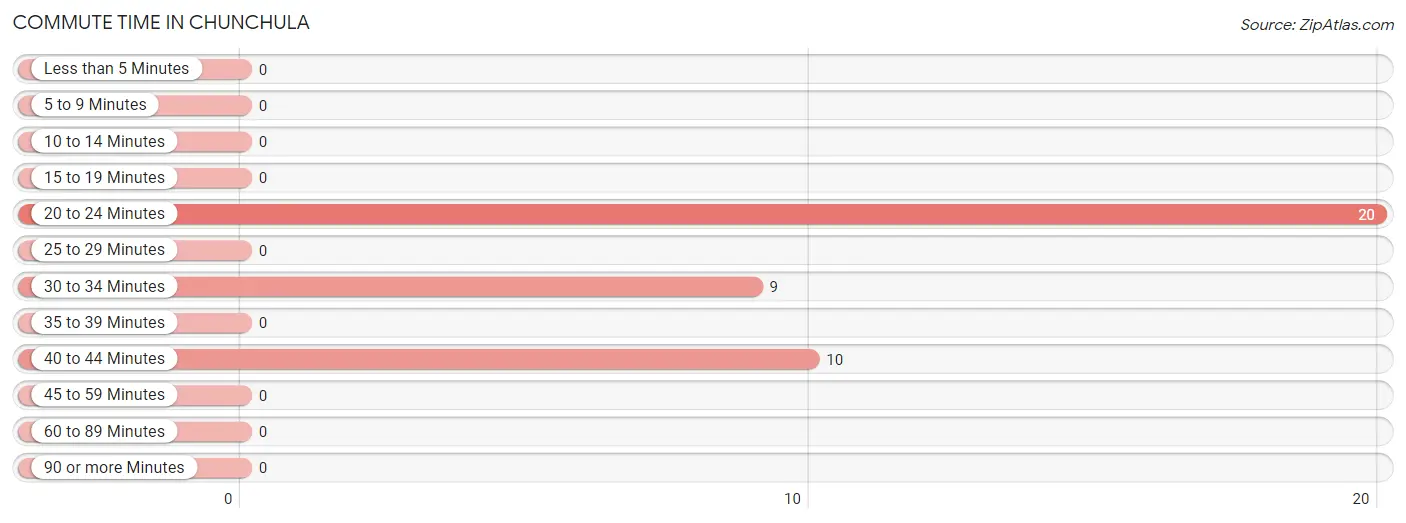
| Commute Time | # Commuters | % Commuters |
| Less than 5 Minutes | 0 | 0.0% |
| 5 to 9 Minutes | 0 | 0.0% |
| 10 to 14 Minutes | 0 | 0.0% |
| 15 to 19 Minutes | 0 | 0.0% |
| 20 to 24 Minutes | 20 | 51.3% |
| 25 to 29 Minutes | 0 | 0.0% |
| 30 to 34 Minutes | 9 | 23.1% |
| 35 to 39 Minutes | 0 | 0.0% |
| 40 to 44 Minutes | 10 | 25.6% |
| 45 to 59 Minutes | 0 | 0.0% |
| 60 to 89 Minutes | 0 | 0.0% |
| 90 or more Minutes | 0 | 0.0% |
Commute Time by Sex in Chunchula
The most common commute times in Chunchula are 20 to 24 minutes (20 commuters, 69.0%) for males and 40 to 44 minutes (10 commuters, 100.0%) for females.
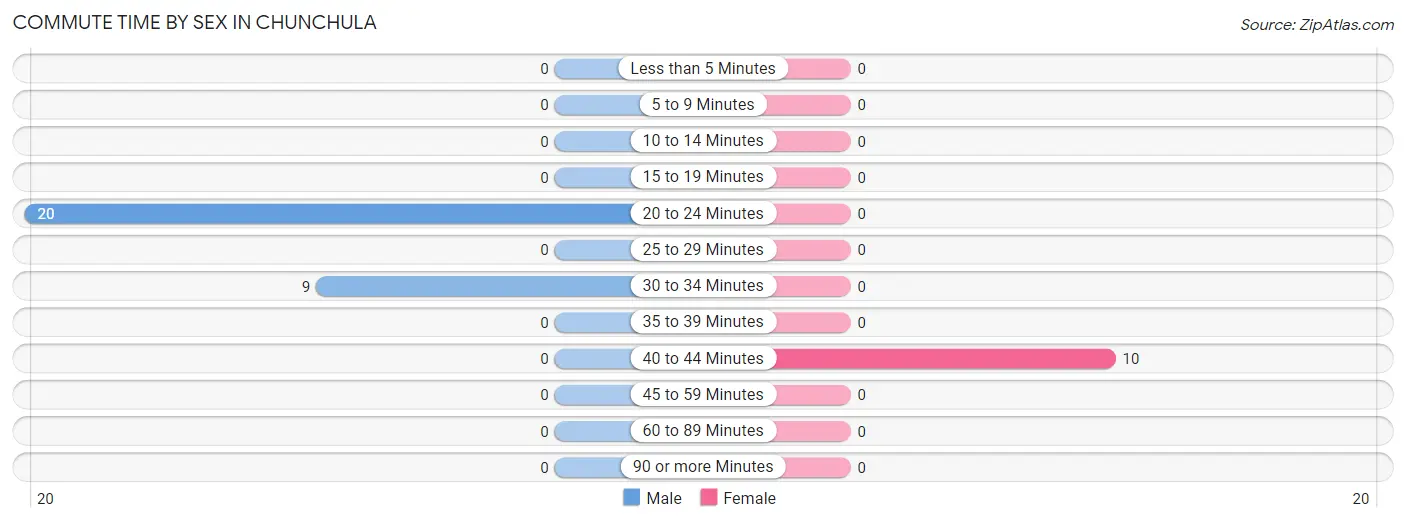
| Commute Time | Male | Female |
| Less than 5 Minutes | 0 (0.0%) | 0 (0.0%) |
| 5 to 9 Minutes | 0 (0.0%) | 0 (0.0%) |
| 10 to 14 Minutes | 0 (0.0%) | 0 (0.0%) |
| 15 to 19 Minutes | 0 (0.0%) | 0 (0.0%) |
| 20 to 24 Minutes | 20 (69.0%) | 0 (0.0%) |
| 25 to 29 Minutes | 0 (0.0%) | 0 (0.0%) |
| 30 to 34 Minutes | 9 (31.0%) | 0 (0.0%) |
| 35 to 39 Minutes | 0 (0.0%) | 0 (0.0%) |
| 40 to 44 Minutes | 0 (0.0%) | 10 (100.0%) |
| 45 to 59 Minutes | 0 (0.0%) | 0 (0.0%) |
| 60 to 89 Minutes | 0 (0.0%) | 0 (0.0%) |
| 90 or more Minutes | 0 (0.0%) | 0 (0.0%) |
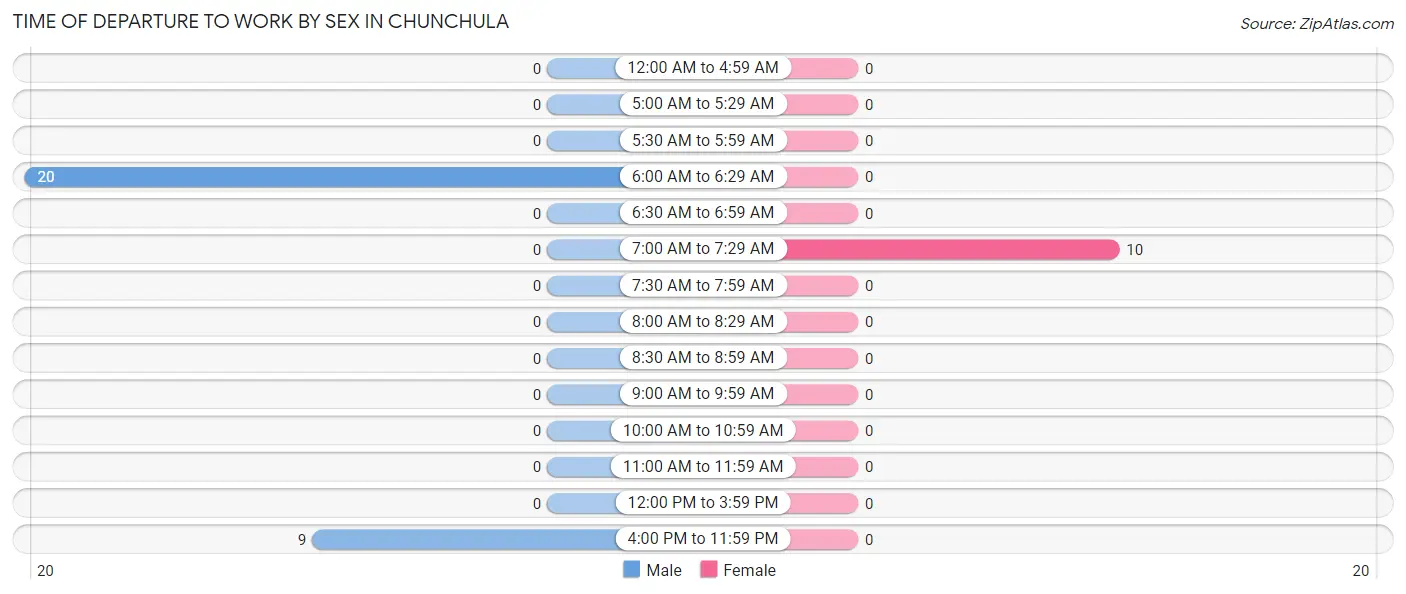
Time of Departure to Work by Sex in Chunchula
The most frequent times of departure to work in Chunchula are 6:00 AM to 6:29 AM (20, 69.0%) for males and 7:00 AM to 7:29 AM (10, 100.0%) for females.
| Time of Departure | Male | Female |
| 12:00 AM to 4:59 AM | 0 (0.0%) | 0 (0.0%) |
| 5:00 AM to 5:29 AM | 0 (0.0%) | 0 (0.0%) |
| 5:30 AM to 5:59 AM | 0 (0.0%) | 0 (0.0%) |
| 6:00 AM to 6:29 AM | 20 (69.0%) | 0 (0.0%) |
| 6:30 AM to 6:59 AM | 0 (0.0%) | 0 (0.0%) |
| 7:00 AM to 7:29 AM | 0 (0.0%) | 10 (100.0%) |
| 7:30 AM to 7:59 AM | 0 (0.0%) | 0 (0.0%) |
| 8:00 AM to 8:29 AM | 0 (0.0%) | 0 (0.0%) |
| 8:30 AM to 8:59 AM | 0 (0.0%) | 0 (0.0%) |
| 9:00 AM to 9:59 AM | 0 (0.0%) | 0 (0.0%) |
| 10:00 AM to 10:59 AM | 0 (0.0%) | 0 (0.0%) |
| 11:00 AM to 11:59 AM | 0 (0.0%) | 0 (0.0%) |
| 12:00 PM to 3:59 PM | 0 (0.0%) | 0 (0.0%) |
| 4:00 PM to 11:59 PM | 9 (31.0%) | 0 (0.0%) |
| Total | 29 (100.0%) | 10 (100.0%) |
Housing Occupancy in Chunchula
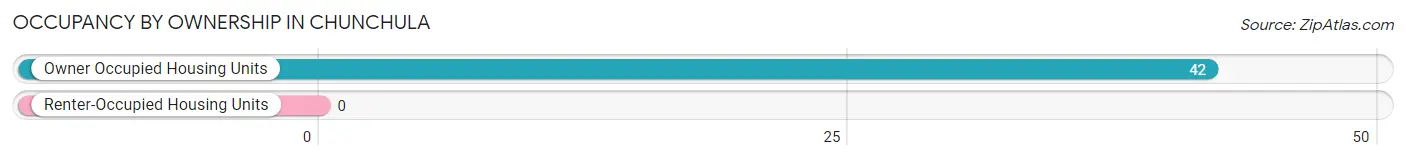
Occupancy by Ownership in Chunchula
Of the total 42 dwellings in Chunchula, owner-occupied units account for 42 (100.0%), while renter-occupied units make up 0 (0.0%).
| Occupancy | # Housing Units | % Housing Units |
| Owner Occupied Housing Units | 42 | 100.0% |
| Renter-Occupied Housing Units | 0 | 0.0% |
| Total Occupied Housing Units | 42 | 100.0% |
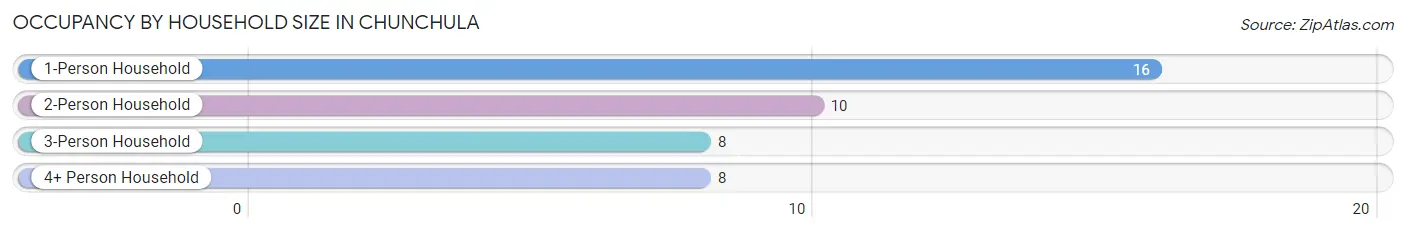
Occupancy by Household Size in Chunchula
| Household Size | # Housing Units | % Housing Units |
| 1-Person Household | 16 | 38.1% |
| 2-Person Household | 10 | 23.8% |
| 3-Person Household | 8 | 19.1% |
| 4+ Person Household | 8 | 19.1% |
| Total Housing Units | 42 | 100.0% |
Occupancy by Ownership by Household Size in Chunchula
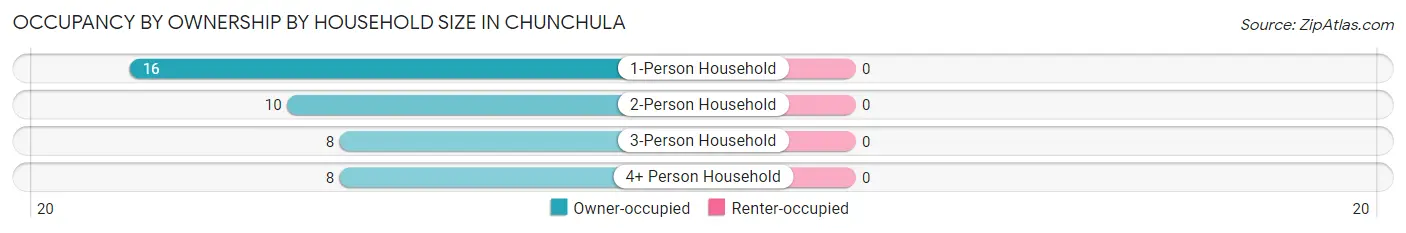
| Household Size | Owner-occupied | Renter-occupied |
| 1-Person Household | 16 (100.0%) | 0 (0.0%) |
| 2-Person Household | 10 (100.0%) | 0 (0.0%) |
| 3-Person Household | 8 (100.0%) | 0 (0.0%) |
| 4+ Person Household | 8 (100.0%) | 0 (0.0%) |
| Total Housing Units | 42 (100.0%) | 0 (0.0%) |
Occupancy by Educational Attainment in Chunchula
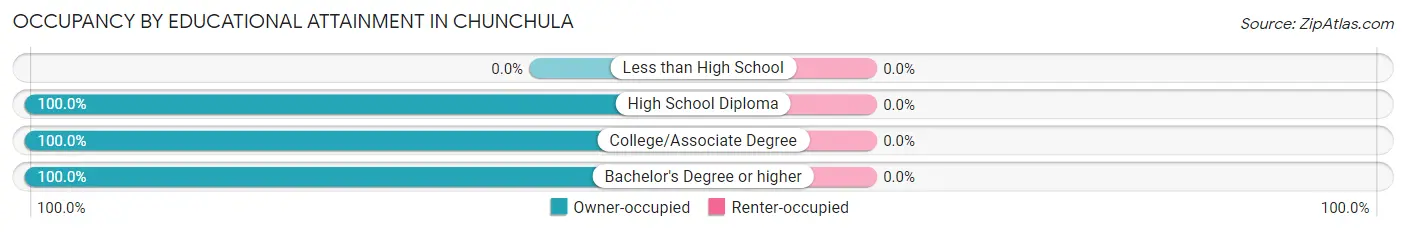
| Household Size | Owner-occupied | Renter-occupied |
| Less than High School | 0 (0.0%) | 0 (0.0%) |
| High School Diploma | 16 (100.0%) | 0 (0.0%) |
| College/Associate Degree | 18 (100.0%) | 0 (0.0%) |
| Bachelor's Degree or higher | 8 (100.0%) | 0 (0.0%) |
Occupancy by Age of Householder in Chunchula
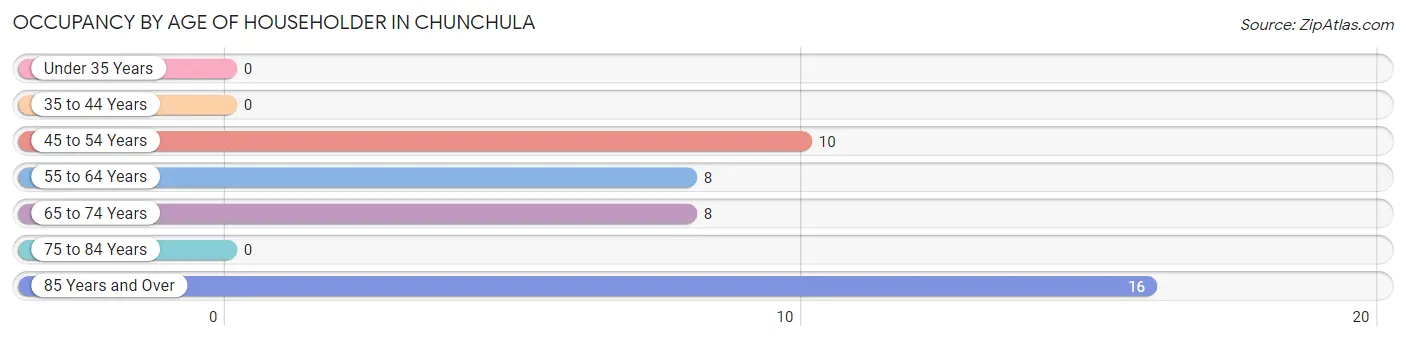
| Age Bracket | # Households | % Households |
| Under 35 Years | 0 | 0.0% |
| 35 to 44 Years | 0 | 0.0% |
| 45 to 54 Years | 10 | 23.8% |
| 55 to 64 Years | 8 | 19.1% |
| 65 to 74 Years | 8 | 19.1% |
| 75 to 84 Years | 0 | 0.0% |
| 85 Years and Over | 16 | 38.1% |
| Total | 42 | 100.0% |
Housing Finances in Chunchula
Median Income by Occupancy in Chunchula
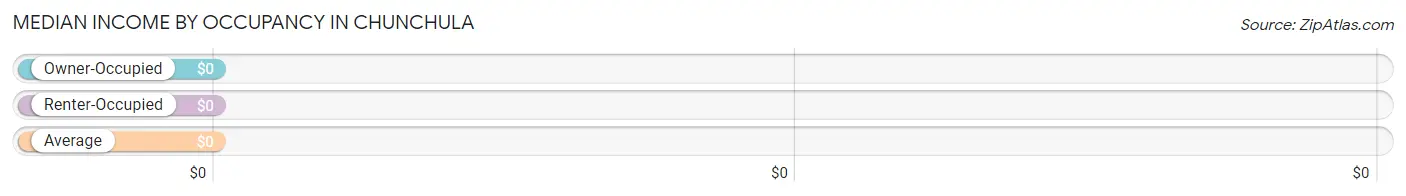
| Occupancy Type | # Households | Median Income |
| Owner-Occupied | 42 (100.0%) | $0 |
| Renter-Occupied | 0 (0.0%) | $0 |
| Average | 42 (100.0%) | $0 |
Occupancy by Householder Income Bracket in Chunchula
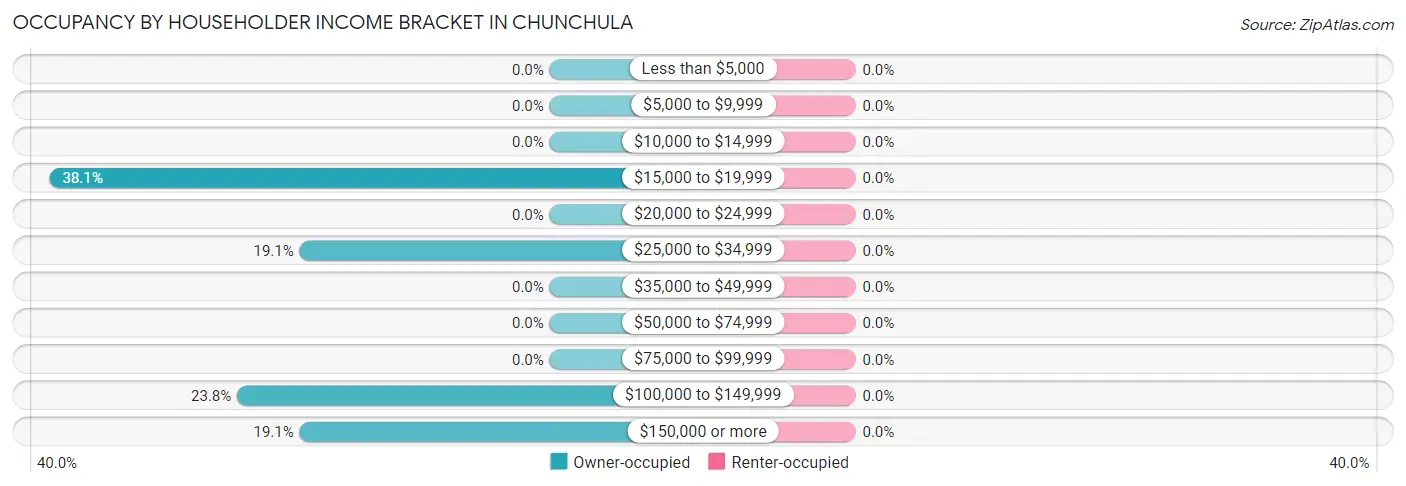
| Income Bracket | Owner-occupied | Renter-occupied |
| Less than $5,000 | 0 (0.0%) | 0 (0.0%) |
| $5,000 to $9,999 | 0 (0.0%) | 0 (0.0%) |
| $10,000 to $14,999 | 0 (0.0%) | 0 (0.0%) |
| $15,000 to $19,999 | 16 (38.1%) | 0 (0.0%) |
| $20,000 to $24,999 | 0 (0.0%) | 0 (0.0%) |
| $25,000 to $34,999 | 8 (19.1%) | 0 (0.0%) |
| $35,000 to $49,999 | 0 (0.0%) | 0 (0.0%) |
| $50,000 to $74,999 | 0 (0.0%) | 0 (0.0%) |
| $75,000 to $99,999 | 0 (0.0%) | 0 (0.0%) |
| $100,000 to $149,999 | 10 (23.8%) | 0 (0.0%) |
| $150,000 or more | 8 (19.1%) | 0 (0.0%) |
| Total | 42 (100.0%) | 0 (0.0%) |
Monthly Housing Cost Tiers in Chunchula
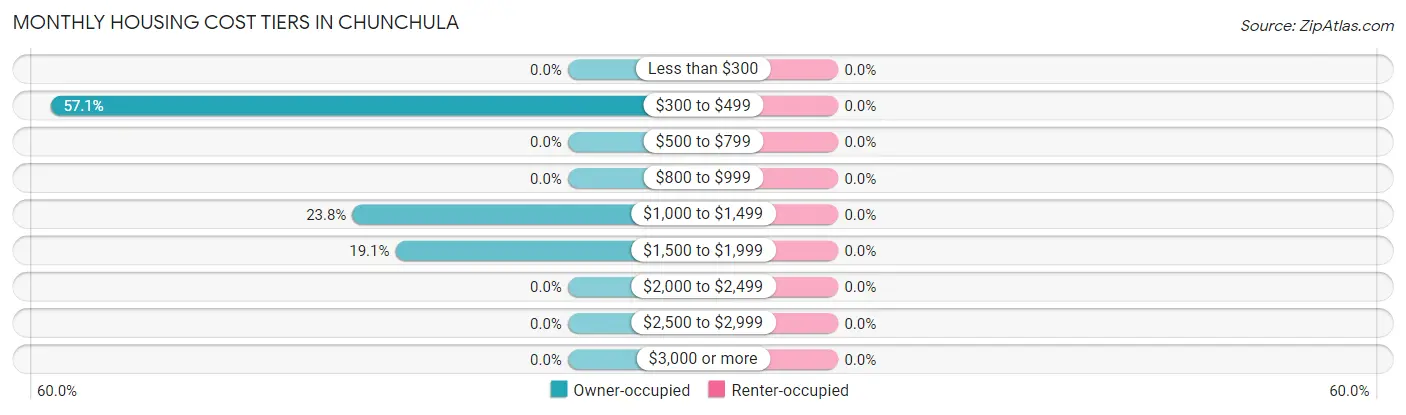
| Monthly Cost | Owner-occupied | Renter-occupied |
| Less than $300 | 0 (0.0%) | 0 (0.0%) |
| $300 to $499 | 24 (57.1%) | 0 (0.0%) |
| $500 to $799 | 0 (0.0%) | 0 (0.0%) |
| $800 to $999 | 0 (0.0%) | 0 (0.0%) |
| $1,000 to $1,499 | 10 (23.8%) | 0 (0.0%) |
| $1,500 to $1,999 | 8 (19.1%) | 0 (0.0%) |
| $2,000 to $2,499 | 0 (0.0%) | 0 (0.0%) |
| $2,500 to $2,999 | 0 (0.0%) | 0 (0.0%) |
| $3,000 or more | 0 (0.0%) | 0 (0.0%) |
| Total | 42 (100.0%) | 0 (0.0%) |
Physical Housing Characteristics in Chunchula
Housing Structures in Chunchula
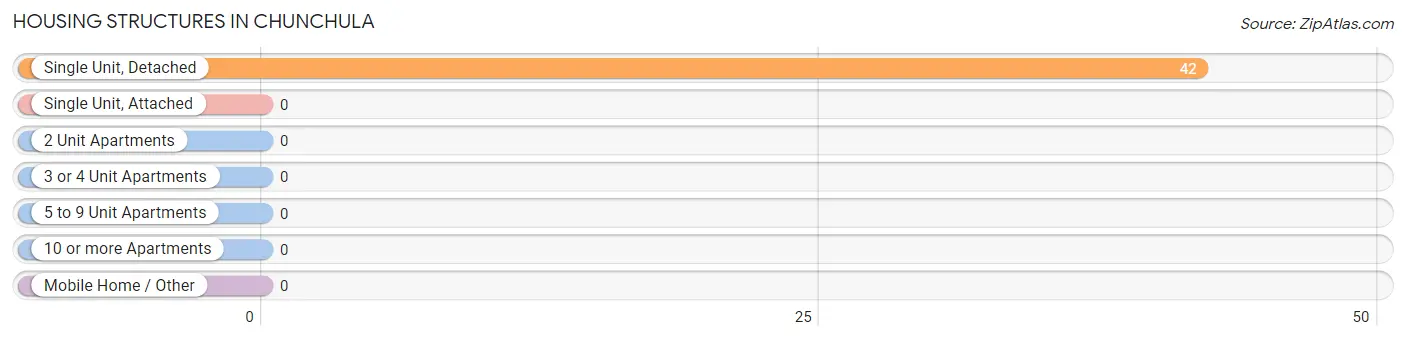
| Structure Type | # Housing Units | % Housing Units |
| Single Unit, Detached | 42 | 100.0% |
| Single Unit, Attached | 0 | 0.0% |
| 2 Unit Apartments | 0 | 0.0% |
| 3 or 4 Unit Apartments | 0 | 0.0% |
| 5 to 9 Unit Apartments | 0 | 0.0% |
| 10 or more Apartments | 0 | 0.0% |
| Mobile Home / Other | 0 | 0.0% |
| Total | 42 | 100.0% |
Housing Structures by Occupancy in Chunchula
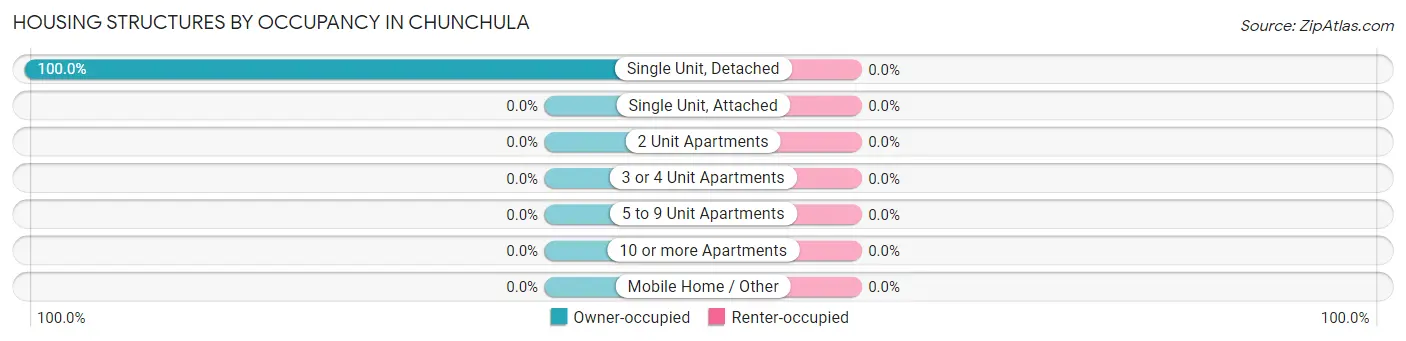
| Structure Type | Owner-occupied | Renter-occupied |
| Single Unit, Detached | 42 (100.0%) | 0 (0.0%) |
| Single Unit, Attached | 0 (0.0%) | 0 (0.0%) |
| 2 Unit Apartments | 0 (0.0%) | 0 (0.0%) |
| 3 or 4 Unit Apartments | 0 (0.0%) | 0 (0.0%) |
| 5 to 9 Unit Apartments | 0 (0.0%) | 0 (0.0%) |
| 10 or more Apartments | 0 (0.0%) | 0 (0.0%) |
| Mobile Home / Other | 0 (0.0%) | 0 (0.0%) |
| Total | 42 (100.0%) | 0 (0.0%) |
Housing Structures by Number of Rooms in Chunchula
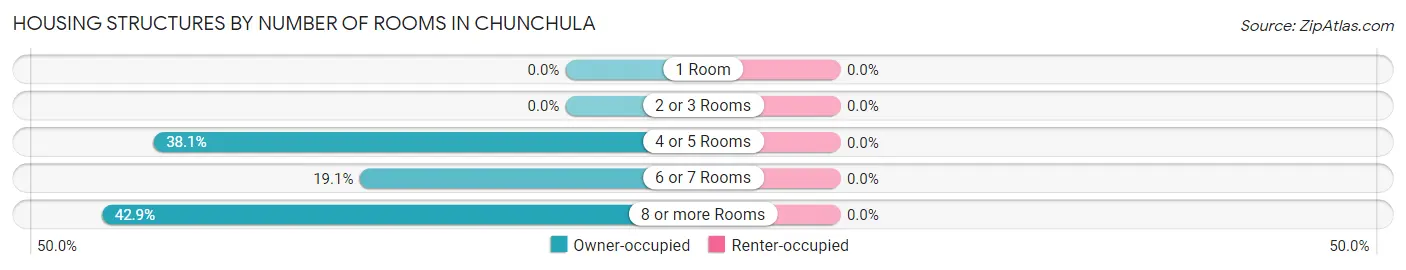
| Number of Rooms | Owner-occupied | Renter-occupied |
| 1 Room | 0 (0.0%) | 0 (0.0%) |
| 2 or 3 Rooms | 0 (0.0%) | 0 (0.0%) |
| 4 or 5 Rooms | 16 (38.1%) | 0 (0.0%) |
| 6 or 7 Rooms | 8 (19.1%) | 0 (0.0%) |
| 8 or more Rooms | 18 (42.9%) | 0 (0.0%) |
| Total | 42 (100.0%) | 0 (0.0%) |
Housing Structure by Heating Type in Chunchula
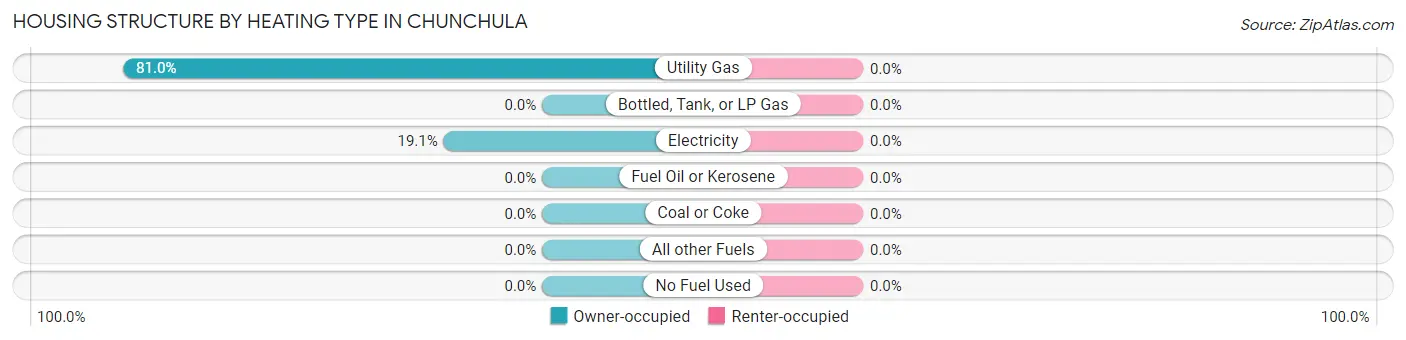
| Heating Type | Owner-occupied | Renter-occupied |
| Utility Gas | 34 (80.9%) | 0 (0.0%) |
| Bottled, Tank, or LP Gas | 0 (0.0%) | 0 (0.0%) |
| Electricity | 8 (19.1%) | 0 (0.0%) |
| Fuel Oil or Kerosene | 0 (0.0%) | 0 (0.0%) |
| Coal or Coke | 0 (0.0%) | 0 (0.0%) |
| All other Fuels | 0 (0.0%) | 0 (0.0%) |
| No Fuel Used | 0 (0.0%) | 0 (0.0%) |
| Total | 42 (100.0%) | 0 (0.0%) |
Household Vehicle Usage in Chunchula
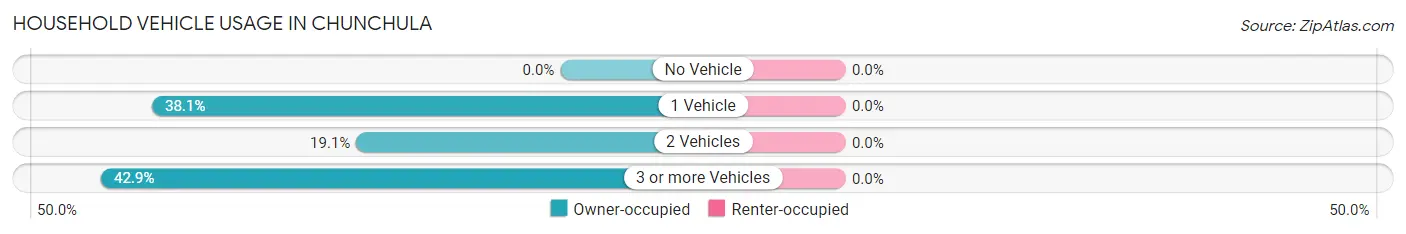
| Vehicles per Household | Owner-occupied | Renter-occupied |
| No Vehicle | 0 (0.0%) | 0 (0.0%) |
| 1 Vehicle | 16 (38.1%) | 0 (0.0%) |
| 2 Vehicles | 8 (19.1%) | 0 (0.0%) |
| 3 or more Vehicles | 18 (42.9%) | 0 (0.0%) |
| Total | 42 (100.0%) | 0 (0.0%) |
Real Estate & Mortgages in Chunchula
Real Estate and Mortgage Overview in Chunchula
| Characteristic | Without Mortgage | With Mortgage |
| Housing Units | 24 | 18 |
| Median Property Value | - | - |
| Median Household Income | - | - |
| Monthly Housing Costs | - | - |
| Real Estate Taxes | - | - |
Property Value by Mortgage Status in Chunchula
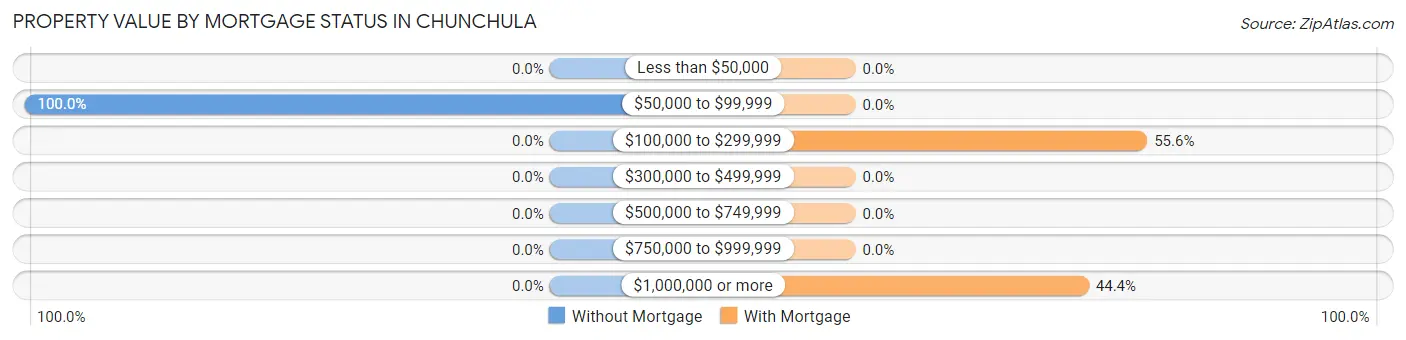
| Property Value | Without Mortgage | With Mortgage |
| Less than $50,000 | 0 (0.0%) | 0 (0.0%) |
| $50,000 to $99,999 | 24 (100.0%) | 0 (0.0%) |
| $100,000 to $299,999 | 0 (0.0%) | 10 (55.6%) |
| $300,000 to $499,999 | 0 (0.0%) | 0 (0.0%) |
| $500,000 to $749,999 | 0 (0.0%) | 0 (0.0%) |
| $750,000 to $999,999 | 0 (0.0%) | 0 (0.0%) |
| $1,000,000 or more | 0 (0.0%) | 8 (44.4%) |
| Total | 24 (100.0%) | 18 (100.0%) |
Household Income by Mortgage Status in Chunchula
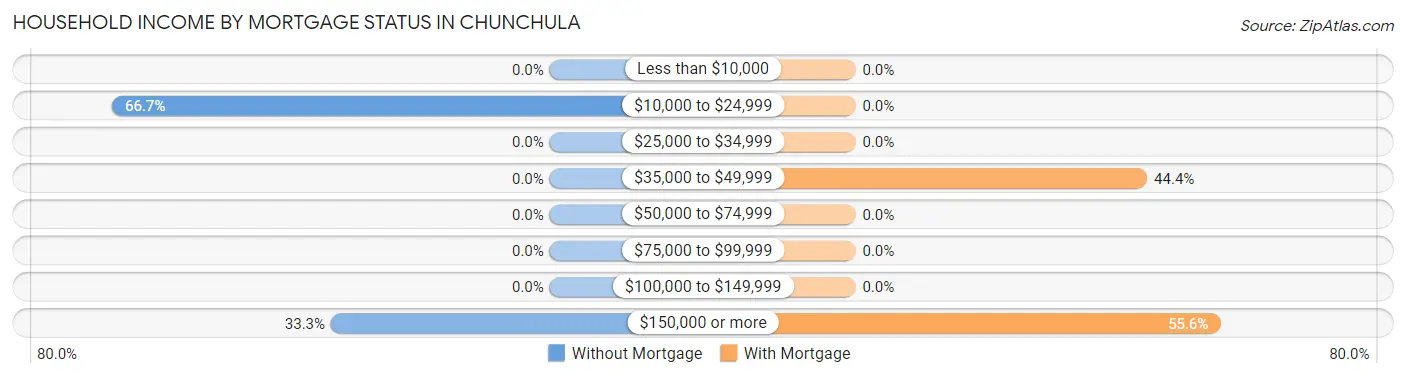
| Household Income | Without Mortgage | With Mortgage |
| Less than $10,000 | 0 (0.0%) | 0 (0.0%) |
| $10,000 to $24,999 | 16 (66.7%) | 0 (0.0%) |
| $25,000 to $34,999 | 0 (0.0%) | 0 (0.0%) |
| $35,000 to $49,999 | 0 (0.0%) | 8 (44.4%) |
| $50,000 to $74,999 | 0 (0.0%) | 0 (0.0%) |
| $75,000 to $99,999 | 0 (0.0%) | 0 (0.0%) |
| $100,000 to $149,999 | 0 (0.0%) | 0 (0.0%) |
| $150,000 or more | 8 (33.3%) | 10 (55.6%) |
| Total | 24 (100.0%) | 18 (100.0%) |
Property Value to Household Income Ratio in Chunchula
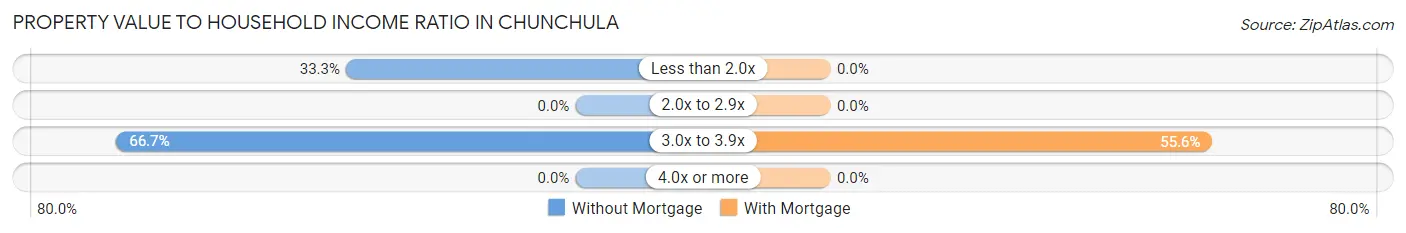
| Value-to-Income Ratio | Without Mortgage | With Mortgage |
| Less than 2.0x | 8 (33.3%) | 0 (0.0%) |
| 2.0x to 2.9x | 0 (0.0%) | 0 (0.0%) |
| 3.0x to 3.9x | 16 (66.7%) | 10 (55.6%) |
| 4.0x or more | 0 (0.0%) | 0 (0.0%) |
| Total | 24 (100.0%) | 18 (100.0%) |
Real Estate Taxes by Mortgage Status in Chunchula
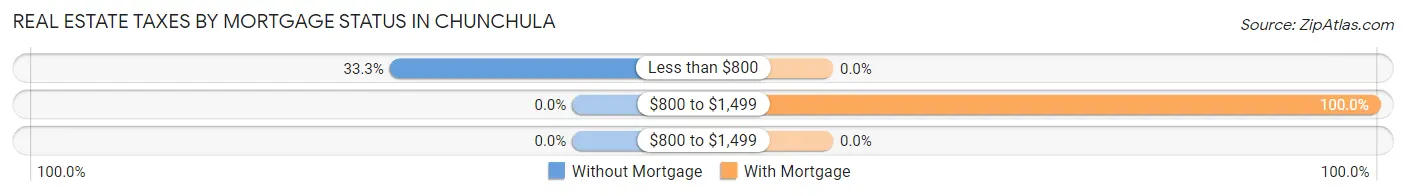
| Property Taxes | Without Mortgage | With Mortgage |
| Less than $800 | 8 (33.3%) | 0 (0.0%) |
| $800 to $1,499 | 0 (0.0%) | 18 (100.0%) |
| $800 to $1,499 | 0 (0.0%) | 0 (0.0%) |
| Total | 24 (100.0%) | 18 (100.0%) |
Health & Disability in Chunchula
Health Insurance Coverage by Age in Chunchula
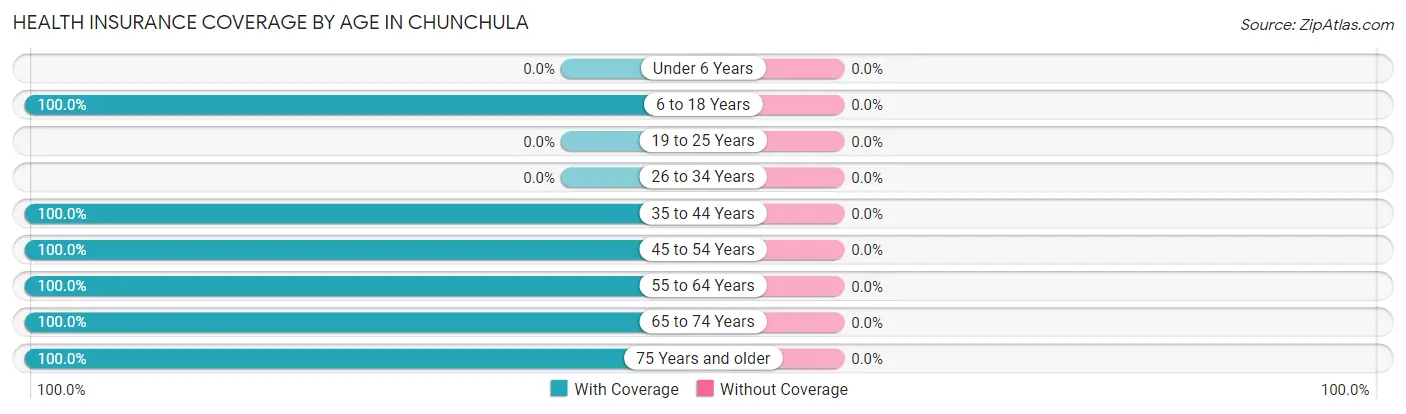
| Age Bracket | With Coverage | Without Coverage |
| Under 6 Years | 0 (0.0%) | 0 (0.0%) |
| 6 to 18 Years | 44 (100.0%) | 0 (0.0%) |
| 19 to 25 Years | 0 (0.0%) | 0 (0.0%) |
| 26 to 34 Years | 0 (0.0%) | 0 (0.0%) |
| 35 to 44 Years | 25 (100.0%) | 0 (0.0%) |
| 45 to 54 Years | 34 (100.0%) | 0 (0.0%) |
| 55 to 64 Years | 25 (100.0%) | 0 (0.0%) |
| 65 to 74 Years | 8 (100.0%) | 0 (0.0%) |
| 75 Years and older | 16 (100.0%) | 0 (0.0%) |
| Total | 152 (100.0%) | 0 (0.0%) |
Health Insurance Coverage by Citizenship Status in Chunchula
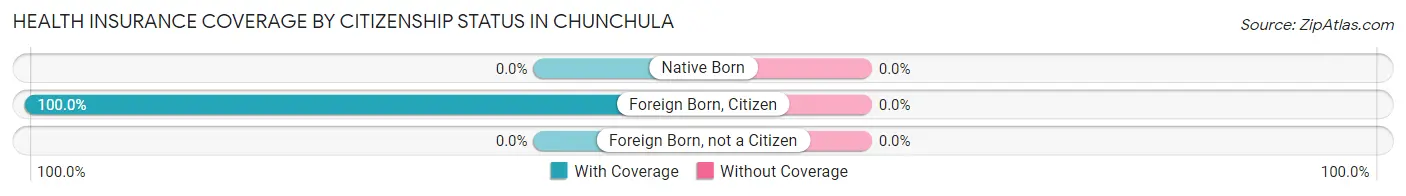
| Citizenship Status | With Coverage | Without Coverage |
| Native Born | 0 (0.0%) | 0 (0.0%) |
| Foreign Born, Citizen | 44 (100.0%) | 0 (0.0%) |
| Foreign Born, not a Citizen | 0 (0.0%) | 0 (0.0%) |
Health Insurance Coverage by Household Income in Chunchula
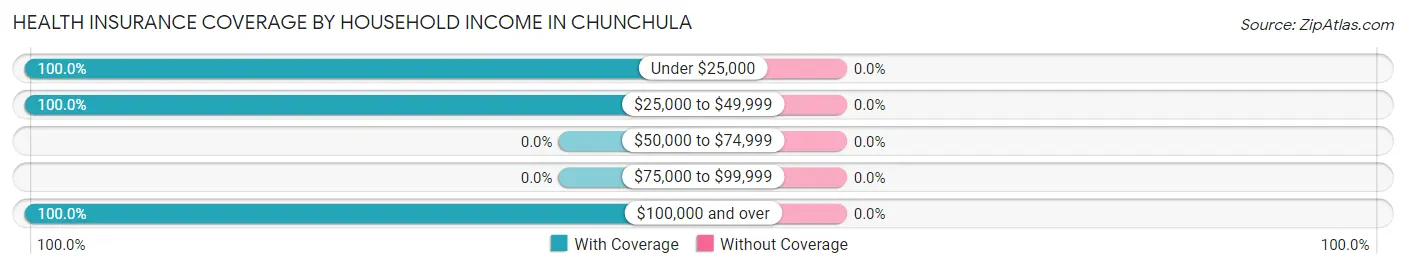
| Household Income | With Coverage | Without Coverage |
| Under $25,000 | 16 (100.0%) | 0 (0.0%) |
| $25,000 to $49,999 | 89 (100.0%) | 0 (0.0%) |
| $50,000 to $74,999 | 0 (0.0%) | 0 (0.0%) |
| $75,000 to $99,999 | 0 (0.0%) | 0 (0.0%) |
| $100,000 and over | 47 (100.0%) | 0 (0.0%) |
Public vs Private Health Insurance Coverage by Age in Chunchula
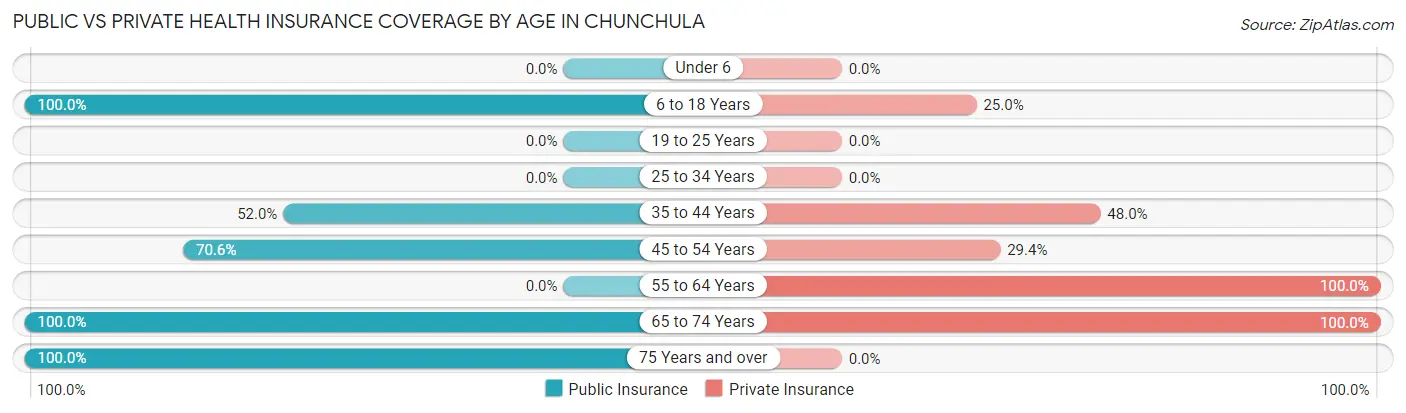
| Age Bracket | Public Insurance | Private Insurance |
| Under 6 | 0 (0.0%) | 0 (0.0%) |
| 6 to 18 Years | 44 (100.0%) | 11 (25.0%) |
| 19 to 25 Years | 0 (0.0%) | 0 (0.0%) |
| 25 to 34 Years | 0 (0.0%) | 0 (0.0%) |
| 35 to 44 Years | 13 (52.0%) | 12 (48.0%) |
| 45 to 54 Years | 24 (70.6%) | 10 (29.4%) |
| 55 to 64 Years | 0 (0.0%) | 25 (100.0%) |
| 65 to 74 Years | 8 (100.0%) | 8 (100.0%) |
| 75 Years and over | 16 (100.0%) | 0 (0.0%) |
| Total | 105 (69.1%) | 66 (43.4%) |
Disability Status by Sex by Age in Chunchula
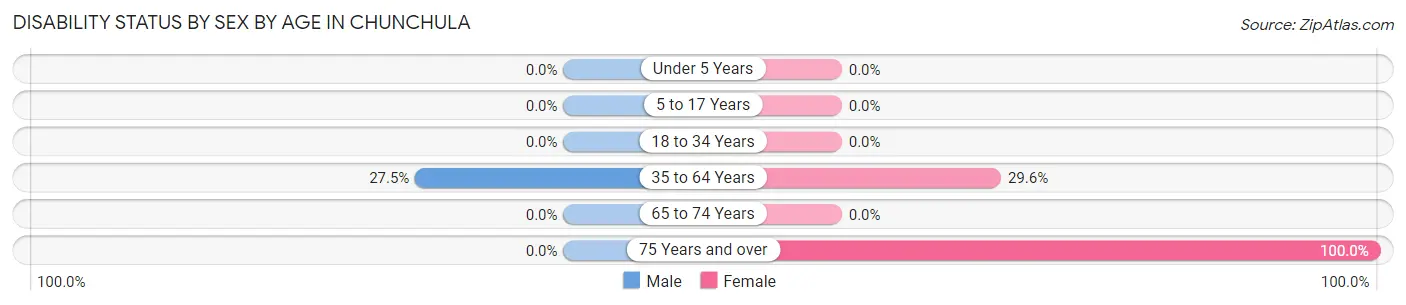
| Age Bracket | Male | Female |
| Under 5 Years | 0 (0.0%) | 0 (0.0%) |
| 5 to 17 Years | 0 (0.0%) | 0 (0.0%) |
| 18 to 34 Years | 0 (0.0%) | 0 (0.0%) |
| 35 to 64 Years | 11 (27.5%) | 13 (29.5%) |
| 65 to 74 Years | 0 (0.0%) | 0 (0.0%) |
| 75 Years and over | 0 (0.0%) | 16 (100.0%) |
Disability Class by Sex by Age in Chunchula
Disability Class: Hearing Difficulty
| Age Bracket | Male | Female |
| Under 5 Years | 0 (0.0%) | 0 (0.0%) |
| 5 to 17 Years | 0 (0.0%) | 0 (0.0%) |
| 18 to 34 Years | 0 (0.0%) | 0 (0.0%) |
| 35 to 64 Years | 0 (0.0%) | 0 (0.0%) |
| 65 to 74 Years | 0 (0.0%) | 0 (0.0%) |
| 75 Years and over | 0 (0.0%) | 0 (0.0%) |
Disability Class: Vision Difficulty
| Age Bracket | Male | Female |
| Under 5 Years | 0 (0.0%) | 0 (0.0%) |
| 5 to 17 Years | 0 (0.0%) | 0 (0.0%) |
| 18 to 34 Years | 0 (0.0%) | 0 (0.0%) |
| 35 to 64 Years | 0 (0.0%) | 0 (0.0%) |
| 65 to 74 Years | 0 (0.0%) | 0 (0.0%) |
| 75 Years and over | 0 (0.0%) | 0 (0.0%) |
Disability Class: Cognitive Difficulty
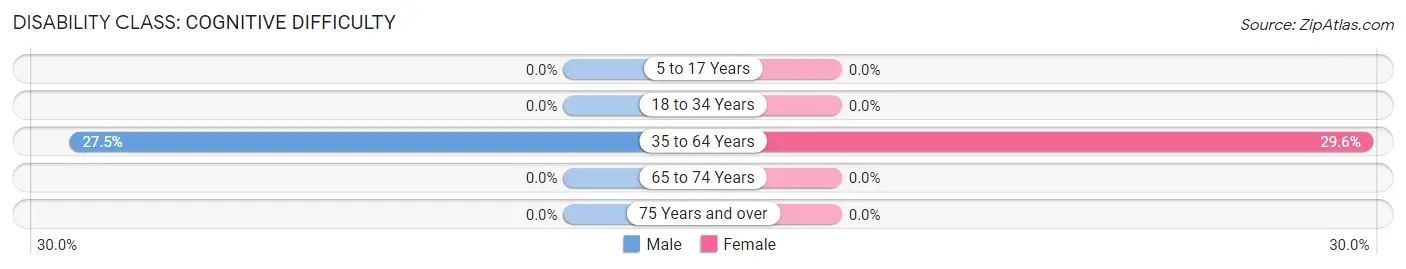
| Age Bracket | Male | Female |
| 5 to 17 Years | 0 (0.0%) | 0 (0.0%) |
| 18 to 34 Years | 0 (0.0%) | 0 (0.0%) |
| 35 to 64 Years | 11 (27.5%) | 13 (29.5%) |
| 65 to 74 Years | 0 (0.0%) | 0 (0.0%) |
| 75 Years and over | 0 (0.0%) | 0 (0.0%) |
Disability Class: Ambulatory Difficulty
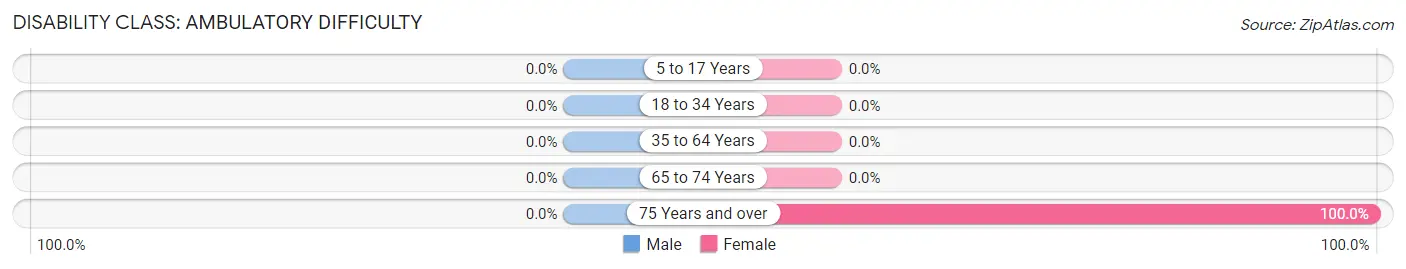
| Age Bracket | Male | Female |
| 5 to 17 Years | 0 (0.0%) | 0 (0.0%) |
| 18 to 34 Years | 0 (0.0%) | 0 (0.0%) |
| 35 to 64 Years | 0 (0.0%) | 0 (0.0%) |
| 65 to 74 Years | 0 (0.0%) | 0 (0.0%) |
| 75 Years and over | 0 (0.0%) | 16 (100.0%) |
Disability Class: Self-Care Difficulty
| Age Bracket | Male | Female |
| 5 to 17 Years | 0 (0.0%) | 0 (0.0%) |
| 18 to 34 Years | 0 (0.0%) | 0 (0.0%) |
| 35 to 64 Years | 0 (0.0%) | 0 (0.0%) |
| 65 to 74 Years | 0 (0.0%) | 0 (0.0%) |
| 75 Years and over | 0 (0.0%) | 0 (0.0%) |
Technology Access in Chunchula
Computing Device Access in Chunchula
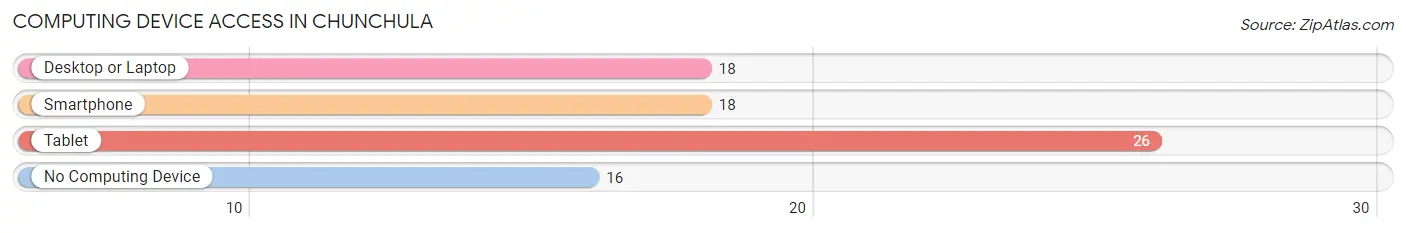
| Device Type | # Households | % Households |
| Desktop or Laptop | 18 | 42.9% |
| Smartphone | 18 | 42.9% |
| Tablet | 26 | 61.9% |
| No Computing Device | 16 | 38.1% |
| Total | 42 | 100.0% |
Internet Access in Chunchula
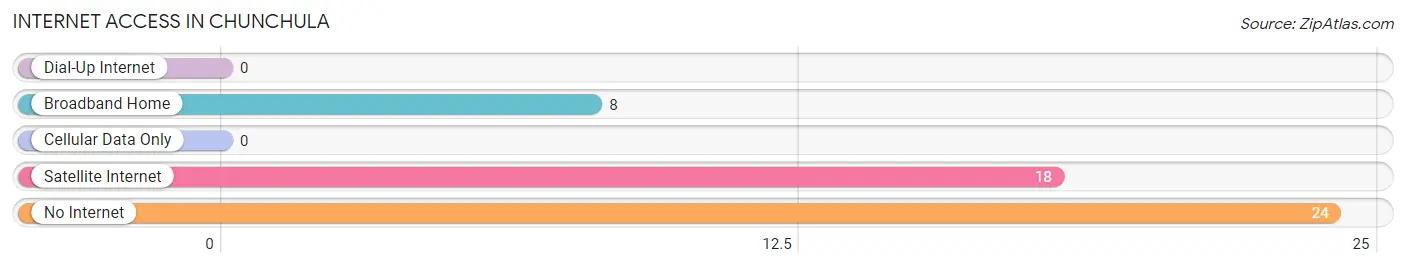
| Internet Type | # Households | % Households |
| Dial-Up Internet | 0 | 0.0% |
| Broadband Home | 8 | 19.1% |
| Cellular Data Only | 0 | 0.0% |
| Satellite Internet | 18 | 42.9% |
| No Internet | 24 | 57.1% |
| Total | 42 | 100.0% |
Chunchula Summary
Chunchula is a small unincorporated community located in Mobile County, Alabama. It is situated along the banks of the Chickasaw Creek, approximately 15 miles north of Mobile. The population of Chunchula was estimated to be 1,845 in 2019.
History
Chunchula was first settled in the early 1800s by a group of Chickasaw Indians. The name Chunchula is derived from the Chickasaw word for “big creek”. The town was officially incorporated in 1819 and was the first town in Mobile County to be incorporated.
In the early 1900s, Chunchula was a thriving agricultural community. The town was home to several cotton gins, sawmills, and gristmills. The town also had a post office, a general store, and a hotel.
In the late 1940s, Chunchula began to experience a decline in population as many of its residents moved away in search of better economic opportunities. The town’s population continued to decline until the late 1990s when it began to experience a resurgence.
Geography
Chunchula is located in Mobile County, Alabama. It is situated along the banks of the Chickasaw Creek, approximately 15 miles north of Mobile. The town is located in the Mobile-Tensaw Delta, a large wetland area that is home to a variety of wildlife.
The town is located in a humid subtropical climate zone, with hot, humid summers and mild winters. The average annual temperature is around 70 degrees Fahrenheit. The average annual precipitation is around 55 inches.
Economy
Chunchula’s economy is largely based on agriculture. The town is home to several farms that produce a variety of crops, including cotton, corn, soybeans, and peanuts. The town is also home to several timber companies that harvest timber from the surrounding forests.
The town is also home to several small businesses, including restaurants, convenience stores, and auto repair shops. The town is also home to a few manufacturing companies that produce a variety of products, including furniture and clothing.
Demographics
As of 2019, the population of Chunchula was estimated to be 1,845. The town is predominantly white, with a small African American population. The median household income is around $37,000, and the median home value is around $90,000.
The town is served by the Mobile County Public School System. The town is home to one elementary school, one middle school, and one high school. The town is also home to a few private schools.
Conclusion
Chunchula is a small unincorporated community located in Mobile County, Alabama. It is situated along the banks of the Chickasaw Creek, approximately 15 miles north of Mobile. The population of Chunchula was estimated to be 1,845 in 2019. The town’s economy is largely based on agriculture, and it is home to several small businesses. The town is predominantly white, with a small African American population. The town is served by the Mobile County Public School System.
Common Questions
What is Per Capita Income in Chunchula?
Per Capita income in Chunchula is $22,139.
What is the Median Family Income in Chunchula?
Median Family Income in Chunchula is $138,750.
What is Inequality or Gini Index in Chunchula?
Inequality or Gini Index in Chunchula is 0.45.
What is the Total Population of Chunchula?
Total Population of Chunchula is 152.
What is the Total Male Population of Chunchula?
Total Male Population of Chunchula is 40.
What is the Total Female Population of Chunchula?
Total Female Population of Chunchula is 112.
What is the Ratio of Males per 100 Females in Chunchula?
There are 35.71 Males per 100 Females in Chunchula.
What is the Ratio of Females per 100 Males in Chunchula?
There are 280.00 Females per 100 Males in Chunchula.
What is the Median Population Age in Chunchula?
Median Population Age in Chunchula is 49.3 Years.
What is the Average Family Size in Chunchula
Average Family Size in Chunchula is 5.2 People.
What is the Average Household Size in Chunchula
Average Household Size in Chunchula is 3.6 People.
How Large is the Labor Force in Chunchula?
There are 39 People in the Labor Forcein in Chunchula.
What is the Percentage of People in the Labor Force in Chunchula?
32.8% of People are in the Labor Force in Chunchula.