Earnings by Sex by Educational Attainment in Reader
Educational Attainment
Male Income
Female Income
Less than High School
-
-
High School Diploma
-
-
College or Associate's Degree
-
-
Bachelor's Degree
-
-
Graduate Degree
-
-
Total
-
-
Family Income in Reader
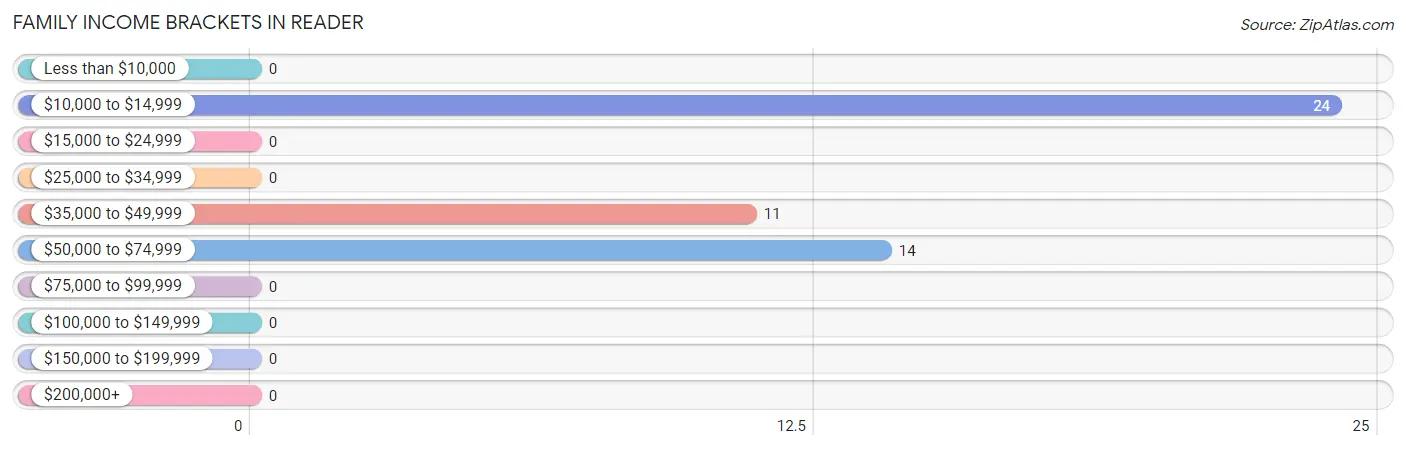
Family Income Brackets in Reader
According to the Reader family income data, there are 24 families falling into the $10,000 to $14,999 income range, which is the most common income bracket and makes up 49.0% of all families.
Income Bracket
# Families
% Families
Less than $10,000
0
0.0%
$10,000 to $14,999
24
49.0%
$15,000 to $24,999
0
0.0%
$25,000 to $34,999
0
0.0%
$35,000 to $49,999
11
22.4%
$50,000 to $74,999
14
28.6%
$75,000 to $99,999
0
0.0%
$100,000 to $149,999
0
0.0%
$150,000 to $199,999
0
0.0%
$200,000+
0
0.0%
Family Income by Famaliy Size in Reader
Income Bracket
# Families
Median Income
2-Person Families
49 (100.0%)
$0
3-Person Families
0 (0.0%)
$0
4-Person Families
0 (0.0%)
$0
5-Person Families
0 (0.0%)
$0
6-Person Families
0 (0.0%)
$0
7+ Person Families
0 (0.0%)
$0
Total
49 (100.0%)
$0
Family Income by Number of Earners in Reader
Number of Earners
# Families
Median Income
No Earners
49 (100.0%)
$0
1 Earner
0 (0.0%)
$0
2 Earners
0 (0.0%)
$0
3+ Earners
0 (0.0%)
$0
Total
49 (100.0%)
$0
Household Income in Reader
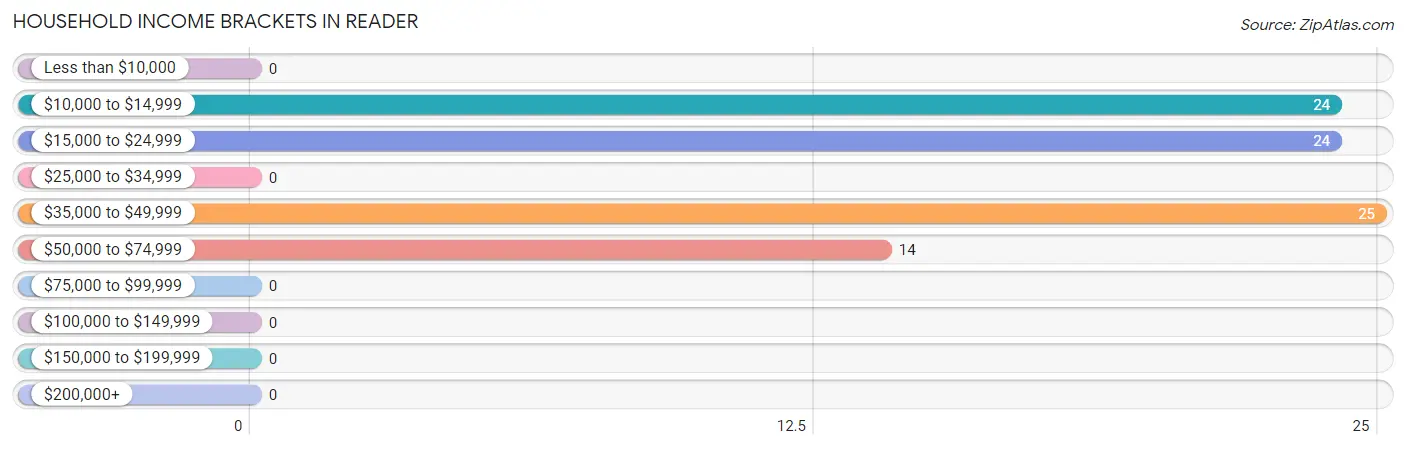
Household Income Brackets in Reader
With 25 households falling in the category, the $35,000 to $49,999 income range is the most frequent in Reader, accounting for 28.7% of all households.
Income Bracket
# Households
% Households
Less than $10,000
0
0.0%
$10,000 to $14,999
24
27.6%
$15,000 to $24,999
24
27.6%
$25,000 to $34,999
0
0.0%
$35,000 to $49,999
25
28.7%
$50,000 to $74,999
14
16.1%
$75,000 to $99,999
0
0.0%
$100,000 to $149,999
0
0.0%
$150,000 to $199,999
0
0.0%
$200,000+
0
0.0%
Household Income by Householder Age in Reader
Income Bracket
# Households
Median Income
15 to 24 Years
0 (0.0%)
$0
25 to 44 Years
0 (0.0%)
$0
45 to 64 Years
0 (0.0%)
$0
65+ Years
87 (100.0%)
$0
Total
87 (100.0%)
$0
Poverty in Reader
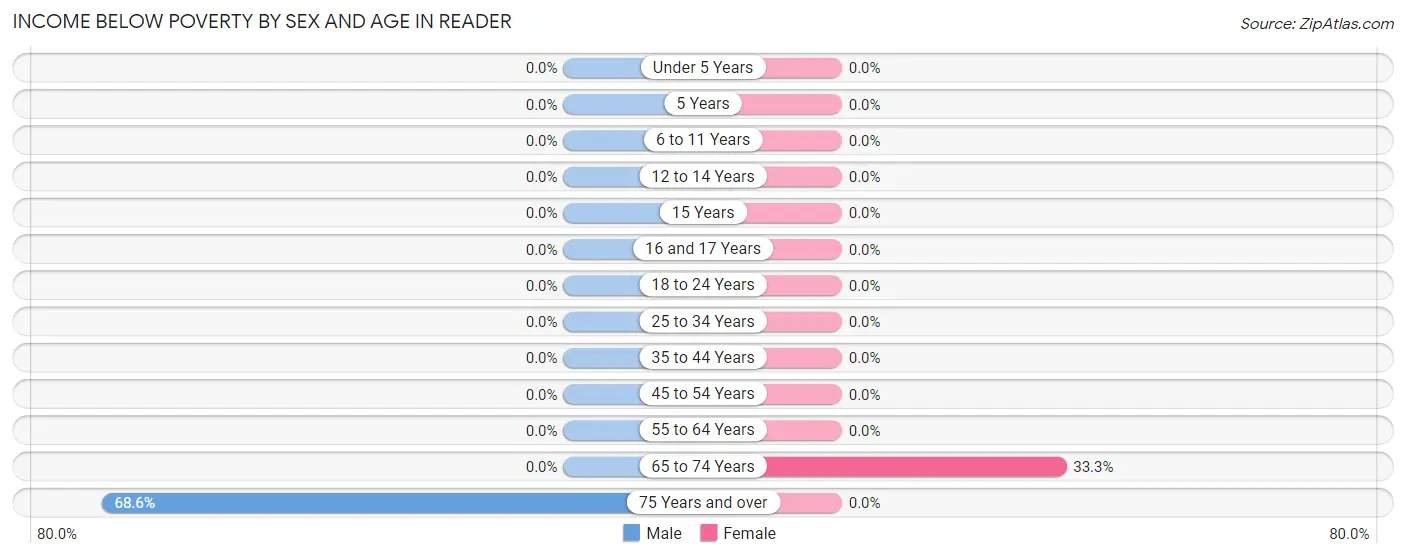
Income Below Poverty by Sex and Age in Reader
With 48.0% poverty level for males and 21.0% for females among the residents of Reader, 75 year old and over males and 65 to 74 year old females are the most vulnerable to poverty, with 24 males (68.6%) and 16 females (33.3%) in their respective age groups living below the poverty level.
Age Bracket
Male
Female
Under 5 Years
0 (0.0%)
0 (0.0%)
5 Years
0 (0.0%)
0 (0.0%)
6 to 11 Years
0 (0.0%)
0 (0.0%)
12 to 14 Years
0 (0.0%)
0 (0.0%)
15 Years
0 (0.0%)
0 (0.0%)
16 and 17 Years
0 (0.0%)
0 (0.0%)
18 to 24 Years
0 (0.0%)
0 (0.0%)
25 to 34 Years
0 (0.0%)
0 (0.0%)
35 to 44 Years
0 (0.0%)
0 (0.0%)
45 to 54 Years
0 (0.0%)
0 (0.0%)
55 to 64 Years
0 (0.0%)
0 (0.0%)
65 to 74 Years
0 (0.0%)
16 (33.3%)
75 Years and over
24 (68.6%)
0 (0.0%)
Total
24 (48.0%)
16 (21.0%)
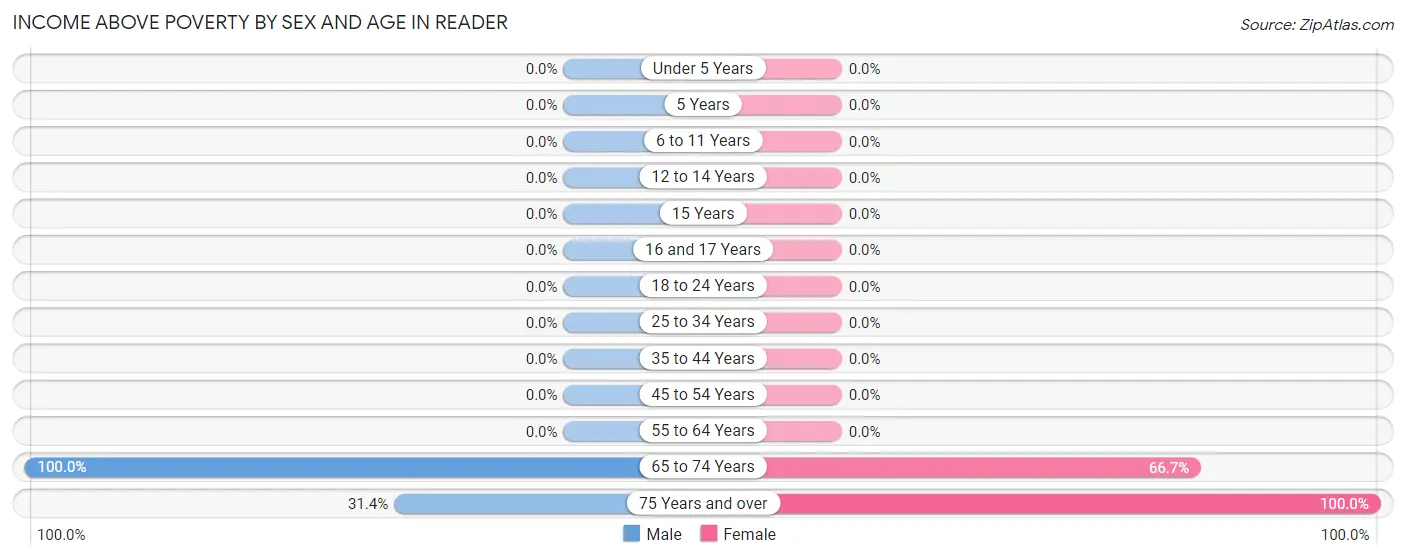
Income Above Poverty by Sex and Age in Reader
According to the poverty statistics in Reader, males aged 65 to 74 years and females aged 75 years and over are the age groups that are most secure financially, with 100.0% of males and 100.0% of females in these age groups living above the poverty line.
Age Bracket
Male
Female
Under 5 Years
0 (0.0%)
0 (0.0%)
5 Years
0 (0.0%)
0 (0.0%)
6 to 11 Years
0 (0.0%)
0 (0.0%)
12 to 14 Years
0 (0.0%)
0 (0.0%)
15 Years
0 (0.0%)
0 (0.0%)
16 and 17 Years
0 (0.0%)
0 (0.0%)
18 to 24 Years
0 (0.0%)
0 (0.0%)
25 to 34 Years
0 (0.0%)
0 (0.0%)
35 to 44 Years
0 (0.0%)
0 (0.0%)
45 to 54 Years
0 (0.0%)
0 (0.0%)
55 to 64 Years
0 (0.0%)
0 (0.0%)
65 to 74 Years
15 (100.0%)
32 (66.7%)
75 Years and over
11 (31.4%)
28 (100.0%)
Total
26 (52.0%)
60 (78.9%)
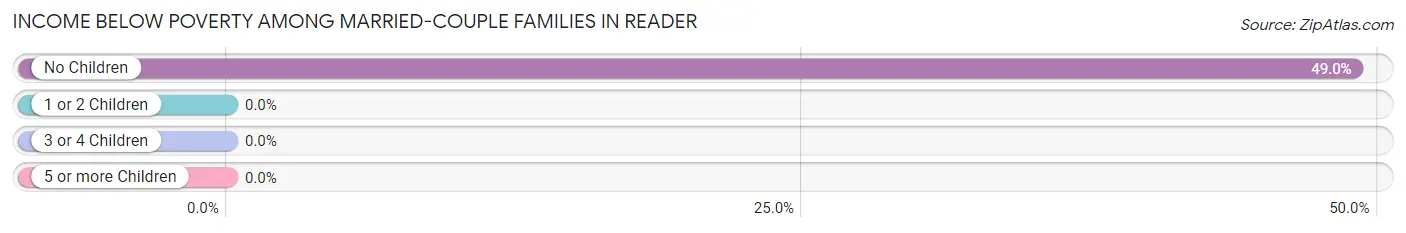
Income Below Poverty Among Married-Couple Families in Reader
The poverty statistics for married-couple families in Reader show that 49.0% or 24 of the total 49 families live below the poverty line. Families with no children have the highest poverty rate of 49.0%, comprising of 24 families. On the other hand, families with no children have the lowest poverty rate of 49.0%, which includes 24 families.
Children
Above Poverty
Below Poverty
No Children
25 (51.0%)
24 (49.0%)
1 or 2 Children
0 (0.0%)
0 (0.0%)
3 or 4 Children
0 (0.0%)
0 (0.0%)
5 or more Children
0 (0.0%)
0 (0.0%)
Total
25 (51.0%)
24 (49.0%)
Income Below Poverty Among Single-Parent Households in Reader
Children
Single Father
Single Mother
No Children
0 (0.0%)
0 (0.0%)
1 or 2 Children
0 (0.0%)
0 (0.0%)
3 or 4 Children
0 (0.0%)
0 (0.0%)
5 or more Children
0 (0.0%)
0 (0.0%)
Total
0 (0.0%)
0 (0.0%)
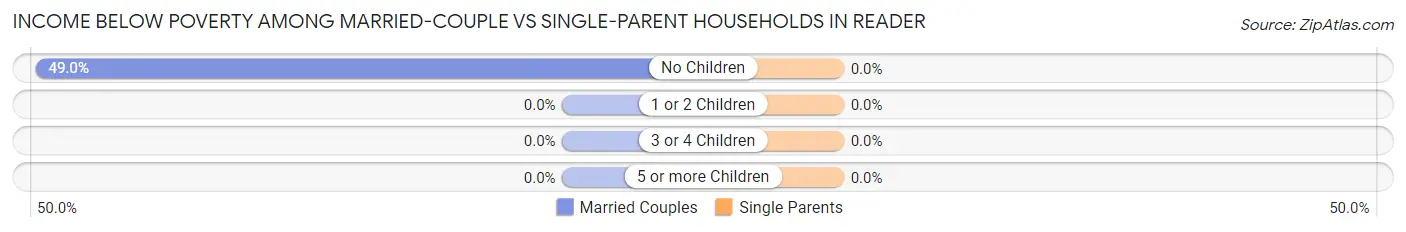
Income Below Poverty Among Married-Couple vs Single-Parent Households in Reader
Children
Married-Couple Families
Single-Parent Households
No Children
24 (49.0%)
0 (0.0%)
1 or 2 Children
0 (0.0%)
0 (0.0%)
3 or 4 Children
0 (0.0%)
0 (0.0%)
5 or more Children
0 (0.0%)
0 (0.0%)
Total
24 (49.0%)
0 (0.0%)
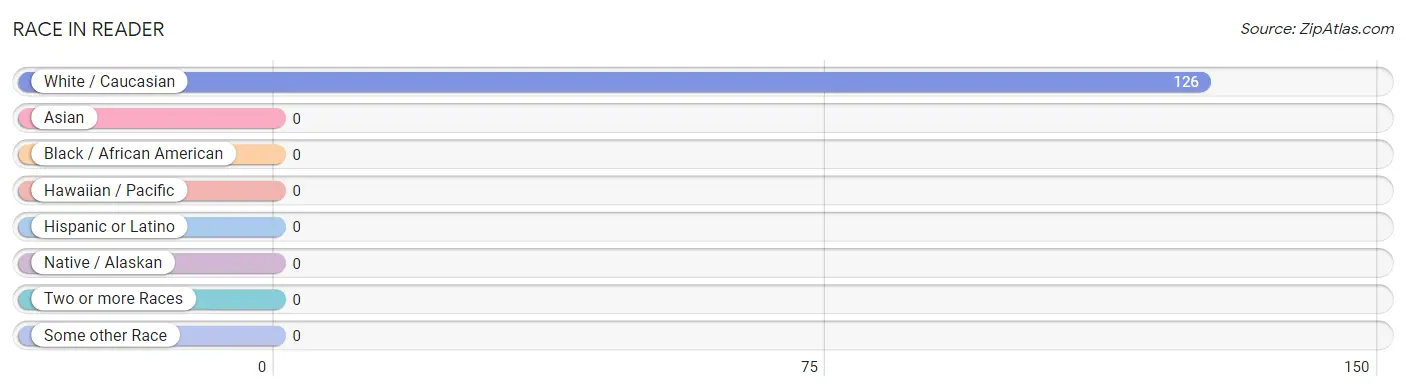
Race in Reader
The most populous races in Reader are , and White / Caucasian (126 | 100.0%).
Race
# Population
% Population
Asian
0
0.0%
Black / African American
0
0.0%
Hawaiian / Pacific
0
0.0%
Hispanic or Latino
0
0.0%
Native / Alaskan
0
0.0%
White / Caucasian
126
100.0%
Two or more Races
0
0.0%
Some other Race
0
0.0%
Total
126
100.0%
Ancestry in Reader
The most populous ancestries reported in Reader are , and American (19 | 15.1%), together accounting for 15.1% of all Reader residents.
Ancestry
# Population
% Population
American
19
15.1%
View All 1 Rows
Immigrants in Reader
Immigration Origin
# Population
% Population
View All 0 Rows
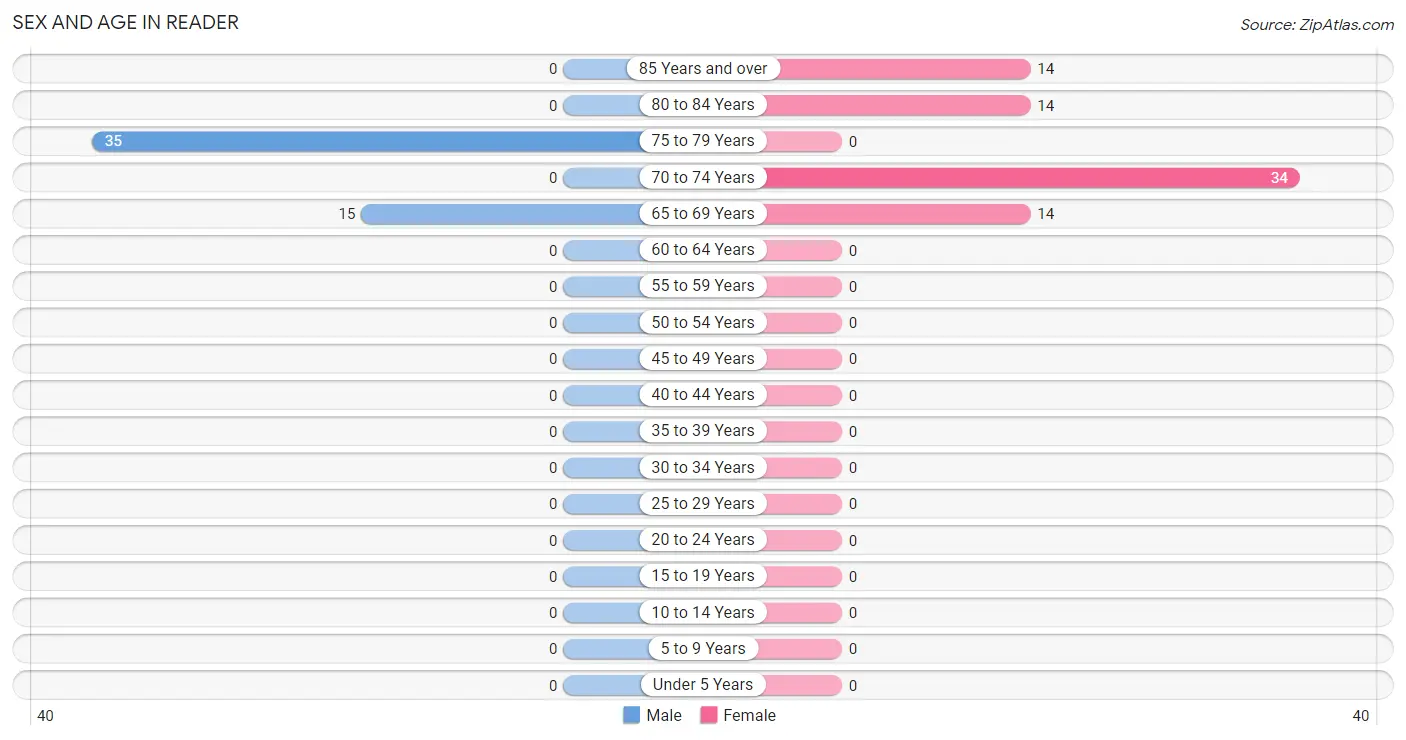
Sex and Age in Reader
Sex and Age in Reader
The most populous age groups in Reader are 75 to 79 Years (35 | 70.0%) for men and 70 to 74 Years (34 | 44.7%) for women.
Age Bracket
Male
Female
Under 5 Years
0 (0.0%)
0 (0.0%)
5 to 9 Years
0 (0.0%)
0 (0.0%)
10 to 14 Years
0 (0.0%)
0 (0.0%)
15 to 19 Years
0 (0.0%)
0 (0.0%)
20 to 24 Years
0 (0.0%)
0 (0.0%)
25 to 29 Years
0 (0.0%)
0 (0.0%)
30 to 34 Years
0 (0.0%)
0 (0.0%)
35 to 39 Years
0 (0.0%)
0 (0.0%)
40 to 44 Years
0 (0.0%)
0 (0.0%)
45 to 49 Years
0 (0.0%)
0 (0.0%)
50 to 54 Years
0 (0.0%)
0 (0.0%)
55 to 59 Years
0 (0.0%)
0 (0.0%)
60 to 64 Years
0 (0.0%)
0 (0.0%)
65 to 69 Years
15 (30.0%)
14 (18.4%)
70 to 74 Years
0 (0.0%)
34 (44.7%)
75 to 79 Years
35 (70.0%)
0 (0.0%)
80 to 84 Years
0 (0.0%)
14 (18.4%)
85 Years and over
0 (0.0%)
14 (18.4%)
Total
50 (100.0%)
76 (100.0%)
Families and Households in Reader
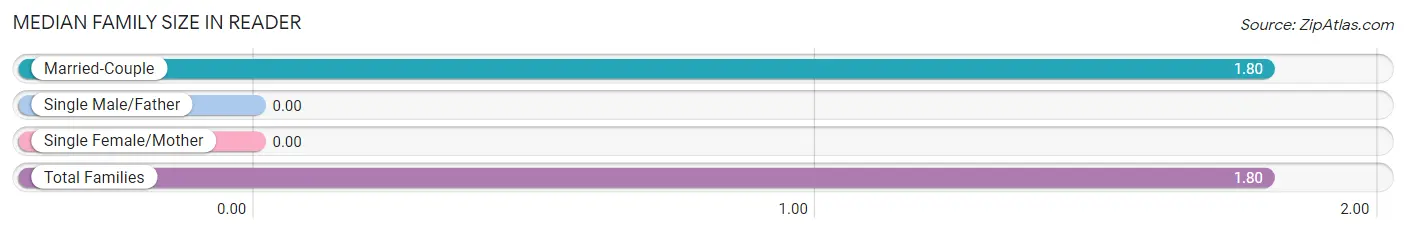
Median Family Size in Reader
Family Type
# Families
Family Size
Married-Couple
49 (100.0%)
1.80
Single Male/Father
0 (0.0%)
-
Single Female/Mother
0 (0.0%)
-
Total Families
49 (100.0%)
1.80
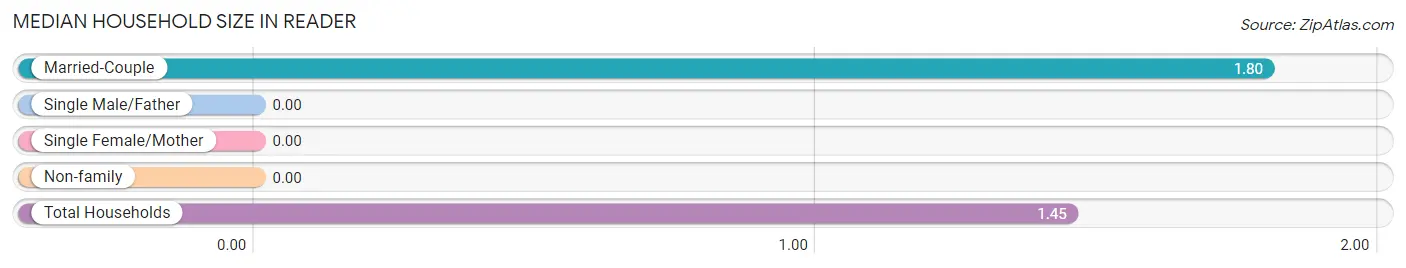
Median Household Size in Reader
Household Type
# Households
Household Size
Married-Couple
49 (56.3%)
1.80
Single Male/Father
0 (0.0%)
-
Single Female/Mother
0 (0.0%)
-
Non-family
38 (43.7%)
-
Total Households
87 (100.0%)
1.45
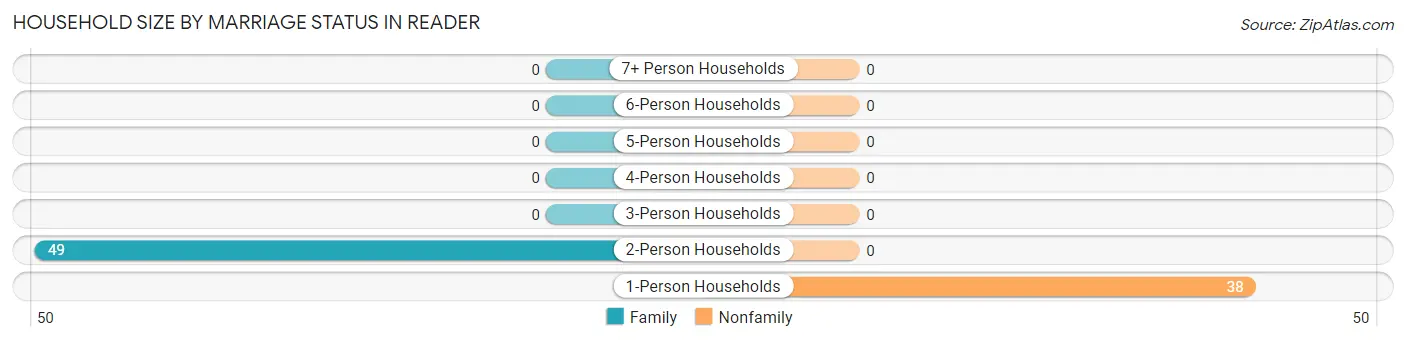
Household Size by Marriage Status in Reader
Out of a total of 87 households in Reader, 49 (56.3%) are family households, while 38 (43.7%) are nonfamily households. The most numerous type of family households are 2-person households, comprising 49, and the most common type of nonfamily households are 1-person households, comprising 38.
Household Size
Family Households
Nonfamily Households
1-Person Households
-
38 (43.7%)
2-Person Households
49 (56.3%)
0 (0.0%)
3-Person Households
0 (0.0%)
0 (0.0%)
4-Person Households
0 (0.0%)
0 (0.0%)
5-Person Households
0 (0.0%)
0 (0.0%)
6-Person Households
0 (0.0%)
0 (0.0%)
7+ Person Households
0 (0.0%)
0 (0.0%)
Total
49 (56.3%)
38 (43.7%)
Female Fertility in Reader
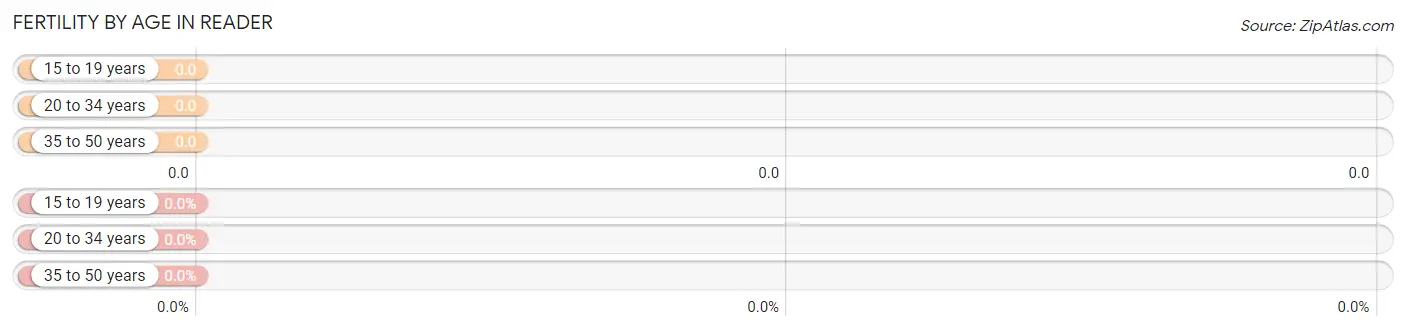
Fertility by Age in Reader
Age Bracket
Women with Births
Births / 1,000 Women
15 to 19 years
0 (0.0%)
0.0
20 to 34 years
0 (0.0%)
0.0
35 to 50 years
0 (0.0%)
0.0
Total
0 (0.0%)
0.0
Fertility by Age by Marriage Status in Reader
Age Bracket
Married
Unmarried
15 to 19 years
0 (0.0%)
0 (0.0%)
20 to 34 years
0 (0.0%)
0 (0.0%)
35 to 50 years
0 (0.0%)
0 (0.0%)
Total
0 (0.0%)
0 (0.0%)
Fertility by Education in Reader
Educational Attainment
Women with Births
Births / 1,000 Women
Less than High School
0 (0.0%)
0.0
High School Diploma
0 (0.0%)
0.0
College or Associate's Degree
0 (0.0%)
0.0
Bachelor's Degree
0 (0.0%)
0.0
Graduate Degree
0 (0.0%)
0.0
Total
0 (0.0%)
0.0
Fertility by Education by Marriage Status in Reader
Educational Attainment
Married
Unmarried
Less than High School
0 (0.0%)
0 (0.0%)
High School Diploma
0 (0.0%)
0 (0.0%)
College or Associate's Degree
0 (0.0%)
0 (0.0%)
Bachelor's Degree
0 (0.0%)
0 (0.0%)
Graduate Degree
0 (0.0%)
0 (0.0%)
Total
0 (0.0%)
0 (0.0%)
Employment Characteristics in Reader
Employment by Class of Employer in Reader
Employer Class
# Employees
% Employees
Private Company Employees
0
0.0%
Self-Employed (Incorporated)
0
0.0%
Self-Employed (Not Incorporated)
0
0.0%
Not-for-profit Organizations
0
0.0%
Local Government Employees
0
0.0%
State Government Employees
0
0.0%
Federal Government Employees
0
0.0%
Unpaid Family Workers
0
0.0%
Total
0
0.0%
Employment Status by Age in Reader
Age Bracket
In Labor Force
Unemployed
16 to 19 Years
0 (0.0%)
0 (0.0%)
20 to 24 Years
0 (0.0%)
0 (0.0%)
25 to 29 Years
0 (0.0%)
0 (0.0%)
30 to 34 Years
0 (0.0%)
0 (0.0%)
35 to 44 Years
0 (0.0%)
0 (0.0%)
45 to 54 Years
0 (0.0%)
0 (0.0%)
55 to 59 Years
0 (0.0%)
0 (0.0%)
60 to 64 Years
0 (0.0%)
0 (0.0%)
65 to 74 Years
0 (0.0%)
0 (0.0%)
75 Years and over
0 (0.0%)
0 (0.0%)
Total
0 (0.0%)
0 (0.0%)
Employment Status by Educational Attainment in Reader
Educational Attainment
In Labor Force
Unemployed
Less than High School
0 (0.0%)
0 (0.0%)
High School Diploma
0 (0.0%)
0 (0.0%)
College / Associate Degree
0 (0.0%)
0 (0.0%)
Bachelor's Degree or higher
0 (0.0%)
0 (0.0%)
Total
0 (0.0%)
0 (0.0%)
Employment Occupations by Sex in Reader
Management, Business, Science and Arts Occupations
Management, Business, Science and Arts Occupations by Sex
Occupation
Male
Female
Management
0 (0.0%)
0 (0.0%)
Business & Financial
0 (0.0%)
0 (0.0%)
Computers, Engineering & Science
0 (0.0%)
0 (0.0%)
Computers & Mathematics
0 (0.0%)
0 (0.0%)
Architecture & Engineering
0 (0.0%)
0 (0.0%)
Life, Physical & Social Science
0 (0.0%)
0 (0.0%)
Community & Social Service
0 (0.0%)
0 (0.0%)
Education, Arts & Media
0 (0.0%)
0 (0.0%)
Legal Services & Support
0 (0.0%)
0 (0.0%)
Education Instruction & Library
0 (0.0%)
0 (0.0%)
Arts, Media & Entertainment
0 (0.0%)
0 (0.0%)
Health Diagnosing & Treating
0 (0.0%)
0 (0.0%)
Health Technologists
0 (0.0%)
0 (0.0%)
Total (Category)
0 (0.0%)
0 (0.0%)
Total (Overall)
0 (0.0%)
0 (0.0%)
Services Occupations
Services Occupations by Sex
Occupation
Male
Female
Healthcare Support
0 (0.0%)
0 (0.0%)
Security & Protection
0 (0.0%)
0 (0.0%)
Firefighting & Prevention
0 (0.0%)
0 (0.0%)
Law Enforcement
0 (0.0%)
0 (0.0%)
Food Preparation & Serving
0 (0.0%)
0 (0.0%)
Cleaning & Maintenance
0 (0.0%)
0 (0.0%)
Personal Care & Service
0 (0.0%)
0 (0.0%)
Total (Category)
0 (0.0%)
0 (0.0%)
Total (Overall)
0 (0.0%)
0 (0.0%)
Sales and Office Occupations
Sales and Office Occupations by Sex
Occupation
Male
Female
Sales & Related
0 (0.0%)
0 (0.0%)
Office & Administration
0 (0.0%)
0 (0.0%)
Total (Category)
0 (0.0%)
0 (0.0%)
Total (Overall)
0 (0.0%)
0 (0.0%)
Natural Resources, Construction and Maintenance Occupations
Natural Resources, Construction and Maintenance Occupations by Sex
Occupation
Male
Female
Farming, Fishing & Forestry
0 (0.0%)
0 (0.0%)
Construction & Extraction
0 (0.0%)
0 (0.0%)
Installation, Maintenance & Repair
0 (0.0%)
0 (0.0%)
Total (Category)
0 (0.0%)
0 (0.0%)
Total (Overall)
0 (0.0%)
0 (0.0%)
Production, Transportation and Moving Occupations
Production, Transportation and Moving Occupations by Sex
Occupation
Male
Female
Production
0 (0.0%)
0 (0.0%)
Transportation
0 (0.0%)
0 (0.0%)
Material Moving
0 (0.0%)
0 (0.0%)
Total (Category)
0 (0.0%)
0 (0.0%)
Total (Overall)
0 (0.0%)
0 (0.0%)
Employment Industries by Sex in Reader
Employment Industries in Reader
Employment Industries by Sex in Reader
Industry
Male
Female
Agriculture, Fishing & Hunting
0 (0.0%)
0 (0.0%)
Mining, Quarrying, & Extraction
0 (0.0%)
0 (0.0%)
Construction
0 (0.0%)
0 (0.0%)
Manufacturing
0 (0.0%)
0 (0.0%)
Wholesale Trade
0 (0.0%)
0 (0.0%)
Retail Trade
0 (0.0%)
0 (0.0%)
Transportation & Warehousing
0 (0.0%)
0 (0.0%)
Utilities
0 (0.0%)
0 (0.0%)
Information
0 (0.0%)
0 (0.0%)
Finance & Insurance
0 (0.0%)
0 (0.0%)
Real Estate, Rental & Leasing
0 (0.0%)
0 (0.0%)
Professional & Scientific
0 (0.0%)
0 (0.0%)
Enterprise Management
0 (0.0%)
0 (0.0%)
Administrative & Support
0 (0.0%)
0 (0.0%)
Educational Services
0 (0.0%)
0 (0.0%)
Health Care & Social Assistance
0 (0.0%)
0 (0.0%)
Arts, Entertainment & Recreation
0 (0.0%)
0 (0.0%)
Accommodation & Food Services
0 (0.0%)
0 (0.0%)
Public Administration
0 (0.0%)
0 (0.0%)
Total
0 (0.0%)
0 (0.0%)
Education in Reader
School Enrollment in Reader
School Level
# Students
% Students
Nursery / Preschool
0
0.0%
Kindergarten
0
0.0%
Elementary School
0
0.0%
Middle School
0
0.0%
High School
0
0.0%
College / Undergraduate
0
0.0%
Graduate / Professional
0
0.0%
Total
0
0.0%
School Enrollment by Age by Funding Source in Reader
Age Bracket
Public School
Private School
3 to 4 Year Olds
0 (0.0%)
0 (0.0%)
5 to 9 Year Old
0 (0.0%)
0 (0.0%)
10 to 14 Year Olds
0 (0.0%)
0 (0.0%)
15 to 17 Year Olds
0 (0.0%)
0 (0.0%)
18 to 19 Year Olds
0 (0.0%)
0 (0.0%)
20 to 24 Year Olds
0 (0.0%)
0 (0.0%)
25 to 34 Year Olds
0 (0.0%)
0 (0.0%)
35 Years and over
0 (0.0%)
0 (0.0%)
Total
0 (0.0%)
0 (0.0%)
Educational Attainment by Field of Study in Reader
Field of Study
# Graduates
% Graduates
Computers & Mathematics
0
0.0%
Bio, Nature & Agricultural
0
0.0%
Physical & Health Sciences
0
0.0%
Psychology
0
0.0%
Social Sciences
0
0.0%
Engineering
0
0.0%
Multidisciplinary Studies
0
0.0%
Science & Technology
0
0.0%
Business
0
0.0%
Education
0
0.0%
Literature & Languages
0
0.0%
Liberal Arts & History
0
0.0%
Visual & Performing Arts
0
0.0%
Communications
0
0.0%
Arts & Humanities
0
0.0%
Total
0
0.0%
Transportation & Commute in Reader
Vehicle Availability by Sex in Reader
Vehicles Available
Male
Female
No Vehicle
0 (0.0%)
0 (0.0%)
1 Vehicle
0 (0.0%)
0 (0.0%)
2 Vehicles
0 (0.0%)
0 (0.0%)
3 Vehicles
0 (0.0%)
0 (0.0%)
4 Vehicles
0 (0.0%)
0 (0.0%)
5 or more Vehicles
0 (0.0%)
0 (0.0%)
Total
0 (0.0%)
0 (0.0%)
Commute Time in Reader
Commute Time
# Commuters
% Commuters
Less than 5 Minutes
0
0.0%
5 to 9 Minutes
0
0.0%
10 to 14 Minutes
0
0.0%
15 to 19 Minutes
0
0.0%
20 to 24 Minutes
0
0.0%
25 to 29 Minutes
0
0.0%
30 to 34 Minutes
0
0.0%
35 to 39 Minutes
0
0.0%
40 to 44 Minutes
0
0.0%
45 to 59 Minutes
0
0.0%
60 to 89 Minutes
0
0.0%
90 or more Minutes
0
0.0%
Commute Time by Sex in Reader
Commute Time
Male
Female
Less than 5 Minutes
0 (0.0%)
0 (0.0%)
5 to 9 Minutes
0 (0.0%)
0 (0.0%)
10 to 14 Minutes
0 (0.0%)
0 (0.0%)
15 to 19 Minutes
0 (0.0%)
0 (0.0%)
20 to 24 Minutes
0 (0.0%)
0 (0.0%)
25 to 29 Minutes
0 (0.0%)
0 (0.0%)
30 to 34 Minutes
0 (0.0%)
0 (0.0%)
35 to 39 Minutes
0 (0.0%)
0 (0.0%)
40 to 44 Minutes
0 (0.0%)
0 (0.0%)
45 to 59 Minutes
0 (0.0%)
0 (0.0%)
60 to 89 Minutes
0 (0.0%)
0 (0.0%)
90 or more Minutes
0 (0.0%)
0 (0.0%)
Time of Departure to Work by Sex in Reader
Time of Departure
Male
Female
12:00 AM to 4:59 AM
0 (0.0%)
0 (0.0%)
5:00 AM to 5:29 AM
0 (0.0%)
0 (0.0%)
5:30 AM to 5:59 AM
0 (0.0%)
0 (0.0%)
6:00 AM to 6:29 AM
0 (0.0%)
0 (0.0%)
6:30 AM to 6:59 AM
0 (0.0%)
0 (0.0%)
7:00 AM to 7:29 AM
0 (0.0%)
0 (0.0%)
7:30 AM to 7:59 AM
0 (0.0%)
0 (0.0%)
8:00 AM to 8:29 AM
0 (0.0%)
0 (0.0%)
8:30 AM to 8:59 AM
0 (0.0%)
0 (0.0%)
9:00 AM to 9:59 AM
0 (0.0%)
0 (0.0%)
10:00 AM to 10:59 AM
0 (0.0%)
0 (0.0%)
11:00 AM to 11:59 AM
0 (0.0%)
0 (0.0%)
12:00 PM to 3:59 PM
0 (0.0%)
0 (0.0%)
4:00 PM to 11:59 PM
0 (0.0%)
0 (0.0%)
Total
0 (0.0%)
0 (0.0%)
Housing Occupancy in Reader
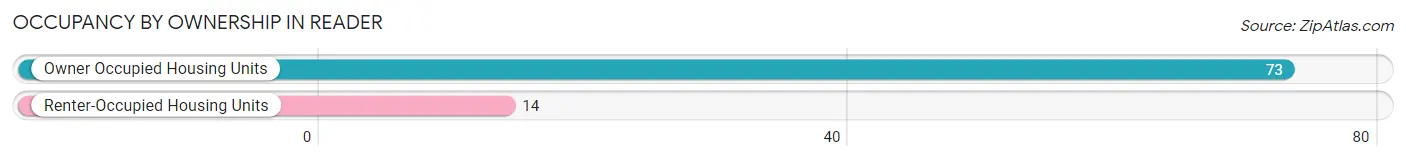
Occupancy by Ownership in Reader
Of the total 87 dwellings in Reader, owner-occupied units account for 73 (83.9%), while renter-occupied units make up 14 (16.1%).
Occupancy
# Housing Units
% Housing Units
Owner Occupied Housing Units
73
83.9%
Renter-Occupied Housing Units
14
16.1%
Total Occupied Housing Units
87
100.0%
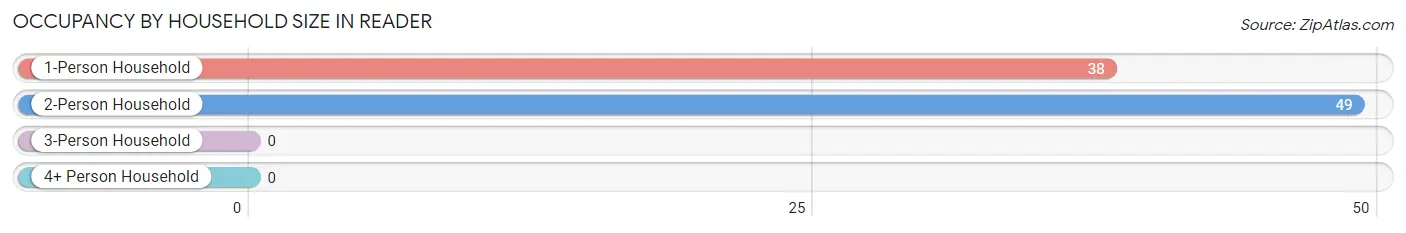
Occupancy by Household Size in Reader
Household Size
# Housing Units
% Housing Units
1-Person Household
38
43.7%
2-Person Household
49
56.3%
3-Person Household
0
0.0%
4+ Person Household
0
0.0%
Total Housing Units
87
100.0%
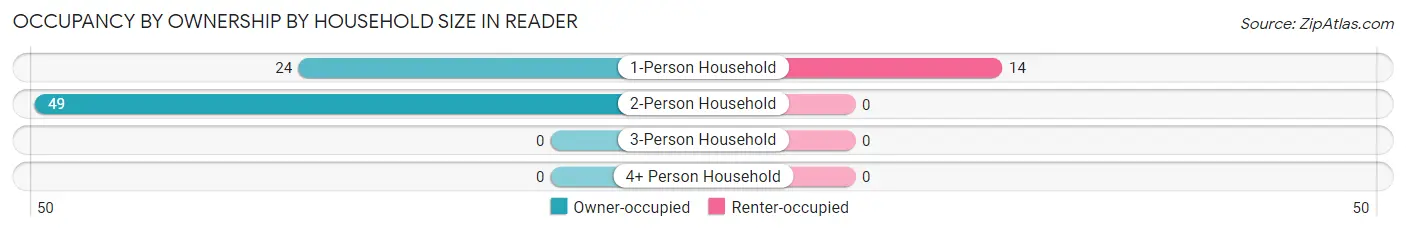
Occupancy by Ownership by Household Size in Reader
Household Size
Owner-occupied
Renter-occupied
1-Person Household
24 (63.2%)
14 (36.8%)
2-Person Household
49 (100.0%)
0 (0.0%)
3-Person Household
0 (0.0%)
0 (0.0%)
4+ Person Household
0 (0.0%)
0 (0.0%)
Total Housing Units
73 (83.9%)
14 (16.1%)
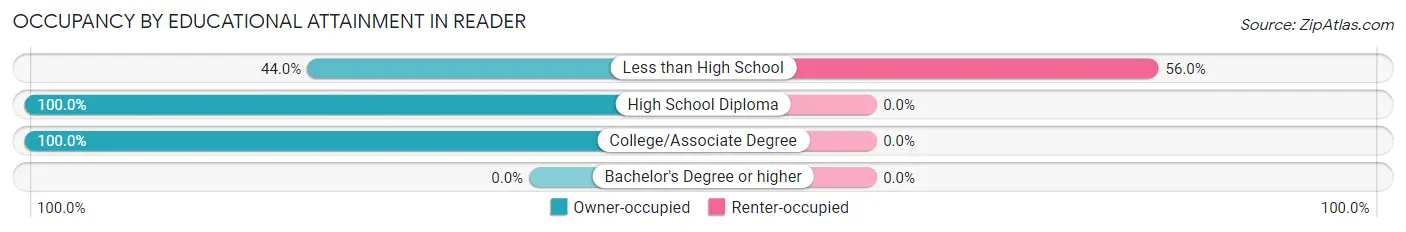
Occupancy by Educational Attainment in Reader
Household Size
Owner-occupied
Renter-occupied
Less than High School
11 (44.0%)
14 (56.0%)
High School Diploma
28 (100.0%)
0 (0.0%)
College/Associate Degree
34 (100.0%)
0 (0.0%)
Bachelor's Degree or higher
0 (0.0%)
0 (0.0%)
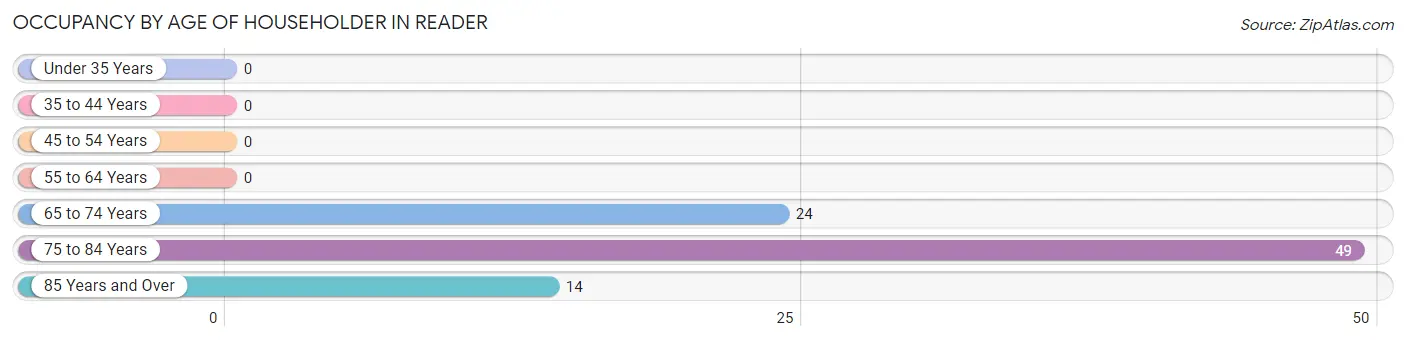
Occupancy by Age of Householder in Reader
Age Bracket
# Households
% Households
Under 35 Years
0
0.0%
35 to 44 Years
0
0.0%
45 to 54 Years
0
0.0%
55 to 64 Years
0
0.0%
65 to 74 Years
24
27.6%
75 to 84 Years
49
56.3%
85 Years and Over
14
16.1%
Total
87
100.0%
Housing Finances in Reader
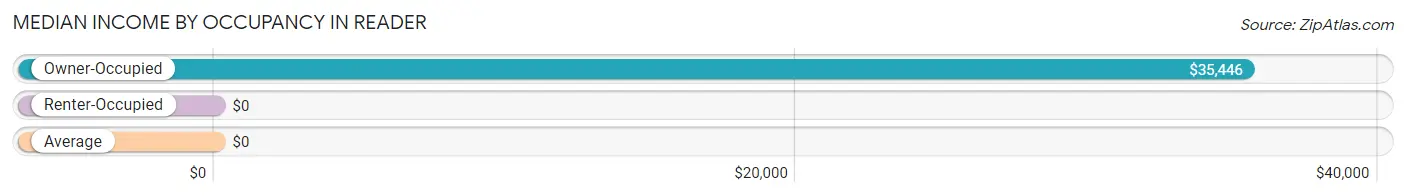
Median Income by Occupancy in Reader
Occupancy Type
# Households
Median Income
Owner-Occupied
73 (83.9%)
$35,446
Renter-Occupied
14 (16.1%)
$0
Average
87 (100.0%)
$0
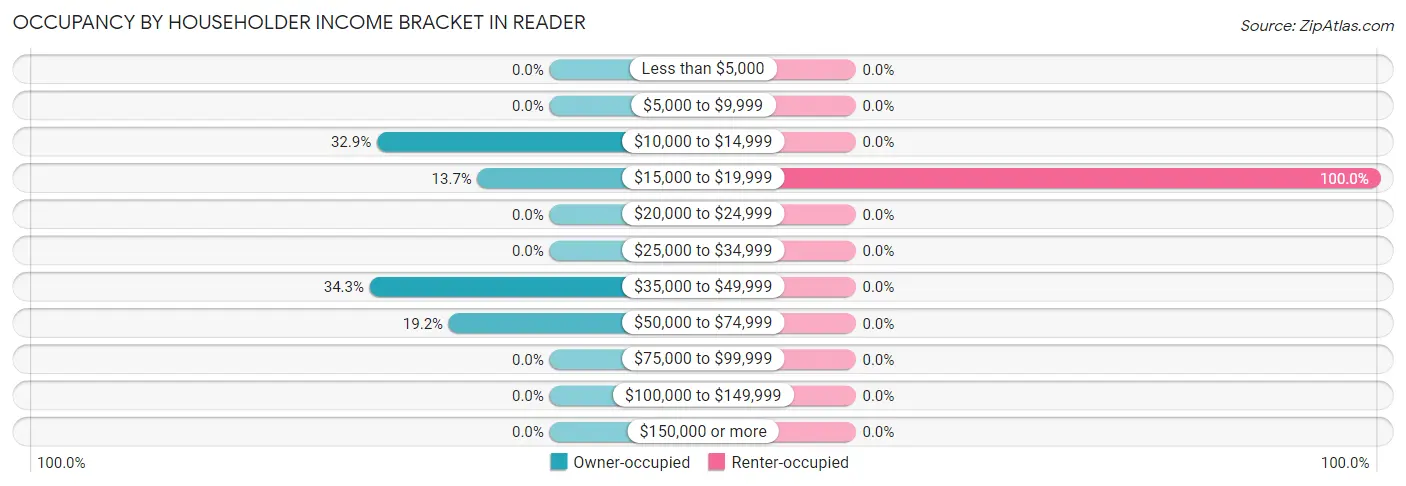
Occupancy by Householder Income Bracket in Reader
Income Bracket
Owner-occupied
Renter-occupied
Less than $5,000
0 (0.0%)
0 (0.0%)
$5,000 to $9,999
0 (0.0%)
0 (0.0%)
$10,000 to $14,999
24 (32.9%)
0 (0.0%)
$15,000 to $19,999
10 (13.7%)
14 (100.0%)
$20,000 to $24,999
0 (0.0%)
0 (0.0%)
$25,000 to $34,999
0 (0.0%)
0 (0.0%)
$35,000 to $49,999
25 (34.3%)
0 (0.0%)
$50,000 to $74,999
14 (19.2%)
0 (0.0%)
$75,000 to $99,999
0 (0.0%)
0 (0.0%)
$100,000 to $149,999
0 (0.0%)
0 (0.0%)
$150,000 or more
0 (0.0%)
0 (0.0%)
Total
73 (100.0%)
14 (100.0%)
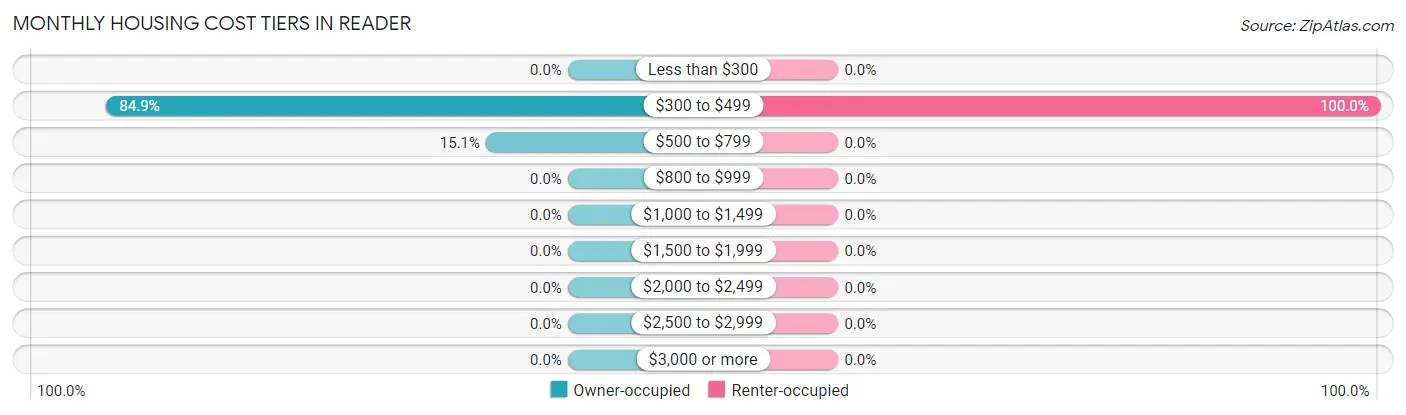
Monthly Housing Cost Tiers in Reader
Monthly Cost
Owner-occupied
Renter-occupied
Less than $300
0 (0.0%)
0 (0.0%)
$300 to $499
62 (84.9%)
14 (100.0%)
$500 to $799
11 (15.1%)
0 (0.0%)
$800 to $999
0 (0.0%)
0 (0.0%)
$1,000 to $1,499
0 (0.0%)
0 (0.0%)
$1,500 to $1,999
0 (0.0%)
0 (0.0%)
$2,000 to $2,499
0 (0.0%)
0 (0.0%)
$2,500 to $2,999
0 (0.0%)
0 (0.0%)
$3,000 or more
0 (0.0%)
0 (0.0%)
Total
73 (100.0%)
14 (100.0%)
Physical Housing Characteristics in Reader
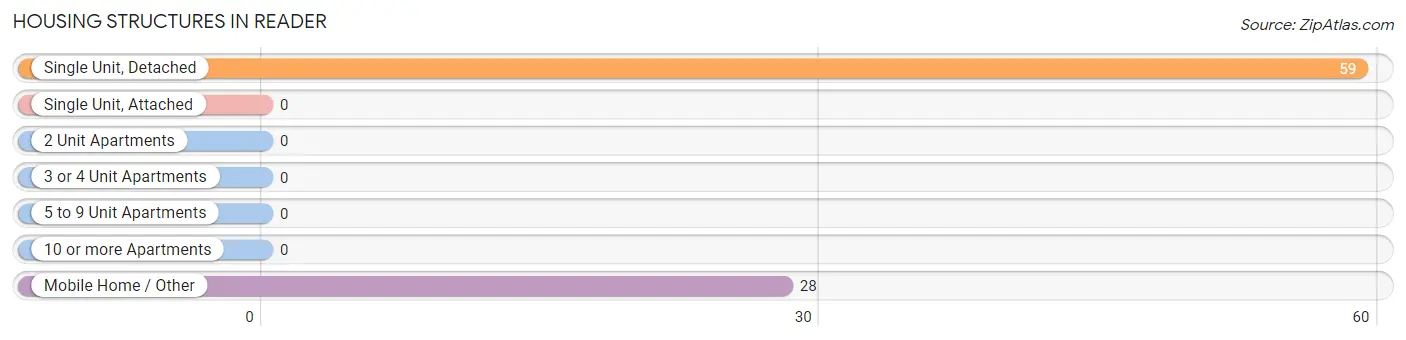
Housing Structures in Reader
Structure Type
# Housing Units
% Housing Units
Single Unit, Detached
59
67.8%
Single Unit, Attached
0
0.0%
2 Unit Apartments
0
0.0%
3 or 4 Unit Apartments
0
0.0%
5 to 9 Unit Apartments
0
0.0%
10 or more Apartments
0
0.0%
Mobile Home / Other
28
32.2%
Total
87
100.0%
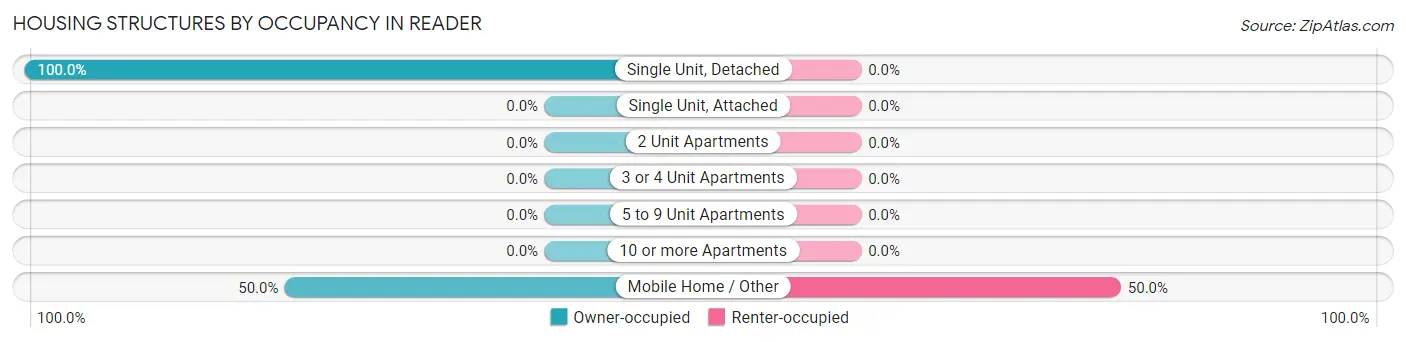
Housing Structures by Occupancy in Reader
Structure Type
Owner-occupied
Renter-occupied
Single Unit, Detached
59 (100.0%)
0 (0.0%)
Single Unit, Attached
0 (0.0%)
0 (0.0%)
2 Unit Apartments
0 (0.0%)
0 (0.0%)
3 or 4 Unit Apartments
0 (0.0%)
0 (0.0%)
5 to 9 Unit Apartments
0 (0.0%)
0 (0.0%)
10 or more Apartments
0 (0.0%)
0 (0.0%)
Mobile Home / Other
14 (50.0%)
14 (50.0%)
Total
73 (83.9%)
14 (16.1%)
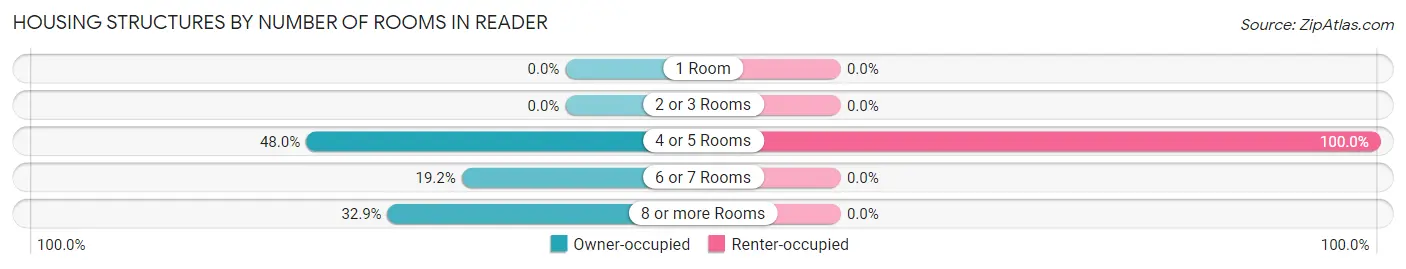
Housing Structures by Number of Rooms in Reader
Number of Rooms
Owner-occupied
Renter-occupied
1 Room
0 (0.0%)
0 (0.0%)
2 or 3 Rooms
0 (0.0%)
0 (0.0%)
4 or 5 Rooms
35 (47.9%)
14 (100.0%)
6 or 7 Rooms
14 (19.2%)
0 (0.0%)
8 or more Rooms
24 (32.9%)
0 (0.0%)
Total
73 (100.0%)
14 (100.0%)
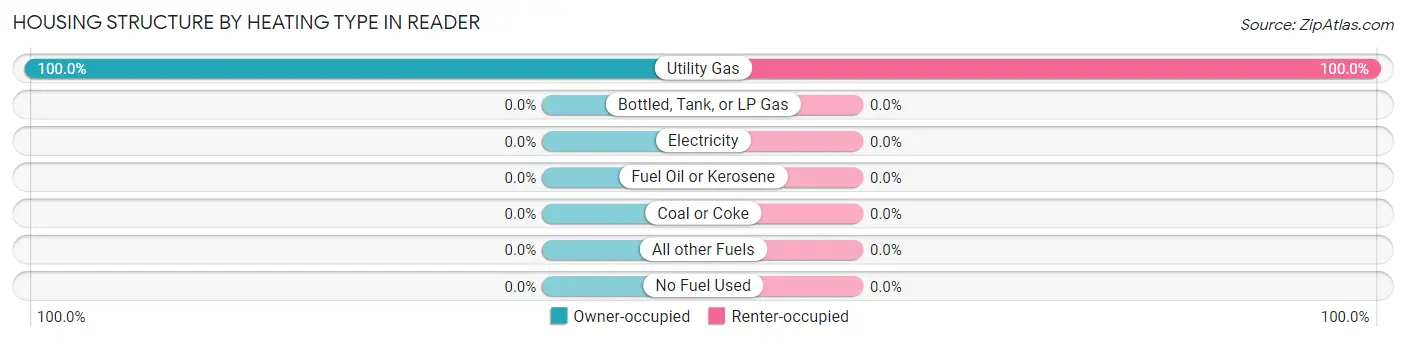
Housing Structure by Heating Type in Reader
Heating Type
Owner-occupied
Renter-occupied
Utility Gas
73 (100.0%)
14 (100.0%)
Bottled, Tank, or LP Gas
0 (0.0%)
0 (0.0%)
Electricity
0 (0.0%)
0 (0.0%)
Fuel Oil or Kerosene
0 (0.0%)
0 (0.0%)
Coal or Coke
0 (0.0%)
0 (0.0%)
All other Fuels
0 (0.0%)
0 (0.0%)
No Fuel Used
0 (0.0%)
0 (0.0%)
Total
73 (100.0%)
14 (100.0%)
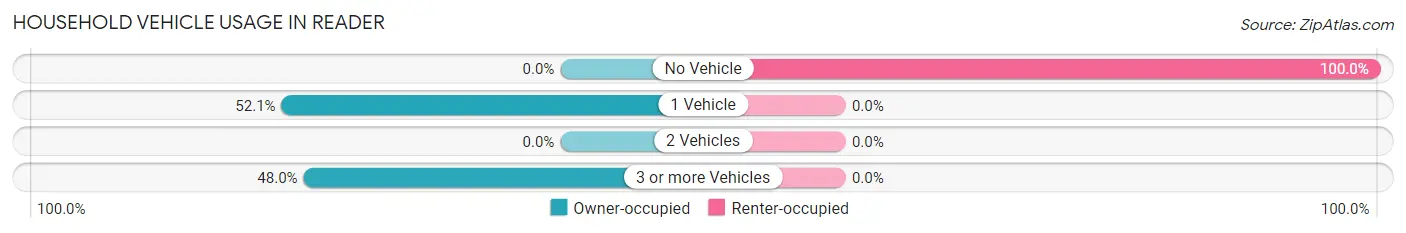
Household Vehicle Usage in Reader
Vehicles per Household
Owner-occupied
Renter-occupied
No Vehicle
0 (0.0%)
14 (100.0%)
1 Vehicle
38 (52.0%)
0 (0.0%)
2 Vehicles
0 (0.0%)
0 (0.0%)
3 or more Vehicles
35 (47.9%)
0 (0.0%)
Total
73 (100.0%)
14 (100.0%)
Real Estate & Mortgages in Reader
Real Estate and Mortgage Overview in Reader
Characteristic
Without Mortgage
With Mortgage
Housing Units
73
0
Median Property Value
$36,800
$0
Median Household Income
$35,446
$0
Monthly Housing Costs
$375
$0
Real Estate Taxes
-
-
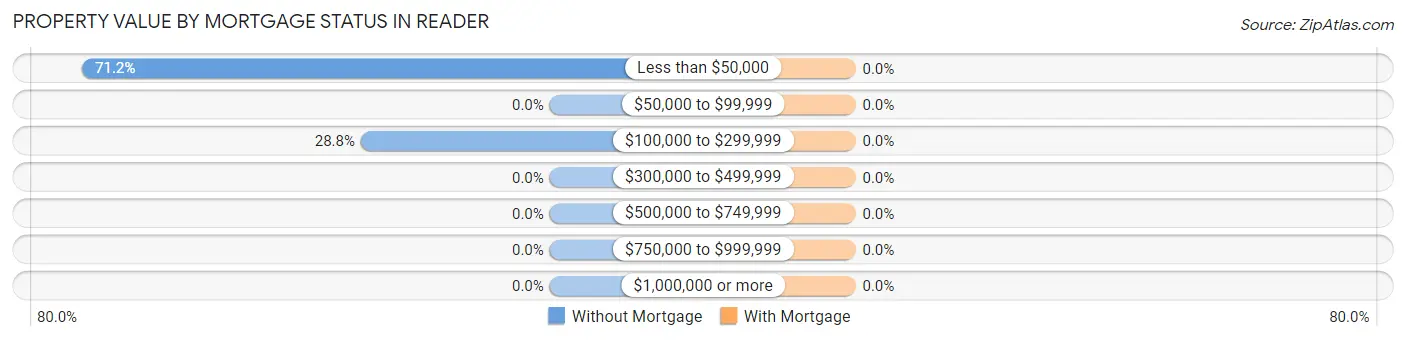
Property Value by Mortgage Status in Reader
Property Value
Without Mortgage
With Mortgage
Less than $50,000
52 (71.2%)
0 (0.0%)
$50,000 to $99,999
0 (0.0%)
0 (0.0%)
$100,000 to $299,999
21 (28.8%)
0 (0.0%)
$300,000 to $499,999
0 (0.0%)
0 (0.0%)
$500,000 to $749,999
0 (0.0%)
0 (0.0%)
$750,000 to $999,999
0 (0.0%)
0 (0.0%)
$1,000,000 or more
0 (0.0%)
0 (0.0%)
Total
73 (100.0%)
0 (0.0%)
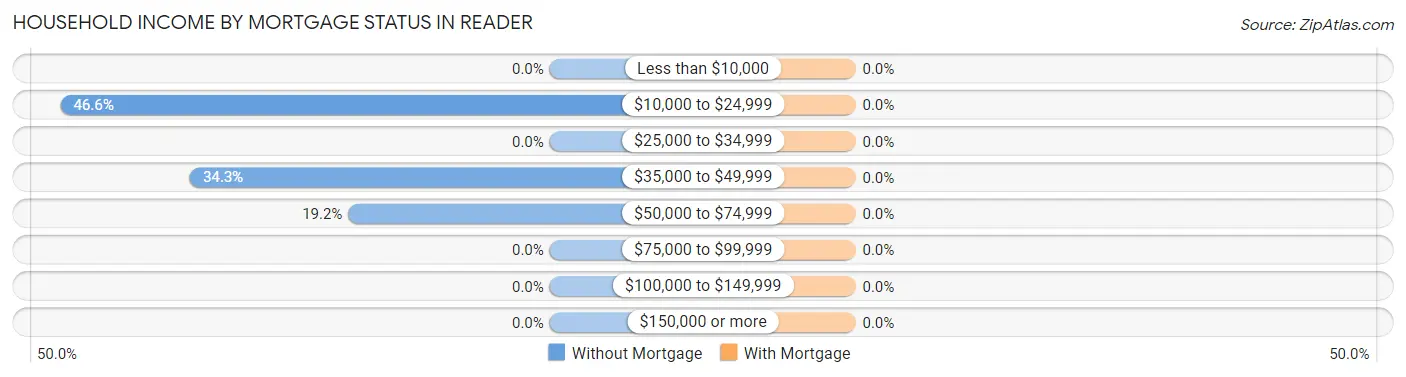
Household Income by Mortgage Status in Reader
Household Income
Without Mortgage
With Mortgage
Less than $10,000
0 (0.0%)
0 (0.0%)
$10,000 to $24,999
34 (46.6%)
0 (0.0%)
$25,000 to $34,999
0 (0.0%)
0 (0.0%)
$35,000 to $49,999
25 (34.3%)
0 (0.0%)
$50,000 to $74,999
14 (19.2%)
0 (0.0%)
$75,000 to $99,999
0 (0.0%)
0 (0.0%)
$100,000 to $149,999
0 (0.0%)
0 (0.0%)
$150,000 or more
0 (0.0%)
0 (0.0%)
Total
73 (100.0%)
0 (0.0%)
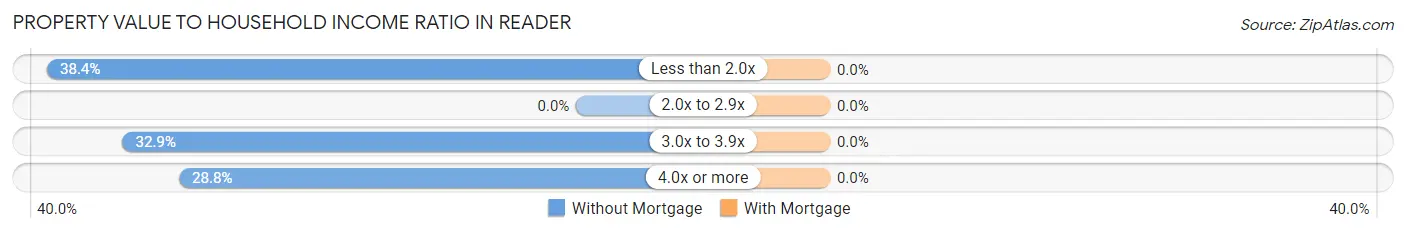
Property Value to Household Income Ratio in Reader
Value-to-Income Ratio
Without Mortgage
With Mortgage
Less than 2.0x
28 (38.4%)
0 (0.0%)
2.0x to 2.9x
0 (0.0%)
0 (0.0%)
3.0x to 3.9x
24 (32.9%)
0 (0.0%)
4.0x or more
21 (28.8%)
0 (0.0%)
Total
73 (100.0%)
0 (0.0%)
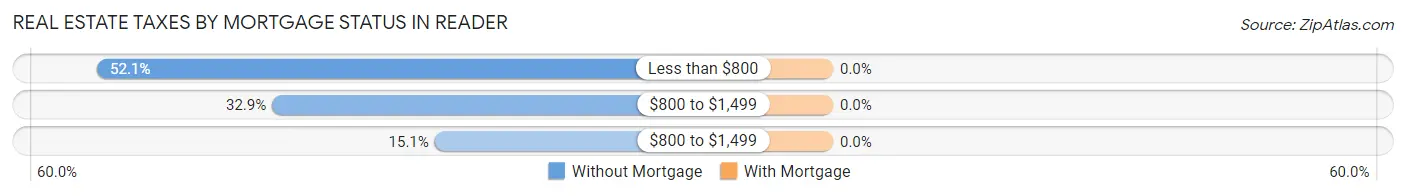
Real Estate Taxes by Mortgage Status in Reader
Property Taxes
Without Mortgage
With Mortgage
Less than $800
38 (52.0%)
0 (0.0%)
$800 to $1,499
24 (32.9%)
0 (0.0%)
$800 to $1,499
11 (15.1%)
0 (0.0%)
Total
73 (100.0%)
0 (0.0%)
Health & Disability in Reader
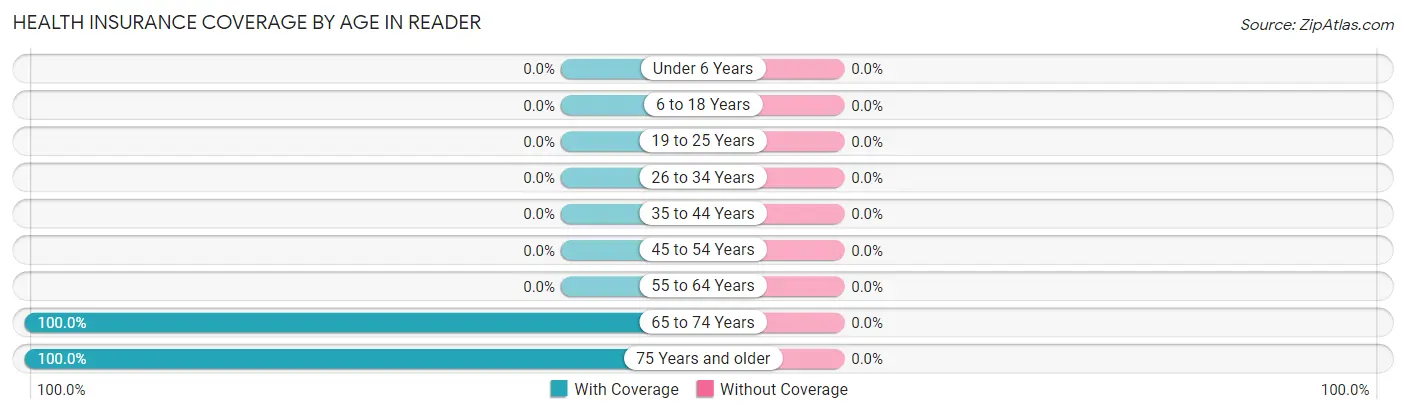
Health Insurance Coverage by Age in Reader
Age Bracket
With Coverage
Without Coverage
Under 6 Years
0 (0.0%)
0 (0.0%)
6 to 18 Years
0 (0.0%)
0 (0.0%)
19 to 25 Years
0 (0.0%)
0 (0.0%)
26 to 34 Years
0 (0.0%)
0 (0.0%)
35 to 44 Years
0 (0.0%)
0 (0.0%)
45 to 54 Years
0 (0.0%)
0 (0.0%)
55 to 64 Years
0 (0.0%)
0 (0.0%)
65 to 74 Years
63 (100.0%)
0 (0.0%)
75 Years and older
63 (100.0%)
0 (0.0%)
Total
126 (100.0%)
0 (0.0%)
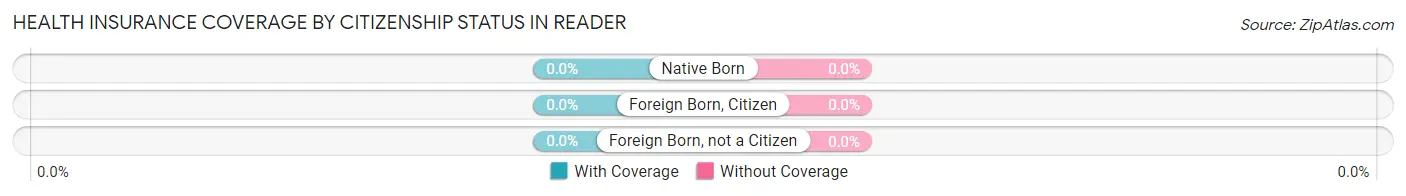
Health Insurance Coverage by Citizenship Status in Reader
Citizenship Status
With Coverage
Without Coverage
Native Born
0 (0.0%)
0 (0.0%)
Foreign Born, Citizen
0 (0.0%)
0 (0.0%)
Foreign Born, not a Citizen
0 (0.0%)
0 (0.0%)
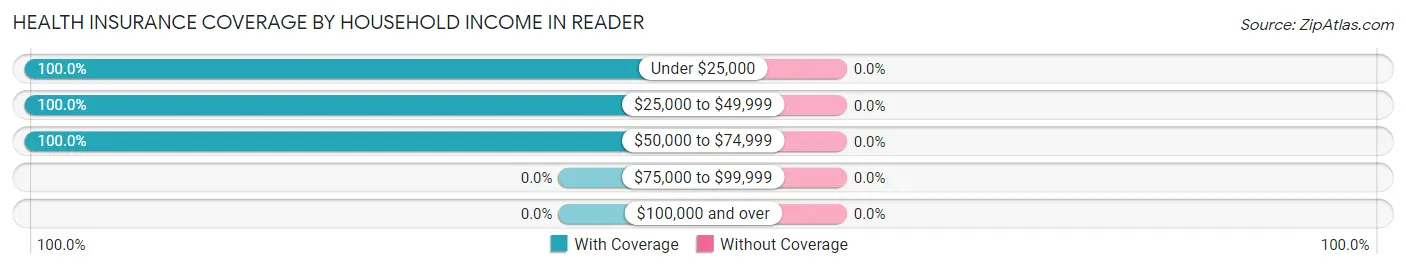
Health Insurance Coverage by Household Income in Reader
Household Income
With Coverage
Without Coverage
Under $25,000
64 (100.0%)
0 (0.0%)
$25,000 to $49,999
33 (100.0%)
0 (0.0%)
$50,000 to $74,999
29 (100.0%)
0 (0.0%)
$75,000 to $99,999
0 (0.0%)
0 (0.0%)
$100,000 and over
0 (0.0%)
0 (0.0%)
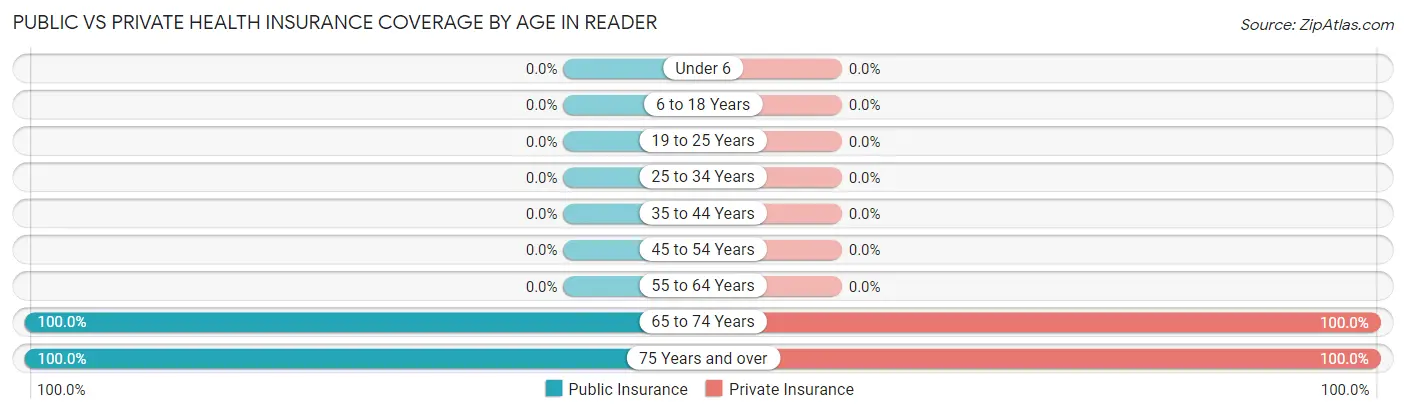
Public vs Private Health Insurance Coverage by Age in Reader
Age Bracket
Public Insurance
Private Insurance
Under 6
0 (0.0%)
0 (0.0%)
6 to 18 Years
0 (0.0%)
0 (0.0%)
19 to 25 Years
0 (0.0%)
0 (0.0%)
25 to 34 Years
0 (0.0%)
0 (0.0%)
35 to 44 Years
0 (0.0%)
0 (0.0%)
45 to 54 Years
0 (0.0%)
0 (0.0%)
55 to 64 Years
0 (0.0%)
0 (0.0%)
65 to 74 Years
63 (100.0%)
63 (100.0%)
75 Years and over
63 (100.0%)
63 (100.0%)
Total
126 (100.0%)
126 (100.0%)
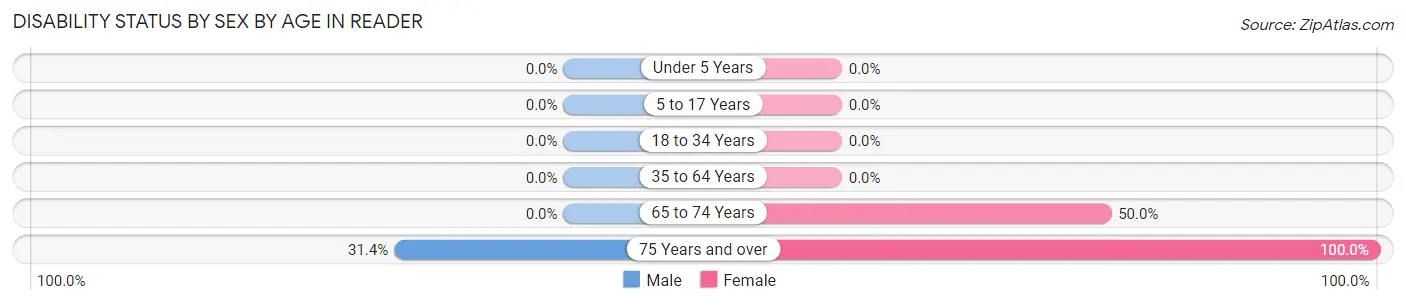
Disability Status by Sex by Age in Reader
Age Bracket
Male
Female
Under 5 Years
0 (0.0%)
0 (0.0%)
5 to 17 Years
0 (0.0%)
0 (0.0%)
18 to 34 Years
0 (0.0%)
0 (0.0%)
35 to 64 Years
0 (0.0%)
0 (0.0%)
65 to 74 Years
0 (0.0%)
24 (50.0%)
75 Years and over
11 (31.4%)
28 (100.0%)
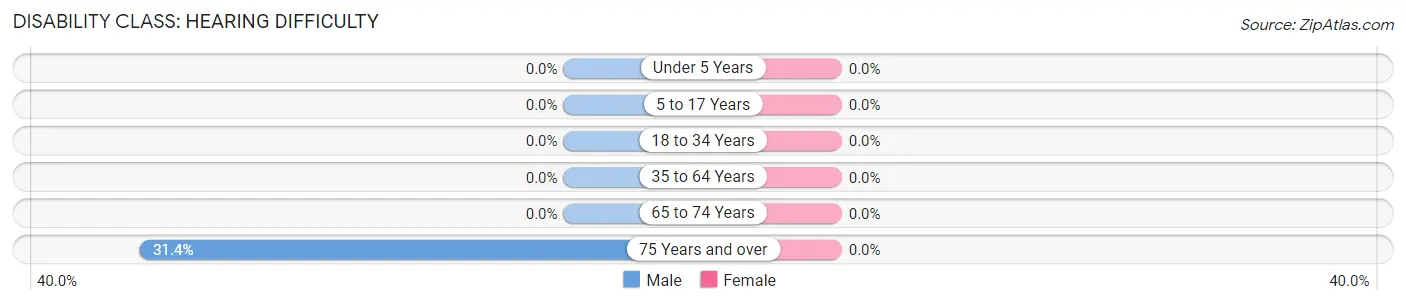
Disability Class by Sex by Age in Reader
Disability Class: Hearing Difficulty
Age Bracket
Male
Female
Under 5 Years
0 (0.0%)
0 (0.0%)
5 to 17 Years
0 (0.0%)
0 (0.0%)
18 to 34 Years
0 (0.0%)
0 (0.0%)
35 to 64 Years
0 (0.0%)
0 (0.0%)
65 to 74 Years
0 (0.0%)
0 (0.0%)
75 Years and over
11 (31.4%)
0 (0.0%)
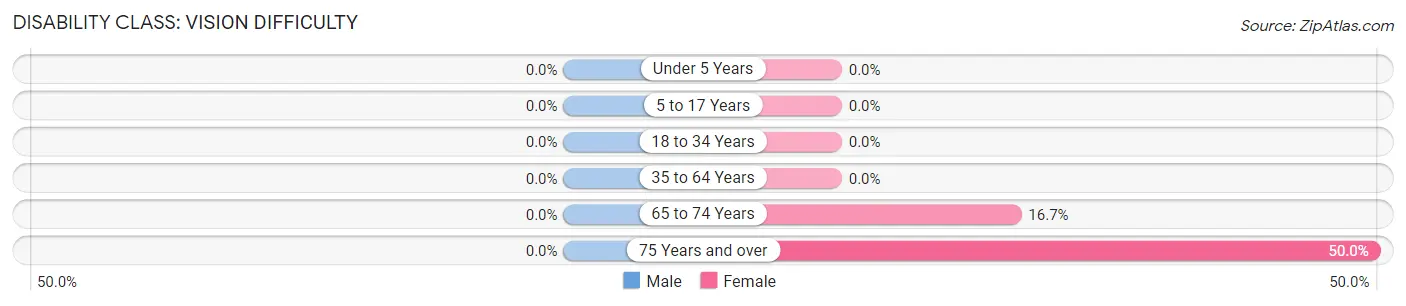
Disability Class: Vision Difficulty
Age Bracket
Male
Female
Under 5 Years
0 (0.0%)
0 (0.0%)
5 to 17 Years
0 (0.0%)
0 (0.0%)
18 to 34 Years
0 (0.0%)
0 (0.0%)
35 to 64 Years
0 (0.0%)
0 (0.0%)
65 to 74 Years
0 (0.0%)
8 (16.7%)
75 Years and over
0 (0.0%)
14 (50.0%)
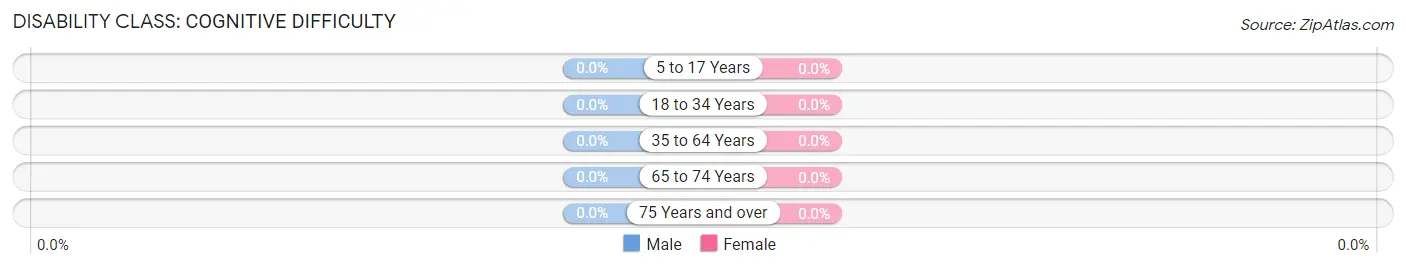
Disability Class: Cognitive Difficulty
Age Bracket
Male
Female
5 to 17 Years
0 (0.0%)
0 (0.0%)
18 to 34 Years
0 (0.0%)
0 (0.0%)
35 to 64 Years
0 (0.0%)
0 (0.0%)
65 to 74 Years
0 (0.0%)
0 (0.0%)
75 Years and over
0 (0.0%)
0 (0.0%)
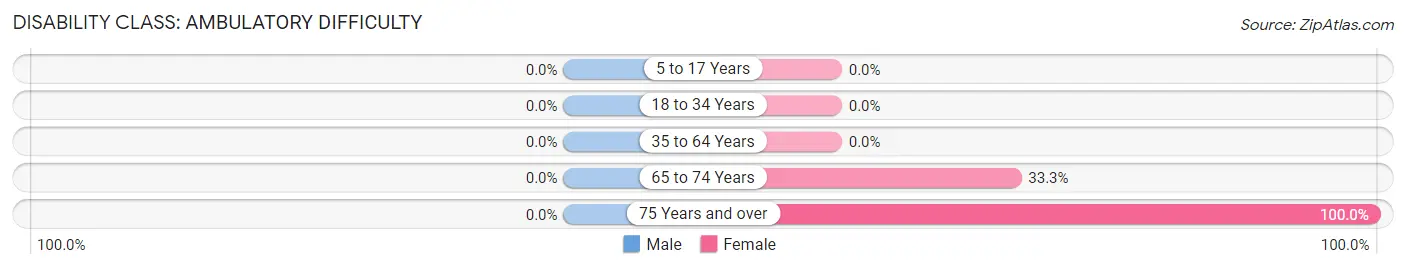
Disability Class: Ambulatory Difficulty
Age Bracket
Male
Female
5 to 17 Years
0 (0.0%)
0 (0.0%)
18 to 34 Years
0 (0.0%)
0 (0.0%)
35 to 64 Years
0 (0.0%)
0 (0.0%)
65 to 74 Years
0 (0.0%)
16 (33.3%)
75 Years and over
0 (0.0%)
28 (100.0%)
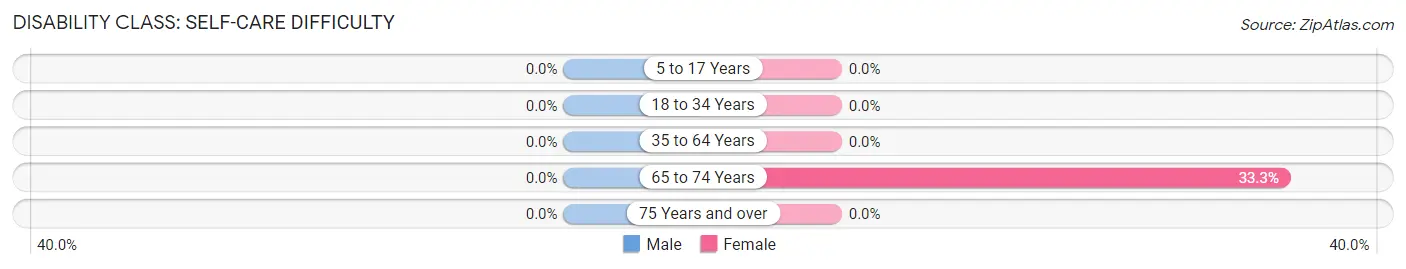
Disability Class: Self-Care Difficulty
Age Bracket
Male
Female
5 to 17 Years
0 (0.0%)
0 (0.0%)
18 to 34 Years
0 (0.0%)
0 (0.0%)
35 to 64 Years
0 (0.0%)
0 (0.0%)
65 to 74 Years
0 (0.0%)
16 (33.3%)
75 Years and over
0 (0.0%)
0 (0.0%)
Technology Access in Reader
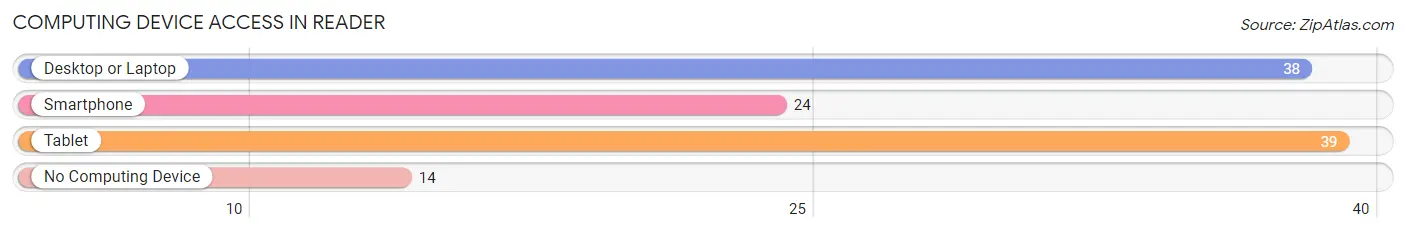
Computing Device Access in Reader
Device Type
# Households
% Households
Desktop or Laptop
38
43.7%
Smartphone
24
27.6%
Tablet
39
44.8%
No Computing Device
14
16.1%
Total
87
100.0%
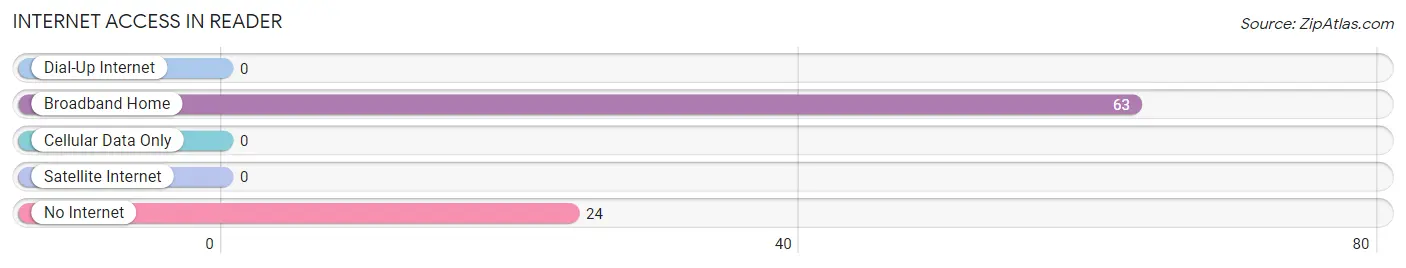
Internet Access in Reader
Internet Type
# Households
% Households
Dial-Up Internet
0
0.0%
Broadband Home
63
72.4%
Cellular Data Only
0
0.0%
Satellite Internet
0
0.0%
No Internet
24
27.6%
Total
87
100.0%
Reader Summary
West Virginia is a state located in the Appalachian region of the United States. It is bordered by Virginia to the southeast, Kentucky to the southwest, Ohio to the northwest, and Pennsylvania and Maryland to the northeast. West Virginia is the 41st largest state by area and ranks 38th in population. The capital and largest city is Charleston.
History
West Virginia was originally part of the state of Virginia, but it became its own state in 1863 during the American Civil War. The state was formed when the western counties of Virginia seceded from the state and joined the Union. West Virginia was the only state to be formed by seceding from a Confederate state during the Civil War.
West Virginia was a major producer of coal and timber during the 19th and 20th centuries. The state was also a major producer of oil and natural gas. The state's economy was heavily dependent on the coal industry until the late 20th century.
Geography
West Virginia is located in the Appalachian region of the United States. It is bordered by Virginia to the southeast, Kentucky to the southwest, Ohio to the northwest, and Pennsylvania and Maryland to the northeast. The state has a total area of 24,230 square miles, making it the 41st largest state by area.
West Virginia is divided into two distinct regions: the Allegheny Plateau in the west and the Appalachian Mountains in the east. The Allegheny Plateau is a plateau that covers most of the state and is characterized by rolling hills and valleys. The Appalachian Mountains are a mountain range that runs through the eastern part of the state and is home to some of the highest peaks in the eastern United States.
Economy
West Virginia's economy is largely based on the extraction and processing of natural resources, such as coal, natural gas, and timber. The state is also a major producer of chemicals, steel, and aluminum.
West Virginia's economy has been in decline since the late 20th century due to the decline of the coal industry. The state has been attempting to diversify its economy by investing in other industries, such as tourism, technology, and manufacturing.
Demographics
As of the 2020 census, West Virginia had an estimated population of 1,792,147. The state has a population density of 73.3 people per square mile, making it the 38th most populous state in the United States.
The largest racial group in West Virginia is white, making up 92.2% of the population. The second largest racial group is African American, making up 4.2% of the population. Other racial groups include Native American (1.2%), Asian (0.7%), and Hispanic or Latino (1.7%).
West Virginia is home to a large number of religious denominations, including Protestantism (63.2%), Catholicism (17.2%), and other Christian denominations (7.2%). The state also has a significant population of non-religious individuals (12.4%).
Common Questions
What is Per Capita Income in Reader?
Per Capita income in Reader is $19,860.
What is Inequality or Gini Index in Reader?
Inequality or Gini Index in Reader is 0.33.
What is the Total Population of Reader?
Total Population of Reader is 126.
What is the Total Male Population of Reader?
Total Male Population of Reader is 50.
What is the Total Female Population of Reader?
Total Female Population of Reader is 76.
What is the Ratio of Males per 100 Females in Reader?
There are 65.79 Males per 100 Females in Reader.
What is the Ratio of Females per 100 Males in Reader?
There are 152.00 Females per 100 Males in Reader.
What is the Median Population Age in Reader?
Median Population Age in Reader is 75.0 Years.
What is the Average Family Size in Reader
Average Family Size in Reader is 1.8 People.
What is the Average Household Size in Reader
Average Household Size in Reader is 1.4 People.
Report Title
Report Link
HTML Copy & Paste Link
Social Media
Copy and paste the folowing code into any webpage where you would like this interactive chart to display