Spaniard Male Disability
COMPARE
Spaniard
Select to Compare
Male Disability
Spaniard Male Disability
12.3%
DISABILITY | MALES
0.1/ 100
METRIC RATING
270th/ 347
METRIC RANK
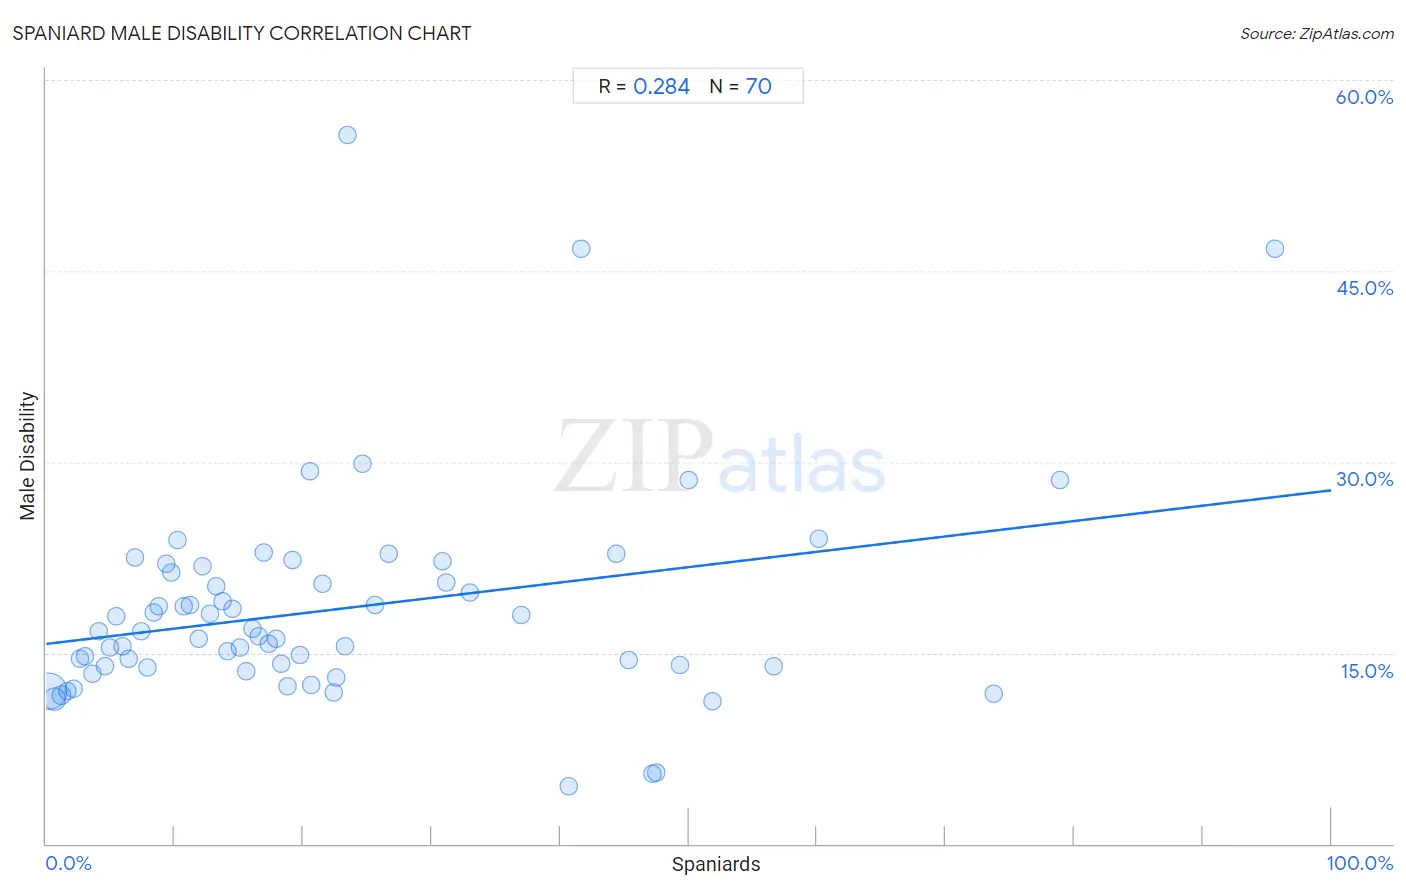
Spaniard Male Disability Correlation Chart
The statistical analysis conducted on geographies consisting of 443,401,909 people shows a weak positive correlation between the proportion of Spaniards and percentage of males with a disability in the United States with a correlation coefficient (R) of 0.284 and weighted average of 12.3%. On average, for every 1% (one percent) increase in Spaniards within a typical geography, there is an increase of 0.12% in percentage of males with a disability.
It is essential to understand that the correlation between the percentage of Spaniards and percentage of males with a disability does not imply a direct cause-and-effect relationship. It remains uncertain whether the presence of Spaniards influences an upward or downward trend in the level of percentage of males with a disability within an area, or if Spaniards simply ended up residing in those areas with higher or lower levels of percentage of males with a disability due to other factors.
Demographics Similar to Spaniards by Male Disability
In terms of male disability, the demographic groups most similar to Spaniards are Czechoslovakian (12.3%, a difference of 0.080%), Portuguese (12.3%, a difference of 0.090%), Scandinavian (12.3%, a difference of 0.19%), Immigrants from Germany (12.3%, a difference of 0.21%), and Hawaiian (12.3%, a difference of 0.26%).
| Demographics | Rating | Rank | Male Disability |
| Canadians | 0.2 /100 | #263 | Tragic 12.2% |
| Nepalese | 0.2 /100 | #264 | Tragic 12.2% |
| Immigrants from Portugal | 0.1 /100 | #265 | Tragic 12.3% |
| Hawaiians | 0.1 /100 | #266 | Tragic 12.3% |
| Immigrants from Germany | 0.1 /100 | #267 | Tragic 12.3% |
| Portuguese | 0.1 /100 | #268 | Tragic 12.3% |
| Czechoslovakians | 0.1 /100 | #269 | Tragic 12.3% |
| Spaniards | 0.1 /100 | #270 | Tragic 12.3% |
| Scandinavians | 0.1 /100 | #271 | Tragic 12.3% |
| Hmong | 0.0 /100 | #272 | Tragic 12.5% |
| Native Hawaiians | 0.0 /100 | #273 | Tragic 12.5% |
| Hopi | 0.0 /100 | #274 | Tragic 12.5% |
| Fijians | 0.0 /100 | #275 | Tragic 12.6% |
| Africans | 0.0 /100 | #276 | Tragic 12.6% |
| Finns | 0.0 /100 | #277 | Tragic 12.6% |
Spaniard Male Disability Correlation Summary
| Measurement | Spaniard Data | Male Disability Data |
| Minimum | 0.20% | 4.5% |
| Maximum | 95.6% | 55.7% |
| Range | 95.4% | 51.2% |
| Mean | 22.4% | 18.4% |
| Median | 16.7% | 16.5% |
| Interquartile 25% (IQ1) | 8.4% | 13.9% |
| Interquartile 75% (IQ3) | 30.8% | 21.3% |
| Interquartile Range (IQR) | 22.4% | 7.4% |
| Standard Deviation (Sample) | 19.9% | 8.5% |
| Standard Deviation (Population) | 19.8% | 8.4% |
Correlation Details
| Spaniard Percentile | Sample Size | Male Disability |
[ 0.0% - 0.5% ] 0.20% | 336,710,814 | 12.0% |
[ 0.5% - 1.0% ] 0.66% | 78,434,527 | 11.3% |
[ 1.0% - 1.5% ] 1.15% | 15,925,525 | 11.7% |
[ 1.5% - 2.0% ] 1.65% | 4,506,933 | 12.0% |
[ 2.0% - 2.5% ] 2.10% | 2,194,052 | 12.2% |
[ 2.5% - 3.0% ] 2.62% | 1,325,432 | 14.6% |
[ 3.0% - 3.5% ] 3.06% | 812,340 | 14.7% |
[ 3.5% - 4.0% ] 3.59% | 542,199 | 13.4% |
[ 4.0% - 4.5% ] 4.04% | 321,911 | 16.7% |
[ 4.5% - 5.0% ] 4.60% | 1,080,629 | 13.9% |
[ 4.5% - 5.0% ] 4.95% | 344,110 | 15.5% |
[ 5.0% - 5.5% ] 5.47% | 308,219 | 17.9% |
[ 5.5% - 6.0% ] 5.97% | 291,893 | 15.5% |
[ 6.0% - 6.5% ] 6.41% | 153,678 | 14.5% |
[ 6.5% - 7.0% ] 6.95% | 36,630 | 22.5% |
[ 7.0% - 7.5% ] 7.41% | 48,379 | 16.6% |
[ 7.5% - 8.0% ] 7.84% | 61,586 | 13.8% |
[ 8.0% - 8.5% ] 8.37% | 17,206 | 18.1% |
[ 8.5% - 9.0% ] 8.79% | 22,938 | 18.6% |
[ 9.0% - 9.5% ] 9.30% | 12,069 | 22.0% |
[ 9.5% - 10.0% ] 9.76% | 17,410 | 21.3% |
[ 10.0% - 10.5% ] 10.26% | 53,332 | 23.8% |
[ 10.5% - 11.0% ] 10.71% | 14,039 | 18.6% |
[ 11.0% - 11.5% ] 11.14% | 18,245 | 18.8% |
[ 11.5% - 12.0% ] 11.90% | 18,069 | 16.1% |
[ 12.0% - 12.5% ] 12.15% | 8,159 | 21.8% |
[ 12.5% - 13.0% ] 12.74% | 2,496 | 18.0% |
[ 13.0% - 13.5% ] 13.18% | 4,157 | 20.2% |
[ 13.5% - 14.0% ] 13.72% | 11,095 | 19.1% |
[ 14.0% - 14.5% ] 14.10% | 1,532 | 15.1% |
[ 14.0% - 14.5% ] 14.48% | 6,563 | 18.5% |
[ 15.0% - 15.5% ] 15.05% | 7,719 | 15.4% |
[ 15.5% - 16.0% ] 15.52% | 1,656 | 13.5% |
[ 16.0% - 16.5% ] 16.03% | 1,578 | 16.9% |
[ 16.5% - 17.0% ] 16.54% | 2,817 | 16.3% |
[ 16.5% - 17.0% ] 16.91% | 1,703 | 22.9% |
[ 17.0% - 17.5% ] 17.36% | 1,567 | 15.7% |
[ 17.5% - 18.0% ] 17.92% | 4,469 | 16.1% |
[ 18.0% - 18.5% ] 18.32% | 2,336 | 14.1% |
[ 18.5% - 19.0% ] 18.76% | 10,722 | 12.4% |
[ 19.0% - 19.5% ] 19.21% | 2,889 | 22.3% |
[ 19.5% - 20.0% ] 19.73% | 902 | 14.8% |
[ 20.5% - 21.0% ] 20.51% | 156 | 29.2% |
[ 20.5% - 21.0% ] 20.62% | 20,910 | 12.4% |
[ 21.0% - 21.5% ] 21.48% | 2,179 | 20.4% |
[ 22.0% - 22.5% ] 22.37% | 4,650 | 11.8% |
[ 22.5% - 23.0% ] 22.59% | 3,285 | 13.0% |
[ 23.0% - 23.5% ] 23.23% | 5,920 | 15.5% |
[ 23.0% - 23.5% ] 23.48% | 115 | 55.7% |
[ 24.5% - 25.0% ] 24.66% | 1,168 | 29.8% |
[ 25.5% - 26.0% ] 25.56% | 360 | 18.7% |
[ 26.5% - 27.0% ] 26.65% | 2,233 | 22.8% |
[ 30.5% - 31.0% ] 30.82% | 1,603 | 22.2% |
[ 31.0% - 31.5% ] 31.15% | 1,268 | 20.5% |
[ 32.5% - 33.0% ] 32.97% | 185 | 19.8% |
[ 37.0% - 37.5% ] 37.01% | 589 | 18.0% |
[ 40.5% - 41.0% ] 40.69% | 1,504 | 4.5% |
[ 41.5% - 42.0% ] 41.66% | 797 | 46.7% |
[ 44.0% - 44.5% ] 44.39% | 1,122 | 22.8% |
[ 45.0% - 45.5% ] 45.30% | 1,786 | 14.4% |
[ 47.0% - 47.5% ] 47.19% | 1,549 | 5.5% |
[ 47.0% - 47.5% ] 47.44% | 1,541 | 5.6% |
[ 49.0% - 49.5% ] 49.29% | 211 | 14.1% |
[ 50.0% - 50.5% ] 50.00% | 82 | 28.6% |
[ 51.5% - 52.0% ] 51.87% | 2,215 | 11.2% |
[ 56.5% - 57.0% ] 56.66% | 413 | 14.0% |
[ 60.0% - 60.5% ] 60.11% | 371 | 24.0% |
[ 73.5% - 74.0% ] 73.70% | 540 | 11.8% |
[ 78.5% - 79.0% ] 78.89% | 199 | 28.6% |
[ 95.5% - 96.0% ] 95.61% | 433 | 46.8% |