Spaniard vs French 3 or more Vehicles in Household
COMPARE
Spaniard
French
3 or more Vehicles in Household
3 or more Vehicles in Household Comparison
Spaniards
French
22.3%
3 OR MORE VEHICLES IN HOUSEHOLD
100.0/ 100
METRIC RATING
58th/ 347
METRIC RANK
21.4%
3 OR MORE VEHICLES IN HOUSEHOLD
99.4/ 100
METRIC RATING
88th/ 347
METRIC RANK
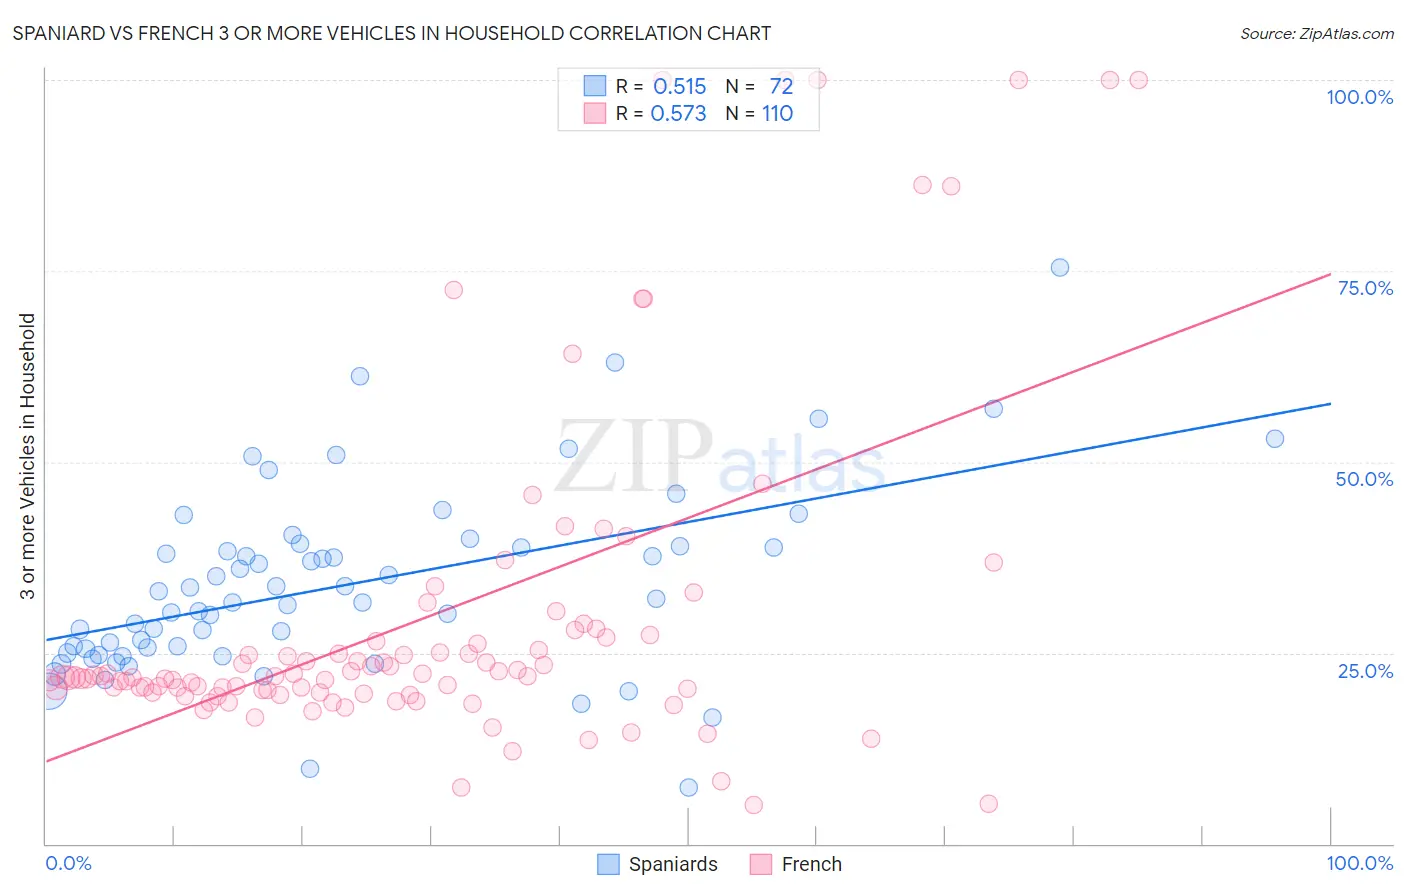
Spaniard vs French 3 or more Vehicles in Household Correlation Chart
The statistical analysis conducted on geographies consisting of 443,028,178 people shows a substantial positive correlation between the proportion of Spaniards and percentage of households with 3 or more vehicles available in the United States with a correlation coefficient (R) of 0.515 and weighted average of 22.3%. Similarly, the statistical analysis conducted on geographies consisting of 571,506,399 people shows a substantial positive correlation between the proportion of French and percentage of households with 3 or more vehicles available in the United States with a correlation coefficient (R) of 0.573 and weighted average of 21.4%, a difference of 4.2%.
3 or more Vehicles in Household Correlation Summary
| Measurement | Spaniard | French |
| Minimum | 7.3% | 5.1% |
| Maximum | 75.5% | 100.0% |
| Range | 68.2% | 94.9% |
| Mean | 33.9% | 29.6% |
| Median | 31.9% | 21.9% |
| Interquartile 25% (IQ1) | 25.3% | 19.8% |
| Interquartile 75% (IQ3) | 38.9% | 27.1% |
| Interquartile Range (IQR) | 13.6% | 7.3% |
| Standard Deviation (Sample) | 12.2% | 22.0% |
| Standard Deviation (Population) | 12.2% | 21.9% |
Similar Demographics by 3 or more Vehicles in Household
Demographics Similar to Spaniards by 3 or more Vehicles in Household
In terms of 3 or more vehicles in household, the demographic groups most similar to Spaniards are Navajo (22.3%, a difference of 0.060%), Pennsylvania German (22.3%, a difference of 0.13%), Finnish (22.3%, a difference of 0.15%), Hispanic or Latino (22.4%, a difference of 0.29%), and Bhutanese (22.2%, a difference of 0.30%).
| Demographics | Rating | Rank | 3 or more Vehicles in Household |
| Whites/Caucasians | 100.0 /100 | #51 | Exceptional 22.6% |
| Welsh | 100.0 /100 | #52 | Exceptional 22.6% |
| Czechs | 100.0 /100 | #53 | Exceptional 22.5% |
| Crow | 100.0 /100 | #54 | Exceptional 22.5% |
| Immigrants | Laos | 100.0 /100 | #55 | Exceptional 22.4% |
| Hispanics or Latinos | 100.0 /100 | #56 | Exceptional 22.4% |
| Pennsylvania Germans | 100.0 /100 | #57 | Exceptional 22.3% |
| Spaniards | 100.0 /100 | #58 | Exceptional 22.3% |
| Navajo | 100.0 /100 | #59 | Exceptional 22.3% |
| Finns | 99.9 /100 | #60 | Exceptional 22.3% |
| Bhutanese | 99.9 /100 | #61 | Exceptional 22.2% |
| Fijians | 99.9 /100 | #62 | Exceptional 22.2% |
| Chickasaw | 99.9 /100 | #63 | Exceptional 22.2% |
| Immigrants | Taiwan | 99.9 /100 | #64 | Exceptional 22.1% |
| Pima | 99.9 /100 | #65 | Exceptional 22.0% |
Demographics Similar to French by 3 or more Vehicles in Household
In terms of 3 or more vehicles in household, the demographic groups most similar to French are Immigrants from the Azores (21.5%, a difference of 0.26%), Delaware (21.5%, a difference of 0.38%), Laotian (21.5%, a difference of 0.46%), Icelander (21.5%, a difference of 0.47%), and Chippewa (21.5%, a difference of 0.53%).
| Demographics | Rating | Rank | 3 or more Vehicles in Household |
| Celtics | 99.7 /100 | #81 | Exceptional 21.7% |
| Immigrants | El Salvador | 99.6 /100 | #82 | Exceptional 21.5% |
| Chippewa | 99.6 /100 | #83 | Exceptional 21.5% |
| Icelanders | 99.6 /100 | #84 | Exceptional 21.5% |
| Laotians | 99.6 /100 | #85 | Exceptional 21.5% |
| Delaware | 99.6 /100 | #86 | Exceptional 21.5% |
| Immigrants | Azores | 99.5 /100 | #87 | Exceptional 21.5% |
| French | 99.4 /100 | #88 | Exceptional 21.4% |
| Marshallese | 99.2 /100 | #89 | Exceptional 21.3% |
| Immigrants | Afghanistan | 99.1 /100 | #90 | Exceptional 21.2% |
| Belgians | 98.9 /100 | #91 | Exceptional 21.2% |
| Apache | 98.9 /100 | #92 | Exceptional 21.2% |
| Immigrants | Indonesia | 98.8 /100 | #93 | Exceptional 21.1% |
| Immigrants | Cambodia | 98.6 /100 | #94 | Exceptional 21.1% |
| Pakistanis | 98.5 /100 | #95 | Exceptional 21.0% |