Spaniard Disability Age Under 5
COMPARE
Spaniard
Select to Compare
Disability Age Under 5
Spaniard Disability Age Under 5
1.4%
DISABILITY | AGE UNDER 5
1.4/ 100
METRIC RATING
244th/ 347
METRIC RANK
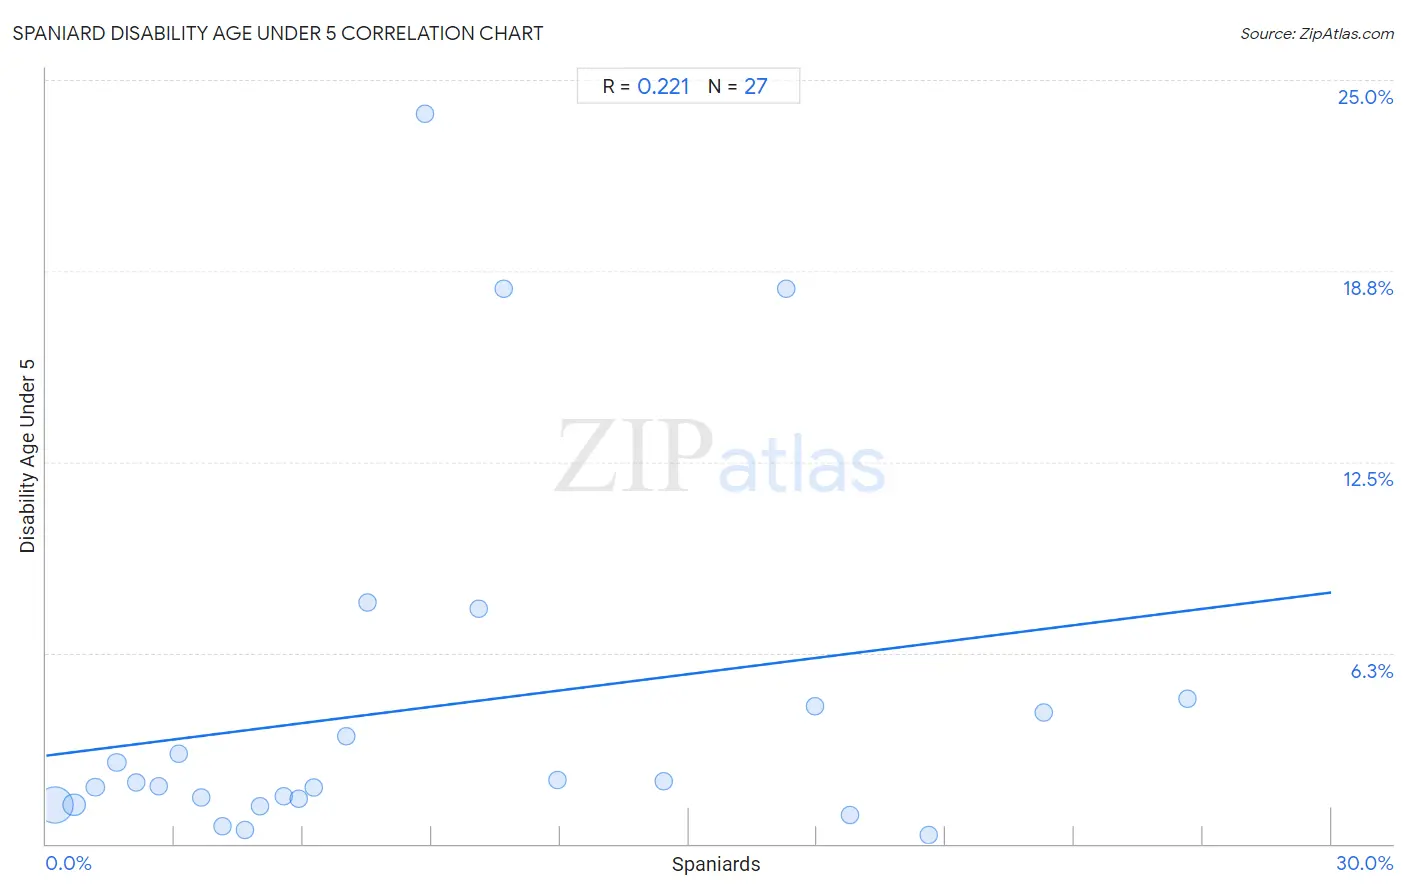
Spaniard Disability Age Under 5 Correlation Chart
The statistical analysis conducted on geographies consisting of 233,722,649 people shows a weak positive correlation between the proportion of Spaniards and percentage of population with a disability under the age of 5 in the United States with a correlation coefficient (R) of 0.221 and weighted average of 1.4%. On average, for every 1% (one percent) increase in Spaniards within a typical geography, there is an increase of 0.18% in percentage of population with a disability under the age of 5.
It is essential to understand that the correlation between the percentage of Spaniards and percentage of population with a disability under the age of 5 does not imply a direct cause-and-effect relationship. It remains uncertain whether the presence of Spaniards influences an upward or downward trend in the level of percentage of population with a disability under the age of 5 within an area, or if Spaniards simply ended up residing in those areas with higher or lower levels of percentage of population with a disability under the age of 5 due to other factors.
Demographics Similar to Spaniards by Disability Age Under 5
In terms of disability age under 5, the demographic groups most similar to Spaniards are Immigrants from Cameroon (1.4%, a difference of 0.43%), Potawatomi (1.4%, a difference of 0.52%), Russian (1.4%, a difference of 0.65%), Immigrants from England (1.4%, a difference of 0.66%), and Eastern European (1.4%, a difference of 0.70%).
| Demographics | Rating | Rank | Disability Age Under 5 |
| Basques | 3.0 /100 | #237 | Tragic 1.3% |
| Spanish American Indians | 2.4 /100 | #238 | Tragic 1.3% |
| Immigrants from Austria | 2.3 /100 | #239 | Tragic 1.3% |
| Native Hawaiians | 2.2 /100 | #240 | Tragic 1.3% |
| Maltese | 2.2 /100 | #241 | Tragic 1.3% |
| Lumbee | 2.1 /100 | #242 | Tragic 1.3% |
| Immigrants from Cameroon | 1.7 /100 | #243 | Tragic 1.4% |
| Spaniards | 1.4 /100 | #244 | Tragic 1.4% |
| Potawatomi | 1.1 /100 | #245 | Tragic 1.4% |
| Russians | 1.0 /100 | #246 | Tragic 1.4% |
| Immigrants from England | 1.0 /100 | #247 | Tragic 1.4% |
| Eastern Europeans | 1.0 /100 | #248 | Tragic 1.4% |
| Bermudans | 1.0 /100 | #249 | Tragic 1.4% |
| Africans | 1.0 /100 | #250 | Tragic 1.4% |
| Immigrants from Hungary | 1.0 /100 | #251 | Tragic 1.4% |
Spaniard Disability Age Under 5 Correlation Summary
| Measurement | Spaniard Data | Disability Age Under 5 Data |
| Minimum | 0.21% | 0.27% |
| Maximum | 26.7% | 23.9% |
| Range | 26.4% | 23.6% |
| Mean | 8.9% | 4.5% |
| Median | 6.2% | 2.0% |
| Interquartile 25% (IQ1) | 3.1% | 1.3% |
| Interquartile 75% (IQ3) | 14.4% | 4.5% |
| Interquartile Range (IQR) | 11.3% | 3.2% |
| Standard Deviation (Sample) | 7.5% | 6.0% |
| Standard Deviation (Population) | 7.3% | 5.9% |
Correlation Details
| Spaniard Percentile | Sample Size | Disability Age Under 5 |
[ 0.0% - 0.5% ] 0.21% | 182,491,278 | 1.3% |
[ 0.5% - 1.0% ] 0.65% | 40,997,638 | 1.3% |
[ 1.0% - 1.5% ] 1.14% | 6,122,904 | 1.8% |
[ 1.5% - 2.0% ] 1.65% | 1,098,693 | 2.7% |
[ 2.0% - 2.5% ] 2.09% | 786,149 | 2.0% |
[ 2.5% - 3.0% ] 2.62% | 426,275 | 1.9% |
[ 3.0% - 3.5% ] 3.10% | 178,089 | 3.0% |
[ 3.5% - 4.0% ] 3.61% | 194,680 | 1.5% |
[ 4.0% - 4.5% ] 4.10% | 89,651 | 0.59% |
[ 4.5% - 5.0% ] 4.64% | 828,050 | 0.44% |
[ 4.5% - 5.0% ] 4.99% | 145,718 | 1.2% |
[ 5.5% - 6.0% ] 5.54% | 108,294 | 1.6% |
[ 5.5% - 6.0% ] 5.89% | 158,570 | 1.5% |
[ 6.0% - 6.5% ] 6.24% | 18,328 | 1.8% |
[ 6.5% - 7.0% ] 6.99% | 987 | 3.5% |
[ 7.5% - 8.0% ] 7.51% | 15,668 | 7.9% |
[ 8.5% - 9.0% ] 8.84% | 961 | 23.9% |
[ 10.0% - 10.5% ] 10.11% | 1,682 | 7.7% |
[ 10.5% - 11.0% ] 10.68% | 440 | 18.2% |
[ 11.5% - 12.0% ] 11.93% | 15,895 | 2.1% |
[ 14.0% - 14.5% ] 14.43% | 4,179 | 2.0% |
[ 17.0% - 17.5% ] 17.27% | 880 | 18.2% |
[ 17.5% - 18.0% ] 17.94% | 2,336 | 4.5% |
[ 18.5% - 19.0% ] 18.76% | 10,722 | 0.96% |
[ 20.5% - 21.0% ] 20.61% | 19,827 | 0.27% |
[ 23.0% - 23.5% ] 23.28% | 2,590 | 4.3% |
[ 26.5% - 27.0% ] 26.65% | 2,165 | 4.8% |