Slovak Disability
COMPARE
Slovak
Select to Compare
Disability
Slovak Disability
13.0%
DISABILITY
0.0/ 100
METRIC RATING
289th/ 347
METRIC RANK
Slovak Disability Correlation Chart
The statistical analysis conducted on geographies consisting of 397,863,317 people shows a significant positive correlation between the proportion of Slovaks and percentage of population with a disability in the United States with a correlation coefficient (R) of 0.644 and weighted average of 13.0%. On average, for every 1% (one percent) increase in Slovaks within a typical geography, there is an increase of 0.60% in percentage of population with a disability.
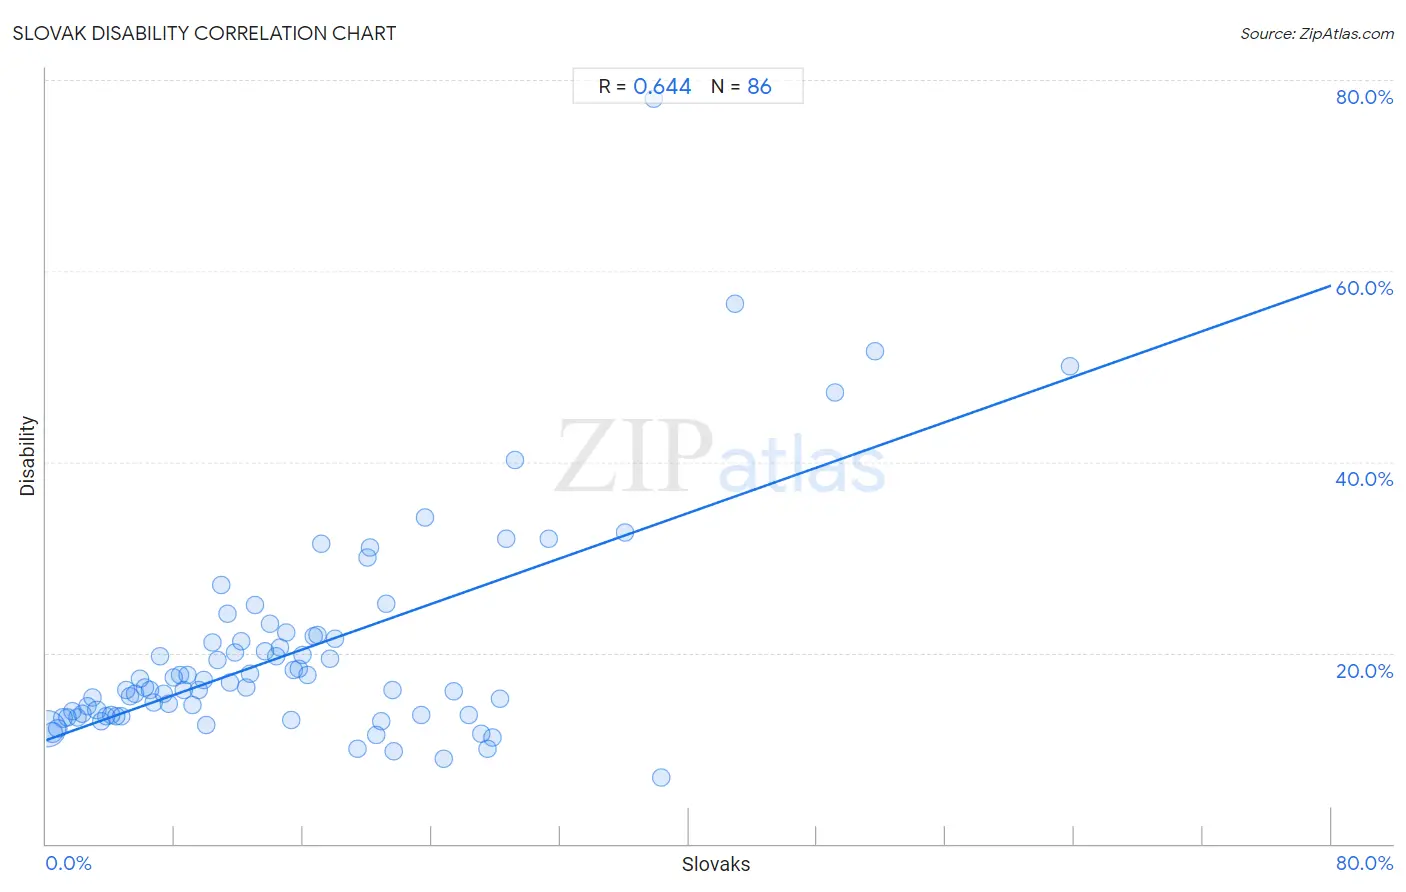
It is essential to understand that the correlation between the percentage of Slovaks and percentage of population with a disability does not imply a direct cause-and-effect relationship. It remains uncertain whether the presence of Slovaks influences an upward or downward trend in the level of percentage of population with a disability within an area, or if Slovaks simply ended up residing in those areas with higher or lower levels of percentage of population with a disability due to other factors.
Demographics Similar to Slovaks by Disability
In terms of disability, the demographic groups most similar to Slovaks are White/Caucasian (13.0%, a difference of 0.0%), African (13.0%, a difference of 0.020%), Cheyenne (13.0%, a difference of 0.060%), Yaqui (13.1%, a difference of 0.28%), and English (13.0%, a difference of 0.44%).
| Demographics | Rating | Rank | Disability |
| Scottish | 0.0 /100 | #282 | Tragic 12.9% |
| Irish | 0.0 /100 | #283 | Tragic 12.9% |
| Welsh | 0.0 /100 | #284 | Tragic 12.9% |
| Crow | 0.0 /100 | #285 | Tragic 12.9% |
| English | 0.0 /100 | #286 | Tragic 13.0% |
| Africans | 0.0 /100 | #287 | Tragic 13.0% |
| Whites/Caucasians | 0.0 /100 | #288 | Tragic 13.0% |
| Slovaks | 0.0 /100 | #289 | Tragic 13.0% |
| Cheyenne | 0.0 /100 | #290 | Tragic 13.0% |
| Yaqui | 0.0 /100 | #291 | Tragic 13.1% |
| Aleuts | 0.0 /100 | #292 | Tragic 13.1% |
| Marshallese | 0.0 /100 | #293 | Tragic 13.1% |
| Celtics | 0.0 /100 | #294 | Tragic 13.1% |
| Nonimmigrants | 0.0 /100 | #295 | Tragic 13.2% |
| Central American Indians | 0.0 /100 | #296 | Tragic 13.2% |
Slovak Disability Correlation Summary
| Measurement | Slovak Data | Disability Data |
| Minimum | 0.10% | 6.9% |
| Maximum | 63.7% | 78.0% |
| Range | 63.6% | 71.1% |
| Mean | 15.5% | 20.1% |
| Median | 12.8% | 16.4% |
| Interquartile 25% (IQ1) | 6.5% | 13.5% |
| Interquartile 75% (IQ3) | 21.2% | 21.4% |
| Interquartile Range (IQR) | 14.7% | 7.9% |
| Standard Deviation (Sample) | 12.3% | 11.4% |
| Standard Deviation (Population) | 12.3% | 11.3% |
Correlation Details
| Slovak Percentile | Sample Size | Disability |
[ 0.0% - 0.5% ] 0.10% | 322,415,703 | 12.0% |
[ 0.0% - 0.5% ] 0.41% | 42,198,456 | 11.7% |
[ 0.5% - 1.0% ] 0.72% | 12,596,431 | 12.1% |
[ 1.0% - 1.5% ] 1.04% | 5,580,291 | 13.2% |
[ 1.0% - 1.5% ] 1.34% | 3,176,525 | 13.2% |
[ 1.5% - 2.0% ] 1.66% | 2,410,652 | 13.9% |
[ 1.5% - 2.0% ] 1.94% | 1,551,947 | 13.2% |
[ 2.0% - 2.5% ] 2.27% | 1,591,403 | 13.6% |
[ 2.5% - 3.0% ] 2.54% | 860,255 | 14.5% |
[ 2.5% - 3.0% ] 2.85% | 903,383 | 15.3% |
[ 3.0% - 3.5% ] 3.15% | 681,261 | 14.1% |
[ 3.0% - 3.5% ] 3.43% | 714,172 | 12.8% |
[ 3.5% - 4.0% ] 3.74% | 478,761 | 13.4% |
[ 4.0% - 4.5% ] 4.06% | 462,311 | 13.5% |
[ 4.0% - 4.5% ] 4.34% | 329,929 | 13.3% |
[ 4.5% - 5.0% ] 4.66% | 213,906 | 13.4% |
[ 4.5% - 5.0% ] 4.96% | 258,732 | 16.0% |
[ 5.0% - 5.5% ] 5.20% | 201,893 | 15.4% |
[ 5.5% - 6.0% ] 5.55% | 103,859 | 15.8% |
[ 5.5% - 6.0% ] 5.87% | 210,382 | 17.3% |
[ 6.0% - 6.5% ] 6.14% | 122,690 | 16.4% |
[ 6.0% - 6.5% ] 6.48% | 101,816 | 16.2% |
[ 6.5% - 7.0% ] 6.71% | 170,716 | 14.7% |
[ 7.0% - 7.5% ] 7.08% | 35,202 | 19.6% |
[ 7.0% - 7.5% ] 7.33% | 41,899 | 15.8% |
[ 7.5% - 8.0% ] 7.64% | 81,898 | 14.7% |
[ 7.5% - 8.0% ] 7.91% | 33,000 | 17.4% |
[ 8.0% - 8.5% ] 8.29% | 66,963 | 17.7% |
[ 8.5% - 9.0% ] 8.54% | 51,836 | 16.2% |
[ 8.5% - 9.0% ] 8.81% | 27,516 | 17.7% |
[ 9.0% - 9.5% ] 9.13% | 17,570 | 14.5% |
[ 9.0% - 9.5% ] 9.47% | 9,473 | 16.2% |
[ 9.5% - 10.0% ] 9.77% | 42,065 | 17.2% |
[ 9.5% - 10.0% ] 9.94% | 3,461 | 12.5% |
[ 10.0% - 10.5% ] 10.38% | 3,286 | 21.1% |
[ 10.5% - 11.0% ] 10.62% | 16,369 | 19.2% |
[ 10.5% - 11.0% ] 10.88% | 3,586 | 27.1% |
[ 11.0% - 11.5% ] 11.27% | 1,340 | 24.0% |
[ 11.0% - 11.5% ] 11.46% | 39,331 | 16.9% |
[ 11.5% - 12.0% ] 11.79% | 1,595 | 20.0% |
[ 12.0% - 12.5% ] 12.16% | 2,640 | 21.2% |
[ 12.0% - 12.5% ] 12.42% | 1,208 | 16.4% |
[ 12.5% - 13.0% ] 12.66% | 5,465 | 17.7% |
[ 12.5% - 13.0% ] 12.96% | 7,216 | 25.0% |
[ 13.5% - 14.0% ] 13.64% | 3,843 | 20.2% |
[ 13.5% - 14.0% ] 13.92% | 2,162 | 23.0% |
[ 14.0% - 14.5% ] 14.29% | 336 | 19.6% |
[ 14.5% - 15.0% ] 14.58% | 1,715 | 20.5% |
[ 14.5% - 15.0% ] 14.94% | 3,306 | 22.1% |
[ 15.0% - 15.5% ] 15.25% | 885 | 13.0% |
[ 15.0% - 15.5% ] 15.41% | 2,259 | 18.1% |
[ 15.5% - 16.0% ] 15.73% | 1,233 | 18.3% |
[ 15.5% - 16.0% ] 15.96% | 639 | 19.7% |
[ 16.0% - 16.5% ] 16.29% | 528 | 17.6% |
[ 16.5% - 17.0% ] 16.64% | 2,151 | 21.8% |
[ 16.5% - 17.0% ] 16.92% | 3,699 | 21.8% |
[ 17.0% - 17.5% ] 17.16% | 204 | 31.4% |
[ 17.5% - 18.0% ] 17.65% | 119 | 19.3% |
[ 17.5% - 18.0% ] 17.99% | 378 | 21.4% |
[ 19.0% - 19.5% ] 19.40% | 1,139 | 9.9% |
[ 20.0% - 20.5% ] 20.00% | 70 | 30.0% |
[ 20.0% - 20.5% ] 20.17% | 476 | 31.1% |
[ 20.5% - 21.0% ] 20.58% | 690 | 11.4% |
[ 20.5% - 21.0% ] 20.83% | 336 | 12.8% |
[ 21.0% - 21.5% ] 21.19% | 840 | 25.1% |
[ 21.5% - 22.0% ] 21.58% | 505 | 16.0% |
[ 21.5% - 22.0% ] 21.62% | 851 | 9.8% |
[ 23.0% - 23.5% ] 23.35% | 1,730 | 13.5% |
[ 23.5% - 24.0% ] 23.60% | 161 | 34.2% |
[ 24.5% - 25.0% ] 24.71% | 348 | 8.9% |
[ 25.0% - 25.5% ] 25.37% | 339 | 15.9% |
[ 26.0% - 26.5% ] 26.32% | 1,345 | 13.5% |
[ 27.0% - 27.5% ] 27.08% | 96 | 11.5% |
[ 27.0% - 27.5% ] 27.50% | 240 | 10.0% |
[ 27.5% - 28.0% ] 27.78% | 18 | 11.1% |
[ 28.0% - 28.5% ] 28.26% | 138 | 15.2% |
[ 28.5% - 29.0% ] 28.67% | 150 | 32.0% |
[ 29.0% - 29.5% ] 29.18% | 281 | 40.2% |
[ 31.0% - 31.5% ] 31.27% | 291 | 32.0% |
[ 36.0% - 36.5% ] 36.00% | 150 | 32.7% |
[ 37.5% - 38.0% ] 37.80% | 82 | 78.0% |
[ 38.0% - 38.5% ] 38.26% | 677 | 6.9% |
[ 42.5% - 43.0% ] 42.86% | 189 | 56.6% |
[ 49.0% - 49.5% ] 49.11% | 112 | 47.3% |
[ 51.5% - 52.0% ] 51.61% | 31 | 51.6% |
[ 63.5% - 64.0% ] 63.74% | 182 | 50.0% |